south east europe regular economic report - world...
TRANSCRIPT
i
South east Europe
regular economic
report
June 5, 2012
THE WORLD BANK Poverty Reduction and Economic Management Unit
Europe and Central Asia Region

ii
SOUTH EAST EUROPE:
REGULAR ECONOMIC REPORT
June 5, 2012
iii
TABLE OF CONTENTS
RECENT ECONOMIC DEVELOPMENTS, OUTLOOK, AND POLICY CHALLENGES
TOWARD ‗GOLDEN GROWTH‘ IN SOUTH EAST EUROPE
1. RECENT ECONOMIC DEVELOPMENTS, OUTLOOK, AND POLICY CHALLENGES 1
A. GLOBAL ENVIRONMENT––RISING RISKS IN THE EUROZONE ........................................ 1
B. GROWTH IN SEE6—SLUGGISH RECOVERY ........................................................................ 5
C. TRADE AND EXTERNAL DEVELOPMENTS––IMPROVING CURRENT ACCOUNTS,
RELATIVELY ROBUST FDI ............................................................................................................. 8
D. FISCAL POLICY AND PUBLIC DEBT––RISING RISKS ....................................................... 12
E. MONETARY POLICY AND FINANCIAL SECTOR–CONTINUED DELEVERAGING ........ 18
F. LABOR MARKET DEVELOPMENTS IN SEE6–WORRISOME TRENDS ............................. 24
G. POVERTY, INEQUALITY, AND PEOPLE‘S PERCEPTIONS OF CRISIS IMPACT IN SEE6––
MORE WORRISOME TRENDS ....................................................................................................... 32
H. OUTLOOK FOR 2012-13.......................................................................................................... 39
I. POLICY CHALLENGES .......................................................................................................... 42
2. GOLDEN GROWTH IN SOUTH EAST EUROPE: KEY IMPLICATIONS FOR POLICY
REFORMS .................................................................................................................................... 45
A. INTRODUCTION ..................................................................................................................... 45
B. TRADE AND FINANCE: PRIMARY DRIVERS OF ‗CONVERGENCE‘ IN SEE6 ................. 46
C. ENTERPRISE AND INNOVATION: GROWING PRODUCTIVITY, BUT LIMITED ROLE OF
INNOVATION.................................................................................................................................. 50
D. LABOR AND GOVERNMENT: HIGH UNEMPLOYMENT, AGING POPULATIONS AND
STRAINED BUDGETS .................................................................................................................... 51
E. CONCLUSIONS AND IMPLICATIONS FOR POLICY REFORM: FROM CONVERGENCE
TO REFORMING LABOR AND GOVERNMENT .......................................................................... 57

iv
Figures
Figure 1: Global financial uncertainty ...................................................................................................... 1
Figure 2: Industrial production picked up markedly in 2012 ..................................................................... 2
Figure 3: Industrial production and import growth in Europe ................................................................... 2
Figure 4: Recovery of real GDP in SEE6 countries (2008 index=100) ...................................................... 5
Figure 5: Recovery of investments in SEE6 countries (2008 index=100) .................................................. 5
Figure 6: Recovery of consumption in SEE6 countries (2008 index=100) ................................................ 6
Figure 7: Recovery of net exports in SEE6 countries (2008 index=100) ................................................... 6
Figure 8: Real GDP growth in SEE6 countries (%) .................................................................................. 6
Figure 9: Real GDP growth in SEE6, EU10, and EU15 (%) ..................................................................... 6
Figure 10: Contributions to real GDP in SEE6 (%) .................................................................................. 7
Figure 11: Contribution to real GDP in SEE6 as a region (%) .................................................................. 7
Figure 12: Contribution to real GVA in SEE6 .......................................................................................... 7
Figure 13: contribution to real GVA in SEE6 as a region (%) .................................................................. 7
Figure 14: Inflation in SEE6, (%) ............................................................................................................ 8
Figure 15: Exports (% of GDP) ............................................................................................................... 8
Figure 16: Export and economic growth (%) ............................................................................................ 9
Figure 17: Import growth (%) .................................................................................................................. 9
Figure 18: Export and import growth ....................................................................................................... 9
Figure 19: CAD and trade balance, (% of GDP) ..................................................................................... 10
Figure 20: CAD by countries, (% of GDP) ............................................................................................. 10
Figure 21: Workers' remittances 2008-2011 (% of GDP) ....................................................................... 10
Figure 22: Foreign direct investments (FDI, net, % GDP) Figure 23: FDI per capita (net, USD) ........... 11
Figure 24: External debt, SEE6 average (% of GDP) ............................................................................. 11
Figure 25: Total international bonds outstanding in select SEE6 (mln. US$) .......................................... 11
Figure 26: Total public and private external debt (% of GDP) ................................................................ 12
Figure 27: SEE6 revenue performance, 2008-2011 ................................................................................ 13
Figure 28: SEE6 expenditure performance, 2008 – 2011 ........................................................................ 13
Figure 29: Spreads on SEE6 sovereign external debt (in bps) ................................................................. 15
Figure 30: Public debt in SEE6 (percent of GDP) .................................................................................. 17
Figure 31: Euribor–OIS spread (%) ....................................................................................................... 18
Figure 32: Five-year CDS spreads for major parent banks to emerging European banks ......................... 18
Figure 33: ECB LTROs and bank term funding (in billions of Euro) ...................................................... 19
Figure 34: Total deposits (valued in euro, Sept. 2008=100) .................................................................... 20
Figure 35: Real y-o-y growth of credit ................................................................................................... 21
Figure 36: Nominal y-o-y growth of credit ............................................................................................. 21
Figure 37: Nominal y-o-y growth of credit ............................................................................................. 22
Figure 38: Nominal y-o-y growth of credit ............................................................................................. 22
Figure 39: Non-performing loans (% of total loans) ............................................................................... 22
Figure 40: Banking sector return on assets (ROA) ................................................................................. 23
Figure 41: Banking sector return on equity (ROE) ................................................................................. 23

v
Figure 42: Loan loss provisions, as percent of total gross loans .............................................................. 23
Figure 43: Changes in the unemployment rates and GDP growth rates in the SEE6, 2000-10 ................. 24
Figure 44: Change in unemployment rates between 2008 and 2011 (in percentage points)...................... 25
Figure 45: Unemployment rates in SEE6 and EU10 ............................................................................... 25
Figure 46: Registered unemployed during 2011 (January 2011 = 100) ................................................... 27
Figure 47:Employment rates in SEE6 (2011) ......................................................................................... 28
Figure 48: Change in real GDP and employment rate in 2011: annual data for SEE6 (left) and quarterly
data for FYR Macedonia (right), (in percentage points).......................................................................... 29
Figure 49: Gross average nominal wage changes (January 2011 = 100) ................................................. 30
Figure 50: Regional poverty trends 2005-2009 (%) ................................................................................ 34
Figure 51: Growth incidence curves, Serbia, Montenegro, and FYR Macedonia ..................................... 35
Figure 52: Perceptions of the impact of the crisis ................................................................................... 36
Figure 53: Main channels of impact Figure 54: Main coping mechanisms ......................................... 37
Figure 55: Industrial Production (3m/3m, percent change, not SA)......................................................... 40
Figure 56: Retail Trade (Jan 2010 = 100, not SA) .................................................................................. 40
Figure 57: EXPY for intermediate goods, thousands of US$, median value, 1996–2008 ......................... 47
Figure 58: Exports and imports of goods and services in the EU15, the EU11, the SEE6 and the Eastern
Partnership States, 2009-10 (or latest available) ..................................................................................... 47
Figure 59: Capital flows, percentage of GDP; period average of group median values ............................ 49
Figure 60: Figure GDP per capita index (EU15 North and Continental=100), 1995-2010 ....................... 50
Figure 61: Unemployment rate as a percentage of total labor force (2009 or latest available).................. 52
Figure 62: Net migration per 1,000 population (2010), and emigration rate of tertiary educated (2000) .. 53
Figure 63: General government expenditure (% of GDP), 2009.............................................................. 55
Figure 64: General government gross debt (% of GDP), 2009 ................................................................ 56
Figure 65: SEE6‘s labor force will shrink by about a quarter between 2010-50 ...................................... 56

vi
Tables
Table 1: Global growth outlook ............................................................................................................... 3
Table 2: Fiscal deficits in SEE6 (percent of GDP) .................................................................................. 13
Table 3: Governments‘ fiscal responses in 2012..................................................................................... 14
Table 4: Sovereign credit ratings* .......................................................................................................... 16
Table 5: Participation (activity) rates in 2011 by gender, in percent ........................................................ 28
Table 6: Internationally comparable estimates of the incidence of poverty and extreme poverty in the
SEE6 2005-2010, (%) ............................................................................................................................ 33
Table 7: Growth Outlook for SEE6 Countries ........................................................................................ 40
Table 8: Selected public debt indicators, 2011 ....................................................................................... 44
Table 9. Doing Business Index (0-100; 0=poor, 100=excellent) ............................................................. 51
Boxes
Box 1: Regional unemployment trends in Serbia .................................................................................... 26
Box 2: The role of Active Labor Market Policies (ALMP) in increasing employment ............................ 31
Box 3: Reforming the labor market: A tale of two countries (and some lessons) ..................................... 54
Annex
Annex 1: Country groupings used in this note ........................................................................................ 58

vii
This report is produced twice a year by a team of economists at the World Bank‘s Europe and Central Asia
region‘s Poverty Reduction and Economic Management Department (ECA PREM). The team is led by
Željko Bogetić ([email protected]) and includes Ron Hood, Dilek Aykut, Alexandru Cojocaru,
Damir Ćosić, Agim Demukaj, Borko Handjiski, Caterina Ruggeri Laderchi, Erjon Luci, Evgenij Najdov,
Lazar Sestović, Kenneth Simmler, Duško Vasiljević and Danijela Vukajlović-Grba. Special topic note on
Golden Growth in the Western Balkans was prepared by Abebe Adugna, and Aleksandra Iwulska on the
basis of a recent World Bank report ―Golden Growth‖ by Indermit Gill, Martin Raiser, Kaspar Richter, and
Juan Zalduendo (2012).
The team benefitted from the guidance and advice from Yvonne Tsikata (Director, ECA PREM) and Satu
Kahkonen (Sector Manager, ECAPREM2). Helpful comments and support from Andrew Burns (Manager,
DECPG) and Juan Zalduendo (Lead economist, ECAVP) are gratefully acknowledged.
In this report, ―South East Europe‖ refers to the six countries of the Western Balkans (SEE6): Albania,
Bosnia and Herzegovina, Kosovo, FYR Macedonia, Montenegro, and Serbia.
viii
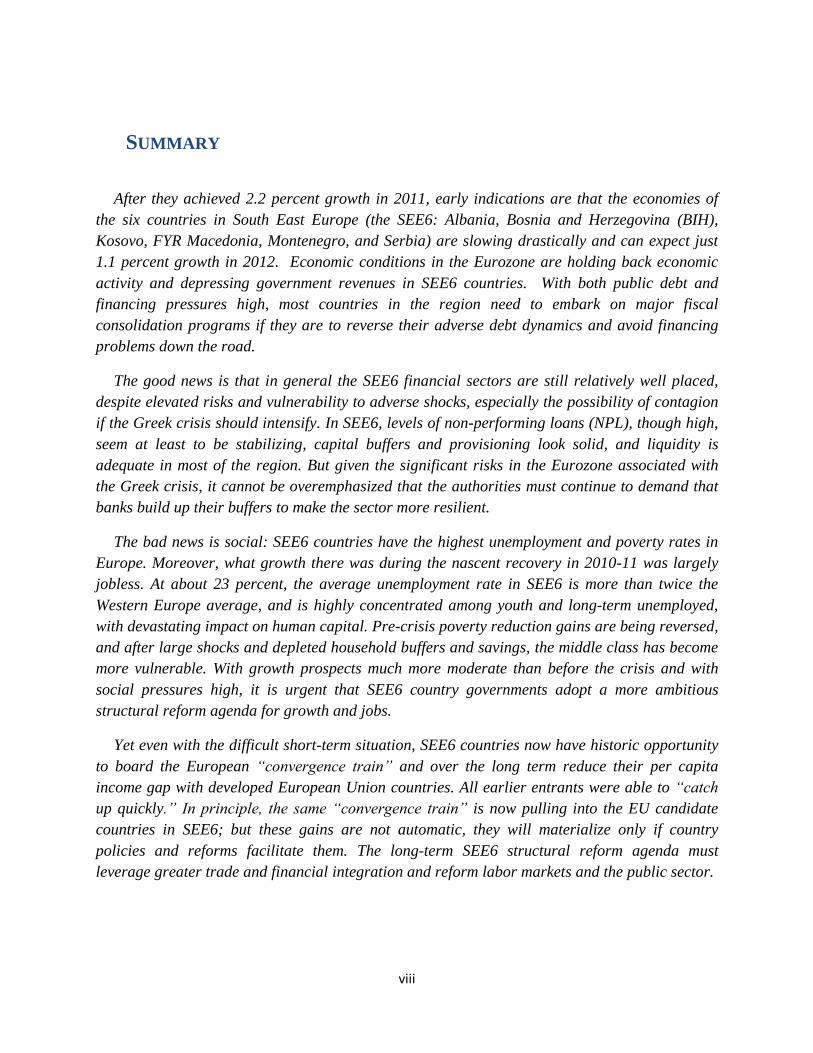
SUMMARY
After they achieved 2.2 percent growth in 2011, early indications are that the economies of
the six countries in South East Europe (the SEE6: Albania, Bosnia and Herzegovina (BIH),
Kosovo, FYR Macedonia, Montenegro, and Serbia) are slowing drastically and can expect just
1.1 percent growth in 2012. Economic conditions in the Eurozone are holding back economic
activity and depressing government revenues in SEE6 countries. With both public debt and
financing pressures high, most countries in the region need to embark on major fiscal
consolidation programs if they are to reverse their adverse debt dynamics and avoid financing
problems down the road.
The good news is that in general the SEE6 financial sectors are still relatively well placed,
despite elevated risks and vulnerability to adverse shocks, especially the possibility of contagion
if the Greek crisis should intensify. In SEE6, levels of non-performing loans (NPL), though high,
seem at least to be stabilizing, capital buffers and provisioning look solid, and liquidity is
adequate in most of the region. But given the significant risks in the Eurozone associated with
the Greek crisis, it cannot be overemphasized that the authorities must continue to demand that
banks build up their buffers to make the sector more resilient.
The bad news is social: SEE6 countries have the highest unemployment and poverty rates in
Europe. Moreover, what growth there was during the nascent recovery in 2010-11 was largely
jobless. At about 23 percent, the average unemployment rate in SEE6 is more than twice the
Western Europe average, and is highly concentrated among youth and long-term unemployed,
with devastating impact on human capital. Pre-crisis poverty reduction gains are being reversed,
and after large shocks and depleted household buffers and savings, the middle class has become
more vulnerable. With growth prospects much more moderate than before the crisis and with
social pressures high, it is urgent that SEE6 country governments adopt a more ambitious
structural reform agenda for growth and jobs.
Yet even with the difficult short-term situation, SEE6 countries now have historic opportunity
to board the European “convergence train” and over the long term reduce their per capita
income gap with developed European Union countries. All earlier entrants were able to “catch
up quickly.” In principle, the same “convergence train” is now pulling into the EU candidate
countries in SEE6; but these gains are not automatic, they will materialize only if country
policies and reforms facilitate them. The long-term SEE6 structural reform agenda must
leverage greater trade and financial integration and reform labor markets and the public sector.
1
1. RECENT ECONOMIC DEVELOPMENTS, OUTLOOK, AND
POLICY CHALLENGES
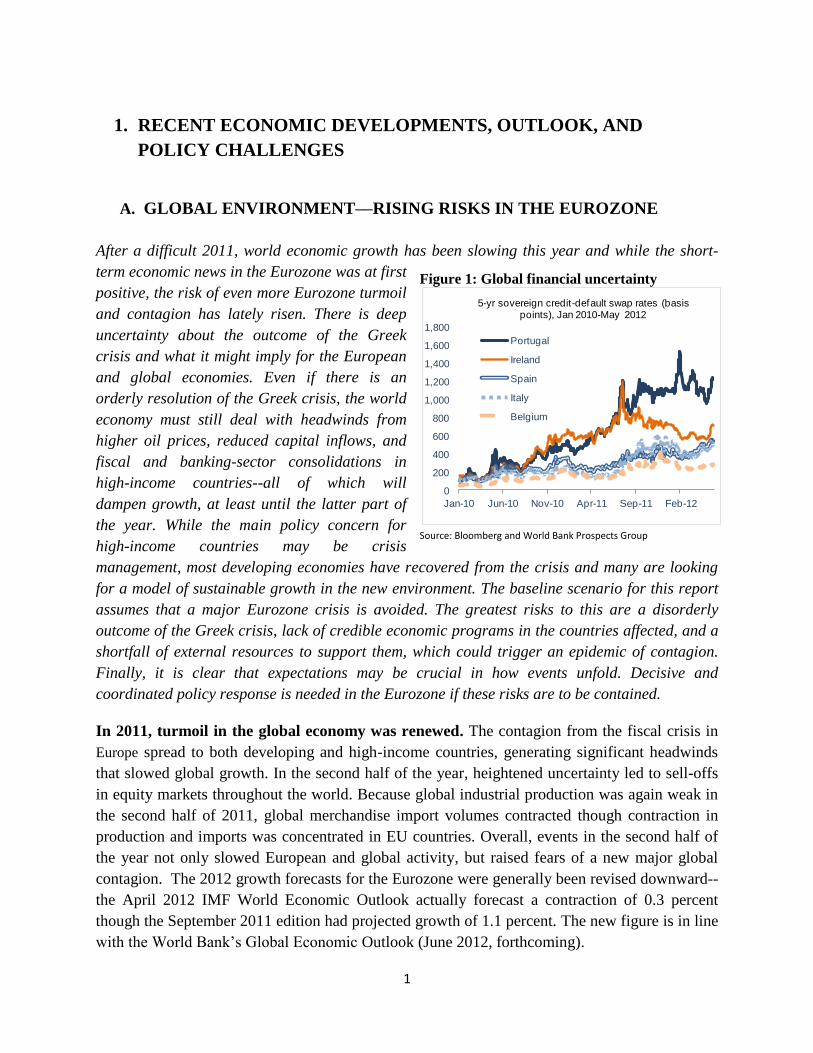
A. GLOBAL ENVIRONMENT––RISING RISKS IN THE EUROZONE
After a difficult 2011, world economic growth has been slowing this year and while the short-
term economic news in the Eurozone was at first
positive, the risk of even more Eurozone turmoil
and contagion has lately risen. There is deep
uncertainty about the outcome of the Greek
crisis and what it might imply for the European
and global economies. Even if there is an
orderly resolution of the Greek crisis, the world
economy must still deal with headwinds from
higher oil prices, reduced capital inflows, and
fiscal and banking-sector consolidations in
high-income countries--all of which will
dampen growth, at least until the latter part of
the year. While the main policy concern for
high-income countries may be crisis
management, most developing economies have recovered from the crisis and many are looking
for a model of sustainable growth in the new environment. The baseline scenario for this report
assumes that a major Eurozone crisis is avoided. The greatest risks to this are a disorderly
outcome of the Greek crisis, lack of credible economic programs in the countries affected, and a
shortfall of external resources to support them, which could trigger an epidemic of contagion.
Finally, it is clear that expectations may be crucial in how events unfold. Decisive and
coordinated policy response is needed in the Eurozone if these risks are to be contained.
In 2011, turmoil in the global economy was renewed. The contagion from the fiscal crisis in
Europe spread to both developing and high-income countries, generating significant headwinds
that slowed global growth. In the second half of the year, heightened uncertainty led to sell-offs
in equity markets throughout the world. Because global industrial production was again weak in
the second half of 2011, global merchandise import volumes contracted though contraction in
production and imports was concentrated in EU countries. Overall, events in the second half of
the year not only slowed European and global activity, but raised fears of a new major global
contagion. The 2012 growth forecasts for the Eurozone were generally been revised downward--
the April 2012 IMF World Economic Outlook actually forecast a contraction of 0.3 percent
though the September 2011 edition had projected growth of 1.1 percent. The new figure is in line
with the World Bank‘s Global Economic Outlook (June 2012, forthcoming).
Figure 1: Global financial uncertainty
Source: Bloomberg and World Bank Prospects Group
0
200
400
600
800
1,000
1,200
1,400
1,600
1,800
Jan-10 Jun-10 Nov-10 Apr-11 Sep-11 Feb-12
5-yr sovereign credit-default swap rates (basis points), Jan 2010-May 2012
Portugal
Ireland
Spain
Italy
Belgium
2
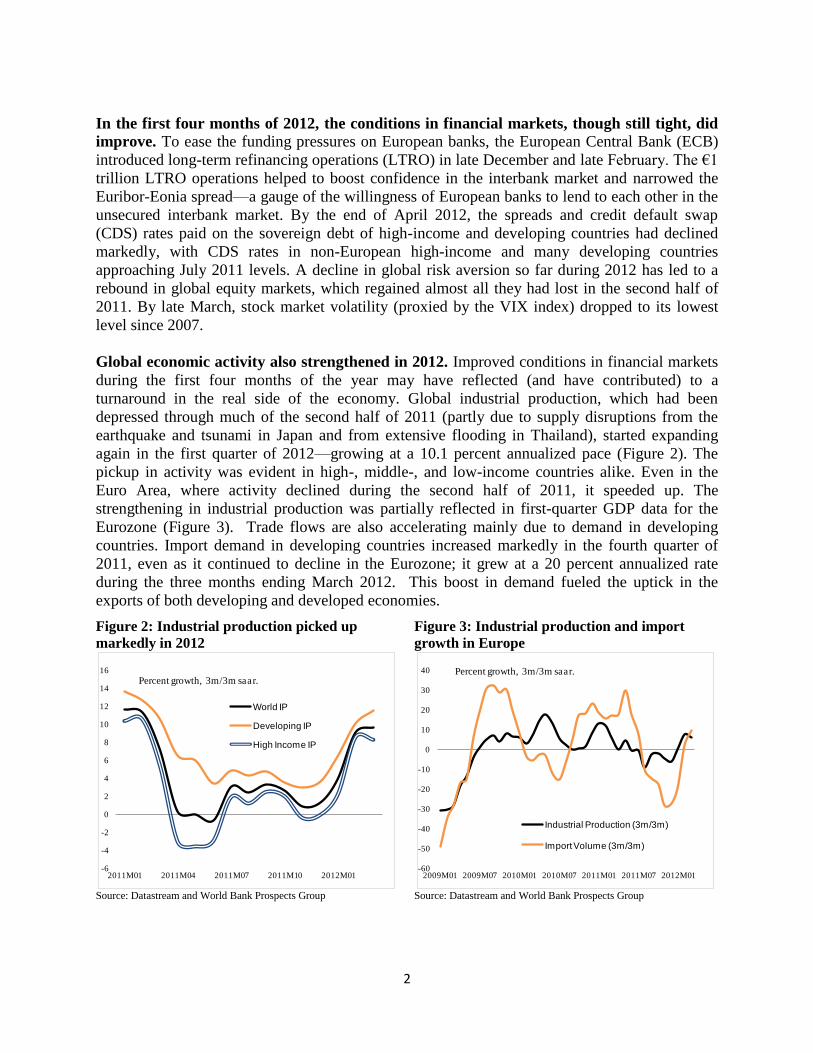
In the first four months of 2012, the conditions in financial markets, though still tight, did
improve. To ease the funding pressures on European banks, the European Central Bank (ECB)
introduced long-term refinancing operations (LTRO) in late December and late February. The €1
trillion LTRO operations helped to boost confidence in the interbank market and narrowed the
Euribor-Eonia spread—a gauge of the willingness of European banks to lend to each other in the
unsecured interbank market. By the end of April 2012, the spreads and credit default swap
(CDS) rates paid on the sovereign debt of high-income and developing countries had declined
markedly, with CDS rates in non-European high-income and many developing countries
approaching July 2011 levels. A decline in global risk aversion so far during 2012 has led to a
rebound in global equity markets, which regained almost all they had lost in the second half of
2011. By late March, stock market volatility (proxied by the VIX index) dropped to its lowest
level since 2007.
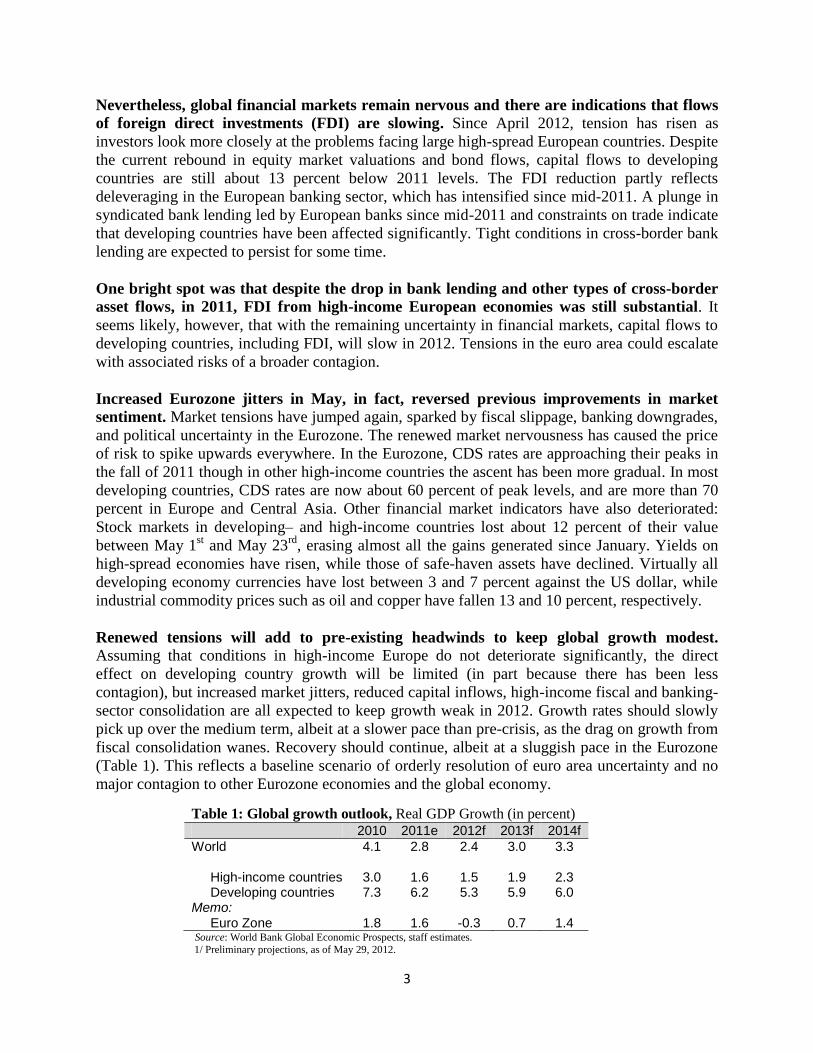
Global economic activity also strengthened in 2012. Improved conditions in financial markets
during the first four months of the year may have reflected (and have contributed) to a
turnaround in the real side of the economy. Global industrial production, which had been
depressed through much of the second half of 2011 (partly due to supply disruptions from the
earthquake and tsunami in Japan and from extensive flooding in Thailand), started expanding
again in the first quarter of 2012—growing at a 10.1 percent annualized pace (Figure 2). The
pickup in activity was evident in high-, middle-, and low-income countries alike. Even in the
Euro Area, where activity declined during the second half of 2011, it speeded up. The
strengthening in industrial production was partially reflected in first-quarter GDP data for the
Eurozone (Figure 3). Trade flows are also accelerating mainly due to demand in developing
countries. Import demand in developing countries increased markedly in the fourth quarter of
2011, even as it continued to decline in the Eurozone; it grew at a 20 percent annualized rate
during the three months ending March 2012. This boost in demand fueled the uptick in the
exports of both developing and developed economies.
Figure 2: Industrial production picked up
markedly in 2012
Source: Datastream and World Bank Prospects Group
Figure 3: Industrial production and import
growth in Europe
Source: Datastream and World Bank Prospects Group
-6
-4
-2
0
2
4
6
8
10
12
14
16
2011M01 2011M04 2011M07 2011M10 2012M01
Percent growth, 3m/3m saar.
World IP
Developing IP
High Income IP
-60
-50
-40
-30
-20
-10
0
10
20
30
40
2009M01 2009M07 2010M01 2010M07 2011M01 2011M07 2012M01
Percent growth, 3m/3m saar.
Industrial Production (3m/3m)
Import Volume (3m/3m)
3
Nevertheless, global financial markets remain nervous and there are indications that flows
of foreign direct investments (FDI) are slowing. Since April 2012, tension has risen as
investors look more closely at the problems facing large high-spread European countries. Despite
the current rebound in equity market valuations and bond flows, capital flows to developing
countries are still about 13 percent below 2011 levels. The FDI reduction partly reflects
deleveraging in the European banking sector, which has intensified since mid-2011. A plunge in
syndicated bank lending led by European banks since mid-2011 and constraints on trade indicate
that developing countries have been affected significantly. Tight conditions in cross-border bank
lending are expected to persist for some time.
One bright spot was that despite the drop in bank lending and other types of cross-border
asset flows, in 2011, FDI from high-income European economies was still substantial. It
seems likely, however, that with the remaining uncertainty in financial markets, capital flows to
developing countries, including FDI, will slow in 2012. Tensions in the euro area could escalate
with associated risks of a broader contagion.
Increased Eurozone jitters in May, in fact, reversed previous improvements in market
sentiment. Market tensions have jumped again, sparked by fiscal slippage, banking downgrades,
and political uncertainty in the Eurozone. The renewed market nervousness has caused the price
of risk to spike upwards everywhere. In the Eurozone, CDS rates are approaching their peaks in
the fall of 2011 though in other high-income countries the ascent has been more gradual. In most
developing countries, CDS rates are now about 60 percent of peak levels, and are more than 70
percent in Europe and Central Asia. Other financial market indicators have also deteriorated:
Stock markets in developing– and high-income countries lost about 12 percent of their value
between May 1st and May 23
rd, erasing almost all the gains generated since January. Yields on
high-spread economies have risen, while those of safe-haven assets have declined. Virtually all
developing economy currencies have lost between 3 and 7 percent against the US dollar, while
industrial commodity prices such as oil and copper have fallen 13 and 10 percent, respectively.
Renewed tensions will add to pre-existing headwinds to keep global growth modest. Assuming that conditions in high-income Europe do not deteriorate significantly, the direct
effect on developing country growth will be limited (in part because there has been less
contagion), but increased market jitters, reduced capital inflows, high-income fiscal and banking-
sector consolidation are all expected to keep growth weak in 2012. Growth rates should slowly
pick up over the medium term, albeit at a slower pace than pre-crisis, as the drag on growth from
fiscal consolidation wanes. Recovery should continue, albeit at a sluggish pace in the Eurozone
(Table 1). This reflects a baseline scenario of orderly resolution of euro area uncertainty and no
major contagion to other Eurozone economies and the global economy.
Table 1: Global growth outlook, Real GDP Growth (in percent) 2010 2011e 2012f 2013f 2014f
World 4.1 2.8 2.4 3.0 3.3
High-income countries 3.0 1.6 1.5 1.9 2.3 Developing countries 7.3 6.2 5.3 5.9 6.0
Memo: Euro Zone 1.8 1.6 -0.3 0.7 1.4
Source: World Bank Global Economic Prospects, staff estimates.
1/ Preliminary projections, as of May 29, 2012.
4
Risks to this tentative recovery remain, especially in Europe. In the immediate run, tensions
emanating from political uncertainty in the Euro Area are likely to be the most serious potential
risk for developing countries Significant progress has been made in Europe on the policy front
both in terms of the domestic structural and fiscal policies of high-spread European economies
and at the level of Euro Area institutions. Nevertheless, policy makers have yet to find the right
mix of structural and macroeconomic policies to fully reduce tensions in financial markets and
generate growth. In the event of a serious crisis in the Eurozone, no world region would be
spared and global GDP could decline sharply (see Global Economic Prospects, January 2012 and
June 2012, forthcoming). Countries with strong reliance on external remittances, tourism,
commodities or with high levels of short-term debt or medium-term financing requirements
could be hardest hit. Many countries have reduced short-term debt exposures in part because of
Euro Area deleveraging. Nevertheless, many countries could be forced to cut sharply into both
government and public spending if global finance were to freeze up as it might do in the case of
a severe crisis. In the instance of a serious recession, commodity prices could fall precipitously,
cutting into government revenues and incomes in oil and metal exporters, but helping to cushion
the blow among oil importing economies. An intensification of financial stresses could force a
much accelerated process of bank-deleveraging in Europe with economies in Europe and Central
Asia, and to a lesser degree Latin America, among the hardest hit.

5
B. GROWTH IN SEE61—SLUGGISH RECOVERY
Growth in SEE6 countries has been relatively sluggish in 2011 and not all countries have
yet attained their pre-crisis levels of activity (Figure 4). Both recession and recovery have
differed across countries. Those countries which managed to avoid the recession (Albania and
Kosovo) or experienced a modest slowdown in growth (FYR Macedonia) have already exceeded
their 2008 real GDP levels in 2010. However, countries that experienced a sharp recession
(Bosnia and Herzegovina, Montenegro, and Serbia) are finding it difficult to return to the same
level (Figures 4-7). Moreover, even compared with EU10 and EU15 countries, which were
severely affected by the global crisis, the recovery in SEE6 appears sluggish (Figure 8-9).
The composition of growth has changed towards domestic demand (Figures 10-11). Growth
in SEE6 averaged 2.2 percent in 2010-11 compared to 4.9 percent in 2006-8. As in other regions,
external demand (net exports) pulled the region out of the recession in 2010. However, since
then, the composition of growth has shifted. In 2011, domestic demand boomed, contributing 3
percentage points to growth, split almost equally between investment and consumption. External
demand became a drag on growth (-0.8 percentage points) as imports rebounded more than
exports, reflecting the recovery of consumption and, to a lesser extent, investment. In fact,
investment recovery has been sluggish, except in Kosovo and, most recently, in FYR Macedonia.
Arguably, growth has not been robust in part because of weak investment activity, which is held
back by short-term factors, including credit, liquidity, payment arrears, as well as longer-term
factors including the investment climate.2
1 SEE6 are Albania, Bosnia and Herzegovina, Kosovo, FYR Macedonia, Montenegro, and Serbia.
2 Political factors also contributed to domestic economic uncertainty and weak recovery. Bosnia and Herzegovina
went through a period of 15 months during [October 2010 and January 2012] without a central government and
without a budget, which hampered economic policymaking. The new government was formed in February 2012.
Figure 4: Recovery of real GDP in SEE6
countries (2008 index=100)
Figure 5: Recovery of investments in SEE6
countries (2008 index=100)
Source: National Statistics Offices, IMF for BIH and KOS in 2011 and
WB staff calculations.
Source: National Statistics Offices, IMF for BIH and KOS in 2011,
Eurostat and WB staff calculations.
85
90
95
100
105
110
115
2008 2009 2010 2011
ALB BIH KOS
MKD MNE SRB65
70
75
80
85
90
95
100
105
110
115
2008 2009 2010 2011
ALB BIH KOS
MKD MNE SRB
6
Figure 8: Real GDP growth in SEE6 countries (%) Figure 9: Real GDP growth in SEE6, EU10, and
EU15 (%)
Source: National Statistics Offices, IMF for BIH and KOS. Source: National Statistics Offices and Eurostat.
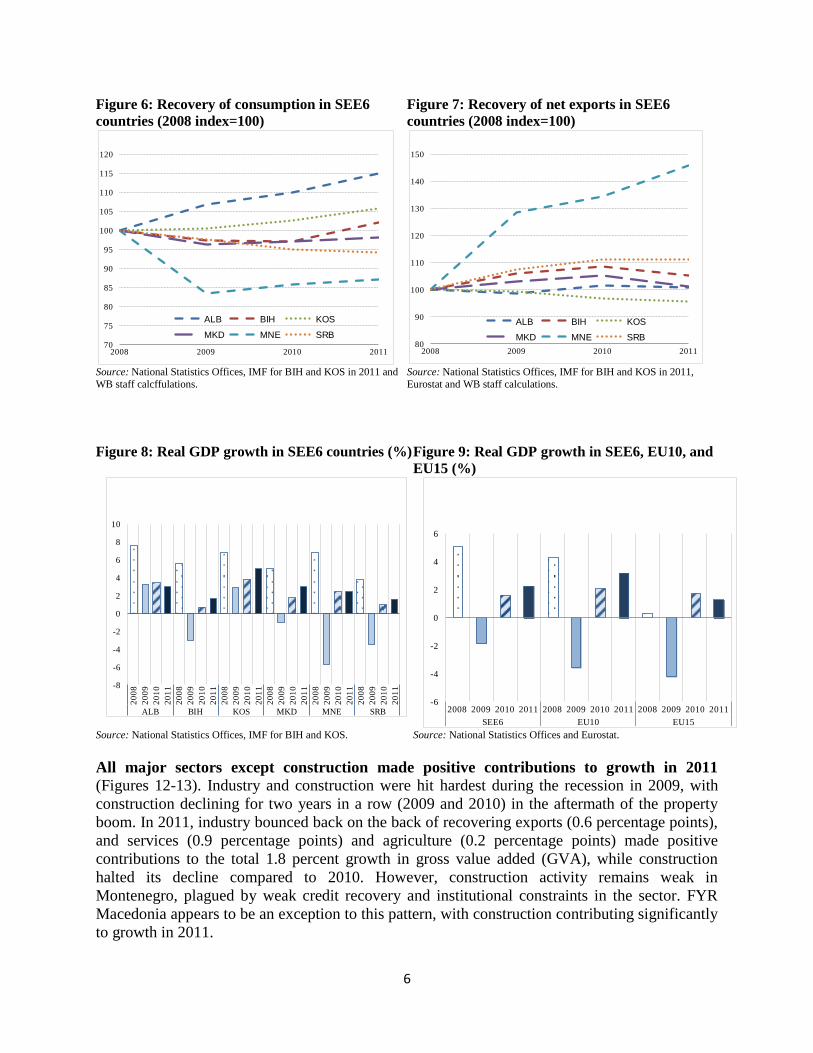
All major sectors except construction made positive contributions to growth in 2011
(Figures 12-13). Industry and construction were hit hardest during the recession in 2009, with
construction declining for two years in a row (2009 and 2010) in the aftermath of the property
boom. In 2011, industry bounced back on the back of recovering exports (0.6 percentage points),
and services (0.9 percentage points) and agriculture (0.2 percentage points) made positive
contributions to the total 1.8 percent growth in gross value added (GVA), while construction
halted its decline compared to 2010. However, construction activity remains weak in
Montenegro, plagued by weak credit recovery and institutional constraints in the sector. FYR
Macedonia appears to be an exception to this pattern, with construction contributing significantly
to growth in 2011.
-8
-6
-4
-2
0
2
4
6
8
10
20
08
20
09
20
10
20
11
20
08
20
09
20
10
20
11
20
08
20
09
20
10
20
11
20
08
20
09
20
10
20
11
20
08
20
09
20
10
20
11
20
08
20
09
20
10
20
11
ALB BIH KOS MKD MNE SRB-6
-4
-2
0
2
4
6
2008 2009 2010 2011 2008 2009 2010 2011 2008 2009 2010 2011
SEE6 EU10 EU15
Figure 6: Recovery of consumption in SEE6
countries (2008 index=100)
Figure 7: Recovery of net exports in SEE6
countries (2008 index=100)
Source: National Statistics Offices, IMF for BIH and KOS in 2011 and
WB staff calcffulations.
Source: National Statistics Offices, IMF for BIH and KOS in 2011,
Eurostat and WB staff calculations.
70
75
80
85
90
95
100
105
110
115
120
2008 2009 2010 2011
ALB BIH KOS
MKD MNE SRB80
90
100
110
120
130
140
150
2008 2009 2010 2011
ALB BIH KOS
MKD MNE SRB

7
Figure 10: Contributions to real GDP in SEE6 (%) Figure 11: Contribution to real GDP in SEE6 as
a region (%)
Source: National Statistics Offices, IMF for BIH and KOS
in 2011 and WB staff caclulations.
Source: National Statistics Offices, IMF for BIH and KOS in 2011 and
WB staff caclulations.
Figure 12: Contribution to real GVA in SEE6
countries (%)
Figure 13: contribution to real GVA in SEE6 as a
region (%)
Source: National Statistics Offices, IMF for BIH and KOS in 2011 and
WB staff caclulations. Kosovo does not publish sectoral data on growth,
and data from Bosnia and Herzegovina are not available for 2011.
Source: National Statistics Offices, IMF for BIH and KOS in 2011 and
WB staff caclulations.
Inflation developments mirror those of real economic activity. Inflation peaked in the first
half of 2011, after rising since the end of 2009, and is now gradually easing (Figure 14). The
collapse in domestic demand during 2008-09 led to a drop in inflation. However, beginning with
the last quarter of 2009, inflation increased on the back of rising global food and energy prices.
SEE6 countries, in particular, have a large share of their CPIs driven by food and energy prices.
Inflation peaked in the first quarter of 2011 as these external price pressures abated. Serbia, in
particular, experienced an upsurge in inflation, with its CPI peaking in April 2011 at 14.7 percent
year-on-year; it has since eased to 2.7% in April 2012.
-40
-30
-20
-10
0
10
20
30
40
20
08
20
09
20
10
20
11
20
08
20
09
20
10
20
11
20
08
20
09
20
10
20
11
20
08
20
09
20
10
20
11
20
08
20
09
20
10
20
11
20
08
20
09
20
10
20
11
ALB BIH KOS MKD MNE SRB
Consumption Investment Net exports Real GDP growth
-10
-8
-6
-4
-2
0
2
4
6
8
10
2008 2009 2010 2011
SEE6
Consumption Investment Net exports Real GDP growth
-8
-6
-4
-2
0
2
4
6
8
10
20
08
20
09
20
10
20
11
20
08
20
09
20
10
20
11
20
08
20
09
20
10
20
11
20
08
20
09
20
10
20
11
20
08
20
09
20
10
20
11
20
08
20
09
20
10
20
11
ALB BIH KOS MKD MNE SRB
Agriculture Industry Construction Services Real GVA growth
-3
-2
-1
0
1
2
3
4
5
2008 2009 2010 2011
SEE6
Agriculture Industry Construction Services Real GVA growth
8
Figure 14: Inflation in SEE6, (%)
Source: SEE6 National Statistics Offices.
C. TRADE AND EXTERNAL DEVELOPMENTS––IMPROVING CURRENT
ACCOUNTS, RELATIVELY ROBUST FDI
Progressive integration of SEE6 economies
into the EU means that EU trade is a key
factor of SEE6 export performance and
overall economic growth. The EU remains
the main export market for SEE6 accounting
for 56 percent of total exports (2011) with the
lion‘s share (28.7 percent) going to Italy and
Germany. Intra-regional trade accounts for
about 22.8 percent of exports of SEE6
economies and is especially important for
Serbia, Montenegro, and Kosovo (where this
share averages 28.3 percent). Interestingly,
only one country–– FYR Macedonia––has
managed to orient its exports significantly
toward the most dynamic large European
economy––Germany (Figure 15).
After a robust recovery in 2010 and the first half of 2011, SEE6 exports have slowed,
reflecting the slowdown in demand in the Eurozone and weather related factors. By the
third quarter of 2010 exports had recovered to pre-crisis levels. In 2011, SEE6 exports grew by
14.1 percent, compared to 14.3 percent for EU10 (Figure 16). Export growth peaked in the first
quarter 2011 at 29.7 percent year on year (y-o-y), and subsequently moderated to 7 percent in the
last quarter 2011. With an exceptionally harsh winter affecting most SEE6 countries, a major
0
1
2
3
4
5
6
7
8
9
10
0
1
2
3
4
5
6
7
8
9
10
1 3 5 7 9 11 1 3 5 7 9 11 1 3 5 7 9 11 1 3
2009 2010 2011 2012
SEE6 (average)
SEE6 (median)
SEE6 (weighted average)
Figure 15: Exports (% of GDP)
Source: SEE6 central banks and UNCTAD.
3 4 58
125
11
10 89
5
10
76 8
4
7
8
6
4
0
5
10
15
20
25
30
35
40
45
MKD BIH SEE6 SRB ALB MNE KOS
Italy Germany Other EU SEE6 Other
9
decline in export growth was recorded across the region in January 2012––a weighted average
drop of 6 percent (17 percent excluding Serbia and Albania). But the deeper reason for
slowdown in exports is the adverse economic climate in the EU, which is resulting in lower
import demand and metal prices.
Figure 16: Export and economic growth (%) Figure 17: Import growth (%)
Source: SEE6 Central Banks and Eurostat. Note: Export growth is in bars, real GDP growth is in lines.
Source: SEE6 Central Banks and Eurostat.
SEE6 import dynamics have been similar to
those of exports during 2009-11, reflecting
the overall shift toward domestic demand.
After a sharp drop in 2009 and a 9 percent
recovery in 2010, imports strengthened further
in 2011, increasing by 13.6 percent (Figure 17).
A similar pattern was observed in the EU10
countries. Domestic demand and imports of
intermediate and capital goods, reflecting
higher FDI, were contributing factors. Also the
effects of higher oil and food prices were
evident especially during the first half of the
year, a period of high energy prices.
Current account deficits (CAD) and trade
balances have improved significantly since
the crisis. Since imports fell more than exports
in all countries in 2009, and export growth recovered much faster, the CAD improved in the
SEE6 region––by about 9.5 percentage points of GDP in 2011 compared to 2008. The trade
balance also improved by 6.5 percentage points of GDP (Figures 18-19). In 2011, both CADs
and trade balances deteriorated slightly across the region, (Figure 20) especially in Kosovo
where CAD and trade balances are strongly affected by the construction of the highway to
Albania and associated imports.
-20
-15
-10
-5
0
5
10
15
20
25
2008 2009 2010 2011
SEE6 EU10 EU15
EU10 growth EU15 growth
-30
-25
-20
-15
-10
-5
0
5
10
15
20
25
2008 2009 2010 2011
SEE6 EU10 EU15
Figure 18: Export and import growth
(% y-o-y)
Source: SEE6 Central Banks.
-40
-30
-20
-10
0
10
20
30
40
Exp Imp Exp Imp Exp Imp Exp Imp Exp Imp Exp Imp
ALB BIH KOS MKD MNE SRB
2009 2010 2011
10
Figure 19: CAD and trade balance, (% of GDP) Figure 20: CAD by countries, (% of GDP)
Source: Central Banks and IMF WEO and WB staff calculations. Source: SEE6 Central Banks.
Remittances have traditionally provided a
cushion against external shocks in SEE6,
but they declined somewhat over the past
two years, reflecting difficult conditions in
the Eurozone countries. Yet, there are
significant differences in official figures
between countries. Serbia‘s remittances
declined significantly, from 9.5 percent in
2009 to 6.8 in 2011 while those of other
countries remained relatively flat (Figure 21).
The region benefits from a large diaspora of
workers in high-income EU countries as well
as the United States, Canada, and Australia.
Estimates of remittances for Serbia,
Montenegro, and FYR Macedonia may be
underestimated.
FDI––an important source of financing,
investment, and growth in SEE6––saw a robust increase of 20 percent during 2011 (Figure
22). FDI more than doubled in Serbia in 2011––which seems an exceptional year because of
FIAT‘s large investment in the auto factory in Kragujevac and the investment of Belgium
Delhaise of nearly EUR 1 billion. FDI in FYR Macedonia also doubled as a share of GDP and on
a per capita basis. Car parts in the industrial sector (Serbia, FYR Macedonia) as well as financial
and agriculture sectors (FYR Macedonia) were the most successful sectors in attracting FDI. In
the aggregate, Serbia attracted the largest amount of FDI in the region––about USD 2.4 billion in
2011, followed by Montenegro, which received the highest per capita FDI (Figure 23).
-19.4
-9.3 -8.5-10.0
-29.2-26.8
-21.6-22.7
-35
-30
-25
-20
-15
-10
-5
02008 2009 2010 2011
CAD Trade balance
-60
-50
-40
-30
-20
-10
0MNE KOS ALB SEE6 SRB BIH MKD
2008 2009 2010 2011
Figure 21: Workers' remittances 2008-2011 (% of
GDP)
Source: SEE6 Central Banks. ALB and BiH define remittances inclusive compensation of employees;
KOS, SRB, MK and MNE use narrow definition of remittances.
0
2
4
6
8
10
12
14
16
18
20
KOS BIH ALB SEE6 SRB MNE MKD
2008 2009 2010 2011
11
Figure 22: Foreign direct investments (FDI, net, % GDP) Figure 23: FDI per capita (net, USD)
Source: SEE6 Central banks. Source: SEE6 Central banks.
Rapid deleveraging of the private sector led to a decline in total external debt in SEE6, but
public external debt continued its upward trend, albeit at a slower pace than before 2011
(Figure 24). This leveling off follows a significant increase in both gross external debt and
government debt to GDP ratios between 2008 and 2010. External debt was reduced by 3.5
percentage points of GDP to 60.7 percent in 2011 (after a peak of 64.1 percent of GDP in 2010).
From June 2009 to March 2012 four countries accessed international commercial markets by
issuing Eurobonds (FYR Macedonia in 2009, Albania in 2010, Montenegro in 2010, 2011 and
2012 and Serbia in 2011) (Figure 25) or by tapping into the international loan markets with an
IBRD guarantee (Serbia, FYR Macedonia). In addition, some of the SEE6 countries used their
IMF quota allocations and loan proceeds (e.g., Serbia, FYR Macedonia), which contributed to
their increased debt.
Figure 24: External debt, SEE6 average (% of
GDP)
Figure 25: Total international bonds
outstanding in select SEE6 (mln. US$)
Source: Central Banks and Ministries of Finance (MoF) of SEE6. Source: MoFs of SEE6 countries.
6.4
5.6
4.5
5.4
0
1
2
3
4
5
6
7
2008 2009 2010 2011
869
341284 285
232 199
77
0
200
400
600
800
1,000
1,200
1,400
MNE SRB KOS SEE6 ALB MKD BIH
2010 2011
53.5
61.664.0
60.7
16.2 19.923.8 25.4
0
10
20
30
40
50
60
70
2008 2009 2010 2011
External debt o/w Government debt
0
200
400
600
800
1,000
1,200
ALB MK MNE SRB

12
Total external debt varies widely across SEE6, with Montenegro and Serbia having the
highest and Kosovo3 the lowest levels (Figure 26). Montenegro and Serbia both remain well
above the regional average and also had the most rapid debt growth. FYR Macedonia and Bosnia
and Herzegovina are slightly below the SEE6 average. Kosovo remains an outlier with the
lowest level of debt, though it will begin increasing in 2012 after the withdrawals from the IMF
Stand-by Arrangement (SBA).
Figure 26: Total public and private external debt
(% of GDP)
Source: Central Banks and MoFs of SEE6, IMF, WB.
D. FISCAL POLICY AND PUBLIC DEBT––RISING RISKS
Weak economic conditions in the Eurozone have exerted a drag on economic activity and
government revenues, raising automatic stabilizer expenditures in SEE6 countries and
forcing SEE6 countries to make other fiscal policy adjustments. In this difficult environment
with rising levels of public debt and financing pressures, most SEE6 countries have to adopt
fiscal consolidation programs to reverse debt dynamics to avoid financing problems down the
road (Table 2). Fiscal and public debt pressures have been building in several countries, most
notably Albania, Montenegro, and Serbia. In response, governments have increasingly relied on
domestic and external IFI borrowing (Montenegro, Serbia, and Albania). A build-up of
budgetary arrears towards the private sector (for example, in Albania, FYR Macedonia) and
municipal arrears in Montenegro are creating additional difficulties for the private sector in an
already challenging environment. Kosovo is an outlier in that its low public debt and deficit
leave some fiscal space for maintaining high levels of public investments in strategic projects
such as the regional highways, which are important for its connectivity with neighbors.
3 Unlike other SEE6 countries, Kosovo has very limited access to international financial markets and consequently
has little external debt.
0
20
40
60
80
100
120
MNE SRB SEE6 MKD BIH ALB KOS
2008 2009 2010 2011 2012

13
Table 2: Fiscal deficits in SEE6 (percent of GDP)
2005 2006 2007 2008 2009 2010 2011 ALB -3.4 -3.3 -3.5 -5.5 -7.0 -3.0 -3.3
BIH 0.8 2.2 0.2 -3.9 -5.7 -4.5 -3.1
KOS -3.1 2.8 7.2 -0.2 -0.6 -2.6 -1.9
MKD 0.2 -0.5 0.6 -0.9 -2.7 -2.4 -2.6
MNE -1.8 3.0 6.0 -0.7 -6.7 -7.7 -3.6
SRB 1.1 -1.6 -2.0 -2.6 -4.5 -4.6 -4.8
Simple Average -1.0 0.4 1.4 -2.3 -4.5 -3.9 -3.2 Weighted Average 0.0 -0.6 -0.6 -2.8 -4.6 -4.0 -3.8 Source: Staff calculations based on MoFs data, IMF data for BIH.
Except in Kosovo, government revenues have been significantly affected by the slowdown
in economic activity. In 2011, revenues fell short of governments‘ budget projections in all
countries, except Kosovo. Weak economic activity translated into lower collections on key
revenue instruments: value-added taxes, excises, and customs revenues. Also, deteriorating
conditions in formal labor markets resulted in reduced revenues from the personal income tax
and social insurance contributions. Total revenues (in real terms) in four of the SEE6 countries
still remain below levels registered in 2008, with Serbia and Montenegro being most affected
(Figure 27).
Figure 27: SEE6 revenue performance, 2008-
2011 Figure 28: SEE6 expenditure performance,
2008 – 2011
Source: World Bank staff calculations based on the authorities‘ data.
Similar trends have continued in the first quarter of 2012, aggravated by winter conditions.
Most countries appear to have prepared their initial 2012 budgets on somewhat optimistic
assumptions about growth and this has resulted in considerable underperformance of revenues.
Montenegro appears to be the most affected as revenues fell by 11.9 percent y-o-y in the first
quarter of 2012, although April data are much stronger, compensating partly for the earlier
shortfall. In FYR Macedonia and Albania revenues were largely flat in real terms and
significantly below planned amounts. Similar trends were recorded in the first two months in
80
90
100
110
120
130
2008 2009 2010 2011
ALB BIH KOS MKD MNE SRB
80
90
100
110
120
130
140
2008 2009 2010 2011
ALB BIH KOS MKD MNE SRB

14
Serbia. At the same time, revenues increased by 5.5 percent y-o-y in Kosovo; however, this is
largely due to one-off dividend receipts whereas tax revenues actually fell by 0.6 percent.
Government responses have so far concentrated on stepping up collection efforts and
cutting spending rather than increasing tax rates (Table 3). The exception so far is
Montenegro, which experienced the largest drop in revenues and the government adopted a
revised 2012 budget in April cutting expenditures and introducing revenue measures. FYR
Macedonian government adopted a supplementary budget in April based on lower growth and
budgeted revenues, including spending cuts of 4.4 percent to remain within the original budget
deficit target. Albania has also signaled that it will revise its budget in response to the worsening
external environment. The other SEE6 have yet to take specific fiscal measures (Figure 28).
Table 3: Governments‘ fiscal responses in 2012
Country Fiscal Pressures Status of adjustment Key measures
Albania Slow growth, revenues
Unplanned electricity imports
Expected in July 2012 Under discussion.
Bosnia and
Herzegovina
Slow growth, revenues Not announced Not announced.
Kosovo Regular mid-year revision
Expected in mid-2012 cuts in spending and new
revenue measures expected to
be adopted
Macedonia, FYR Slow growth, revenues Adopted by Government in
April 2012
Cuts in spending on capital
expenditures and goods and
services
Montenegro Slow growth, revenues,
Called state guarantees
Adopted by Parliament in
May 2012
New specific taxes and fees,
cuts in current and capital
spending
Serbia Slow growth, revenues Expected post elections Increase in tax rates
Wage and pension freezes *
Source: World Bank staff.
* Pending Government decision.
Expenditure adjustments in 2011 were broad, cutting investment, subsidies and other
current expenditures. Expenditures were cut most in Montenegro, mostly capital spending and
subsidies. FYR Macedonia also adjusted budgeted spending by cutting goods and services and
capital spending. Expenditures in Serbia were in line with the budget with wages growing
slightly higher than other spending categories. Expenditures in Kosovo in 2011 were 8 percent
lower than the budget; however, this reflects implementation capacity constraints rather than
financing constraints.
In early 2012, governments continued cutting expenditures in response to revenue
underperformance to remain within the financing constraints. In particular, spending in
Albania and Montenegro has been lowered in early 2012 relative to 2011.
However, with rigid spending patterns, there are reports of arrears emerging in several
SEE6 countries. With the exception of Kosovo, spending patterns of SEE6 countries appear to
be heavily tilted towards wages and social transfers, making adjustments difficult in the short

15
run4. In addition, the economic slowdown appears to have unmasked existing vulnerabilities in
the public financial management framework, including non-functioning refund schemes and
inadequate commitment controls. This is creating an additional constraint for the private sector in
an already challenging economic environment. For instance in Montenegro, the stock of general
government arrears (mostly in municipalities) is documented at about 3.5 percent of GDP at the
end of 2011. In response, the government is implementing a program of reducing arrears in
municipalities. In other countries, however, there are no firm data on budgetary arrears although
indirect and circumstantial evidence from the private sector suggests they may be significant.
Gross financing requirements5 in 2012-13 are substantial in SEE6. These appear to be driven
by deficit levels but also growing reliance on short-term debt in a few countries. While SEE6
countries have been able to roll over their debt so far, this may change if the situation in the
financial sector deteriorates. With relatively small adjustments in fiscal balances envisaged
across the SEE6 in 2013, financing requirements are not expected to fall significantly. While
financing for most of the deficit is expected to come from international financial organizations,
and commercial and bilateral lenders, the sizable amount of short-term debt will keep gross
financing needs high and the roll-over risk considerable.
External financing conditions
are tight. While borrowing costs
for developing countries
(including for SEE6 region) have
declined in early 2012 as a
consequence of reduced risk
aversion6, they still remain high
(Figure 29). By end-March,
2012, spreads on debt issued by
SEE6 countries declined by
between 80 and 290 basis points
compared to end-2011 but have
increased again because of
renewed turmoil in the
Eurozone. However, ranging
from between 570 – 880 basis
points, these remain high and
could rise further in the face of a
Greek contagion which could
significantly curtail access to
finance.
4 For a fuller discussion of revenue and spending structure of fiscal sectors in SEE6 see Box 2 in previous SEE RER.
5 Financing needs are defined as deficit levels and repayments on domestic and foreign debt, including short-term
debt. 6 World Bank, Development Prospects Groups, Weekly Global Economic Brief, March 2012, available at:
http://siteresources.worldbank.org/INTPROSPECTS/Resources/334934-1302024558568/7846453-
1326146297898/DECPGWeekly_032912.pdf
Figure 29: Spreads on SEE6 sovereign external debt (in bps)
Source: World Bank staff.
0
200
400
600
800
1000
1200
1400
Q4.10 Q1.11 Q2.11 Q3.11 Dec-11 Jan-12 Feb-12 Mar-12 Apr-12
ALB MKD MNE SRB
16
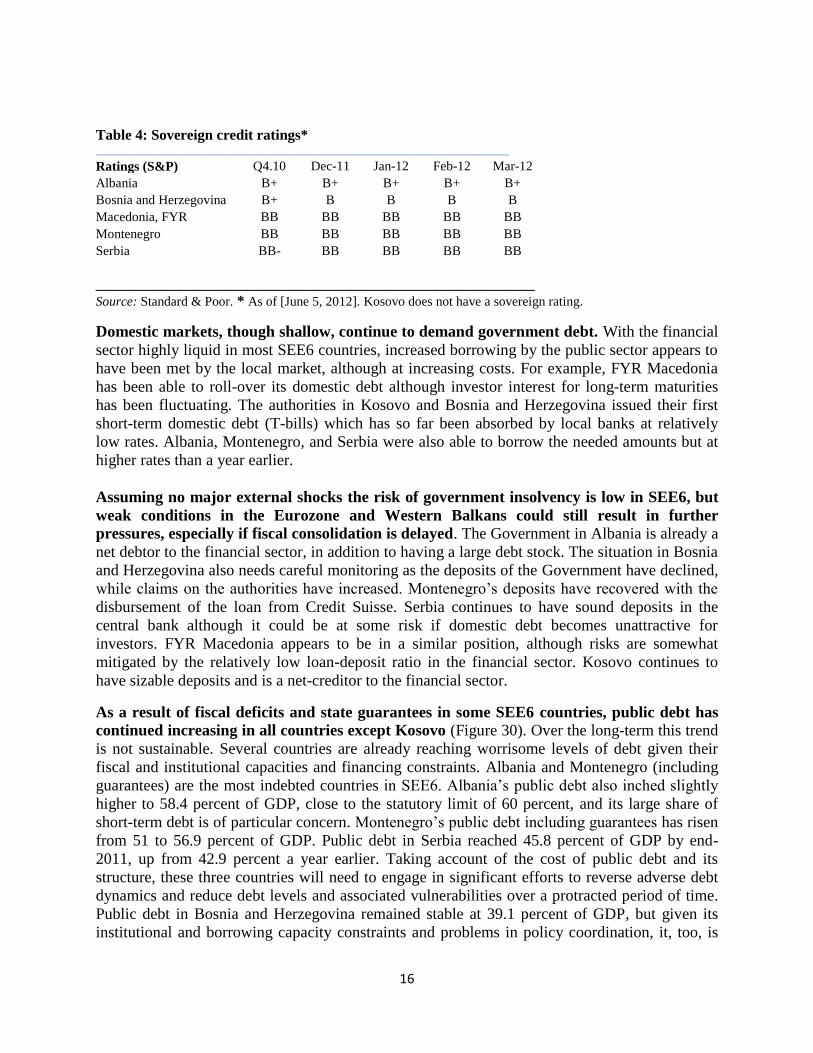
Table 4: Sovereign credit ratings* _____________________________________________________________________
Ratings (S&P) Q4.10 Dec-11 Jan-12 Feb-12 Mar-12
Albania B+ B+ B+ B+ B+
Bosnia and Herzegovina B+ B B B B
Macedonia, FYR BB BB BB BB BB
Montenegro BB BB BB BB BB
Serbia BB- BB BB BB BB
____________________________________________________________
Source: Standard & Poor. * As of [June 5, 2012]. Kosovo does not have a sovereign rating.
Domestic markets, though shallow, continue to demand government debt. With the financial
sector highly liquid in most SEE6 countries, increased borrowing by the public sector appears to
have been met by the local market, although at increasing costs. For example, FYR Macedonia
has been able to roll-over its domestic debt although investor interest for long-term maturities
has been fluctuating. The authorities in Kosovo and Bosnia and Herzegovina issued their first
short-term domestic debt (T-bills) which has so far been absorbed by local banks at relatively
low rates. Albania, Montenegro, and Serbia were also able to borrow the needed amounts but at
higher rates than a year earlier.
Assuming no major external shocks the risk of government insolvency is low in SEE6, but
weak conditions in the Eurozone and Western Balkans could still result in further
pressures, especially if fiscal consolidation is delayed. The Government in Albania is already a
net debtor to the financial sector, in addition to having a large debt stock. The situation in Bosnia
and Herzegovina also needs careful monitoring as the deposits of the Government have declined,
while claims on the authorities have increased. Montenegro‘s deposits have recovered with the
disbursement of the loan from Credit Suisse. Serbia continues to have sound deposits in the
central bank although it could be at some risk if domestic debt becomes unattractive for
investors. FYR Macedonia appears to be in a similar position, although risks are somewhat
mitigated by the relatively low loan-deposit ratio in the financial sector. Kosovo continues to
have sizable deposits and is a net-creditor to the financial sector.
As a result of fiscal deficits and state guarantees in some SEE6 countries, public debt has
continued increasing in all countries except Kosovo (Figure 30). Over the long-term this trend
is not sustainable. Several countries are already reaching worrisome levels of debt given their
fiscal and institutional capacities and financing constraints. Albania and Montenegro (including
guarantees) are the most indebted countries in SEE6. Albania‘s public debt also inched slightly
higher to 58.4 percent of GDP, close to the statutory limit of 60 percent, and its large share of
short-term debt is of particular concern. Montenegro‘s public debt including guarantees has risen
from 51 to 56.9 percent of GDP. Public debt in Serbia reached 45.8 percent of GDP by end-
2011, up from 42.9 percent a year earlier. Taking account of the cost of public debt and its
structure, these three countries will need to engage in significant efforts to reverse adverse debt
dynamics and reduce debt levels and associated vulnerabilities over a protracted period of time.
Public debt in Bosnia and Herzegovina remained stable at 39.1 percent of GDP, but given its
institutional and borrowing capacity constraints and problems in policy coordination, it, too, is
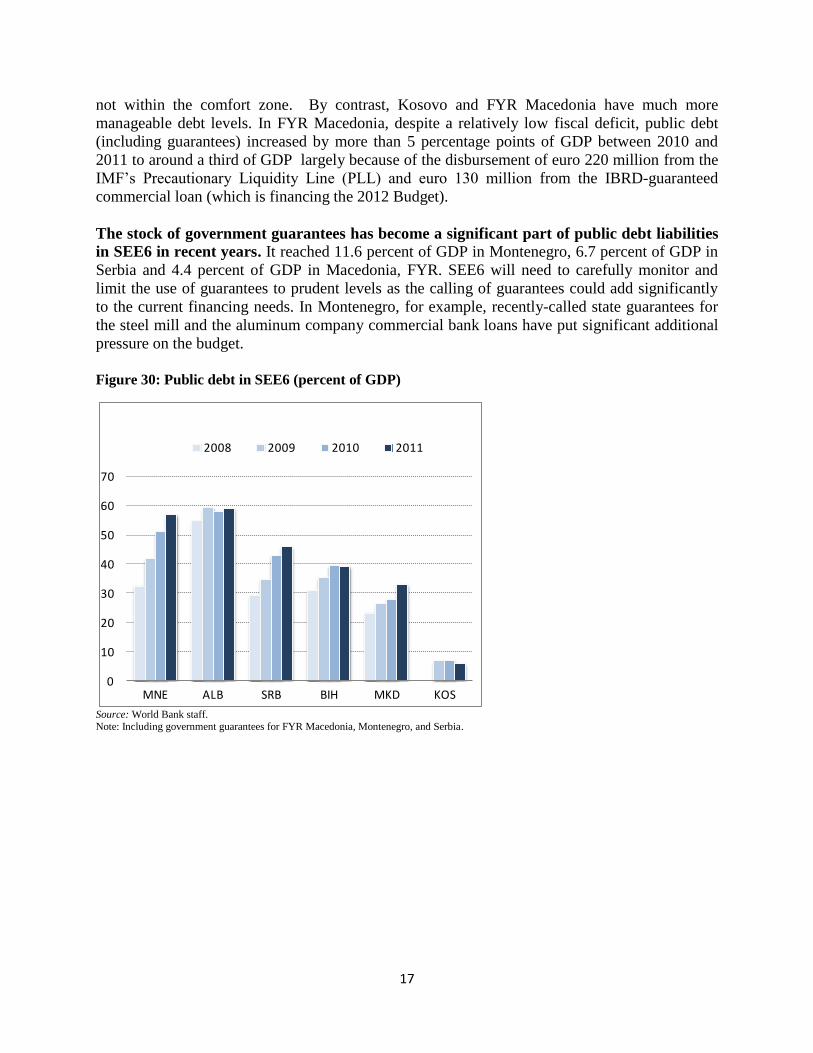
17
not within the comfort zone. By contrast, Kosovo and FYR Macedonia have much more
manageable debt levels. In FYR Macedonia, despite a relatively low fiscal deficit, public debt
(including guarantees) increased by more than 5 percentage points of GDP between 2010 and
2011 to around a third of GDP largely because of the disbursement of euro 220 million from the
IMF‘s Precautionary Liquidity Line (PLL) and euro 130 million from the IBRD-guaranteed
commercial loan (which is financing the 2012 Budget).
The stock of government guarantees has become a significant part of public debt liabilities
in SEE6 in recent years. It reached 11.6 percent of GDP in Montenegro, 6.7 percent of GDP in
Serbia and 4.4 percent of GDP in Macedonia, FYR. SEE6 will need to carefully monitor and
limit the use of guarantees to prudent levels as the calling of guarantees could add significantly
to the current financing needs. In Montenegro, for example, recently-called state guarantees for
the steel mill and the aluminum company commercial bank loans have put significant additional
pressure on the budget.
Figure 30: Public debt in SEE6 (percent of GDP)
Source: World Bank staff. Note: Including government guarantees for FYR Macedonia, Montenegro, and Serbia.
0
10
20
30
40
50
60
70
MNE ALB SRB BIH MKD KOS
2008 2009 2010 2011
18
E. MONETARY POLICY AND FINANCIAL SECTOR–CONTINUED
DELEVERAGING
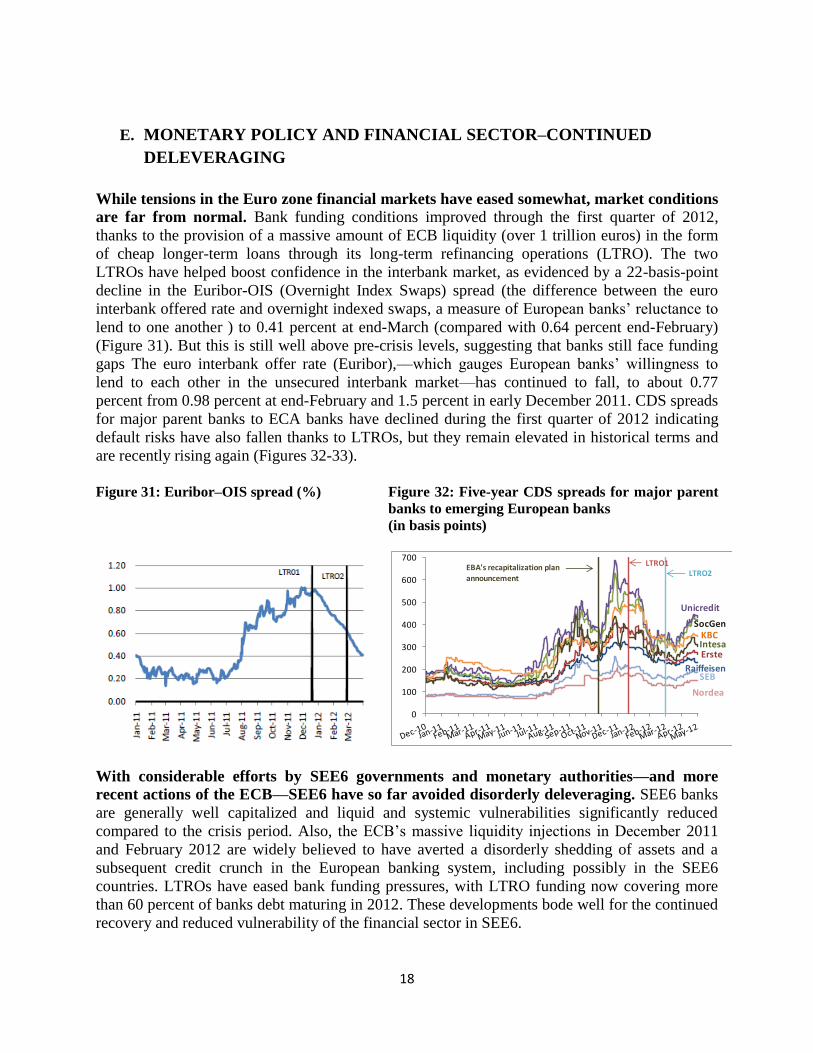
While tensions in the Euro zone financial markets have eased somewhat, market conditions
are far from normal. Bank funding conditions improved through the first quarter of 2012,
thanks to the provision of a massive amount of ECB liquidity (over 1 trillion euros) in the form
of cheap longer-term loans through its long-term refinancing operations (LTRO). The two
LTROs have helped boost confidence in the interbank market, as evidenced by a 22-basis-point
decline in the Euribor-OIS (Overnight Index Swaps) spread (the difference between the euro
interbank offered rate and overnight indexed swaps, a measure of European banks‘ reluctance to
lend to one another ) to 0.41 percent at end-March (compared with 0.64 percent end-February)
(Figure 31). But this is still well above pre-crisis levels, suggesting that banks still face funding
gaps The euro interbank offer rate (Euribor),––which gauges European banks‘ willingness to
lend to each other in the unsecured interbank market––has continued to fall, to about 0.77
percent from 0.98 percent at end-February and 1.5 percent in early December 2011. CDS spreads
for major parent banks to ECA banks have declined during the first quarter of 2012 indicating
default risks have also fallen thanks to LTROs, but they remain elevated in historical terms and
are recently rising again (Figures 32-33).
Figure 31: Euribor–OIS spread (%)
Figure 32: Five-year CDS spreads for major parent
banks to emerging European banks
(in basis points)
With considerable efforts by SEE6 governments and monetary authorities––and more
recent actions of the ECB––SEE6 have so far avoided disorderly deleveraging. SEE6 banks
are generally well capitalized and liquid and systemic vulnerabilities significantly reduced
compared to the crisis period. Also, the ECB‘s massive liquidity injections in December 2011
and February 2012 are widely believed to have averted a disorderly shedding of assets and a
subsequent credit crunch in the European banking system, including possibly in the SEE6
countries. LTROs have eased bank funding pressures, with LTRO funding now covering more
than 60 percent of banks debt maturing in 2012. These developments bode well for the continued
recovery and reduced vulnerability of the financial sector in SEE6.
0
100
200
300
400
500
600
700
Raiffeisen
Erste
Unicredit
IntesaKBC
SocGen
SEB
Nordea
EBA's recapitalization plan
announcement
LTRO1LTRO2

19
Figure 33: ECB LTROs and bank term funding (in billions of Euro)
1 The change in euro area monetary and financial institutions' holdings of
government bonds from end-November 2011 to February 2012.
Source: IMF Global Financial Stability Report, April 2012.
But significant risks remain in the European financial system. Most of the liquidity provided
to the European banks has been used for the profitable carry trade (with banks able to borrow at
1 percent and invest in sovereign bonds with high yields), and only a limited amount of the
additional liquidity has ended up in the real economy. Banks are expected to continue to remain
under market and regulatory pressure (magnified by the EBA‘s end-June requirement) for
leading Eurozone banks to boost capital and liquidity buffers, to strengthen their balance sheets,
and more broadly, adjust their business models toward a more sustainable new equilibrium.
Yet, despite funding pressures since 2008, international banks have generally maintained
exposures to SEE6 countries, although they reduced exposure to non-affiliated banks.
Despite the loss of funding from non-affiliated international banks, total foreign liabilities grew
in most Central, Eastern and Southeastern Europe (CESEE) banking systems. That is, while the
rapid growth came to a sudden halt, parent funding has not declined, as of Q3 2011, as some had
feared. Several factors may be at play:
strategic commitment of many parent banks to remain present in the CESEE region,
combined with their small local portfolios in SEE6,
continued profitability of operations in these countries, and
difficulty in shrinking balance sheets that mostly consist of loans, especially in SEE6
countries which have neither robust capital markets nor an established secondary market
for loan sales.

20
Regardless of contractual maturities on loans, reducing the exposure to clients is difficult in an
environment where enterprises are suffering from weak economic conditions, and competing
financial institutions are not looking to significantly expand their exposures. If banks do choose
to reduce their loan books, this is likely to be associated with credit losses. Still, bank lending in
the region seems to be increasingly funded from local deposit sources, in contrast to the pre-
crisis period, thus reducing banking systems‘ exposure to international funding.
European officials, IFIs and private banking groups agreed in January 2012 on a set of
principles under Vienna Initiative 2.0 to help avoid disorderly deleveraging in emerging
Europe—the region most vulnerable to the effects of large bank retrenchment. Regulatory
coordination between home and host countries is critically important in the fragile economic
environment where national authorities may be focused on their country problems first and
foremost. The revitalization of the Vienna Initiative, Vienna 2.0, therefore, seeks to bring
together national and international authorities with IFIs to stimulate policy coordination for
emerging Europe. The initiative includes European Commission (EC), European Banking
Authority (EBA), European Systemic Risk Board (ESRB), European Central Bank (ECB, as
observer), International Monetary Fund (IMF), European Bank for Reconstruction and
Development (EBRD), European Investment Bank (EIB), the World Bank Group (WBG), and
national authorities. The objectives of Vienna 2.0 include to obtain: (i) commitment by home
authorities to consider impacts of regulatory measures in emerging Europe and to communicate
effectively with host authorities; (ii) efforts by host authorities to develop local funding sources;
(iii) effective communication between home and host authorities to avoid ring-fencing of
liquidity; (iv) revision by supervisory colleges of EBA recapitalization plans and their impact on
host countries; and (v) commitment of IFIs to analyze risks, provide policy advice and
coordinate their support to the region.
Overall, the total level of deposits in
SEE6 countries has recovered to pre-
crisis peaks. (Figure 34). Following a
sharp drop in deposits with the onset of
the first wave of crisis in late 2008, there
has been a gradual recovery. In all
countries except Montenegro, deposits are
now above the pre-crisis peak. In Bosnia
and Herzegovina, deposits have just
returned to pre-crisis peak. However, the
recovery of deposits has slowed in recent
months, and in fact there has been a slight
decrease in deposits during first quarter
for the region as a whole. Looking at the
aggregate number for the region, deposits
have dropped by 2.5% during the first
three months of 2012, compared to
almost 7 percent increase in the second
Figure 34: Total deposits (valued in euro, Sept. 2008=100)
Source: SEE6 Central Banks.
20
40
60
80
100
120
140
160
Dec-0
5
Jun
-06
Dec-0
6
Jun
-07
Dec-0
7
Jun
-08
Dec-0
8
Jun
-09
Dec-0
9
Jun
-10
Dec-1
0
Jun
-11
Dec-1
1
ALB BIH
KOS MKD
MNE SRB
SEE6 total

21
half of 2011. This reversal, in aggregate and in most of the individual countries (excluding
Albania and FYR Macedonia), is most likely linked to the turbulence in financial markets in the
second half of 2011.
Credit growth is positive in most of the region, but growth rates are well below pre-crisis
levels and in line with muted demand (Figure 35-36). Despite the stress that financial systems
experienced in the second half of 2011, credit growth has remained positive in most of SEE6
countries (except Montenegro, which experienced the largest credit boom and bust7). The
nominal y-o-y growth rate of credit to the private sector up to January 2012 for SEE6 (measured
as the median of individual countries growth rates) has hovered around 8 percent over the
previous year, but by March it dropped to 6.2 percent. The highest credit growth rates were
recorded in Albania (11.0 percent) and Kosovo (13.6 percent), although they are nowhere near
the unsustainable rates of the pre-crisis period. Credit growth to companies and households has
been broadly similar, with some slowdown in credit to companies in February and March. Year-
on-year growth of credit to companies has been at 9 to 10 percent through most of 2011, but in
February and March of 2012 it is around 7 percent (Figures 37-38).
Figure 35: Real y-o-y growth of credit
to the private sector up to March 2012 *
* Data for MNE not available
Source: SEE6 Central Banks.
Figure 36: Nominal y-o-y growth of credit
to the private sector up to March 2012
Source: SEE6 Central Banks.
7 Total credit growth in Montenegro is depressed as a reflection of credit contraction and the transfer of bad loans to
parent banks/factoring companies in the four large banks, while the remaining seven banks recorded positive credit
growth.
-10
0
10
20
30
40
50
60
Jan-07 Jul-07 Jan-08 Jul-08 Jan-09 Jul-09 Jan-10 Jul-10 Jan-11 Jul-11 Jan-12
ALB
BIH
KOS
MKD
MNE
SRB
SEE6 median
-20
-10
0
10
20
30
40
50
60
70
Jan-07 Jul-07 Jan-08 Jul-08 Jan-09 Jul-09 Jan-10 Jul-10 Jan-11 Jul-11 Jan-12
ALB
BIH
KOS
MKD
MNE
SRB
SEE6 median

22
Figure 37: Nominal y-o-y growth of credit
to private companies up to March 2012
Source: SEE6 Central Banks.
Figure 38: Nominal y-o-y growth of credit
to households up to March 2012
Source: SEE6 Central Banks.
NPLs remain significantly elevated, averaging 14 percent across SEE6 (Figure 39). After
increasing with the onset of the crisis, NPLs have stabilized at an elevated level. NPLs are
especially high in Serbia and Albania. In Serbia, NPLs have been stable at about 18-19 percent,
though generally gradually increasing. In Albania NPLs continue to rise, reaching 20 percent in
March 2012. Montenegro had the highest level of NPLs, but this was sharply reduced in the
second half of 2011, largely due to the sale of bad loans to factoring companies and/or to mother
banks, and, to a lesser extent, loan collection. This chronic high level of NPLs impedes banks‘
earnings, capitalization, ability to attract new investors and moreover, willingness to lend.
Generally stabilizing NPLs and liquid and
well capitalized banks, however, should not
obscure the fact that a number of smaller
and publically–owned banks are facing
difficulties. As of December 2011, liquid
assets to total assets were at around 38 percent
in Serbia, 31 percent in FYR Macedonia, 27
percent in Bosnia and Herzegovina, and 22
percent in Montenegro. Banking sector capital
adequacy ratios remain solid in most countries
(as of December 2011 it was 13.3 percent in
Bosnia and Herzegovina, 15.5 in Montenegro,
15.6 percent in Albania, 16.8 in FYR
Macedonia and 19.1 percent in Serbia).
Overall, banks in most countries of the region
were profitable in 2011 (Figures 40-41). Loan
loss provisions, which are relatively high and
have been increasing on the back of
-30
-20
-10
0
10
20
30
40
50
60
70
Jan-07 Jul-07 Jan-08 Jul-08 Jan-09 Jul-09 Jan-10 Jul-10 Jan-11 Jul-11 Jan-12
ALB
BIH
KOS
MKD
MNE
SRB
SEE6 median
-20
-10
0
10
20
30
40
50
60
70
Jan-07 Jul-07 Jan-08 Jul-08 Jan-09 Jul-09 Jan-10 Jul-10 Jan-11 Jul-11 Jan-12
ALB
BIH
KOS
MKD
MNE
SRB
SEE6 median
Figure 39: Non-performing loans (% of total
loans)
Source: SEE6 Central Banks.
0
5
10
15
20
25
30
2007:Q1 2007:Q4 2008:Q3 2009:Q2 2010:Q1 2010:Q4 2011:Q3
ALB
BIH
KOS
MKD
MNE
SRB
SEE6 median

23
worsening of NPLs, provide further assurance against abrupt unwinding of banking systems
(Figure 42). That said, individual banks are having difficulty keeping adequate capital levels;
this is mostly the case for some small, domestically-owned banks and some public banks.
Monetary and supervisory authorities should remain vigilant in closely monitoring and
reassessing risks and taking early action at any sign of weaknesses in the system.
Figure 40: Banking sector return on assets
(ROA)
Source: SEE6 Central Banks.
Figure 41: Banking sector return on equity
(ROE)
Source: SEE6 Central Banks.
Figure 42: Loan loss provisions, as percent of total gross
loans
Source: SEE6 Central Banks.
-5
-4
-3
-2
-1
0
1
2
3
4
2006:Q1 2007:Q3 2009:Q1 2010:Q3 2012:Q1
ALB
BIH
KOS
MKD
MNE
SRB
-50
-40
-30
-20
-10
0
10
20
30
2006:Q1 2007:Q3 2009:Q1 2010:Q3 2012:Q1
ALB
BIH
KOS
MKD
MNE
SRB
0
2
4
6
8
10
12
ALB BIH KOS MKD MNE SRB
Dec-08 Dec-09 Dec-10 Mar-11
Jun-11 Sep-11 Dec-11

24
F. LABOR MARKET DEVELOPMENTS IN SEE6–WORRISOME TRENDS
The growth in SEE6 countries has not been effective in reducing high unemployment. The
estimated elasticity of unemployment with respect to growth in SEE6 countries has been rather
low, about -0.2, meaning that a 1 percentage point of growth, on average, is associated with 0.2
percentage point decline in the unemployment rate (Figure 43). This means that with the
unchanged pattern of growth, it would take five years of strong growth averaging 5 percent or
more for unemployment to decline substantially––by about 5 percentage points overall. This
highlights the criticality of reigniting robust, labor-absorbing growth in SEE6 and the need for
strong pro-growth stabilization and structural policies.
Further, since the global crisis, the growth-unemployment nexus has been less favorable in
SEE6 than in comparator countries––and the trend is worrisome. The sensitivity of the
unemployment rate to growth is much lower in SEE6 than in EU10 countries. Moreover, the
SEE6 unemployment rate, which is overall much higher than in the rest of Europe and in EU10,
continued to climb up in 2011 in several SEE6 countries. As a result, unemployment rates in
Serbia, Bosnia and Herzegovina, and Montenegro in 2011 were substantially higher than in the
pre-crisis period. FYR Macedonia and Kosovo, by contrast, managed to reduce unemployment
somewhat but from the very high levels, despite the contraction of output in FYR Macedonia in
2009 (Figure 44). In part, the changes reflect structural reforms which in Montenegro and
Kosovo meant significant reductions in employment in the public sector.
Figure 43: Changes in the unemployment rates and GDP growth rates in the
SEE6, 2000-10
Notes: The number of observations is 52. Albania 2000-02 observations were identified as outliers with the
absolute values of standardized residuals greater than 2. Therefore, they were excluded. Standard error for the
coefficient for GDP growth is 0.09 (t=-2.18). Serbia and Montenegro estimates are combined in the original KILM series. Disaggregated statistics were estimated using the following methodology: Unemployment and
labor force estimates based on labor force surveys for the population aged 15+ estimates are available from the
national statistical offices. These estimates were combined to calculate a Serbia and Montenegro total for 2008 through 2010.Then using the ratio of the KILM estimates to our combined estimates for 2008, the combined
Serbia and Montenegro were forecasted from 1999 through 2007. Then, using the ratio of labor force in Serbia
to labor force in Serbia and Montenegro combined in 2008, the Serbia labor force estimates were calculated for 1999 through 2007. The same procedure was followed with the unemployment estimates as well for Montenegro.
Sources: R. Islam and A. (2012). “Jobs in ECA,” background paper for Regional Labor Market report, under preparation. GDP growth estimates are from the WDI (2011). Unemployment rate estimates are from the ILO's
KILM database (retrieved on 4/2/12).
y = -0.2036x + 0.955
-8
-6
-4
-2
0
2
4
6
8
-12.5 -10.0 -7.5 -5.0 -2.5 0.0 2.5 5.0 7.5 10.0 12.5
An
nu
al %
-po
int
chan
ge
in u
nem
plo
yme
nt
rate
, 2
00
0-1
0
Annual growth in real GDP (%), 2000-10

25
Figure 44: Change in unemployment rates between 2008 and 2011 (in percentage points)
Source: Labor Force Surveys (LFS) of National Statistical Offices.
Notes: Latest 2011 LFS data used. Kosovo data are for 2009. Albania‘s unemployment rate is based on administrative sources.
The increase in output in 2011 was not
accompanied by falling unemployment in
most SEE6 countries––a seeming evidence
of ―jobless growth‖ (Figure 45).8 For
example, Serbia‘s unemployment continued
to climb, reaching 23.79 percent in
November 2011 – an all-time record since
the labor force survey (LFS) was introduced
15 years ago (Box 1). This reflects continued
employment losses in Serbia‘s industry and
services, in part, competitive pressures,
restructuring, and increased inactivity rate.10
In FYR Macedonia, the measured
unemployment rate was stable at 31.2
percent in the first three quarters of 2011,
but then rose to 31.8 in the last quarter.
Montenegro, by contrast, saw a continued
decline in the unemployment rate during
2011, from 21.2 percent in Q1 to 18.9
percent in Q4, although Montenegro‘s unemployment rate shows strong seasonal pattern
associated with the peak employment during the summer tourist season. A LFS has not been
8 LFS data in SEE6 are infrequent in several SEE6 countries, so a fully updated and region-wide labor market
analysis for 2011 is not possible for all countries. Albania and Kosovo have not undertaken a LFS since 2009. 9 Figures are based on ―age 15+‖ definition of working age population.
10 Data from the LFS panel allow a decomposition of the determinants of the rise of unemployment. Between April
2008 and April 2011 there was both a significant increase of the number of unemployed (more than 200,000), but
also a decrease in the economically active population (by roughly 350,000).
The increase in inactivity was particularly high at the beginning of the financial crisis and among those in informal
employment; a quarter of the population in this group transitioned from informal employment to inactivity between
April 2008 and April 2009.
-3
-3
-2
-2
-1
-1
0
Macedonia, FYR Kosovo0
1
2
3
4
5
6
7
8
9
Albania Montenegro BIH Serbia
Figure 45: Unemployment rates in SEE6 and EU10
Source: Labor Force Surveys of National Statistical Offices.
Note: Data for Kosovo for 2010-11 not available; data for Albania
from administrative sources.
0
5
10
15
20
25
30
35
40
45
50
2007 2008 2009 2010 2011
ALB BIH KOSMKD MNE SRBEU-10*

26
undertaken in Kosovo since 2009, and data for Albania are not currently available to users since
the same year. The latest LFS in BIH was completed in April 2011 when unemployment was
27.6 percent (0.4 percentage points higher than in 2010).
Box 1: Regional unemployment trends in Serbia
Unemployment in SEE6 is high but it is even higher in specific regions, which may require the particular attention
of governments as ―‘hot spots‖ of high unemployment and social tensions. For example, unemployment rates are
quite uneven across Serbia, the largest economy in SEE6: unemployment is highest in the south-eastern part of the
country (26.6 percent in November 2011), and lowest in Belgrade (20.8 percent) while the Kragujevac area seems to
have seen a decline in unemployment with the arrival of the large FIAT plant. Interestingly, the substantial increase
in unemployment over the past few years has affected urban areas more than rural areas. As a result, urban
unemployment in 2011 (25.5 percent) surpassed traditionally high rural unemployment (21.5 percent). Also,
contrary to some perceptions, the Belgrade area, in particular, has suffered the most in recent months, with
unemployment increasing by 2 percentage points between April and November 2011. Tracking regional
unemployment with high quality and updated data is important in monitoring local labor market developments and
formulating policy responses.
Source: World Bank staff.
Youth unemployment is reaching alarming levels in some countries. Youth (15-24)
unemployment is not only the highest among all age groups, but it has been increasing during
2011 in all countries for which a recent LFS is available. FYR Macedonia has the highest
measured youth unemployment (59.4 percent in Q4 of 2011) and also recorded the largest
increase during 2011 – a 9 percentage point year-on-year increase in Q4. While this must be
qualified by a preliminary indication that official unemployment data in FYR Macedonia need to
be revisited for coverage and accuracy, there is little doubt that unemployment, including youth
unemployment, remains high. Similarly, Serbia‘s youth unemployment was 51.9 percent in
November 2011), followed by Montenegro (39.4 percent in Q4 2011). Even though recent data
are not available for BIH and Kosovo, indications are that youth unemployment might be even
higher in these countries.
Unemployment among those with low skills (with no education beyond primary) continues
to be higher than for skilled workers in FYR Macedonia and Montenegro, but not in
Serbia. In FYR Macedonia and Montenegro, the low-skill unemployment rate is very high––
37.3 and 30.3 percent, respectively, but Montenegro employs substantial migrant labor during
the summer tourist season. By contrast, Serbia‘s unemployment rate is highest (26.8 percent) for
job seekers with secondary education.
Another issue is that a large share of unemployment in the SEE6 is long-term, with
damaging effects on human capital. Over 80 percent of those looking for a job in BIH and
Montenegro, and over 70 percent of those in Serbia, have been looking for a job for over a year.
The situation is likely similar in other countries even though data are not available. Being out of
work for an extended period has devastating effects on people‘s skills and work abilities. This, in
turn, diminishes their future job prospects, and ultimately may lead job seekers to become
inactive.
Administrative source data present complementary, updated information, largely
corroborating the previous picture on unemployment trends. All SEE6 collect some labor
market data from administrative sources (Figure 46). The downside is that these data are, in
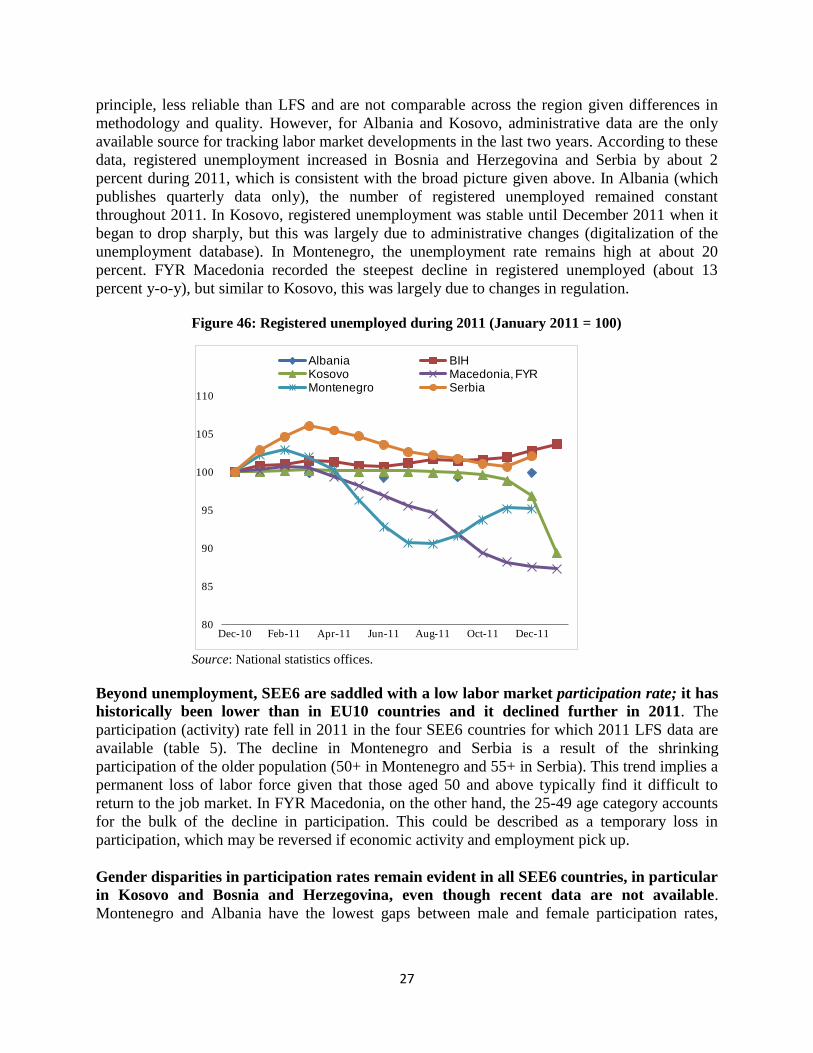
27
principle, less reliable than LFS and are not comparable across the region given differences in
methodology and quality. However, for Albania and Kosovo, administrative data are the only
available source for tracking labor market developments in the last two years. According to these
data, registered unemployment increased in Bosnia and Herzegovina and Serbia by about 2
percent during 2011, which is consistent with the broad picture given above. In Albania (which
publishes quarterly data only), the number of registered unemployed remained constant
throughout 2011. In Kosovo, registered unemployment was stable until December 2011 when it
began to drop sharply, but this was largely due to administrative changes (digitalization of the
unemployment database). In Montenegro, the unemployment rate remains high at about 20
percent. FYR Macedonia recorded the steepest decline in registered unemployed (about 13
percent y-o-y), but similar to Kosovo, this was largely due to changes in regulation.
Figure 46: Registered unemployed during 2011 (January 2011 = 100)
Source: National statistics offices.
Beyond unemployment, SEE6 are saddled with a low labor market participation rate; it has
historically been lower than in EU10 countries and it declined further in 2011. The
participation (activity) rate fell in 2011 in the four SEE6 countries for which 2011 LFS data are
available (table 5). The decline in Montenegro and Serbia is a result of the shrinking
participation of the older population (50+ in Montenegro and 55+ in Serbia). This trend implies a
permanent loss of labor force given that those aged 50 and above typically find it difficult to
return to the job market. In FYR Macedonia, on the other hand, the 25-49 age category accounts
for the bulk of the decline in participation. This could be described as a temporary loss in
participation, which may be reversed if economic activity and employment pick up.
Gender disparities in participation rates remain evident in all SEE6 countries, in particular
in Kosovo and Bosnia and Herzegovina, even though recent data are not available.
Montenegro and Albania have the lowest gaps between male and female participation rates,
80
85
90
95
100
105
110
Dec-10 Feb-11 Apr-11 Jun-11 Aug-11 Oct-11 Dec-11
Albania BIHKosovo Macedonia, FYRMontenegro Serbia
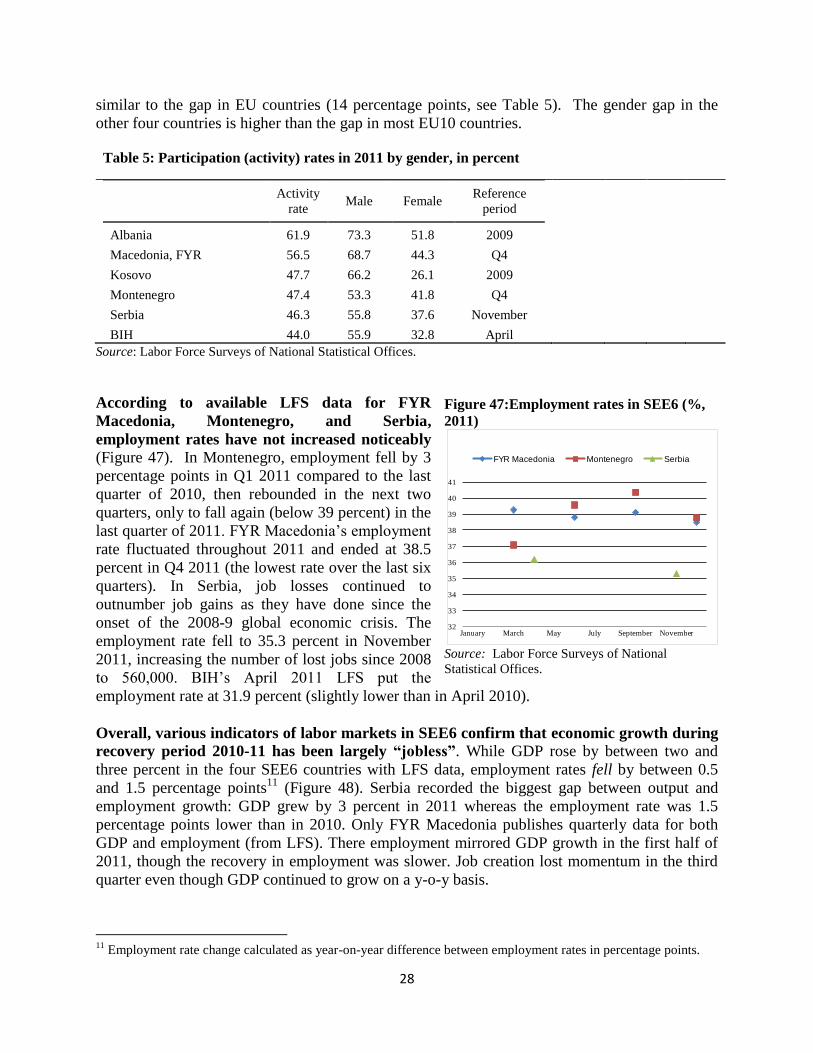
28
similar to the gap in EU countries (14 percentage points, see Table 5). The gender gap in the
other four countries is higher than the gap in most EU10 countries.
Table 5: Participation (activity) rates in 2011 by gender, in percent
Activity
rate Male Female
Reference
period
Albania 61.9 73.3 51.8 2009
Macedonia, FYR 56.5 68.7 44.3 Q4
Kosovo 47.7 66.2 26.1 2009
Montenegro 47.4 53.3 41.8 Q4
Serbia 46.3 55.8 37.6 November
BIH 44.0 55.9 32.8 April
Source: Labor Force Surveys of National Statistical Offices.
According to available LFS data for FYR
Macedonia, Montenegro, and Serbia,
employment rates have not increased noticeably
(Figure 47). In Montenegro, employment fell by 3
percentage points in Q1 2011 compared to the last
quarter of 2010, then rebounded in the next two
quarters, only to fall again (below 39 percent) in the
last quarter of 2011. FYR Macedonia‘s employment
rate fluctuated throughout 2011 and ended at 38.5
percent in Q4 2011 (the lowest rate over the last six
quarters). In Serbia, job losses continued to
outnumber job gains as they have done since the
onset of the 2008-9 global economic crisis. The
employment rate fell to 35.3 percent in November
2011, increasing the number of lost jobs since 2008
to 560,000. BIH‘s April 2011 LFS put the
employment rate at 31.9 percent (slightly lower than in April 2010).
Overall, various indicators of labor markets in SEE6 confirm that economic growth during
recovery period 2010-11 has been largely ―jobless‖. While GDP rose by between two and
three percent in the four SEE6 countries with LFS data, employment rates fell by between 0.5
and 1.5 percentage points11
(Figure 48). Serbia recorded the biggest gap between output and
employment growth: GDP grew by 3 percent in 2011 whereas the employment rate was 1.5
percentage points lower than in 2010. Only FYR Macedonia publishes quarterly data for both
GDP and employment (from LFS). There employment mirrored GDP growth in the first half of
2011, though the recovery in employment was slower. Job creation lost momentum in the third
quarter even though GDP continued to grow on a y-o-y basis.
11
Employment rate change calculated as year-on-year difference between employment rates in percentage points.
Figure 47:Employment rates in SEE6 (%,
2011)
Source: Labor Force Surveys of National
Statistical Offices.
32
33
34
35
36
37
38
39
40
41
January March May July September November
FYR Macedonia Montenegro Serbia

29
Figure 48: Change in real GDP and employment rate in 2011: annual data for SEE6 (left) and
quarterly data for FYR Macedonia (right), (in percentage points)
Source: National statistics offices.
In countries that produce regular LFS, additional insights can be obtained by looking at
sectoral employment patterns suggesting that job losses were concentrated in industry,
agriculture, and construction while services registered gains. Industry and agriculture in
Montenegro that lost about 7,000 and 2,000 jobs, respectively, in the last quarter of 2011, largely
due to seasonal factors. On the other hand, employment in services increased slightly due to
5,000 additional jobs created in wholesale and resale trade, perhaps reflecting an ongoing shift
towards a more service- and tourism-oriented economy in that country. In FYR Macedonia, the
sectors which suffered most in terms of employment were construction (almost 7,000 jobs),
agriculture (5,900), and wholesale and retail services (3,700) – with the declines in construction
and agriculture being mostly seasonal. By contrast, education, culture and recreation, and food
and catering added over 2,000 jobs each. Serbia‘s economy lost 57,000 jobs between April and
November: 24,000 in agriculture, 11,000 in construction, 10,000 in wholesale and retail trade,
and 9,000 in financial services sector. There was some job creation in the education and energy
sectors.
Not surprisingly, weak labor market performance generally led to lower real wages. In
2011, nominal wages increased in Serbia and Bosnia and Herzegovina, and marginally in FYR
Macedonia, and fell in Montenegro (Figure 49). Albania and Kosovo do not publish monthly
wage data. Serbia‘s monthly wage had the highest y-o-y increase in January 2012 (7.3 percent).
The jump in December 2011 was even higher, but this is the seasonal effect of payment of
bonuses (e.g. 13th
month salary). The nominal growth in Bosnia and Herzegovina was 4.5
percent, while the average in FYR Macedonia was 0.4 percent lower in January 2012 (y-o-y). In
real terms, however, wages remained flat in Serbia, and recorded a slight increase in Bosnia and
Herzegovina. The decline in real wages in Montenegro.
-2
-2
-1
-1
0
1
1
2
2
3
3
4
SRB MKD MNE BIH
GDP growth Empoyment change
-1
0
1
2
3
4
5
6
Q1 Q2 Q3
GDP growth Employment change
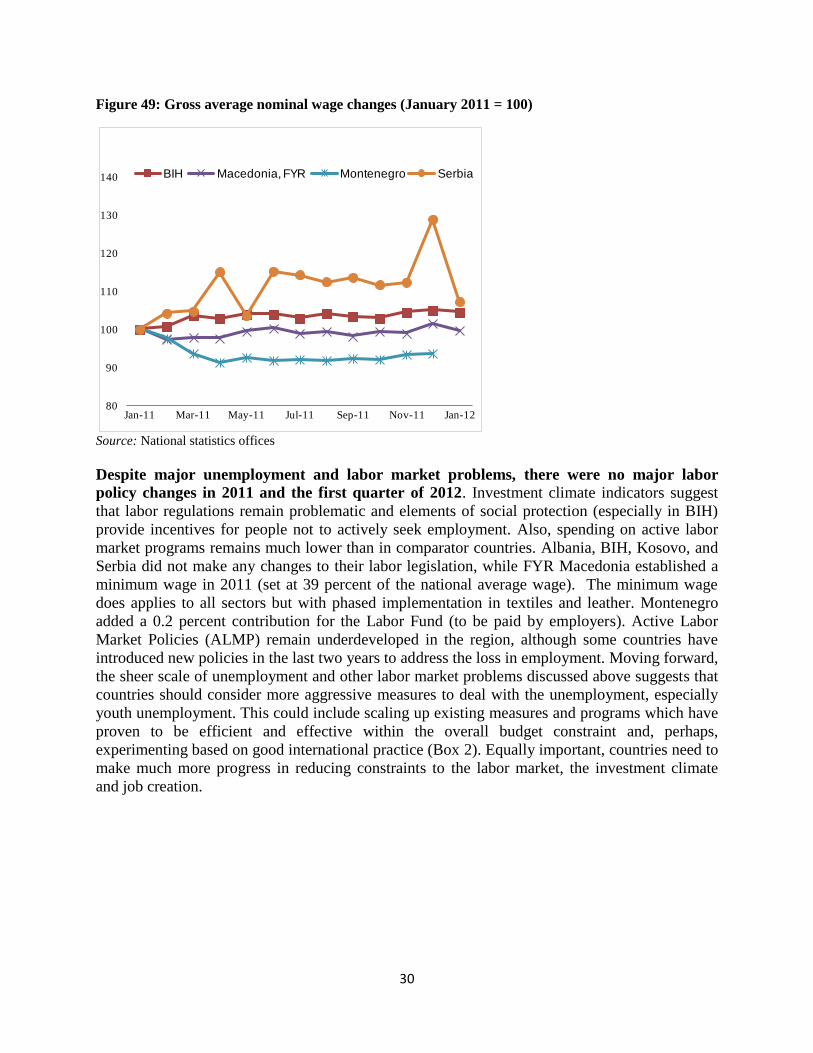
30
Figure 49: Gross average nominal wage changes (January 2011 = 100)
Source: National statistics offices
Despite major unemployment and labor market problems, there were no major labor
policy changes in 2011 and the first quarter of 2012. Investment climate indicators suggest
that labor regulations remain problematic and elements of social protection (especially in BIH)
provide incentives for people not to actively seek employment. Also, spending on active labor
market programs remains much lower than in comparator countries. Albania, BIH, Kosovo, and
Serbia did not make any changes to their labor legislation, while FYR Macedonia established a
minimum wage in 2011 (set at 39 percent of the national average wage). The minimum wage
does applies to all sectors but with phased implementation in textiles and leather. Montenegro
added a 0.2 percent contribution for the Labor Fund (to be paid by employers). Active Labor
Market Policies (ALMP) remain underdeveloped in the region, although some countries have
introduced new policies in the last two years to address the loss in employment. Moving forward,
the sheer scale of unemployment and other labor market problems discussed above suggests that
countries should consider more aggressive measures to deal with the unemployment, especially
youth unemployment. This could include scaling up existing measures and programs which have
proven to be efficient and effective within the overall budget constraint and, perhaps,
experimenting based on good international practice (Box 2). Equally important, countries need to
make much more progress in reducing constraints to the labor market, the investment climate
and job creation.
80
90
100
110
120
130
140
Jan-11 Mar-11 May-11 Jul-11 Sep-11 Nov-11 Jan-12
BIH Macedonia, FYR Montenegro Serbia

31
Box 2: The role of Active Labor Market Policies (ALMP) in increasing employment
In times of economic downturn, active labor market policies (ALMPs) have the potential to improve the
functioning of the labor market by increasing demand or enhancing labor supply––but they are not a magic
bullet. ALMPs can range from wage subsidies to start-up support, public works, re-training, job counseling, and job
search assistance. Measures such as wage subsidies or public works tends to increase labor demand, training
enhances labor supply, while job counseling improves matching of demand and supply. Modern technology (e-
matching and use of cell phones) offers new options for reducing information asymmetries and facilitating matching
of job seekers with employers.
Not all ALMPs, however, are efficient or even effective. International experience shows that these interventions
can be expensive and that they can have unintended consequences such as: (i) the substitution of subsidized for
unsubsidized workers (de facto reallocating vacancies towards workers that benefit from these programs and away
from others); (ii) the provision of subsidies to employers who would have hired even in the absence of one of these
programs; (iii) layoffs of employees hired under one of these programs once the subsidy period ends; and (iv)
attracting the most employable jobseekers who self-select in the program, as opposed to those who would find it
harder to find a job.
International evidence suggests that some ALMPs are more effective than others. A recent meta-analysis of the
effectiveness of 199 recent ALMPs drawn from 97 studies conducted between 1995 and 2007 found subsidized
public sector employment programs to be relatively ineffective, whereas job search assistance programs were found
to have generally favorable impacts especially in the short run (1 year). Classroom and on-the-job training programs
were found not to be especially favorable in the short-run, but their relative impact was found to be more positive
after two years.
SEE6 spend relatively less on ALMPs than EU countries. For instance, Serbia only spent 0.1 percent of GDP on
ALMPs in 2010, FYR Macedonia allocated 0.17 percent of GDP in 2008, and Montenegro 0.37 percent for the same
year. By contrast, OECD countries with far less severe unemployment problems spend on average 0.4 percent of
GDP in OECD countries and some spend as high as 1 percent of GDP (Austria and Belgium).
Evidence on the effectiveness of ALMPs in SEE6 remains scarce. A recent evaluation of self-employment
subsidies in Serbia suggests a positive impact on employment and wages. Additional impact evaluations of ALMPs
in SEE6 need to be undertaken. Based on these, countries should strengthen the administration of ALMPs and
remove the barriers to activation that are implicit in their safety net systems. Social assistance programs in the region
are well targeted, but some of these (e.g., special category veteran benefits in BIH) might implicitly create barriers
to labor market participation.
There is an increasing emphasis on helping people reduce their dependence on cash transfers and promote
their employability. For instance, in Serbia, Montenegro and Kosovo, people are being allowed to work and
maintain their social assistance beneficiary status. Serbia is also piloting a ‗one-stop-shop‘ for assistance with cash
transfers, social care and employment services. Serbia and Kosovo have introduced ALMPs such as public works
that target long-term beneficiaries of last-resort social assistance. FYR Macedonia has workfare requirements and
job intermediation services for social assistance claimants.

32
G. POVERTY, INEQUALITY, AND PEOPLE‘S PERCEPTIONS OF CRISIS
IMPACT IN SEE6––MORE WORRISOME TRENDS
Given that jobs everywhere are a key avenue out of poverty, it is unsurprising that the
poverty profile of SEE6 mirrors the worrisome picture and trends in labor markets. In
SEE6, an estimated 1.5 million people live in extreme poverty and almost 6 million live in
poverty based on the ECAPOV methodology.12
SEE6 have higher poverty and unemployment
rates than other countries in Eastern Europe and Central Asia: internationally comparable
poverty rates in Kosovo, Albania, Macedonia are among the seven highest in Europe. Also,
measured poverty rates in Bosnia and Herzegovina are likely significantly underestimated.13
SEE6 countries are heterogeneous in terms of poverty incidence and trends. Kosovo and
Albania have the highest incidences and Serbia and Montenegro the lowest (Table 6). Similar
patterns apply to extreme poverty. In terms of trend for the region as a whole, the incidence of
poverty was falling rapidly prior to 2008, fuelled by robust economic growth and a rise in
incomes. This overall decrease in poverty incidence in Montenegro and in Serbia affected all
poor groups (i.e. those living in extreme poverty with less than PPP US$2.5/day, and those living
in moderate poverty with consumption per capita between PPP US$2.5 and US$5/day). By
contrast, in Albania and FYR Macedonia, poverty reduction was accompanied by a greater
concentration of poor people living in moderate poverty.
The global financial crisis has arrested or reversed this progress: post-crisis jobless growth
has been accompanied by a rise in poverty. In the three countries for which 2009 data are
available (FYR Macedonia, Montenegro and Serbia) the extreme poverty rates increased
between 2008 and 2009 consistent with the negative GDP growth in 2009. While all six
countries registered positive real GDP growth in 2010, available data for Montenegro, FYR
Macedonia and Serbia, for example, suggest that in spite of the economic rebound, poverty
incidence continued to grow. This reflects continuing problems in the labor markets and the
increasing strains on households and resulting coping strategies (e.g., by dissaving, selling
assets).
12
Out of a total population estimated at almost 19 million, based on existing surveys. ECAPOV is a database of
household surveys for all the countries in Eastern Europe and Central Asia. Data from this database are standardized
and poverty estimates are produced according to a consistent methodology which allows for inter-country
comparability. Estimates based on national methodologies offer similar trends. 13
In Bosnia and Herzegovina there are doubts about the quality of the 2005 PPP data. As noted in World Bank
(2009) Protecting the Poor during the Global Crisis: 2009 Bosnia and Herzegovina Poverty Update, Bosnia and
Herzegovina PPP price levels are much lower than their neighbors so that if we use the average price level for the
SEE countries, Bosnia and Herzegovina PPP based poverty estimates will be substantially higher than currently
estimated, and this sensitivity to the price level is the basis for a caution in interpreting these PPP results‖ (page 12).

33
Table 6: Internationally comparable estimates of the incidence of poverty and extreme poverty in
the SEE6 2005-2010, (%)
2005 2006 2007 2008 2009 2010
Extreme poverty (US$ 2.5 / day)
Albania 18.1
13.3
Bosnia &
Herzegovina
1.5
Kosovo 45.9 46.1
36.2
Macedonia, FYR 7.4 8.6
9.0 10.9 14.7
Montenegro 3.0 2.4 1.4 0.8 2.0
Serbia 5.0 2.3 1.8 1.1 1.8 2.4
Poverty (US$ 5 / day)
Albania 64.3
62.1
Bosnia &
Herzegovina
11.0
Kosovo 85.7 87.5
81.7
Macedonia, FYR 32.7 32.1
37.1 36.8 42.5
Montenegro 25.4 27.3 16.3 14.0 13.7
Serbia 28.6 20.1 17.9 16.1 16.5 20.7 Source: ECAPOV database. Extreme poverty defined as living on less than 2.5 USD a day, Poverty defined as living
on less than 5 USD a day. Note: Poverty rate for Bosnia and Herzegovina is likely significantly underestimated
because of a problem with PPP estimate for that country.
Poverty rates in SEE6 do not compare well with the rest of the Europe and Central Asia
region (Figure 50). In the SEE6 region as a whole, the incidence of extreme poverty is similar to
the ECAPOV estimate for Eastern Europe and Central Asia. In 200914
roughly 1.5 million people
or 7.8 percent of the population in the SEE6 lived below the extreme poverty threshold.15
The
SEE6 compare favorably to the Low Income Countries in the Community of Independent States
(LIC-CIS)16
, where in 2009 a quarter of the population still lived below the extreme threshold.
However, poverty incidence in the SEE6 remains considerably higher than in MIC-CIS and
EU10 countries, where the extreme poverty rate in 2009 was below 2 percent.
Similar patterns apply to the distribution of moderate poverty across SEE6 countries. A
further 4.4 million people, or 23 percent of the population in the SEE6 lived just above the
extreme poverty threshold (on PPP US$ 2.5-5/day) in 2009, close to the overall Eastern Europe
and Central Asia region estimate, but higher than in EU10 or MIC-CIS countries. This again
compares favorably with the much poorer LIC-CIS region, where more than 40 percent of the
population lived on US$2.5-5/day. While the lack of recent data makes it difficult to estimate
the precise poverty impact of the recent financial crisis for the SEE6 as a whole, the available
data from FYR Macedonia, Montenegro, and Serbia suggest the rise in poverty in SEE6 in 2010
and 2011 might have reinforced the divergence in poverty rates with the EU10 countries.
14
This is the most recent year for which actual poverty data are available for the majority of the countries in ECA. 15
Regional ECAPOV estimates for a given year are based on actual country data when these are available.
Projections from earlier years are used for years for which survey data are not available. 16
LIC-CIS countries are Armenia, Georgia, Azerbaijan, Tajikistan, Kyrgyz and Moldova.
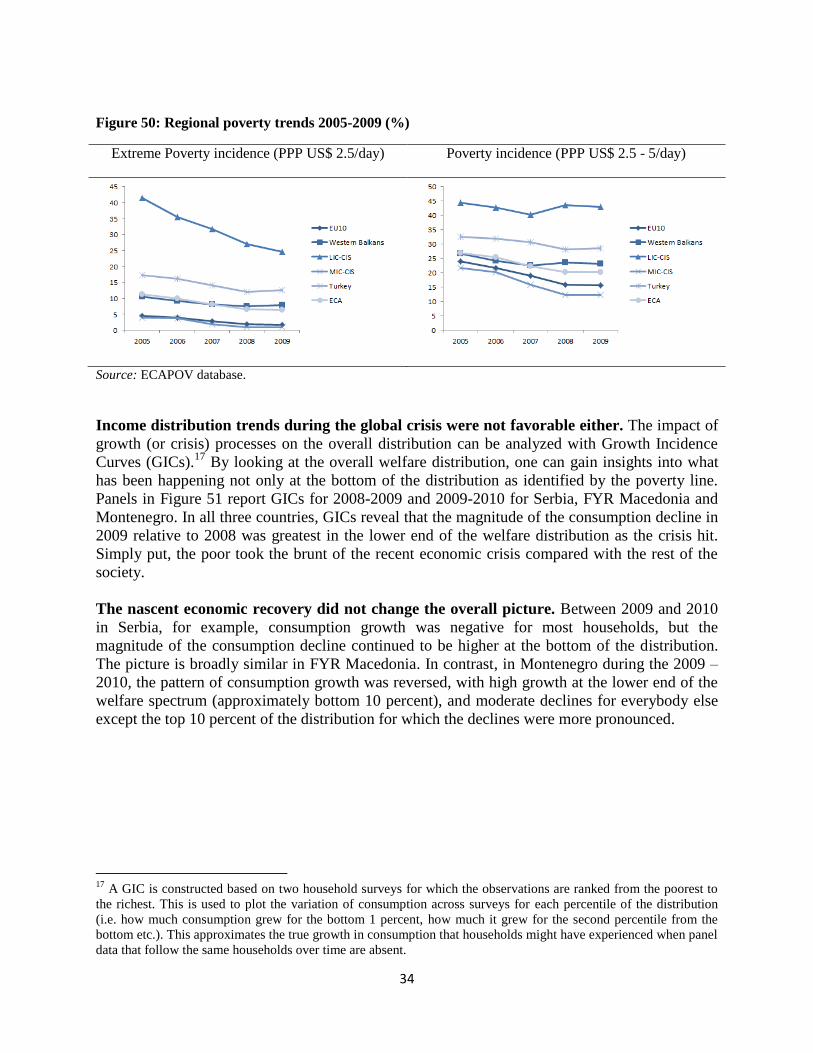
34
Figure 50: Regional poverty trends 2005-2009 (%)
Extreme Poverty incidence (PPP US$ 2.5/day) Poverty incidence (PPP US$ 2.5 - 5/day)
Source: ECAPOV database.
Income distribution trends during the global crisis were not favorable either. The impact of
growth (or crisis) processes on the overall distribution can be analyzed with Growth Incidence
Curves (GICs).17
By looking at the overall welfare distribution, one can gain insights into what
has been happening not only at the bottom of the distribution as identified by the poverty line.
Panels in Figure 51 report GICs for 2008-2009 and 2009-2010 for Serbia, FYR Macedonia and
Montenegro. In all three countries, GICs reveal that the magnitude of the consumption decline in
2009 relative to 2008 was greatest in the lower end of the welfare distribution as the crisis hit.
Simply put, the poor took the brunt of the recent economic crisis compared with the rest of the
society.
The nascent economic recovery did not change the overall picture. Between 2009 and 2010
in Serbia, for example, consumption growth was negative for most households, but the
magnitude of the consumption decline continued to be higher at the bottom of the distribution.
The picture is broadly similar in FYR Macedonia. In contrast, in Montenegro during the 2009 –
2010, the pattern of consumption growth was reversed, with high growth at the lower end of the
welfare spectrum (approximately bottom 10 percent), and moderate declines for everybody else
except the top 10 percent of the distribution for which the declines were more pronounced.
17
A GIC is constructed based on two household surveys for which the observations are ranked from the poorest to
the richest. This is used to plot the variation of consumption across surveys for each percentile of the distribution
(i.e. how much consumption grew for the bottom 1 percent, how much it grew for the second percentile from the
bottom etc.). This approximates the true growth in consumption that households might have experienced when panel
data that follow the same households over time are absent.

35
Figure 51: Growth incidence curves, Serbia, Montenegro, and FYR Macedonia
Source: World Bank staff.
This ―objective‖ picture of poverty and inequality based on distribution data can be
supplemented by the information about perceptions of the crisis impact in the region and
coping strategies (Figure 52). This is important because social and household wellbeing
inherently depend on subjective and societal evaluations of the broader economic and social
environment, and these evaluations can feed back into the overall economic and social climate
and economic decisions and prospects for long-term growth. Such data were collected in the
-14
-10
-6-2
26
An
nu
al g
row
th r
ate
%
1 10 20 30 40 50 60 70 80 90 100Expenditure percentiles
Growth incidence 95% confidence bounds
Growth in mean Growth at median
Mean growth rate
Serbia 2008-2009
-14
-10
-6-2
26
An
nu
al g
row
th r
ate
%
1 10 20 30 40 50 60 70 80 90 100Expenditure percentiles
Growth incidence 95% confidence bounds
Growth in mean Growth at median
Mean growth rate
Serbia 2009 - 2010
-40
-20
02
04
0
An
nu
al g
row
th r
ate
%
1 10 20 30 40 50 60 70 80 90 100Expenditure percentiles
Growth incidence 95% confidence bounds
Growth in mean Growth at median
Mean growth rate
Montenegro 2008-2009
-40
-20
02
04
0
An
nu
al g
row
th r
ate
%
1 10 20 30 40 50 60 70 80 90 100Expenditure percentiles
Growth incidence 95% confidence bounds
Growth in mean Growth at median
Mean growth rate
Montenegro 2009-2010
-60
-40
-20
02
0
An
nu
al g
row
th r
ate
%
1 10 20 30 40 50 60 70 80 90 100Expenditure percentiles
Growth incidence 95% confidence bounds
Growth in mean Growth at median
Mean growth rate
FYR Macedonia 2008-2009
-60
-40
-20
02
0
An
nu
al g
row
th r
ate
%
1 10 20 30 40 50 60 70 80 90 100Expenditure percentiles
Growth incidence 95% confidence bounds
Growth in mean Growth at median
Mean growth rate
FYR Macedonia 2009-2010
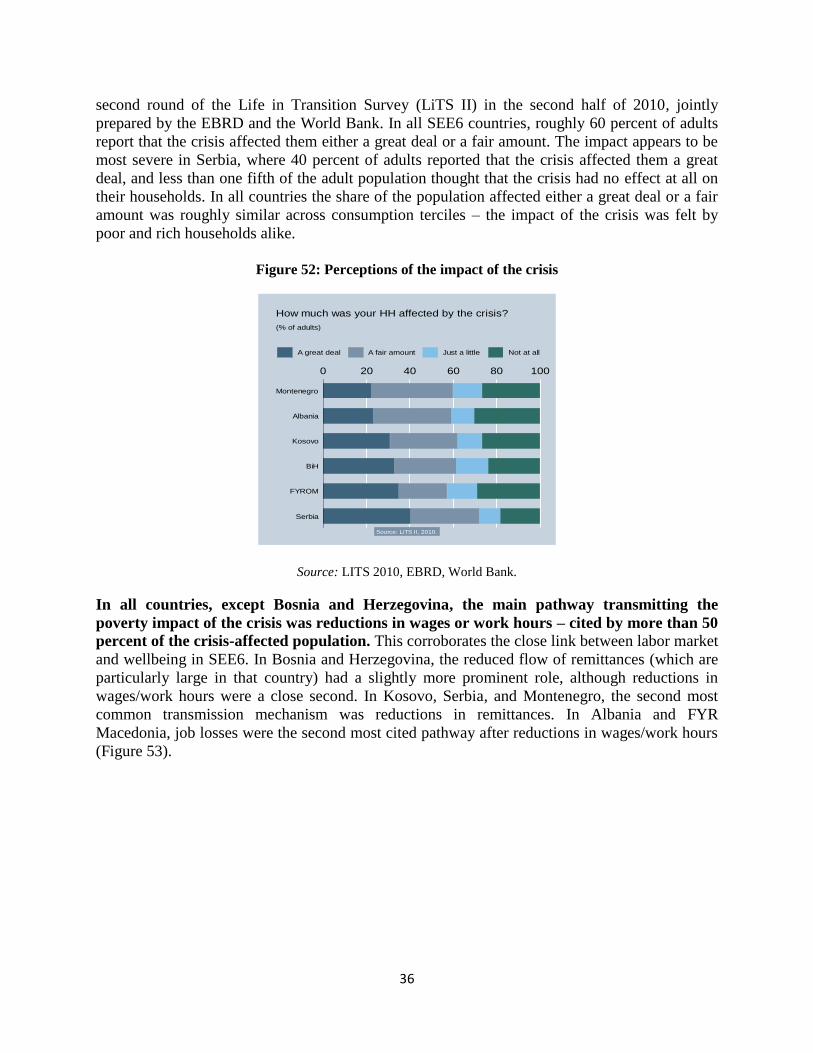
36
second round of the Life in Transition Survey (LiTS II) in the second half of 2010, jointly
prepared by the EBRD and the World Bank. In all SEE6 countries, roughly 60 percent of adults
report that the crisis affected them either a great deal or a fair amount. The impact appears to be
most severe in Serbia, where 40 percent of adults reported that the crisis affected them a great
deal, and less than one fifth of the adult population thought that the crisis had no effect at all on
their households. In all countries the share of the population affected either a great deal or a fair
amount was roughly similar across consumption terciles – the impact of the crisis was felt by
poor and rich households alike.
Figure 52: Perceptions of the impact of the crisis
Source: LITS 2010, EBRD, World Bank.
In all countries, except Bosnia and Herzegovina, the main pathway transmitting the
poverty impact of the crisis was reductions in wages or work hours – cited by more than 50
percent of the crisis-affected population. This corroborates the close link between labor market
and wellbeing in SEE6. In Bosnia and Herzegovina, the reduced flow of remittances (which are
particularly large in that country) had a slightly more prominent role, although reductions in
wages/work hours were a close second. In Kosovo, Serbia, and Montenegro, the second most
common transmission mechanism was reductions in remittances. In Albania and FYR
Macedonia, job losses were the second most cited pathway after reductions in wages/work hours
(Figure 53).
0 20 40 60 80 100
Serbia
FYROM
BiH
Kosovo
Albania
Montenegro
Source: LiTS II, 2010.
(% of adults)
How much was your HH affected by the crisis?
A great deal A fair amount Just a little Not at all

37
Figure 53: Main channels of impact Figure 54: Main coping mechanisms
Source: LITS 2010, EBRD, World Bank.
To cope with the impact of the crisis, households cut, first and foremost, the consumption
of luxury goods and some elective services (Figure 54). This coping strategy is reported by
almost half of the population in Bosnia and Herzegovina, and almost 70 percent of the
population in FYR Macedonia. However, the crisis affected more than just the consumption of
luxuries – a large share of the population across all countries (and in particular in Serbia and
FYR Macedonia) reported reducing their consumption of staple foods. Roughly a fifth of the
population in Albania and FYR Macedonia report having had to stop buying medications or
delay visits to the doctor; in Montenegro, Serbia and FYR Macedonia roughly 40 percent of the
population report that they had to delay utility payments or cut TV, phone or internet service.
Moreover, the incidence of these more extreme coping strategies such as reducing the
consumption of staples, postponing medical treatment or delaying payment of utilities is higher
among those in the bottom consumption tercile.
0
10
20
30
40
50
60
70
BiH Kosovo Albania Serbia FYROM Montenegro
Source: LiTS II, 2010.
(% of crisis-affected population )
Main crisis impact pathways
Reduction in wages or hours
Job loss or closed business
Reduced flow of remittances
Additional work undertaken
0
10
20
30
40
50
60
70
BiH Montenegro Albania Serbia Kosovo FYROM
Source: LiTS II, 2010.
(% of adult population)
Main crisis coping mechanisms
Reduced consumption of luxury goods
Reduced consumption of staple foods
Stopped buying medications / postponed doctor visits
Reduced vacations
Reduced consumption of alcohol / cigarettes
Delayed utilities payments / cut TV, phone, or internet
38
The sobering findings of the poverty and inequality indicators and LITS survey should give
a pause to policymakers in SEE6 countries: what is to be done?18 Perceptions of large shares
of the population having to cope with the crisis by cutting down on staple food and health
spending point to the difficulties of SEE6 countries putting in place effective crisis response
systems. Safety nets should play a key role in such responses but the recent severe economic
crisis challenged the government‘s ability to protect the poor and vulnerable.
A recent evaluation of country safety net systems in SEE6 concluded that some of them
reacted more flexibly than others. During the crisis and in its aftermath, the demand for
unemployment benefits and social assistance increased while at the same time government
revenues decreased, resulting in pressures to reduce spending on social protection, health, and
education. The main finding of this assessment was that maintaining effective protection within a
reduced post-crisis fiscal envelope requires major reforms:
(i) to curtail spending on rights-based or categorical (non-means-tested) benefits;
(ii) to increase uptake and extend the coverage of means-tested social assistance;
(iii) to reduce work disincentives that are built into the design of last-resort social
assistance, and to increase their flexibility and responsiveness to crises and shocks.
More specifically:
Public spending on social assistance as a share of GDP in the SEE6 is comparable to
the rest of Eastern Europe and Central Asia (1.8 percent of GDP compared to an
average spending of 1.7 percent of GDP in all countries in the region). Bosnia and
Herzegovina is a notable exception: with 3.33 percent of GDP going to social assistance
in 2008-09 and even more - 3.9 percent of GDP - in 2010, Bosnia and Herzegovina is one
of the biggest spenders among European and Central Asian countries. The expenditure on
war veteran benefits appears to drive this result – if it were brought down to the average
regional level of 0.4-0.5 percent of GDP, overall spending on social assistance in Bosnia
and Herzegovina would be equal to the SEE6 average.
Spending on social assistance is inequitable, with a growing share of allocations to
categorical programs. Throughout the 2000s, categorical benefits consistently absorbed
a higher share of social assistance spending than means-tested benefits. Only FYR
Macedonia spends more on means-tested than on categorical programs though reforms in
2008 increased the share of non-means tested programs.
Spending priorities differ across countries. Spending on the last-resort social
assistance is relatively high in Montenegro (close to 0.5 percent of GDP) and also in FYR
Macedonia, and the highest in Kosovo (over 0.7 percent of GDP), where it reflects the
18
Gotcheva, Boryana and Ramya Sundaram (2011) ―Social Safety Nets in the Western Balkans: Design,
Implementation and Performance‖ The World Bank Washington DC, forthcoming in Ruggeri Laderchi and
Savastano ―Poverty and Exclusion in the Western Balkans: new directions in poverty and analysis‖, Springer, New
York.

39
high incidence of poverty and the concentration of spending on fewer benefit programs.
Spending on the last-resort social assistance is very low in Serbia and Bosnia and
Herzegovina, resulting in small-scale programs with narrow coverage and big exclusion
errors. At the same time, SEE6 spend more on disability allowances than other European
and Central Asia countries, with Albania having the largest spending (0.9 percent of
GDP) in the region, and Montenegro having the highest growth rate in spending on
disability benefits in recent years.
Overall social assistance has solid targeting accuracy, but low coverage (the highest
coverage is 40 percent of the bottom quintile for the safety net in Kosovo). Coverage is
extremely low even in countries which have multiple safety net programs designed to
protect against, and mitigate multiple risks related not just to poverty, but also for
disability, the temporary loss of job to take care after the birth of a young child or an
increase in the number of dependent children in the family. The generosity of benefits
varies significantly among the SEE6 countries. While when measured as a fraction of the
post-transfer consumption of beneficiary households generosity appears relatively high
compared to social assistance schemes delivering similar benefits in ECA, social
assistance benefits in the SEE6 are not very generous compared with minimum wages –
ranging between 7 and 20 percent of the minimum wage (with the exception of
Montenegro where they amounted to 75 percent).
H. OUTLOOK FOR 2012-13
SEE6 are entering a period of slower growth and more difficult adjustment. Average
growth in SEE6 in 2012 is expected to be 1.1 percent compared to 2.2 percent in 2011. Given the
expectations of weak growth in 2012 for Bosnia and Herzegovina, Montenegro and Serbia, in
particular, these three countries will not attain their pre-crisis real GDP growth until 2013. The
economic prospects for Eurozone on which SEE6 is particularly reliant for export demand,
remittances and FDI are better than they were six months ago, but there remain significant risks.
Notably, the SEE6 recovery will continue to lag that of other transition and developing countries
with less Europe-centered global linkages. Fiscal adjustment will need to continue under more
difficult circumstances as will efforts to keep public debt levels from edging further into the
unsustainable range. Credit growth is likely to remain weak, and the financial sector,
increasingly dependent on local deposits as deleveraging of European banks continues, will have
at the same time to deal with elevated NPL levels.
The first quarter 2012 was particularly difficult in SEE6. Contrary to the global recovery of
growth in industrial production, the region‘s industrial production was hit both by slowing
European demand for imports as well as harsh winter conditions that paralyzed the region during
February 2012. Furthermore, the increase in global oil prices will put a further break on
economic activity as will European banking-sector deleveraging which has intensified since the
end of 2011.
As economic prospects for 2012 begin to deteriorate, a strong rebound in employment
seems unlikely in the short-term. With GDP growth projected at 1.1 percent in 2012, the
prospects for a noticeable increase in employment are low. High-frequency industrial production

40
and retail sales data point in the same direction (Figure 55-56). Slow credit growth, lack of
significant fiscal space for employment-generating investments, and weak export prospects point
to a further worsening in labor market performance. Substantial FDI, however, could lead to a
turning point in local labor markets, but given the weak and uncertain outlook for Europe, the
probability of such a scenario is low.
Taken together, these trends imply that SEE6 countries will remain on a dual growth track
during 2012. Countries that have high debt levels and relied the most on external demand for
recovery (Bosnia and Herzegovina, Montenegro, Serbia and to some extent Albania) will face
sluggish growth this year while FYR Macedonia and Kosovo will see better, though still lower
than in 2011, growth rates (Table 7). This bodes well for further narrowing of external current
account balances in 2012-13, reflecting partly the ongoing fiscal consolidation.
Table 7: Growth Outlook for SEE6 Countries
Real GDP growth (%)
2012 2013
ALB 1.6 2.5
BIH 0.5 1.5 KOS 4.0 4.1
MK 2.0 3.2 MNE 0.5 1.5
SRB 0.5 3.0
SEE6 1.1 2.6
Prospects for SEE6 export growth in 2012 remain positive, although at a moderate level of
about 8 percent assuming the Eurozone crisis does not significantly deepen further. This is
despite the latest moderation and even decline y-o-y in the first months of the year due mainly to
Figure 55: Industrial Production (3m/3m, percent
change, not SA)
Figure 56: Retail Trade (Jan 2010 = 100, not SA)
Source: National Statistics Offices and WB staff
caclulations.
Source: National Statistics Offices and WB staff
caclulations.
-40
-30
-20
-10
0
10
20
30
40
1 3 5 7 9 11 1 3 5 7 9 11 1 3 5 7 9 11 1
2009 2010 2011 2012
BIH MKD MNE SRB SEE4
60
80
100
120
140
160
180
200
220
240
1 2 3 4 5 6 7 8 9 10 11 12 1 2 3 4 5 6 7 8 9 1011 12 1 2 3
2010 2011 2012
ALB SRB MKD MNE SEE4
41
the harsh winter and temporary impact of euro crisis. Import growth, however, is expected to
moderate further to about 5 percent in 2012, implying a weaker demand due to lower economic
growth and a further narrowing of external current account deficits.
Despite the worsening FDI environment because of the Eurozone crisis, SEE6 are
benefitting from a number of new investments recently announced (e.g., FYR Macedonia,
Serbia). Longer term prospects for FDI continue to be positive. However, differences among
countries are evident. Serbia experienced a significant outflow in January 2012 related to the
purchase of minority stake in state telecom from Greek OTE, but the expectation for 2012 is that
FDI inflows in Greenfield investments will be similar to 2011. Kosovo is expecting FDI to be
boosted by the sale of the telecom company (PTK) in early 2013. One example of how FDIs can
be used to expand local export base is FYR Macedonia: with the entrance of two large car-parts
in 2007, automotive components have since become important exports in that country.
All the countries except Kosovo and Albania have relatively high levels of external debt
with Montenegro and, to a lesser extent, Serbia being into the high risk range. While some
of this debt is to official lenders, it represents a rollover risk should market access tighten further.
However, most of this debt has a maturity which goes beyond 2012 and in many cases 2015 and
onwards. In the short run, Montenegro‘s government might face the risk of having to pay under
past guarantees it provided on Euro 90 million of loans to the Aluminum Company which are
coming due.
Given the external and subregional environment, future credit growth is likely to be
moderate at best, trailing the rise in local deposits as the new dominant source of funding,
and may be even worse if the crisis in the Eurozone deepens. A protracted period of more
difficult access to credit may result from increased aversion on the part of parent banks to
reliance on wholesale funding and constraints on intra-group transfers between parent banks and
their ECA subsidiaries. Slower growth of credit leaves the problem of long-term finance for
private sector growth.
Some smaller banks are facing significant challenges and this could put pressure on
already tight fiscal envelopes. For example, in Serbia two small domestic banks have already
requested recapitalization by the state and another domestic bank recorded large losses in 2011
wiping out its capital and is now under caretaker management with possible state
recapitalization.
Without a proactive and cooperative approach, NPLs are likely to remain elevated,
creating a further drag on economic recovery. The NPL rates in most countries of the region
are high. This affects the quality of the banking sector‘s assets, business results, and lending
costs. The subdued economic outlook for the region means that delinquent borrowers will
continue to struggle and that collateral values will remain at depressed levels for some time.
Speedy NPL resolution holds the promise of removing an important drag on economic growth in
the SEE6 countries, but this will require a proactive and cooperative approach19
.
19
Source: European Banking Coordination ―Vienna‖ Initiative: Working Group on NPLs in Central, Eastern and
Southeastern Europe.
42
Public finances will continue to be under pressure across SEE6 in the rest of 2012 and in
2013. With the exception of Montenegro, which plans to bring the deficit down to 2.5 percent of
GDP in 2012 and further in medium term, the fiscal adjustment currently envisaged in other
SEE6 countries is modest. Serbia has planned an overall adjustment of 0.6 percentage points of
GDP over two years (although this remains to be adopted by the new government) while Albania
is targeting deficits of 3 percent of GDP in 2012. FYR Macedonia plans to keep the deficit
unchanged at 2.5 percent of GDP. Kosovo, in line with its sound fiscal position, is increasing the
deficit to accommodate higher outlays for capital expenditures. The deficit is projected to
increase in Bosnia and Herzegovina in 2012, followed by an adjustment needed to create fiscal
space for the upcoming repayments. Also, the assumptions underpinning the fiscal policy
dialogue in most SEE6 countries include a modest recession in the Eurozone in early 2012 and
an accelerating recovery afterwards. In this environment, a more conservative approach with
more fully developed contingency measures may be warranted given the economic risks
described earlier in this report as these may have a further negative impact on revenues and
available financing.
I. POLICY CHALLENGES
The central short-term policy challenge for SEE6 countries is fiscal and debt. This cannot be
overemphasized. Under the baseline scenario, public debt will continue to increase in 2012, with
only a minor improvement envisaged for 2013, which will keep SEE6 vulnerable. Albania,
Montenegro and Serbia have in recent years had their public debt on an unsustainable trajectory
and will, therefore, need to see much stronger corrective actions. In addition, both Albania and
Serbia will, unless major corrective measures are taken, breach their debt ceilings of 60 percent
of GDP (Albania) and 45 percent of GDP respectively, set in their national legislation. Facing
significant fiscal pressures and high level of debt, and on current policies, only Montenegro is
expected to see a reduction in the debt level during this period; however, this critically depends
on the implementation of an ambitious planned fiscal adjustment.
With debt levels increasing and risks remaining significant, authorities in the SEE6
countries may need to reconsider the levels of public debt that could be considered
sustainable. The 60 percent of GDP Maastricht criteria typically considered as being sustainable
is based on considerably different assumptions regarding the economic environment compared to
the ones facing the SEE6 countries. With external environment risks, market access issues and
debt structures facing SEE6 countries today, a prudent level would probably be considerably
lower20
and the authorities in these countries should devise credible medium- to long-term fiscal
strategies that will see stabilization and reduction of public debt levels. One reason that the SEE6
situation is different is that these countries are increasingly moving away from concessional
borrowing toward market-based financing which is increasing the cost of debt and reducing
maturity. Another is that fiscal consolidations ahead of many of these countries are likely to
20
A new consensus is emerging that prudent levels of debt for advanced countries should not exceed 60 percent of
GDP and in developing countries, including SEE6––40 percent of GDP. While the country specific level of debt that
is sustainable depends on a range of variables, these are broad indicators that could serve as rough benchmarks (See,
for example, recent IMF working papers by Baldacci, Gupta and Mulas-Grandos:―Getting Debt Under Control,‖
Finance & Development, December 2010; and ―Restoring Debt Sustainability After Crisis: Implications for the
Fiscal Mix,‖ IMF WP/10/232).
43
further reduce their fiscal envelopes. As a result, while the current debt servicing costs are
relatively manageable at this time21
, these are expected to increase going further. In addition,
while public debt as percentage of GDP is lower than in comparator EU10 countries, an
alternative measure––public debt as percentage of annual government revenues––is above the
EU10 average (table 8). Also, with greater reliance on relatively shallow domestic markets,
domestic debt risks are also increasing. In addition, a significant part of public debt in the four
SEE6 countries that have their own currencies (Albania, Bosnia and Herzegovina, FYR
Macedonia, and Serbia) is denominated in, or indexed to, a foreign currency, giving rise to
currency as well as term mismatch risks. While exchange rate risks are mitigated somewhat by
the relatively strong reserve levels and generally solvent external positions, large fluctuations of
the exchange rate can have a sizable impact on fiscal solvency.
The process of adjustment would need to be advanced in some SEE6 countries which
currently have higher public debt levels (Albania, Montenegro, and Serbia) while
improving the composition of public expenditures toward critical infrastructure
investments. With rigid expenditure structures in a number of SEE6 countries, such an
adjustment could be challenging and may require difficult policy decisions. As a first step,
revenue targets and sources of financing should be realistically assessed and revenue and
expenditure measures designed to offset the impact of the slower growth environment. Going
further, the medium-term fiscal strategies, including on contingent liabilities need to be revisited
to ensure that public debt levels stabilize and are put on declining trends. Otherwise, SEE6 will
be facing growing risks, including roll-over and market access risks, in a risk-averse global
environment.
Adjustment alone is not enough: given shallow domestic capital markets, most of SEE6
would need to borrow externally in order to finance their deficits and debt repayments
during this difficult period. This is significantly increasing the roll-over risks facing the SEE6
countries. With the exception of Bosnia and Herzegovina which saw a one notch downgrade of
its rating by Moody‘s to B3, SEE6 countries have so far managed to avoid credit rating
downgrades, but still are facing spreads in excess of 500 bps. Getting better borrowing terms
would require implementation of credible fiscal programs to strengthen the fiscal and economic
fundamentals, including reduction of fiscal deficits and debt levels, restructuring of expenditures,
and promoting reforms to improve competitiveness. At the same time, stronger development of
the domestic market is needed to restructure the significant stock of short-term debt into longer
maturities and mitigate risks from growing reliance on the domestic market. In this environment,
IFIs can help provide financing on more favorable terms until the economic recovery gets
underway and conditions of market access improve.
21
Interest expenditures average around 1 percent of GDP in the SEE6 countries with the exception of Albania were
interest expenditures in 2011 were 3.1 percent of GDP.

44
Table 8: Selected public debt indicators, 2011
ALB BIH KOS MK MNE SRB
Public debt, % of government revenues 227.9 84.8 18.7 108.7 151.5 116.2
Financing requirements, % of GDP 24.7 7.0 2.3 8.6 10.6 14.0
Interest payments, % of GDP 3.1 0.7 0.0 0.8 1.5 1.4
Source: Bank staff estimates based on data from Ministries of Finance and International Monetary Fund
Note: Short-term debt presented on gross bases in calculating the financing requirements.
Most SEE6 countries have adopted some sort of formal limits on the level of public debt
but with the rise in arrears, questions arise about the effectiveness of these fiscal rules and
public financial management frameworks. Albania, Kosovo and Serbia have formally capped
government debt through fiscal legislation. Serbia has also established a Fiscal Council, a policy
watchdog that is closely monitoring and assessing fiscal developments and policies. FYR
Macedonia and Montenegro have imposed fiscal limits using strategy-level documents, and
Montenegro is considering introducing legislation to cap the debt level as well. FYR Macedonia
is planning a revision of the government debt to GDP target from 30 to 35 percent of GDP.
Notwithstanding these fiscal institutions, SEE6 countries must continue strengthening their
public financial management (PFM) frameworks, closely monitor and aggressively work on
reducing the stock and flows of budgetary and tax arrears. They would also be advised to closely
monitor private sector arrears and work closely with the monetary authorities to strengthen
financial discipline.
In the longer term, and assuming that there is not a catastrophic collapse in the short term
SEE6 have an opportunity to achieve dynamic ―Golden Growth‖ and this will be linked to
the recovery of Europe itself. Even so, longer term SEE6 growth rates are unlikely to return to
and persist at levels that were experienced in the immediate pre-crisis period. But the recovery
will be a brighter and more imminent prospect, and progress on poverty reduction renewed, if the
Greek crisis is resolved in an orderly manner, if a protracted hiatus in the growth-sustaining
investment is avoided in the coming quarters, if the authorities stick to prudent fiscal and public
debt policies, and if the long legacy of structural reform needs examined in the last SEE RER is
addressed vigorously. Such policies––focused on the investment climate, the labor market,
public sector reforms, and institutions––will be sorely needed to confront some of the persistent
challenges of the region. These include stubbornly high unemployment rates, especially among
youth, a tendency towards emigration of the most highly educated and an aging population.
Looking to the European future of SEE6––beyond the difficult short term––there is reason
for optimism. In the following note on ―Golden Growth‖ and prospects for its achievement in
SEE6 countries, the report present the reasons for such optimism and suggest policies needed to
ensure that this potential is realized.

45
2. GOLDEN GROWTH IN SOUTH EAST EUROPE: KEY
IMPLICATIONS FOR POLICY REFORMS22
A. INTRODUCTION
This note adapts the recent Golden Growth Report (GGR), produced by the World Bank‘s
Europe and Central Asia Chief Economist‘s Office, to the case of SEE6 countries. It
discusses key economic developments in Europe from a long-term perspective, including the
progress made and the challenges faced by the SEE6 region, in respect of the key thematic areas
covered by the GGR--income convergence, trade and finance, enterprise and innovation, and
labor and government. It also draws implications and lessons for SEE6 countries in terms of
long-term development policy reforms going forward.
The main messages are as follows:
Greater trade and financial integration have served as major income ―convergence
machine‖––a reduction in the per capita income gap with developed, ―core‘ EU
countries––for earlier entrants into the European Union (EU). In principle, the same
―convergence train‖ awaits new EU candidate countries among SEE6. But these gains
are not automatic, they will only materialize with appropriate policies and reforms
(section II below).
SEE6 countries have experienced gains in growth in productivity since the early
1990s, and the business environment has improved across the board, but the role of
innovation and research and development in the enterprise sector remains very
limited (section III).
Despite gains in output and productivity since the early 1990s, SEE6 job growth has
lagged, with most of the countries in the region today facing high unemployment
levels and relatively low participation rates, which points to the need for reforming
labor and government (section IV). On the labor side, labor market reforms (e.g.
reduce rigidities in hiring and firing, dismissal costs.) and active labor market policies
that promote, among other things, job matching and training remain critical to
addressing the long term (youth) unemployment challenge. On the government side,
while there is much similarity between SEE6 and Western Europe (e.g. dominance of
social protection spending), the size of government is comparatively smaller in SEE6.
However, SEE6 faces the prospect of one of the worst demographic transitions in the
next several decades, with aging population, shrinking labor force, and outward
22
This note is based on the recent ―Golden Growth‖ report of the World Bank (Gill, Raiser, Richter and Zalduendo,
2012), which analyzes the European economic model along six thematic areas: trade and finance, enterprise and
innovation, and labor and government. The note tailors the key messages and policy implications to the South East
Europe Six (SEE6) countries: Albania, Bosnia and Herzegovina, Kosovo, FYR Macedonia, Montenegro, and Serbia.
For other country groupings used in this note, see Annex 1.

46
migration –all imposing heavy strains on social protection and pension systems,
health care costs, and public finances. Reforming social protection and health care
today will be essential for the countries in the region to be better prepared for the
demographic transition and aging population of tomorrow.
Finally, SEE6 countries that wish to tap into the potential of ―Golden Growth‖ face a
common policy agenda of keeping the convergence machine running through
leveraging greater trade and financial flows on the one hand and reforming labor
and government on the other. This agenda is summarized in the concluding section
(section V).
B. TRADE AND FINANCE: PRIMARY DRIVERS OF
‗CONVERGENCE‘ IN SEE6
SEE6 countries are becoming more integrated with Western Europe and the world. FYR
Macedonia and Montenegro became official candidates to the European Union (EU) in 2005 and
2010, respectively; Serbia was granted candidate status in February 2012; and Albania, and
Bosnia and Herzegovina are potential candidates. This closer integration with Western Europe
has brought economic benefits, including greater trade and financial linkages and income
convergence. Importantly, capital in Europe flows ―downhill‖––from developed to developing
countries––in contrast to much of the rest of the world,23
contributing to growth in Europe‘s less-
affluent economies. There is a strong link between the EU candidate countries‘ foreign savings
and economic growth, though that link appears to be stronger for EU12 than for SEE6. The
reason is clear: actual and even prospective EU membership serves as an anchor for international
investors (Stojkov and Zalduendo, 2011), bestowing specific benefits in the form of greater trade
and financial flows, and fueling income growth and convergence (towards the EU level).
Importantly, this convergence machine is driven mostly by trade and finance.
SEE6 countries substantially increased their external trade and trade sophistication. Not
only has the share of exports from SEE6 going to EU15 grown, but also the sophistication of
exports with EU15 has increased between 2000 and 2008, the latest year for which complete data
were available for this analysis (figure 57). Gill, Raiser and others (2012) suggest that the
decreasing importance of exports to EU15 may be partially linked to lower GDP growth in the
EU15 countries. Exports to and from SEE6 have become more sophisticated in the last decade:
on average exports sophistication to EU15 in intermediate goods grew from US$8,371 in 2000 to
US$13,075 in 2008. However, SEE6‘s export sophistication for intermediate goods remains
lower than that of EU11 as a group, suggesting that the region has some way to go in terms of
taking advantage of high value exports.
But SEE6 exports are still dominated by low-skill and natural resource-intensive products
(Kathuria, 2008). Analysis of the composition of exports (figure 58) reveals that in 2009-10
SEE6 exports were dominated by intermediate goods (12.4 percent of GDP) and traditional
services (10.5 percent of GDP), with relatively little contribution from capital goods and modern
23
In other regions capital does not seem to flow ‗downhill‘. See: Prasad, Rajan, and Subramanian (2007) or
Gourinchas and Jeanne (2009).
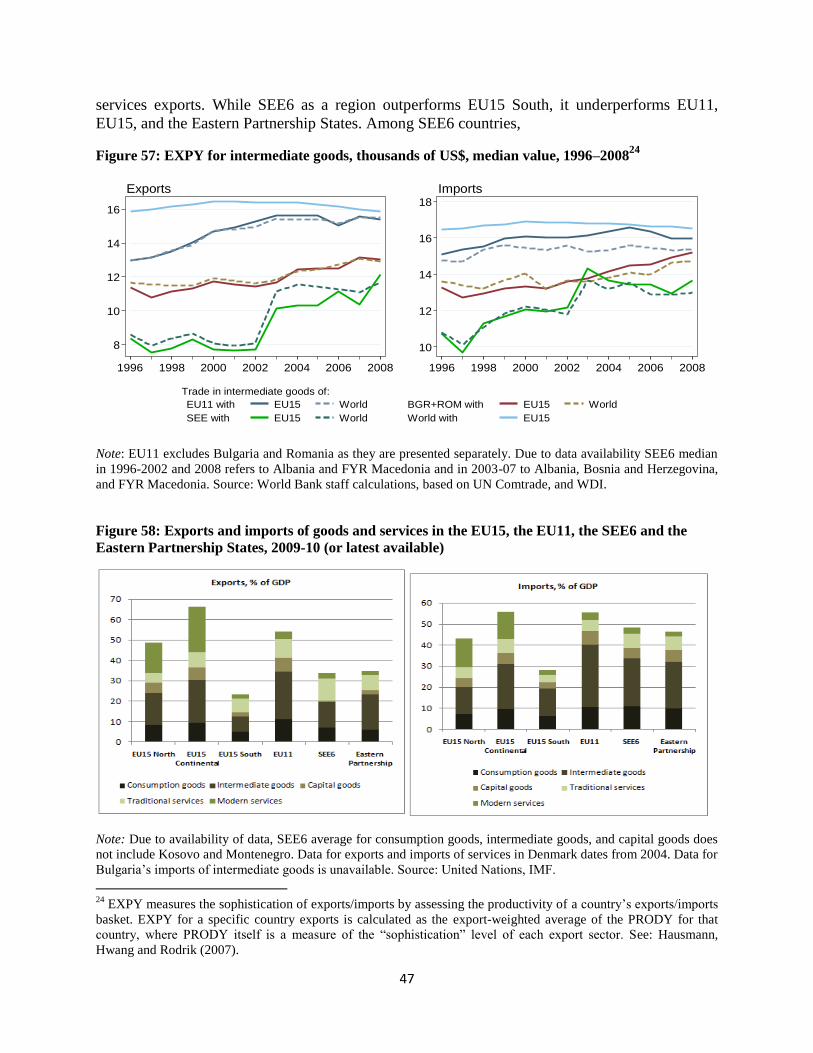
47
services exports. While SEE6 as a region outperforms EU15 South, it underperforms EU11,
EU15, and the Eastern Partnership States. Among SEE6 countries,
Figure 57: EXPY for intermediate goods, thousands of US$, median value, 1996–200824
Note: EU11 excludes Bulgaria and Romania as they are presented separately. Due to data availability SEE6 median
in 1996-2002 and 2008 refers to Albania and FYR Macedonia and in 2003-07 to Albania, Bosnia and Herzegovina,
and FYR Macedonia. Source: World Bank staff calculations, based on UN Comtrade, and WDI.
Figure 58: Exports and imports of goods and services in the EU15, the EU11, the SEE6 and the
Eastern Partnership States, 2009-10 (or latest available)
Note: Due to availability of data, SEE6 average for consumption goods, intermediate goods, and capital goods does
not include Kosovo and Montenegro. Data for exports and imports of services in Denmark dates from 2004. Data for
Bulgaria‘s imports of intermediate goods is unavailable. Source: United Nations, IMF.
24
EXPY measures the sophistication of exports/imports by assessing the productivity of a country‘s exports/imports
basket. EXPY for a specific country exports is calculated as the export-weighted average of the PRODY for that
country, where PRODY itself is a measure of the ―sophistication‖ level of each export sector. See: Hausmann,
Hwang and Rodrik (2007).
8
10
12
14
16
10
12
14
16
18
1996 1998 2000 2002 2004 2006 2008 1996 1998 2000 2002 2004 2006 2008
Exports Imports
EU11 with EU15 World BGR+ROM with EU15 World
SEE with EU15 World World with EU15
Trade in intermediate goods of:
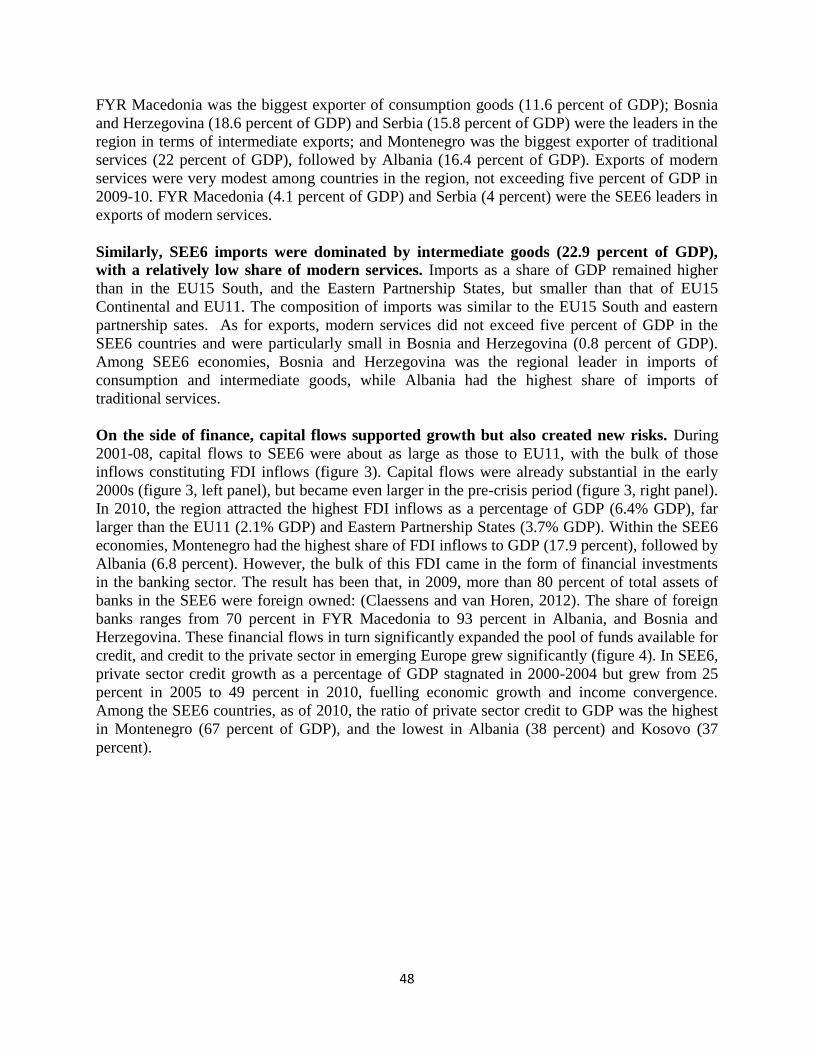
48
FYR Macedonia was the biggest exporter of consumption goods (11.6 percent of GDP); Bosnia
and Herzegovina (18.6 percent of GDP) and Serbia (15.8 percent of GDP) were the leaders in the
region in terms of intermediate exports; and Montenegro was the biggest exporter of traditional
services (22 percent of GDP), followed by Albania (16.4 percent of GDP). Exports of modern
services were very modest among countries in the region, not exceeding five percent of GDP in
2009-10. FYR Macedonia (4.1 percent of GDP) and Serbia (4 percent) were the SEE6 leaders in
exports of modern services.
Similarly, SEE6 imports were dominated by intermediate goods (22.9 percent of GDP),
with a relatively low share of modern services. Imports as a share of GDP remained higher
than in the EU15 South, and the Eastern Partnership States, but smaller than that of EU15
Continental and EU11. The composition of imports was similar to the EU15 South and eastern
partnership sates. As for exports, modern services did not exceed five percent of GDP in the
SEE6 countries and were particularly small in Bosnia and Herzegovina (0.8 percent of GDP).
Among SEE6 economies, Bosnia and Herzegovina was the regional leader in imports of
consumption and intermediate goods, while Albania had the highest share of imports of
traditional services.
On the side of finance, capital flows supported growth but also created new risks. During
2001-08, capital flows to SEE6 were about as large as those to EU11, with the bulk of those
inflows constituting FDI inflows (figure 3). Capital flows were already substantial in the early
2000s (figure 3, left panel), but became even larger in the pre-crisis period (figure 3, right panel).
In 2010, the region attracted the highest FDI inflows as a percentage of GDP (6.4% GDP), far
larger than the EU11 (2.1% GDP) and Eastern Partnership States (3.7% GDP). Within the SEE6
economies, Montenegro had the highest share of FDI inflows to GDP (17.9 percent), followed by
Albania (6.8 percent). However, the bulk of this FDI came in the form of financial investments
in the banking sector. The result has been that, in 2009, more than 80 percent of total assets of
banks in the SEE6 were foreign owned: (Claessens and van Horen, 2012). The share of foreign
banks ranges from 70 percent in FYR Macedonia to 93 percent in Albania, and Bosnia and
Herzegovina. These financial flows in turn significantly expanded the pool of funds available for
credit, and credit to the private sector in emerging Europe grew significantly (figure 4). In SEE6,
private sector credit growth as a percentage of GDP stagnated in 2000-2004 but grew from 25
percent in 2005 to 49 percent in 2010, fuelling economic growth and income convergence.
Among the SEE6 countries, as of 2010, the ratio of private sector credit to GDP was the highest
in Montenegro (67 percent of GDP), and the lowest in Albania (38 percent) and Kosovo (37
percent).
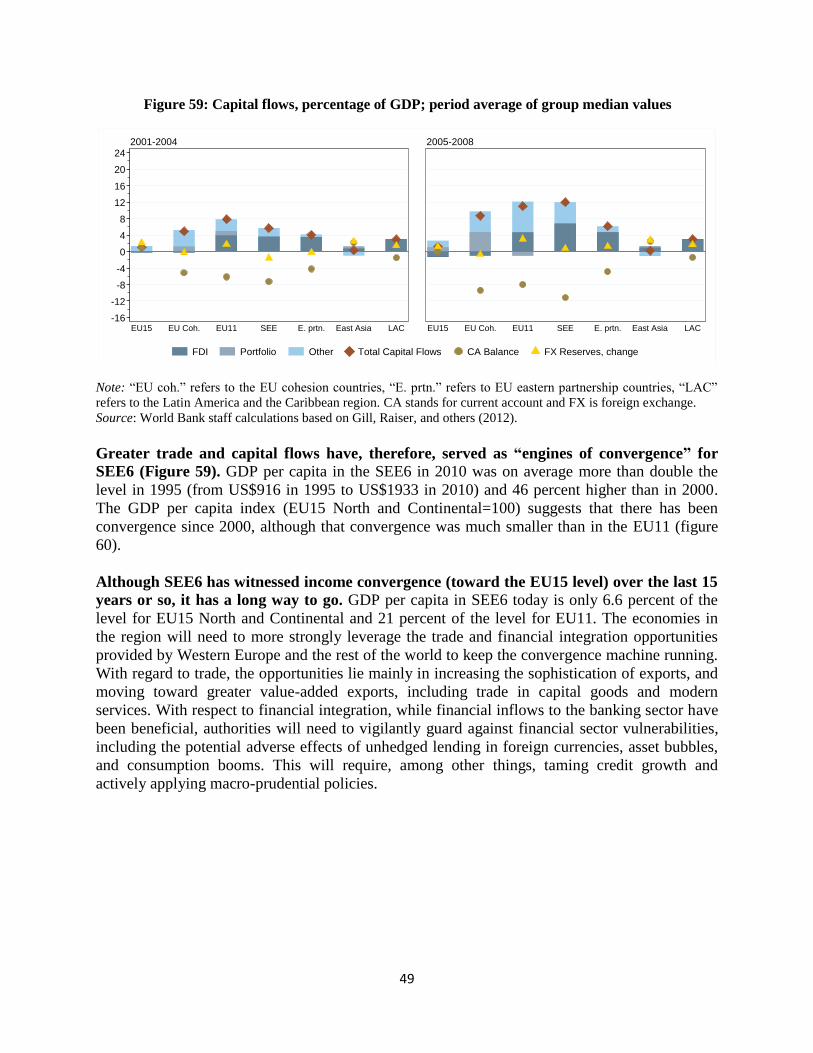
49
Figure 59: Capital flows, percentage of GDP; period average of group median values
Note: ―EU coh.‖ refers to the EU cohesion countries, ―E. prtn.‖ refers to EU eastern partnership countries, ―LAC‖
refers to the Latin America and the Caribbean region. CA stands for current account and FX is foreign exchange.
Source: World Bank staff calculations based on Gill, Raiser, and others (2012).
Greater trade and capital flows have, therefore, served as ―engines of convergence‖ for
SEE6 (Figure 59). GDP per capita in the SEE6 in 2010 was on average more than double the
level in 1995 (from US$916 in 1995 to US$1933 in 2010) and 46 percent higher than in 2000.
The GDP per capita index (EU15 North and Continental=100) suggests that there has been
convergence since 2000, although that convergence was much smaller than in the EU11 (figure
60).
Although SEE6 has witnessed income convergence (toward the EU15 level) over the last 15
years or so, it has a long way to go. GDP per capita in SEE6 today is only 6.6 percent of the
level for EU15 North and Continental and 21 percent of the level for EU11. The economies in
the region will need to more strongly leverage the trade and financial integration opportunities
provided by Western Europe and the rest of the world to keep the convergence machine running.
With regard to trade, the opportunities lie mainly in increasing the sophistication of exports, and
moving toward greater value-added exports, including trade in capital goods and modern
services. With respect to financial integration, while financial inflows to the banking sector have
been beneficial, authorities will need to vigilantly guard against financial sector vulnerabilities,
including the potential adverse effects of unhedged lending in foreign currencies, asset bubbles,
and consumption booms. This will require, among other things, taming credit growth and
actively applying macro-prudential policies.
-16
-12
-8
-4
0
4
8
12
16
20
24
EU15 EU Coh. EU11 SEE E. prtn. East Asia LAC EU15 EU Coh. EU11 SEE E. prtn. East Asia LAC
2001-2004 2005-2008
FDI Portfolio Other Total Capital Flows CA Balance FX Reserves, change
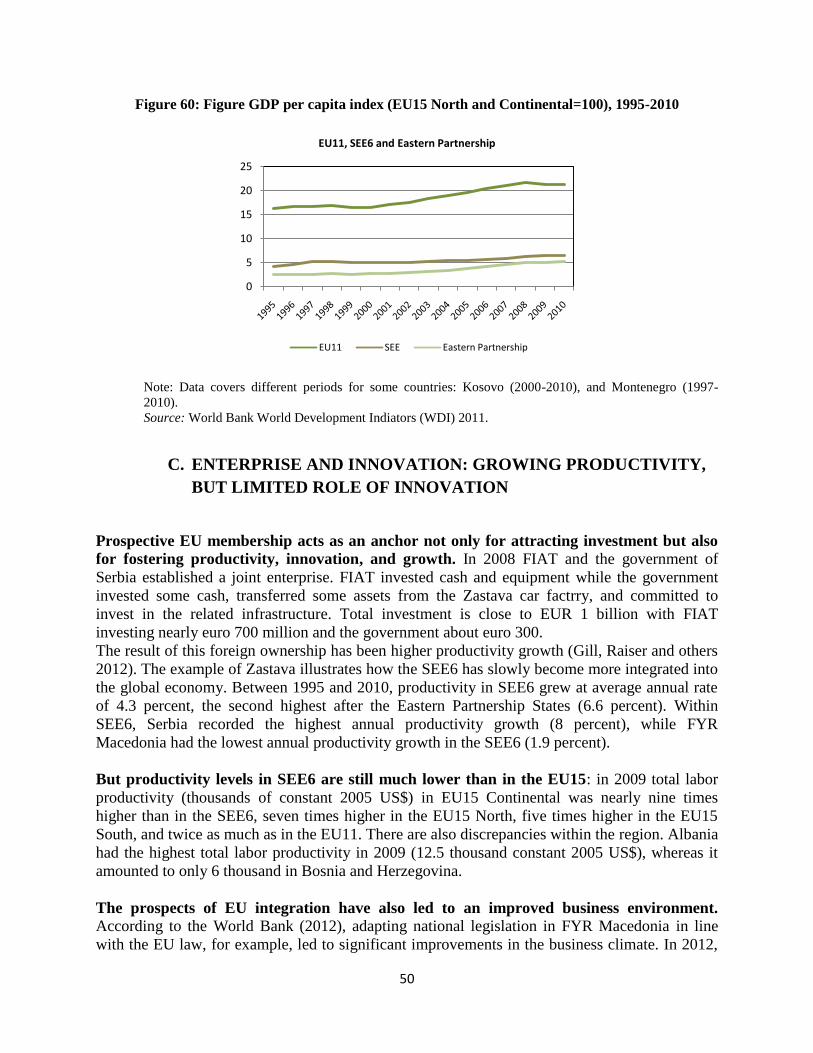
50
Figure 60: Figure GDP per capita index (EU15 North and Continental=100), 1995-2010
Note: Data covers different periods for some countries: Kosovo (2000-2010), and Montenegro (1997-
2010).
Source: World Bank World Development Indiators (WDI) 2011.
C. ENTERPRISE AND INNOVATION: GROWING PRODUCTIVITY,
BUT LIMITED ROLE OF INNOVATION
Prospective EU membership acts as an anchor not only for attracting investment but also
for fostering productivity, innovation, and growth. In 2008 FIAT and the government of
Serbia established a joint enterprise. FIAT invested cash and equipment while the government
invested some cash, transferred some assets from the Zastava car factrry, and committed to
invest in the related infrastructure. Total investment is close to EUR 1 billion with FIAT
investing nearly euro 700 million and the government about euro 300.
The result of this foreign ownership has been higher productivity growth (Gill, Raiser and others
2012). The example of Zastava illustrates how the SEE6 has slowly become more integrated into
the global economy. Between 1995 and 2010, productivity in SEE6 grew at average annual rate
of 4.3 percent, the second highest after the Eastern Partnership States (6.6 percent). Within
SEE6, Serbia recorded the highest annual productivity growth (8 percent), while FYR
Macedonia had the lowest annual productivity growth in the SEE6 (1.9 percent).
But productivity levels in SEE6 are still much lower than in the EU15: in 2009 total labor
productivity (thousands of constant 2005 US$) in EU15 Continental was nearly nine times
higher than in the SEE6, seven times higher in the EU15 North, five times higher in the EU15
South, and twice as much as in the EU11. There are also discrepancies within the region. Albania
had the highest total labor productivity in 2009 (12.5 thousand constant 2005 US$), whereas it
amounted to only 6 thousand in Bosnia and Herzegovina.
The prospects of EU integration have also led to an improved business environment.
According to the World Bank (2012), adapting national legislation in FYR Macedonia in line
with the EU law, for example, led to significant improvements in the business climate. In 2012,
0
5
10
15
20
25
EU11, SEE6 and Eastern Partnership
EU11 SEE Eastern Partnership
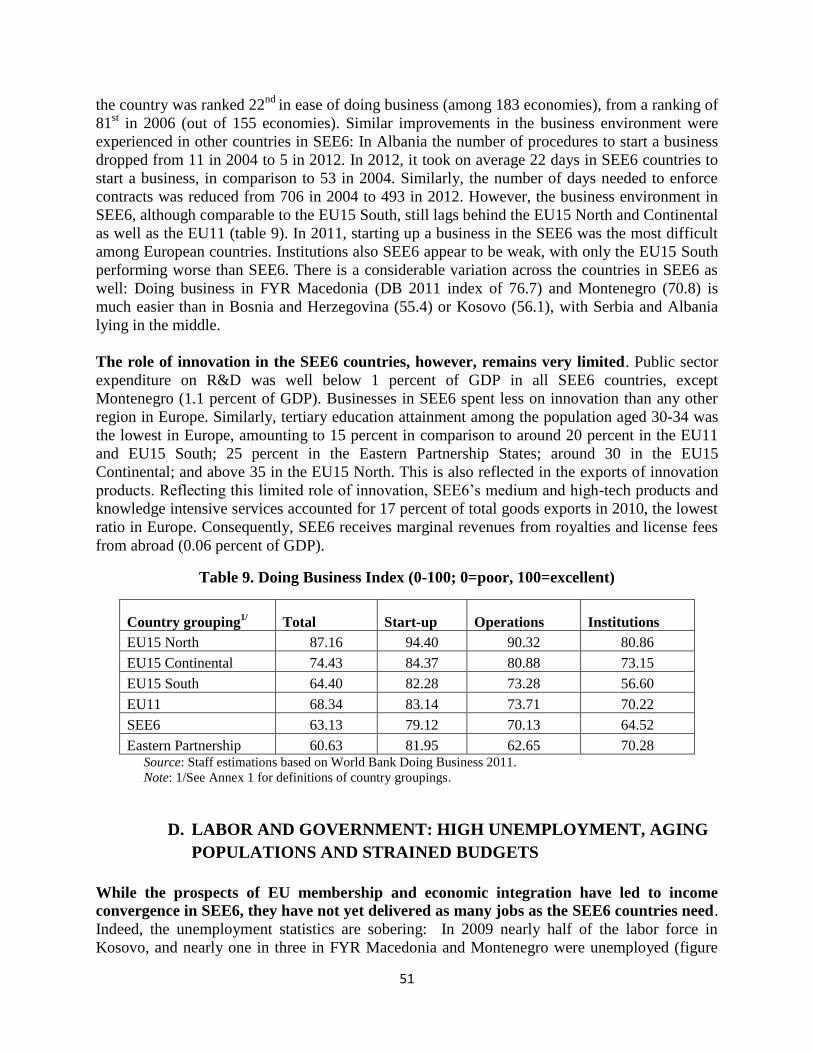
51
the country was ranked 22nd
in ease of doing business (among 183 economies), from a ranking of
81st in 2006 (out of 155 economies). Similar improvements in the business environment were
experienced in other countries in SEE6: In Albania the number of procedures to start a business
dropped from 11 in 2004 to 5 in 2012. In 2012, it took on average 22 days in SEE6 countries to
start a business, in comparison to 53 in 2004. Similarly, the number of days needed to enforce
contracts was reduced from 706 in 2004 to 493 in 2012. However, the business environment in
SEE6, although comparable to the EU15 South, still lags behind the EU15 North and Continental
as well as the EU11 (table 9). In 2011, starting up a business in the SEE6 was the most difficult
among European countries. Institutions also SEE6 appear to be weak, with only the EU15 South
performing worse than SEE6. There is a considerable variation across the countries in SEE6 as
well: Doing business in FYR Macedonia (DB 2011 index of 76.7) and Montenegro (70.8) is
much easier than in Bosnia and Herzegovina (55.4) or Kosovo (56.1), with Serbia and Albania
lying in the middle.
The role of innovation in the SEE6 countries, however, remains very limited. Public sector
expenditure on R&D was well below 1 percent of GDP in all SEE6 countries, except
Montenegro (1.1 percent of GDP). Businesses in SEE6 spent less on innovation than any other
region in Europe. Similarly, tertiary education attainment among the population aged 30-34 was
the lowest in Europe, amounting to 15 percent in comparison to around 20 percent in the EU11
and EU15 South; 25 percent in the Eastern Partnership States; around 30 in the EU15
Continental; and above 35 in the EU15 North. This is also reflected in the exports of innovation
products. Reflecting this limited role of innovation, SEE6‘s medium and high-tech products and
knowledge intensive services accounted for 17 percent of total goods exports in 2010, the lowest
ratio in Europe. Consequently, SEE6 receives marginal revenues from royalties and license fees
from abroad (0.06 percent of GDP).
Table 9. Doing Business Index (0-100; 0=poor, 100=excellent)
Country grouping1/ Total Start-up Operations Institutions
EU15 North 87.16 94.40 90.32 80.86
EU15 Continental 74.43 84.37 80.88 73.15
EU15 South 64.40 82.28 73.28 56.60
EU11 68.34 83.14 73.71 70.22
SEE6 63.13 79.12 70.13 64.52
Eastern Partnership 60.63 81.95 62.65 70.28 Source: Staff estimations based on World Bank Doing Business 2011.
Note: 1/See Annex 1 for definitions of country groupings.
D. LABOR AND GOVERNMENT: HIGH UNEMPLOYMENT, AGING
POPULATIONS AND STRAINED BUDGETS
While the prospects of EU membership and economic integration have led to income
convergence in SEE6, they have not yet delivered as many jobs as the SEE6 countries need.
Indeed, the unemployment statistics are sobering: In 2009 nearly half of the labor force in
Kosovo, and nearly one in three in FYR Macedonia and Montenegro were unemployed (figure

52
7). The employment landscape was only marginally better in other SEE6 economies: one in four
people in the labor force in Bosnia and Herzegovina, one in seven in Serbia, and one in ten in
Albania remained unemployed. SEE6 as a region fared worse than any other region in Europe
(figure 61). The high unemployment underscores the need for the countries in the region not only
to pursue pro-growth policies but also to improve labor market flexibility and mobility through
reforming, among others, the labor regulations to make their economies more contestable. Box 3
summarizes examples of countries that have undertaken labor market reforms successfully in
recent years.
Figure 61: Unemployment rate as a percentage of total labor force (2009 or latest available)
Note: Data for 2009 or the most recent available year. Data for Belarus are unavailable.
Source: World Bank.
0
5
10
15
20
25
30
35
40
45
50
EU15 North EU15 Continental
EU15 South EU11 SEE6 Eastern Partnership
ALB BIH KSV MKD MNE SRB
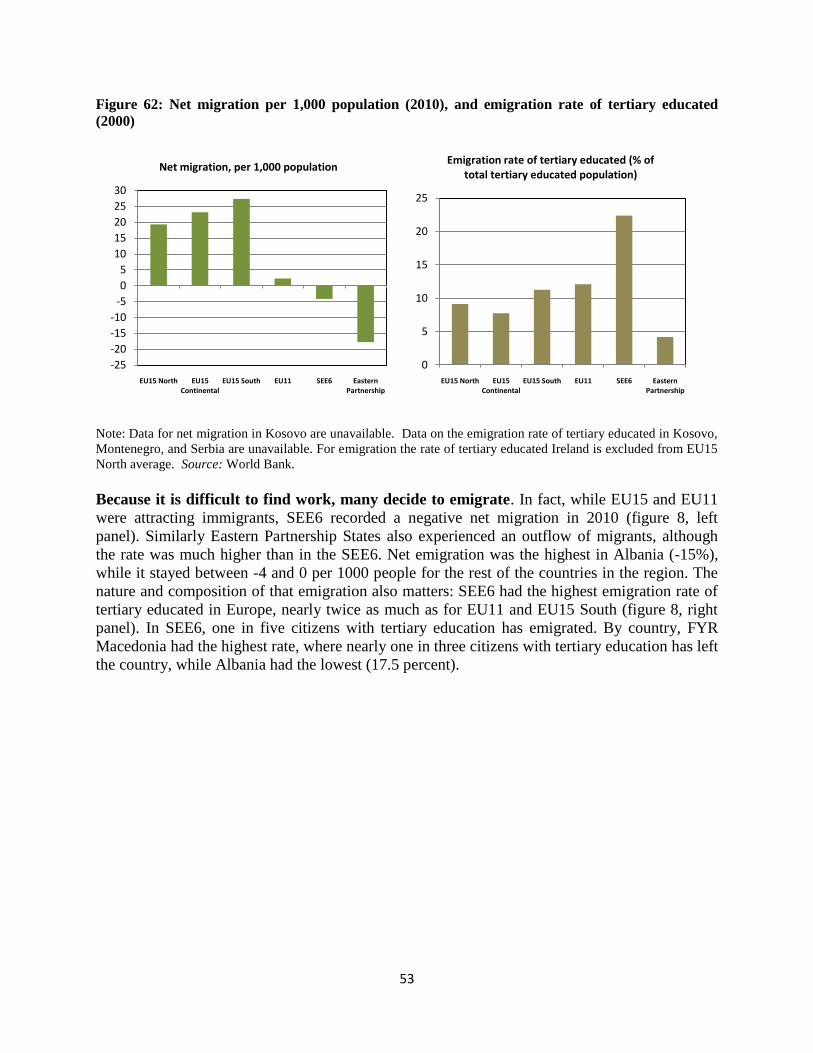
53
Figure 62: Net migration per 1,000 population (2010), and emigration rate of tertiary educated
(2000)
Note: Data for net migration in Kosovo are unavailable. Data on the emigration rate of tertiary educated in Kosovo,
Montenegro, and Serbia are unavailable. For emigration the rate of tertiary educated Ireland is excluded from EU15
North average. Source: World Bank.
Because it is difficult to find work, many decide to emigrate. In fact, while EU15 and EU11
were attracting immigrants, SEE6 recorded a negative net migration in 2010 (figure 8, left
panel). Similarly Eastern Partnership States also experienced an outflow of migrants, although
the rate was much higher than in the SEE6. Net emigration was the highest in Albania (-15%),
while it stayed between -4 and 0 per 1000 people for the rest of the countries in the region. The
nature and composition of that emigration also matters: SEE6 had the highest emigration rate of
tertiary educated in Europe, nearly twice as much as for EU11 and EU15 South (figure 8, right
panel). In SEE6, one in five citizens with tertiary education has emigrated. By country, FYR
Macedonia had the highest rate, where nearly one in three citizens with tertiary education has left
the country, while Albania had the lowest (17.5 percent).
-25
-20
-15
-10
-5
0
5
10
15
20
25
30
EU15 North EU15 Continental
EU15 South EU11 SEE6 Eastern Partnership
Net migration, per 1,000 population
0
5
10
15
20
25
EU15 North EU15 Continental
EU15 South EU11 SEE6 Eastern Partnership
Emigration rate of tertiary educated (% of total tertiary educated population)

54
The average size of government in SEE6, at about 40 percent of GDP, is comparable to the
Eastern Partnership Countries but smaller than just about any other groupings in Europe
(Figure 63). In 2009, SEE6 countries spent around 40 percent of their GDP, and more than a
quarter of it went to social protection. With the exception of Serbia (19 percent), social
protection spending, at an average of 11 percent, was not particularly large when compared to
other regions in Europe (figure 9): EU15 North (20.3 percent of GDP), EU15 Continental (19
percent), EU15 South (18.6 percent), EU11 (14.7 percent), and Eastern Partnership States (11.9).
SEE6 countries, however, face significant challenges in ensuring greater efficiency and
effectiveness of public spending. A key component of government reform going forward is
therefore to ensure a more efficient service delivery in health, education, and social protection
through, among other things, better targeting, institutional reforms, and greater accountability for
use of public resources.
Box 3: Reforming the labor market: A tale of two countries (and some lessons)
Making the labor market flexible is no easy task but two countries managed to accomplish it, providing lessons for
other countries in SEE6. Although countries with different income levels may face different challenges,
increasing the flexibility of labor markets can yield similar successes. This box reviews experiences of two
economies of different development stage: Denmark, and Estonia.
Denmark. In Denmark, labor market regulation combines flexibility for employers and income security for
workers. The arrangement is called ―flexicurity‖ and has been in place since at least the 1970s (Iwulska 2011).
Flexicurity combines three elements. First, it is easy to fire and hire: every year one out of five Danes experiences
unemployment, mainly in transition to a new job. Second, once unemployed, workers enjoy one of the most
generous benefit systems in Europe. Yet, the incidence of long-term unemployment in Denmark stood at 9.1 as
opposed to the OECD weighted average of 23.5. Third, by adopting active labor market programs, the unemployed
are encouraged to reenter employment. Flexicurity seems to work well in Denmark. Between 1995 and 2008,
unemployment averaged 4.9 percent, compared with 8.5 percent for the rest of the EU15. Flexicurity in Denmark is
a result of gradually evolving structures rather than one-time decisions. It works because Denmark has a long
history of self-regulation by labor market partners. Finally, the cost of the labor market programs is substantial:
Denmark spent 4.5 percent of GDP on active labor market programs in 2008.
Estonia. Estonia has one of the most flexible labor regulations in emerging Europe. Even in the public sector,
employers enjoy relative flexibility in setting wages. According to the World Bank Doing Business Index for hiring
and firing practices (the index ranges from 1 to 7, 1 = impeded by regulations, 7 = flexibly determined by
employers), in 2010, Estonia recorded the highest score among EU11 (4.5). This flexibility started very early after
the transition, as Estonia implemented changes in wage bargaining in 1992. In 1999, the Socio-Economic Council
was formed and given responsibility for setting the minimum wage, the tax-free income threshold, and levels of
unemployment benefits (Rutkowski, Scarpetta and others 2005). With the reforms, union density dropped
significantly from 14.3 percent in 2000 to 6 percent in 2008 (percent of total paid employees, ILO, Statistics
Estonia, Labor Force Survey). Consequently, the unemployment rate dropped from 13.7 percent in 2000 to 5.5
percent in 2008. And although unemployment increased recently to 16.9 percent due to the financial crisis of 2008-
09, it is forecast to drop to 5.8 percent by 2016 (IMF WEO). Source: Rutkowski, Scarpetta and others (2005), Iwulska (2011).
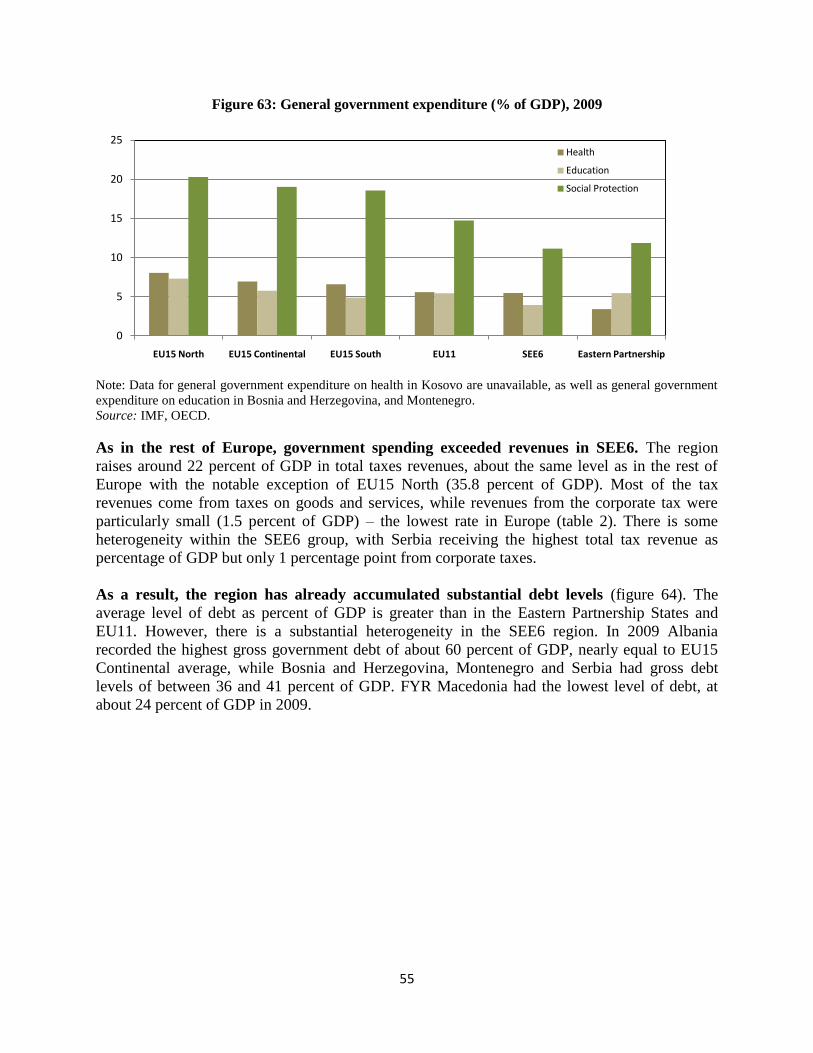
55
Figure 63: General government expenditure (% of GDP), 2009
Note: Data for general government expenditure on health in Kosovo are unavailable, as well as general government
expenditure on education in Bosnia and Herzegovina, and Montenegro.
Source: IMF, OECD.
As in the rest of Europe, government spending exceeded revenues in SEE6. The region
raises around 22 percent of GDP in total taxes revenues, about the same level as in the rest of
Europe with the notable exception of EU15 North (35.8 percent of GDP). Most of the tax
revenues come from taxes on goods and services, while revenues from the corporate tax were
particularly small (1.5 percent of GDP) – the lowest rate in Europe (table 2). There is some
heterogeneity within the SEE6 group, with Serbia receiving the highest total tax revenue as
percentage of GDP but only 1 percentage point from corporate taxes.
As a result, the region has already accumulated substantial debt levels (figure 64). The
average level of debt as percent of GDP is greater than in the Eastern Partnership States and
EU11. However, there is a substantial heterogeneity in the SEE6 region. In 2009 Albania
recorded the highest gross government debt of about 60 percent of GDP, nearly equal to EU15
Continental average, while Bosnia and Herzegovina, Montenegro and Serbia had gross debt
levels of between 36 and 41 percent of GDP. FYR Macedonia had the lowest level of debt, at
about 24 percent of GDP in 2009.
0
5
10
15
20
25
EU15 North EU15 Continental EU15 South EU11 SEE6 Eastern Partnership
Health
Education
Social Protection
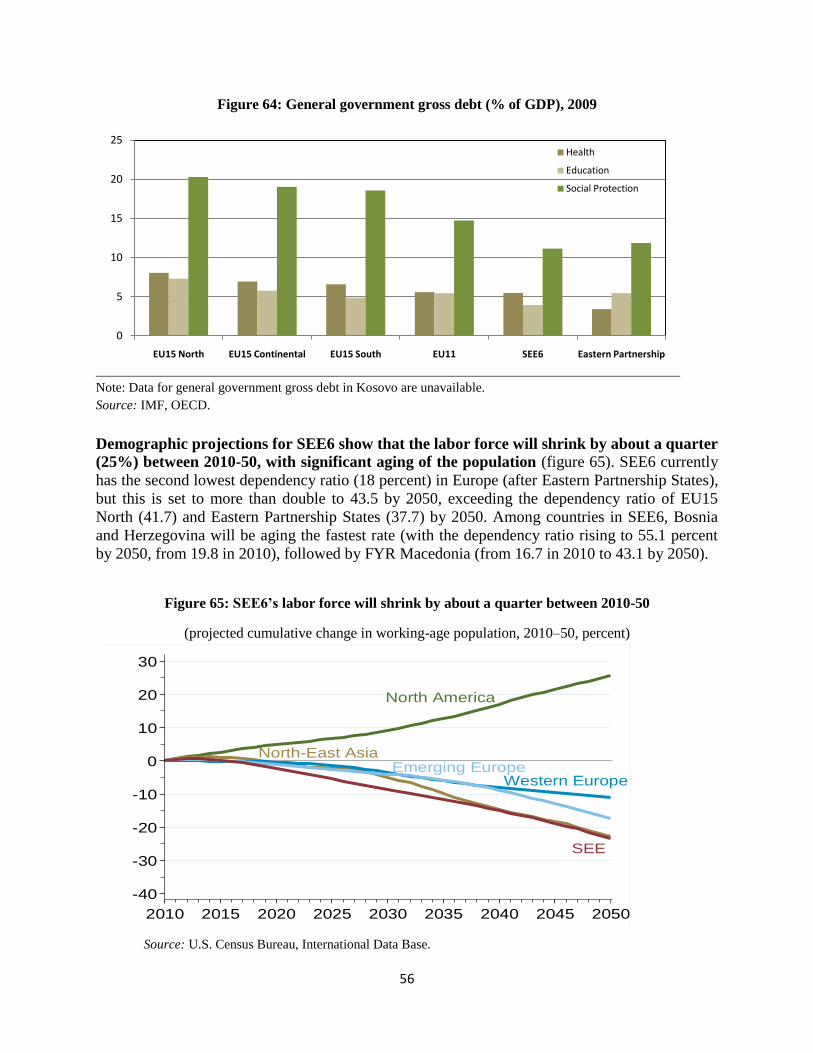
56
Figure 64: General government gross debt (% of GDP), 2009
Note: Data for general government gross debt in Kosovo are unavailable.
Source: IMF, OECD.
Demographic projections for SEE6 show that the labor force will shrink by about a quarter
(25%) between 2010-50, with significant aging of the population (figure 65). SEE6 currently
has the second lowest dependency ratio (18 percent) in Europe (after Eastern Partnership States),
but this is set to more than double to 43.5 by 2050, exceeding the dependency ratio of EU15
North (41.7) and Eastern Partnership States (37.7) by 2050. Among countries in SEE6, Bosnia
and Herzegovina will be aging the fastest rate (with the dependency ratio rising to 55.1 percent
by 2050, from 19.8 in 2010), followed by FYR Macedonia (from 16.7 in 2010 to 43.1 by 2050).
Figure 65: SEE6‘s labor force will shrink by about a quarter between 2010-50
(projected cumulative change in working-age population, 2010–50, percent)
Source: U.S. Census Bureau, International Data Base.
0
5
10
15
20
25
EU15 North EU15 Continental EU15 South EU11 SEE6 Eastern Partnership
Health
Education
Social Protection
North America
North-East Asia
Western EuropeEmerging Europe
SEE
-40
-30
-20
-10
0
10
20
30
Wor
king
-age
pop
ulat
ion,
201
0=0
2010 2015 2020 2025 2030 2035 2040 2045 2050
57
The aging population will increase pension and healthcare costs, putting a further strain on
public finances. The pension systems in SEE6 are likely to be burdened heavily as a result of the
aging population, as fewer workers are called on to support many more elderly reflecting the
higher dependency ratio. Healthcare costs are also likely to increase significantly as the countries
grapple with healthcare for the elderly. This means that big fiscal adjustments are needed to
address both current imbalances and future costs related to the aging population, including
reforms of the pensions and social transfers systems, and healthcare. According to Gill, Raiser
and others (2012), in the EU candidate countries an adjustment in the primary balance of 3.4
percent of GDP is required between 2010 and 2020. This is higher than in the Eastern
Partnership States (2.9) but lower than in the EU12 (4.9). However, when the primary balance is
adjusted cyclically, EU candidates reveal the highest adjustment needs (3.4 percent) between
2010 and 2020 in emerging Europe, followed by the Eastern Partnership States (3.0 percent) and
EU12 (2.8 percent).
E. CONCLUSIONS AND IMPLICATIONS FOR POLICY REFORM:
FROM CONVERGENCE TO REFORMING LABOR AND
GOVERNMENT
The key policy implications for long-term development policy in SEE6 going forward are two-
fold:
(i) Keep the ―convergence engine‖ running by leveraging greater trade and financial flows:
Trade: Although the share of exports from SEE6 to EU15 has grown, and the
sophistication of exports with EU15 has increased since 2000, SEE6 remains the least
sophisticated with regard to trade in services relative to even the EU11, with the bulk of
services trade concentrated in transportation, travel, construction and recreation. This
points to the importance of continuing to leverage trade opportunities – in particular by
increasing the sophistication of exports and moving toward greater value-added exports,
including trade in capital goods and modern services –to keep the convergence machine
running.
Finance: While SEE6 has benefited from large capital flows since 2001, most of which
came in the form of FDI to the banking sector, the implication is that the countries in the
region will need to vigilantly guard against financial sector vulnerability--including the
potential adverse effects of unhedged lending in foreign currencies, asset bubbles, and
consumption booms—to keep the convergence machine running. This will require,
among other things, taming credit growth and actively applying macro-prudential
policies.
(ii) Reform labor and government now in order to address the long term challenges of high
unemployment and ageing population:
Labor: The SEE6 economies have had much success in labor productivity growth since
the early 1990s, growing at average annual rate of 4.3 percent during 1995-2010, but that
growth has overall not generated sufficient jobs, with most of the countries in the region
today facing high unemployment levels. This underscores the critical importance of

58
creating more jobs, especially for the young and the educated, not only through pursuing
growth policies but also by undertaking labor market reforms to increase labor market
flexibility and mobility. Labor market reforms (e.g. reduction of rigidities in hiring and
firing, dismissal costs, etc.) and active labor market policies that promote, among other
things, job matching and training will become critical to address the unemployment
challenge.
Government: At about 40 percent of GDP, the average size of government in SEE6 is
smaller than just about any other groupings in Europe. However, SEE6 faces one of the
worst demographic outlooks in the next four decades, with significant population aging, a
shrinking labor force (by a quarter), and outward migration–all imposing major stresses
on social protection and pension systems, health care costs, and public finances. The
pension systems in SEE6 are likely to be burdened heavily, as fewer workers are called
on to support many more elderly reflecting higher dependency ratios. Healthcare costs
are also likely to increase significantly as the countries grapple with healthcare for the
elderly. This means that big fiscal adjustments are needed to address both current
imbalances and future costs related to the aging population, including reforms of the
pensions and social transfers systems, and healthcare. Improving efficiency and
effectiveness of public spending will be critical to addressing these challenges.
Reforming social protection and health care today will be essential for the countries in the
region to be better prepared for the demographic transition and aging population of
tomorrow; and these reforms in turn are critical to making fiscal adjustment needed to
keep public finances, including public debt, in order.
Annex 1: Country groupings used in this note
EU15 North EU15
Continental
EU15 South SEE6 EU11 Eastern
Partnership
States
Denmark Austria Greece Albania Bulgaria Armenia
Finland Belgium Italy Bosnia and
Herzegovina
Croatia Azerbaijan
Ireland France Portugal Kosovo Czech
Republic
Belarus
Sweden Germany Spain FYR Macedonia Estonia Georgia
United
Kingdom
Luxembourg Montenegro Hungary Moldova
The
Netherlands
Serbia Latvia Ukraine
Lithuania
Poland
Romania
Slovak
Republic
Slovenia