south eastern europe emerging market economies … market economies w eeekkllyy rreppoorrtt nbg ......
TRANSCRIPT

South Eastern Europe and Mediterranean Emerging Market Economies
WWeeeekkllyy RReeppoorrtt
NBG - Economic Analysis Division
Director: Paul Mylonas : +30 210 33 41 521 : [email protected] Emerging Markets Research Head: Michael Loufir : +30 210 33 41 211 : [email protected] Analysts:
Evlabia Fetsi : +30 210 33 41 667 : [email protected]
Konstantinos Romanos-Louizos : +30 210 33 41 225 : [email protected]
Louiza Troupi : +30 210 33 41 696 : [email protected]
:
Finansbank Research
Chief Economist: Inan Demir : +90 212 318 5087 : [email protected] Analyst:
Gökçe Çelik : +90 212 318 5096 : [email protected]
25 – 31 August 2015
TURKEY . . . . . . . . . . . . . . . . . . . . . . . . . . . . . . . . . . . . . . . . . . . . . 1
Opinion polls suggest no notable change in the distribution of
votes in the November 1st snap parliamentary elections
President Erdogan approves an interim Government until the
November elections
A strong banking sector performance in Q2:15
ROMANIA . . . . . . . . . . . . . . . . . . . . . . . . . . . . . . . . . . . . . . . . . . . . 2 2
Significant fiscal consolidation in the first 7 months of the year
A revised Fiscal Code endorsed by Parliament
BULGARIA . . . . . . . . . . . . . . . . . . . . . . . . . . . . . . . . . . . . . . . . . . . 3
Impressive fiscal consolidation in the first 7 months of the year
SERBIA . . . . . . . . . . . . . . . . . . . . . . . . . . . . . . . . . . . . . . . . . . . . . . 4
Substantial progress in EU-mediated talks with Kosovo
Customer deposit growth remains strong in June
Credit activity accelerates slightly in June
FYROM . . . . . . . . . . . . . . . . . . . . . . . . . . . . . . . . . . . . . . . . . . . . . . . . . . 5
Fitch assigns a negative outlook to the country’s long-term
foreign and local currency debt ratings
Fiscal performance improves significantly in the first 7 months
of the year
ALBANIA . . . . . . . . . . . . . . . . . . . . . . . . . . . . . . . . . . . . . . . . . . . . 6
Customer deposit growth remains subdued in June
Credit activity moderates to just 0.3% y-o-y in June
CYPRUS . . . . . . . . . . . . . . . . . . . . . . . . . . . . . . . . . . . . . . . . . . . . . 7
A positive Troika mission statement following the 7th review of
the country’s financial assistance programme
Tourist arrivals reach a decade high of 1.5mn in the first 7
months of the year
EGYPT . . . . . . . . . . . . . . . . . . . . . . . . . . . . . . . . . . . . . . . . . . . . . . 8
Long-awaited parliamentary elections to begin on October 17th
Tourism receipts post impressive growth in FY:14/15 (c. 43%
in USD terms)
APPENDIX: FINANCIAL MARKETS . . . . . . . . . . . . . . . . . . . . . . . . 9
The information in this document, being distributed by National Bank of Greece S.A., is based upon data and sources of information believed to be correct and reliable but the accuracy of which cannot be guaranteed. Accordingly, no representation or warranty, implied or expressed, is made by any member of National Bank of Greece S.A. as to its accuracy adequacy, timeliness or completeness.

25 – 31 August 2015
NBG - South Eastern Europe and Mediterranean Emerging Market Economies - Weekly Report 1
Turkey
BB+ / Baa3 / BBB- (S&P/ Moody’s / Fitch)
-20
-15
-10
-5
0
5
10
15
20
25
30
-20
-15
-10
-5
0
5
10
15
20
25
30
Q2
:07
Q4
:07
Q2
:08
Q4
:08
Q2
:09
Q4
:09
Q2
:10
Q4
:10
Q2
:11
Q4
:11
Q2
:12
Q4
:12
Q2
:13
Q4
:13
Q2
:14
Q4
:14
Q2
:15
Quarterly Net Banking Sector Profit (bn, TRY) (Annualised)
Taxes Provisions for bad loansOerating Expenses Net Non-Interest IncomeNet Interest Income Net Income
0
50
100
150
200
250
300
150
200
250
300
350
400
450
500
550
Q2:0
7
Q4:0
7
Q2:0
8
Q4:0
8
Q2:0
9
Q4:0
9
Q2:1
0
Q4:1
0
Q2:1
1
Q4:1
1
Q2:1
2
Q4:1
2
Q2:1
3
Q4:1
3
Q2:1
4
Q4:1
4
Q2:1
5
Quarterly Cost of Risk (Annualised) and NPL Ratio
NPL Ratio (bps, left scale)Cost of Risk (bps, right scale)
250
300
350
400
450
500
550
600
4
8
12
16
20
24
28
32
Q2:0
7
Q4:0
7
Q2:0
8
Q4:0
8
Q2:0
9
Q4:0
9
Q2:1
0
Q4:1
0
Q2:1
1
Q4:1
1
Q2:1
2
Q4:1
2
Q2:1
3
Q4:1
3
Q2:1
4
Q4:1
4
Q2:1
5
Quarterly ROAE and Net Interest Margin (Annualised)
ROAE (%, lhs)
Net Interest Income (bps of Average Assets, rhs)
31 Aug. 3-M F 6-M F 12-M F
1-m TRIBOR (%) 12.0 11.0 10.5 9.5
TRY/EUR 3.27 3.05 3.00 2.90
Sov. Spread (2017, bps) 135 125 115 100
31 Aug. 1-W % YTD % 2-Y %
ISE 100 75,210 5.4 -12.3 13.3
2012 2013 2014 2015F 2016F
Real GDP Growth (%) 2.1 4.2 2.9 3.4 3.8
Inflation (eop, %) 6.2 7.4 8.2 7.4 6.2
Cur. Acct. Bal. (% GDP) -6.2 -7.9 -5.7 -5.2 -5.4
Fiscal Bal. (% GDP) -2.1 -1.2 -1.3 -1.4 -1.2
Recent opinion polls suggest no notable change in the
distribution of votes in the November 1st
snap parliamentary
elections. President Erdogan called for early parliamentary elections to
be held on November 1st, as the PM and leader of the largest party in
Parliament (AKP), Davutoglu, failed to form a coalition government by
the August 23rd
deadline. Importantly, the latest opinion polls do not
suggest the emergence of a single party government from the
upcoming elections. The most likely outcome is a grand coalition
between AKP and CHP, the second largest party.
President Erdogan approves an interim Government to run the
country until the November elections. On the day of the
announcement of the snap elections, President Erdogan appointed PM
Davutoglu to form an interim "election government", which should
comprise all parties represented in parliament, according to their share
of seats (11 AKP, 5 CHP, 3 MHP, 3 HDP, and 3 independents).
However, as the opposition parties have either totally or partly rejected
to take part in the interim government, the new cabinet comprises 11
AKP, 2 HDP and 1 MHP lawmakers, along with 11 independents (8 of
them filling the seats not taken by the opposition). Importantly, no major
change in the course of economic policy is expected under the new
administration, as both Finance Minister, Simsek, and Economy
Minister, Zeybekci, retained their posts.
Strong banking sector bottom line in Q2:15, despite continued
tight macro-prudential measures and persistent funding cost
pressures. Banking sector net profit (after tax) rose by 7.5% y-o-y to a
9-quarter high of TRY 7.1bn (EUR 2.6bn or 0.4% of projected 2015
GDP) in Q2:15, as the increase in pre-provision earnings before tax
largely offset that in provisions for NPLs. However, (annualised) ROAA
and ROAE declined to still robust levels of 1.3% and 11.8%,
respectively, in Q2:15 from 1.4% and 12.6% in Q2:14.
Pre-provision earnings (before tax) posted strong growth in Q2:15,
supported by a significant increase in net interest income (NII).
Despite a large rise in operating expenses (up 23.1% y-o-y largely
reflecting general provisions) and a decline in net non-interest income
(NNII, down 1.6% y-o-y), pre-provision earnings (before tax) rose by a
strong 8.9% y-o-y in Q2:15, on the back of a significant increase in NII
(up 25.2% y-o-y).
The improvement in NII in Q2:15 was driven by higher average assets
(up 19.9% y-o-y) and net interest margin (NIM, over average assets, up
15 bps y-o-y to 359 bps (annualised)). Note that the increase in
average gross loans was even sharper (up 23.4% y-o-y), despite
continued tight macro-prudential measures by the CBRT and the
BRSA, aimed at holding back the current account deficit and stabilizing
the exchange rate. The improvement in the NIM, on an annual basis,
was contained by cost funding pressures, with the average overnight
interbank market rate rising to 10.9% in Q2:15 from 10.4% a year ago
(in line with the CBRT’s tightening of liquidity conditions) and the
banking sector’s liquidity ratio deteriorating (the net loan-to-customer
deposit ratio rose to 120% at end-Q2:15 from 115% at end-Q2:14).
Provisions for NPLs rose significantly in Q2:15, keeping the
coverage ratio at a comfortable level. P/L provisions for NPLs
increased by 17.9% y-o-y in Q2:15, due to the deterioration in the NPL
ratio (up 10 bps y-o-y to a still low 2.88%). Note that the increase in the
NPL ratio in Q2:15 was exclusively driven by the retail segment, which
have borne the brunt of the new regulation. As a result, the cost of risk
remained broadly unchanged at 116 bps in Q2:15. Encouragingly, the
increase in P/L provisions for NPLs was sufficient in Q2:15, so as to
keep the NPL coverage ratio unchanged from its comfortable level of
74.5% a year ago.

25 – 31 August 2015
NBG - South Eastern Europe and Mediterranean Emerging Market Economies - Weekly Report 2
Romania BBB- / Baa3 / BBB- (S&P / Moody’s / Fitch)
Consolidated Budget (% of GDP)
2014
Outcome 7M:14 7M:15
2015 Revised Budget
2015 NBG
Forecast
Total Revenue 32.1 18.1 19.3 33.9 33.4
Tax Revenue 27.4 15.9 16.6 27.9 28.1
o/w PIT/CIT 5.4 3.3 3.6 5.8 5.9
VAT 7.6 4.4 4.9 8.0 8.1
Excise Duties 3.6 2.0 2.1 3.8 3.8
Property Tax 0.9 0.6 0.5 0.8 0.8
Soc. Sec. Contr. 8.6 5.0 4.8 8.3 8.3
Non-Tax Revenue 4.7 2.2 2.7 6.0 5.3
o/w EU grants 1.9 0.5 0.8 3.0 2.3
Total Expenditure 34.0 18.3 18.3 35.8 35.3
Current Spending 29.1 17.5 17.7 29.1 29.3
o/w Wages 7.5 4.2 4.3 7.2 7.4
Social Spending 10.7 6.1 6.3 11.0 11.0
Goods & Services 5.9 3.1 3.0 5.9 5.9
Other Transfers 2.4 1.2 1.1 2.4 2.4
Subsidies 0.9 0.5 0.5 0.8 0.8
Interest Paym. 1.5 1.1 1.0 1.5 1.4
Capital Expend. 4.9 1.8 1.9 6.7 6.0
Fiscal Balance -1.9 -0.2 1.1 -1.9 -1.9
Primary Balance -0.3 0.9 2.1 -0.4 -0.5
-10
-5
0
5
10
15
20
-10
-9
-8
-7
-6
-5
-4
-3
-2
-1
0
01
/10
04
/10
07
/10
10
/10
01
/11
04
/11
07
/11
10
/11
01
/12
04
/12
07
/12
10
/12
01
/13
04
/13
07
/13
10
/13
01
/14
04
/14
07
/14
10
/14
01
/15
04
/15
07
/15
Tax Revenue, Primary Expenditure& Fiscal Balance (12-m Rolling)
Primary Expenditure (y-o-y % change, right scale)Tax Revenue (y-o-y % change, right scale)
Fiscal Balance (as % of GDP, left scale)
31 Aug. 3-M F 6-M F 12-M F
1-m ROBOR (%) 1.5 1.2 1.5 1.8
RON/EUR 4.43 4.42 4.41 4.40
Sov. Spread (2018, bps) 99 84 82 80
31 Aug. 1-W % YTD % 2-Y %
BET-BK 1,337 2.6 2.2 20.4
2012 2013 2014 2015F 2016F
Real GDP Growth (%) 0.6 3.4 2.8 3.4 4.0
Inflation (eop, %) 5.0 1.6 0.8 0.0 1.0
Cur. Acct. Bal. (% GDP) -4.5 -0.8 -0.4 -0.5 -1.1
Fiscal Bal. (% GDP) -2.5 -2.5 -1.9 -1.9 -2.8
Significant fiscal consolidation in the first 7 months of 2015, with
the 12-month rolling deficit narrowing to 0.6% of GDP in July from
1.9% in December. The consolidated budget posted a surplus of 1.1%
of GDP in 7M:15 against a deficit of 0.2% in 7M:14. The main driver
behind this impressive performance was tax revenue (up 0.7 pps of
GDP y-o-y). Indeed, VAT revenue surged in 7M:15 (by 0.5 pps of GDP
y-o-y), in line with the sustained economic recovery, as did revenue
from PIT/CIT (up 0.3 pps of GDP y-o-y). These factors more than offset
the drop in revenue from social security contributions (SSC, down 0.2
pps of GDP y-o-y), following the reduction of their rates at end-2014.
The decline in revenue from SSC was smaller than expected, reflecting
improved tax compliance and a rise in employment. Non-tax revenue
also improved in 7M:15 (up 0.5 pps of GDP y-o-y), mainly due to the
better absorption of EU funds. On the other hand, despite lower interest
payments (down 0.1 pp of GDP y-o-y, due to the sharp decrease in
debt yields), spending controls eased slightly, with current spending
rising in 7M:15 (by 0.2 pps of GDP y-o-y), reflecting higher personnel
expenses and social transfers.
The FY:15 deficit target of 1.9% of GDP appears within reach,
despite a pre-election expansionary fiscal policy. In view of the y-t-d
overperformance of tax revenue, authorities revised the FY:15 budget
in July to increase budget spending while maintaining the deficit target
unchanged at 1.9% of GDP. In our view, the significant fiscal
consolidation recorded y-t-d provides enough fiscal space to increase
spending, without jeopardizing the FY:15 budget deficit target.
Indeed, budget revenue should continue to overperform, despite a
series of tax cuts. Specifically, the impact of the 5 pp cut in SSC rates is
estimated at 0.2 pps of GDP for the remainder of the year, while the
VAT cut on food (by 15 pps to 9%) in June is expected to cost another
0.3 pps of GDP. The revenue shortfall from these measures should be
more than offset, however, by the impact of: i) higher consumption,
especially following the VAT cut on food; and ii) the hike in public sector
wages (see below). Overall, we see tax revenue reaching 28.1% of
GDP in FY:15, slightly higher than the budget target of 27.9%.
Importantly, the strong tax revenue performance should help offset an
expected slippage in budget spending. The latter would most likely
come from the ongoing loosening in incomes policy. Specifically,
pensions have already been raised (by 5%), as has the minimum wage
(by 16.7% to RON 1,050), while targeted increases in public sector
wages and benefits as well as the early repayment of the remaining
salary rights due to be reinstated are on the cards, with the total cost
estimated at c. 0.6 pps of GDP for 8-12M:15. All said, we expect
current spending to accelerate in the coming months, bringing the
FY:15 figure to 29.3% of GDP, higher than the budget target of 29.1%.
A revised Fiscal Code (FC) endorsed by Parliament. Following the
President’s refusal to sign the FC in July, the Government agreed with
the opposition to moderate tax cuts, opening the way for ratification by
Parliament on September 3rd
. According to the changes passed, the
VAT will be cut by 4 pps to 20% in January 2016 and by an additional
1 pp to 19% in January 2017 (instead of a single-phased 5 pp cut in
2016), while the property tax on special constructions, the extra levy on
fuels and the 16% dividend tax will be maintained until end-2016
(instead of eliminating the first two and reducing the third one in
January 2016). Recall that the IMF/EU have opposed the tax cuts,
highlighting their impact on the sustainability of the country’s fiscal
position. We see the budget deficit widening to 2.8% of GDP in FY:16,
slightly lower than the EU threshold (3%), but much higher than the
target agreed under the EU Fiscal Pact (1.2%).

25 – 31 August 2015
NBG - South Eastern Europe and Mediterranean Emerging Market Economies - Weekly Report 3
Bulgaria BB+ / Baa2 / BBB- (S&P / Moody’s / Fitch)
Consolidated Budget (% of GDP)
2014
Outcome 7M:14 7M:15
2015 Budget
2015 NBG
Forecast
Total Revenue 35.8 20.5 22.8 36.3 37.0
Tax Revenue 28.0 16.1 17.3 28.7 29.4
Non-Tax Rev. 4.2 2.7 2.8 4.0 4.0
Grants 3.6 1.7 2.7 3.6 3.6
Total Expenditure 39.5 21.9 21.8 39.3 39.5
Current Spending 33.5 19.3 18.9 33.1 33.3
o/w Wages 5.6 3.2 3.2 5.2 5.4
Goods & Services 5.8 3.1 2.9 5.6 5.5
Subsidies 1.9 1.2 1.1 1.8 1.8
Social Spending 16.7 9.6 9.6 16.2 16.4
Interest Payments 0.7 0.6 0.6 1.0 0.9
Capital Expend. 6.0 2.6 2.9 6.2 6.2
Fiscal Balance -3.7 -1.4 0.9 -3.0 -2.5
-25
-20
-15
-10
-5
0
5
10
15
20
25
-6
-4
-2
0
2
4
6
01
/10
04
/10
07
/10
10
/10
01
/11
04
/11
07
/11
10
/11
01
/12
04
/12
07
/12
10
/12
01
/13
04
/13
07
/13
10
/13
01
/14
04
/14
07
/14
10
/14
01
/15
04
/15
07
/15
Tax Revenue, Primary Expenditure & Fiscal Balance (12-m rolling)
Tax Revenue (y-o-y % change, right scale)Primary Expenditure (y-o-y % change, right scale)
Fiscal Balance (as % of GDP, left scale)
3691215182124273033
369
1215182124273033
01
/10
04
/10
07
/10
10
/10
01
/11
04
/11
07
/11
10
/11
01
/12
04
/12
07
/12
10
/12
01
/13
04
/13
07
/13
10
/13
01
/14
04
/14
07
/14
10
/14
01
/15
04
/15
07
/15
Gross Public Debt & Fiscal Reserves(as % of GDP)
Gross Public Debt Fiscal Reserve Account
31 Aug. 3-M F 6-M F 12-M F
1-m SOFIBOR (%) 0.3 0.3 0.3 0.3
BGN/EUR 1.96 1.96 1.96 1.96
Sov. Spread (2017, bps) 75 78 74 70
31 Aug. 1-W % YTD % 2-Y %
SOFIX 459 1.3 -8.6 7.4
2012 2013 2014 2015F 2016F
Real GDP Growth (%) 0.5 1.1 1.7 1.6 2.2
Inflation (eop, %) 4.2 -1.6 -0.9 0.2 1.4
Cur. Acct. Bal. (% GDP) -0.3 1.9 0.9 2.5 1.5
Fiscal Bal. (% GDP) -0.4 -1.8 -3.7 -2.5 -2.0
An impressive fiscal consolidation in the first 7 months of 2015,
mainly on the back of base effects, with the 12-month rolling
deficit narrowing to 1.3% of GDP in July from 3.7% in December.
The consolidated budget recorded a surplus of 0.9% of GDP in the first
seven months of 2015 compared with a deficit of 1.4% in the same
period in 2014. This was the best performance since 2008, and was
mainly driven by an across-the-board improvement in budget revenue
(up 2.3 pps of GDP y-o-y in 7M:15). Specifically, tax revenue surged in
7M:15 (up 1.2 pps of GDP y-o-y), but this can be largely attributed to
strong base effects (recall that structural changes in the tax system in
early-2014 had caused delays in tax collection). In this context,
revenue from indirect taxes rose sharply in 7M:15 (by 0.8 pps of GDP
y-o-y, due also to lower VAT refunds compared with 7M:14), as did
revenue from social security contributions (up 0.3 pps of GDP y-o-y,
due to the hike in the minimum wage by 12% to EUR 195 in two
stages, improved tax compliance and an increase in employment).
Grants from the EU also increased in 7M:15 (by 1 pp of GDP y-o-y), on
the back of base effects from delayed refunds for expenses incurred at
end-2014. On the other side of the budget, current spending was
contained in 7M:15 (down 0.4 pps of GDP y-o-y), mainly on the back of
lower public consumption and subsidies, compensating for the rise in
public investment (up 0.3 pps of GDP y-o-y).
Although the fiscal performance is set to deteriorate during the
remainder of the year, the FY:15 deficit should undershoot its
target of 3% of GDP. In the absence of additional base effects, growth
in tax revenue should weaken during the remainder of the year,
reflecting the sluggish economic recovery (H2:15 nominal GDP growth
is projected at just 2.5% following an estimated 4% in H1:15, due, inter
alia, to persistently low inflation). Nevertheless, we still expect tax
collection to overshoot its FY:15 budget target, considering the
performance y-t-d (up 9.4% y-o-y in 7M:15 against a FY:15 target of
4.3%) and improving tax compliance.
At the same time, the FY:15 current spending target (up only 0.2%)
appears attainable, in view of the y-t-d performance (down 0.1% y-o-y
in 7M:15) and the implementation of a series of spending consolidation
measures. Key measures include: i) a significant reduction in the public
wage bill; ii) tighter means-testing; iii) lower transfers to the healthcare
system; and iv) an increase in the retirement age by 4 months. The
latter should reduce slightly the pension system’s deficit by 0.1 pp of
GDP to an estimated 2.5% in FY:15.
Public investment is also set to accelerate during the remainder of the
year, in view, inter alia, of the discrepancy between the y-t-d
absorption of EU funds and the execution of the investment
programme (0.7 pps of GDP). All said, despite higher interest
payments, we expect the consolidated budget deficit to narrow to 2.5%
of GDP in FY:15 from 3.7% in FY:14, overperforming its target and the
EU threshold (both at 3% of GDP), after having exceeded it by a wide
margin in FY:14.
Bulgaria’s largest ever sovereign debt issue in March provides
adequate financing until end-year. Recall that in its largest ever
sovereign debt sale, Bulgaria raised EUR 3.1bn (7.3% of GDP) from
international bond markets in March through a triple-tranche Eurobond
at favourable terms, restoring its fiscal reserves to more than adequate
levels (currently at EUR 10.7bn or 12.9% of GDP). Overall, we see
Bulgaria’s gross public debt rising to 30.5% of GDP at end-2015 from
28.1% at end-2014, still below the IMF-calculated average of emerging
and developing Europe (c. 45% of GDP).
25 – 31 August 2015
NBG - South Eastern Europe and Mediterranean Emerging Market Economies - Weekly Report 4
Serbia
BB- / B1 / B+ (S&P / Moody’s / Fitch)
-15
-5
5
15
25
35
45
-15
-5
5
15
25
35
45
Jun 0
8
De
c 0
8
Jun 0
9
De
c 0
9
Jun 1
0
De
c 1
0
Jun 1
1
De
c 1
1
Jun 1
2
De
c 1
2
Jun 1
3
De
c 1
3
Jun 1
4
De
c 1
4
Jun 1
5
Credit to the Private Sector(y-o-y % change)
CorporateLoans (FX adjusted)*Retail Loans (FX adjusted)* Total Loans (FX adjusted)*
Total Loans
* NBG estimates before October 2009** FX loans include FX denominated and linked Loans
-20
-10
0
10
20
30
40
50
-20
-10
0
10
20
30
40
50
Jun 0
8
De
c 0
8
Jun 0
9
De
c 0
9
Jun 1
0
De
c 1
0
Jun 1
1
De
c 1
1
Jun 1
2
De
c 1
2
Jun 1
3
De
c 1
3
Jun 1
4
De
c 1
4
Jun 1
5
Customer Deposits(y-o-y % change)
Total Deposits
Retail Deposits (FX adjusted) Total Deposits (FX adjusted)
Corporate Deposits (FX adjusted)
0
3
6
9
12
15
18
21
24
0
20
40
60
80
100
120
140
160
Jun 0
8
De
c 0
8
Jun 0
9
De
c 0
9
Jun 1
0
De
c 1
0
Jun 1
1
De
c 1
1
Jun 1
2
De
c 1
2
Jun 1
3
De
c 1
3
Jun 1
4
De
c 1
4
Jun 1
5
NPL and Liquidity Ratios
FX-denominated and linked Loans/ Total
loans (%, lhs)
NPL (%, rhs)
Loans/ Deposits (%, lhs)
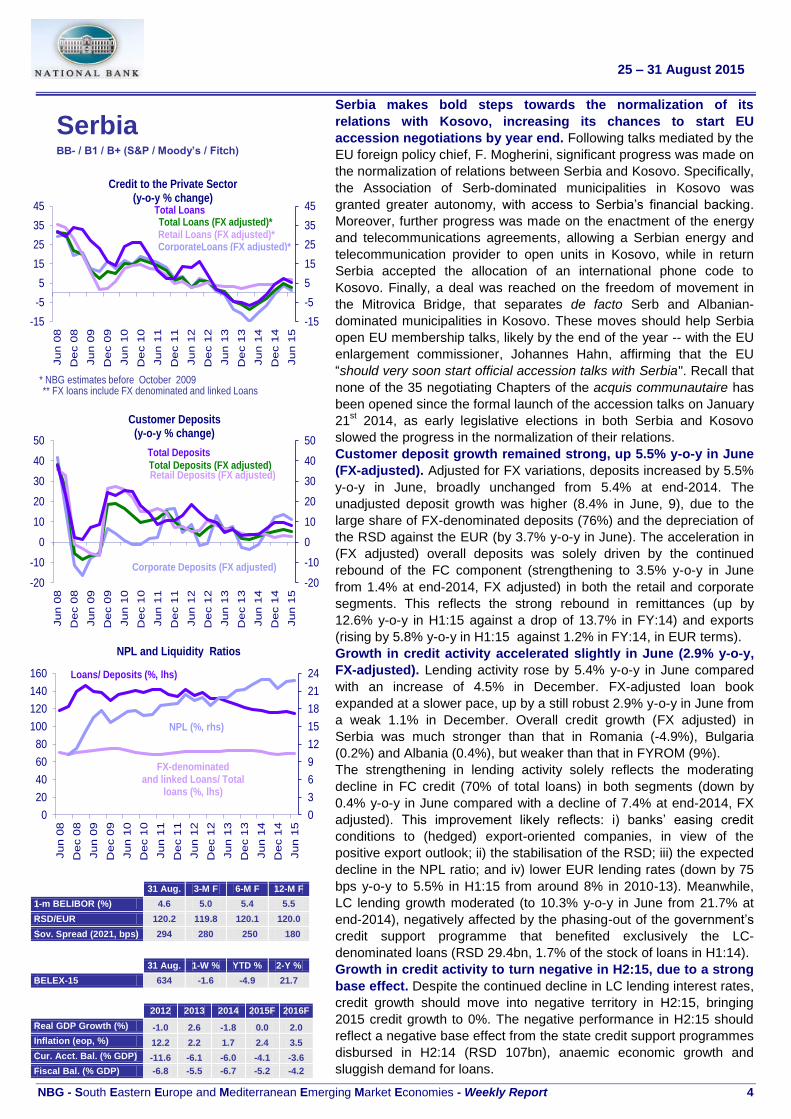
Serbia makes bold steps towards the normalization of its
relations with Kosovo, increasing its chances to start EU
accession negotiations by year end. Following talks mediated by the
EU foreign policy chief, F. Mogherini, significant progress was made on
the normalization of relations between Serbia and Kosovo. Specifically,
the Association of Serb-dominated municipalities in Kosovo was
granted greater autonomy, with access to Serbia’s financial backing.
Moreover, further progress was made on the enactment of the energy
and telecommunications agreements, allowing a Serbian energy and
telecommunication provider to open units in Kosovo, while in return
Serbia accepted the allocation of an international phone code to
Kosovo. Finally, a deal was reached on the freedom of movement in
the Mitrovica Bridge, that separates de facto Serb and Albanian-
dominated municipalities in Kosovo. These moves should help Serbia
open EU membership talks, likely by the end of the year -- with the EU
enlargement commissioner, Johannes Hahn, affirming that the EU
“should very soon start official accession talks with Serbia". Recall that
none of the 35 negotiating Chapters of the acquis communautaire has
been opened since the formal launch of the accession talks on January
21st 2014, as early legislative elections in both Serbia and Kosovo
slowed the progress in the normalization of their relations.
Customer deposit growth remained strong, up 5.5% y-o-y in June
(FX-adjusted). Adjusted for FX variations, deposits increased by 5.5%
y-o-y in June, broadly unchanged from 5.4% at end-2014. The
unadjusted deposit growth was higher (8.4% in June, 9), due to the
large share of FX-denominated deposits (76%) and the depreciation of
the RSD against the EUR (by 3.7% y-o-y in June). The acceleration in
(FX adjusted) overall deposits was solely driven by the continued
rebound of the FC component (strengthening to 3.5% y-o-y in June
from 1.4% at end-2014, FX adjusted) in both the retail and corporate
segments. This reflects the strong rebound in remittances (up by
12.6% y-o-y in H1:15 against a drop of 13.7% in FY:14) and exports
(rising by 5.8% y-o-y in H1:15 against 1.2% in FY:14, in EUR terms).
Growth in credit activity accelerated slightly in June (2.9% y-o-y,
FX-adjusted). Lending activity rose by 5.4% y-o-y in June compared
with an increase of 4.5% in December. FX-adjusted loan book
expanded at a slower pace, up by a still robust 2.9% y-o-y in June from
a weak 1.1% in December. Overall credit growth (FX adjusted) in
Serbia was much stronger than that in Romania (-4.9%), Bulgaria
(0.2%) and Albania (0.4%), but weaker than that in FYROM (9%).
The strengthening in lending activity solely reflects the moderating
decline in FC credit (70% of total loans) in both segments (down by
0.4% y-o-y in June compared with a decline of 7.4% at end-2014, FX
adjusted). This improvement likely reflects: i) banks’ easing credit
conditions to (hedged) export-oriented companies, in view of the
positive export outlook; ii) the stabilisation of the RSD; iii) the expected
decline in the NPL ratio; and iv) lower EUR lending rates (down by 75
bps y-o-y to 5.5% in H1:15 from around 8% in 2010-13). Meanwhile,
LC lending growth moderated (to 10.3% y-o-y in June from 21.7% at
end-2014), negatively affected by the phasing-out of the government’s
credit support programme that benefited exclusively the LC-
denominated loans (RSD 29.4bn, 1.7% of the stock of loans in H1:14).
Growth in credit activity to turn negative in H2:15, due to a strong
base effect. Despite the continued decline in LC lending interest rates,
credit growth should move into negative territory in H2:15, bringing
2015 credit growth to 0%. The negative performance in H2:15 should
reflect a negative base effect from the state credit support programmes
disbursed in H2:14 (RSD 107bn), anaemic economic growth and
sluggish demand for loans.
31 Aug. 3-M F 6-M F 12-M F
1-m BELIBOR (%) 4.6 5.0 5.4 5.5
RSD/EUR 120.2 119.8 120.1 120.0
Sov. Spread (2021, bps) 294 280 250 180
31 Aug. 1-W % YTD % 2-Y %
BELEX-15 634 -1.6 -4.9 21.7
2012 2013 2014 2015F 2016F
Real GDP Growth (%) -1.0 2.6 -1.8 0.0 2.0
Inflation (eop, %) 12.2 2.2 1.7 2.4 3.5
Cur. Acct. Bal. (% GDP) -11.6 -6.1 -6.0 -4.1 -3.6
Fiscal Bal. (% GDP) -6.8 -5.5 -6.7 -5.2 -4.2

25 – 31 August 2015
NBG - South Eastern Europe and Mediterranean Emerging Market Economies - Weekly Report 5
F.Y.R.O.M. BB- / NR / BB+ (S&P / Moody’s / Fitch)
31 Aug. 3-M F 6-M F 12-M F
1-m SKIBOR (%) 1.4 1.4 1.4 1.4
MKD /EUR
61.3 61.3 61.3 61.3
Sov. Spread (2021, bps) 410 380 350 280
31 Aug. 1-W % YTD % 2-Y %
MBI 100 1,666 -0.8 -9.6 2.0
2012 2013 2014 2015F 2016F
Real GDP Growth (%) -0.5 2.7 3.8 3.8 3.6
Inflation (eop, %) 4.7 1.4 -0.5 0.5 1.0
Cur. Acct. Bal. (% GDP) -3.0 -1.8 -1.3 -0.4 -2.5
Fiscal Bal. (% GDP) -3.8 -3.9 -4.2 -3.7 -3.5
Fitch assigns a negative outlook to FYROM’s long-term foreign
and local currency debt ratings. On August 21st, Fitch revised its
outlook on the country’s BB+ credit rating to negative from stable. The
move was mainly motivated by significant risks to political stability,
despite the signing in mid-July of an EU-mediated agreement between
the leaders of the main political parties to end a 15-month political
impasse. However, the agency refrained from downgrading the
country’s sovereign rating from BB+ (four notches below investment
grade), due to a track record of low macroeconomic volatility, above
peers’ GDP per capita, as well as a favourable business climate and a
high investment ratio. Note that Fitch rates FYROM two notches
above S&P (BB-).
The fiscal performance improved significantly in 7M:15, with the
12-month rolling deficit easing to 3.3% of GDP in July. The fiscal
deficit narrowed significantly by 0.9 pps y-o-y to 2% of GDP in 7M:15.
This positive performance reflects a broad-based improvement in
revenue (up 1.4 pps of GDP y-o-y). Indeed, tax collection surged in
7M:15 (up 1.1 pps of GDP y-o-y), despite a decline in VAT revenue,
supported by a series of revenue-enhancing measures. Specifically:
i) corporate tax revenue rose sharply in 7M:15 (up 0.9 pps of GDP
y-o-y), following the elimination of the tax exemption on undistributed
profits, effective since January 1st; ii) excise taxes also increased in
7M:15 (up 0.3 pps of GDP y-o-y), following a hike on excise duties of
petroleum and tobacco -- in line with the harmonization to EU
standards; and iii) revenue from social security contributions rose by
0.2 pps of GDP y-o-y in 7M:15, underpinned by a hike in the minimum
wage by 9% (to MKD 156/month) since January 1st. At the same time,
non-tax revenue also increased in 7M:15 (up 0.3 pps of GDP y-o-y),
on the back of higher foreign grants and dividends from public entities.
The fiscal performance would have been even better had current
expenditure not increased (up 0.8 pps y-o-y), on the back of higher
spending on social transfers and goods & services ahead of the April
2016 early legislative elections. With the July outcome, the 12-month
rolling deficit moderated to 3.3% of GDP in July from 4.2% in
December 2014.
The observance of the (upwardly) revised FY:15 fiscal deficit
target requires lower-than-planned expenditure. In view of the
revenue overperformance in H1:15 and ahead of the April 2016 snap
elections, Parliament approved a revised 2015 Budget in late-July,
envisaging higher-than-initially-projected revenue (by 0.7 pps of GDP)
and expenditure (by 1 pp of GDP), thereby raising the deficit to 3.7%
of GDP from 3.4%.
In our view, despite the strong y-t-d performance (a deficit of 2% of
GDP in 7M:15), the observance of the revised 2015 Budget target of
3.7% will require lower-than-budgeted expenditure. In our view,
despite the strong tax revenue overperformance (+13.7% y-o-y in
7M:15), the revised revenue growth target of 14.3% (from 11.9% in
the initial budget) appears unattainable due to an overly optimistic
non-tax revenue target. According to our baseline scenario, which
projects a lower-than-budgeted recovery in revenue growth in 8-
12M:15 (10.7% against a revised target of 15.1% y-o-y), the revenue
shortfall should amount to 0.5 pps of GDP for the full year. To make
up for this shortfall, expenditure growth should be contained in 8-
12M:15 (at 13% y-o-y against a revised target of 17% y-o-y), bringing
FY:15 spending growth to 9.6% y-o-y against a revised target of
11.3% and an initial target of 8.2%. In view of the authorities’ good
track record, the FY:15 deficit target of 3.7% is likely to be achieved.
Consolidated Fiscal Balance (% of GDP)
2014
7M:14
7M:15
Revised 2015
Budget
NBG 2015
Forecast
Revenue 27.8 15.5 16.9 30.5 30.0
Tax Revenue 24.6 13.8 14.9 26.1 26.3
Personal Inc. 2.3 1.3 1.3 2.4 2.4
Corporate Inc. 1.0 0.6 1.5 1.9 2.2
VAT 8.3 4.8 4.5 8.1 8.0
Excises 3.3 1.7 2.0 3.5 3.7
Import Duties 0.8 0.5 0.4 0.9 0.8
Other Taxes 0.5 0.1 0.1 0.3 0.2
Soc. Contrib. 8.4 4.7 5.0 8.6 8.7
Non-Tax revenue 3.2 1.7 2.0 4.4 3.7
Expenditure 32.0 18.4 19.0 34.2 33.7
Cur. Expenditure 28.6 16.6 17.4 30.1 29.9
Personnel 4.4 2.5 2.6 4.6 4.6
G. & Services 2.9 1.7 1.9 3.6 3.4
Transfers 20.3 11.8 12.1 20.7 20.7
Int.Payments 1.0 0.6 0.8 1.2 1.2
Capital Expend. 3.4 1.8 1.6 4.1 3.8
Fiscal Balance -4.2 -2.9 -2.0 -3.7 -3.7
Primary Balance -3.2 -2.4 -1.2 -2.5 -2.5
Consolidated Fiscal Balance (% of GDP)
2014
Initial 2015
Budget
Revised 2015
Budget
Revenue 27.8 29.8 30.5
Tax Revenue 24.6 25.2 26.1
Personal Inc. 2.3 2.1 2.4
Corporate Inc. 1.0 0.9 1.9
VAT 8.3 8.4 8.1
Excises 3.3 3.2 3.5
Import Duties 0.8 0.9 0.9
Other Taxes 0.5 0.5 0.3
Soc. Contrib. 8.4 8.9 8.6
Non-Tax revenue 3.2 4.7 4.4
Expenditure 32.0 33.2 34.2
Cur. Expenditure 28.6 29.3 30.1
Personnel 4.4 4.5 4.6
G. & Services 2.9 3.3 3.6
Transfers 20.3 20.4 20.7
Int.Payments 1.0 1.1 1.2
Capital Expend. 3.4 3.9 4.1
Fiscal Balance -4.2 -3.4 -3.7
Primary Balance -3.2 -2.3 -2.5

25 – 31 August 2015
NBG - South Eastern Europe and Mediterranean Emerging Market Economies - Weekly Report 6
Albania
B / B1 / NR (S&P / Moody’s / Fitch)
-10-505101520253035404550
-10-505
101520253035404550
Q2
:08
Q4
:08
Q2
:09
Q4
:09
Q2
:10
Q4
:10
Q2
:11
Q4
:11
Q2
:12
Q4
:12
Q2
:13
Q4
:13
Q2
:14
Q4:1
4
Q2
:15
Credit to the Private Sector and Customer Deposits (y-o-y % change)
Customer Deposits (FX-Adjusted)
Credit to the Private Sector
Customer Deposits
Credit to the Private Sector (FX-Adjusted)
50
60
70
80
90
100
110
120
50
60
70
80
90
100
110
120
Q2:0
8
Q4:0
8
Q2:0
9
Q4:0
9
Q2:1
0
Q4:1
0
Q2:1
1
Q4:1
1
Q2:1
2
Q4:1
2
Q2:1
3
Q4:1
3
Q2:1
4
Q4:1
4
Q2:1
5
Loans-to-Deposits Ratios (%)
Total Loans-to-Total Deposits
FX Loans-to-FX Deposits
02468101214161820222426
02468
101214161820222426
Q2:0
8
Q4:0
8
Q2:0
9
Q4:0
9
Q2:1
0
Q4:1
0
Q2:1
1
Q4:1
1
Q2:1
2
Q4:1
2
Q2:1
3
Q4:1
3
Q2:1
4
Q4:1
4
Q2:1
5
NPL RatioLoss Loans Rate (%, left scale)
Doubtful Loans Rate (%, left scale)
Substandard Loans Rate (%, left scale)
Overall NPL Ratio (%, left scale)
31 Aug. 3-M F 6-M F 12-M F
1-m TRIBOR (mid, %) 2.7 2.9 3.0 3.2
ALL/EUR 139.7 141.2 140.2 140.5
Sov. Spread (bps) 316 300 260 200
31 Aug. 1-W % YTD % 2-Y %
Stock Market - - - - - - - - - - - -
2012 2013 2014 2015F 2016E
Real GDP Growth (%) 1.4 1.1 2.1 3.0 3.6
Inflation (eop, %) 2.4 1.9 0.7 1.5 1.5
Cur. Acct. Bal. (% GDP) -10.2 -10.8 -13.1 -12.8 -12.4
Fiscal Bal. (% GDP) -3.4 -5.0 -5.2 -2.8 -2.0
Customer deposit growth remains subdued, up 1.9% y-o-y in June.
Customer deposit growth decelerated to 1.9% y-o-y in June from 2.4%
at end-2014. From a segment perspective, retail deposits (accounting
for a sizeable 90% of total deposits) accelerated slightly to 1.1% y-o-y
in June from 0.5% in December, on the back of the continued decline in
the unemployment rate (to 17.3% in Q1:15 from 18% in Q4:14), as well
as the rebound in economic activity (estimated to have accelerated to
3% y-o-y in H1:15 from 1.9% in FY:14) and the continued recovery in
remittances. Note that retail deposit growth would have been stronger
had households not continued to invest heavily in high-yielding
domestic debt. Indeed, in H1:15, the difference between the 12-month
T-bill rate and the 12-month deposit interest rate (which reached a low
of 1.5% in June) was 2 pps, widening from 1.5 pps in FY:14 and 1 pp in
FY:13.
On the other hand, corporate deposit growth moderated to a still robust
8.9% y-o-y in June from (a 4-year high of) 20% in December, due to a
moderation in the LC segment, likely reflecting the slowdown in the
clearance of government arrears (ALL 12.6bn in H1:15, or 1.3% of
deposits, following the disbursement of ALL 19.1bn in H1:14, or 2.1% of
deposits).
Credit activity growth moderates to just 0.3% y-o-y in June, likely
due to large loan write-offs. Private sector credit growth eased to a
mere 0.3% y-o-y in June from 2% at end-2014. The weakening was
likely driven by loan write-offs, especially due to the compulsory write-
off of loans held in “loss” category for more than 3 years, as at January
1st 2015 (estimated to reduce NPLs by 3 pps, according to the IMF). In
fact, “loss” loans declined to 10.3% of total loans in June from 11.8% in
December 2014 (a decline of ALL 8.7bn in “loss” loan stock). Excluding
this once-off, credit growth is estimated to have remained broadly
unchanged at 2% y-o-y in June.
Importantly, retail lending (30% of total loans) remains the only source
of credit growth (up 2.5% y-o-y in June from just 1.2% in December
2014). Note that bank lending to households has been underpinned by:
i) favourable LC lending interest rates, following the sharp monetary
policy easing (since the start of the cycle of monetary policy loosening
in September 2011, the average LC lending interest rate has declined
by 2.7 pps to 8.4% in June); ii) ample liquidity in the banking sector
(with ratios for total net loans-to-total deposits at an estimated 45% in
June) and non-reliance on foreign financing; as well as iii) a low loan
penetration rate in the retail segment (just 10.9% of GDP in June).
On the other hand, loan growth in the corporate segment turned
negative (down 0.6% y-o-y in June against a rise of 2.4% in December
2014). This reflects still high bank risk aversion to the corporate
segment, holding the majority of NPLs.
Credit growth to remain sluggish until end-2015. Bank lending is set
to remain weak this year on the back of the ongoing cleaning-up of
bank balance sheets. Credit is set to pick up gradually thereafter,
supported by further easing of credit standards by banks, on the back
of improved asset quality. The latter should be driven by: i) the
clearance of accumulated arrears by the Government (set to reduce the
NPL ratio by 5-6 pps according to BoA estimates); and ii) the
completion of compulsory write-off of loans held in “loss” category. Note
that these measures have started to bear fruit, with the NPL ratio falling
to a 13-quarter low of 20% in Q2:15 from a peak of 24.9% in Q3:14. Moreover, the BoA’s expected resolution plan for large borrowers and
the review of the bankruptcy framework (e.g. slow court collateral
execution affects about 20% of total loans, according to the IMF), which
aims to facilitate restructuring, should also contribute to the rebound in
credit activity.
25 – 31 August 2015
NBG - South Eastern Europe and Mediterranean Emerging Market Economies - Weekly Report 7
Cyprus B+ / B3 / B- (S&P / Moody’s / Fitch)
-12
-9
-6
-3
0
3
6
9
12
15
-12
-9
-6
-3
0
3
6
9
12
15
7M
:10
7M
:11
7M
:12
7M
:13
7M
:14
7M
:15
Israel UK Russia Other y-o-y % change
Contribution Rates to Tourist Arrivals Growth (pps) Contribution Rates to Tourist Arrivals Growth (pps)
-16
-12
-8
-4
0
4
8
12
16
2000
2080
2160
2240
2320
2400
2480
2560
07
/09
10
/09
01
/10
04
/10
07
/10
10
/10
01
/11
04
/11
07
/11
10
/11
01
/12
04
/12
07
/12
10
/12
01
/13
04
/13
07
/13
10
/13
01
/14
04
/14
07
/14
10
/14
01
/15
04
/15
07
/15
Tourist Arrivals (12-M Rolling Sum)
Level (in '000, lhs)y-o-y % change (rhs)
-18
-14
-10
-6
-2
2
6
10
14
18
1000
1200
1400
1600
1800
2000
2200
07
/09
10
/09
01
/10
04
/10
07
/10
10
/10
01
/11
04
/11
07
/11
10
/11
01
/12
04
/12
07
/12
10
/12
01
/13
04
/13
07
/13
10
/13
01
/14
04
/14
07
/14
10
/14
01
/15
04
/15
07
/15
Tourist Receipts (12-M Rolling Sum)
Level (in EURmn, lhs)y-o-y % change (rhs)
31 Aug. 3-M F 6-M F 12-M F
1-m EURIBOR (%) -0.10 -0.10 -0.10 -0.10
EUR/USD 1.12 1.08 1.05 1.00
Sov. Spread (2020, bps) 348 320 280 200
31 Aug. 1-W % YTD % 2-Y %
CSE Index 79 0.4 -8.4 -16.6
2012 2013 2014 2015F 2016F
Real GDP Growth (%) -2.4 -5.4 -2.3 0.7 1.8
Inflation (eop, %) 1.1 -2.3 -1.5 -0.6 1.0
Cur. Acct. Bal. (% GDP) -6.3 -3.0 -5.1 -5.0 -4.5
Fiscal Bal. (% GDP) -4.6 -4.7 0.4 -1.0 0.0
A positive Troika mission statement following the 7th
review of the
financial assistance programme. On July 27th, the Troika mission
successfully completed the 7th
review of the country’s EUR 10bn
financial assistance programme approved in late-March 2013. It
commended, inter alia, the authorities’ commitment to the programme,
the return to positive economic growth since Q1:15, and the gradual
decline in unemployment, albeit to still-high levels.
However, it stressed that the approval of the review by the Eurogroup
will hinge on the completion of 3 prior actions: i) parliamentary approval
of the legislation regulating the pending issue of property buyers, who
have not secured title deeds; ii) Cabinet approval of a bill allowing the
conversion of the semi-government telecoms utility CyΤΑ into a limited
liability company (first phase of the privatization of CyΤΑ); and
iii) Cabinet approval of a reform package, including a revision of the
wage setting framework and the opening of promotion posts in the
public sector. The first prior action is expected to be completed in the
coming days, while the other two were met on August 26th.
We expect the 7th review to be completed by the Eurogroup in early-
October, which will open the door for the disbursement of EUR 500mn
by the ESM, bringing total disbursements to EUR 7bn, out of a total of
EUR 10bn. This will also allow the Central Bank of Cyprus and the ECB
to resume the purchase of Cypriot bonds in the secondary market in the
context of the ECB’s quantitative easing programme.
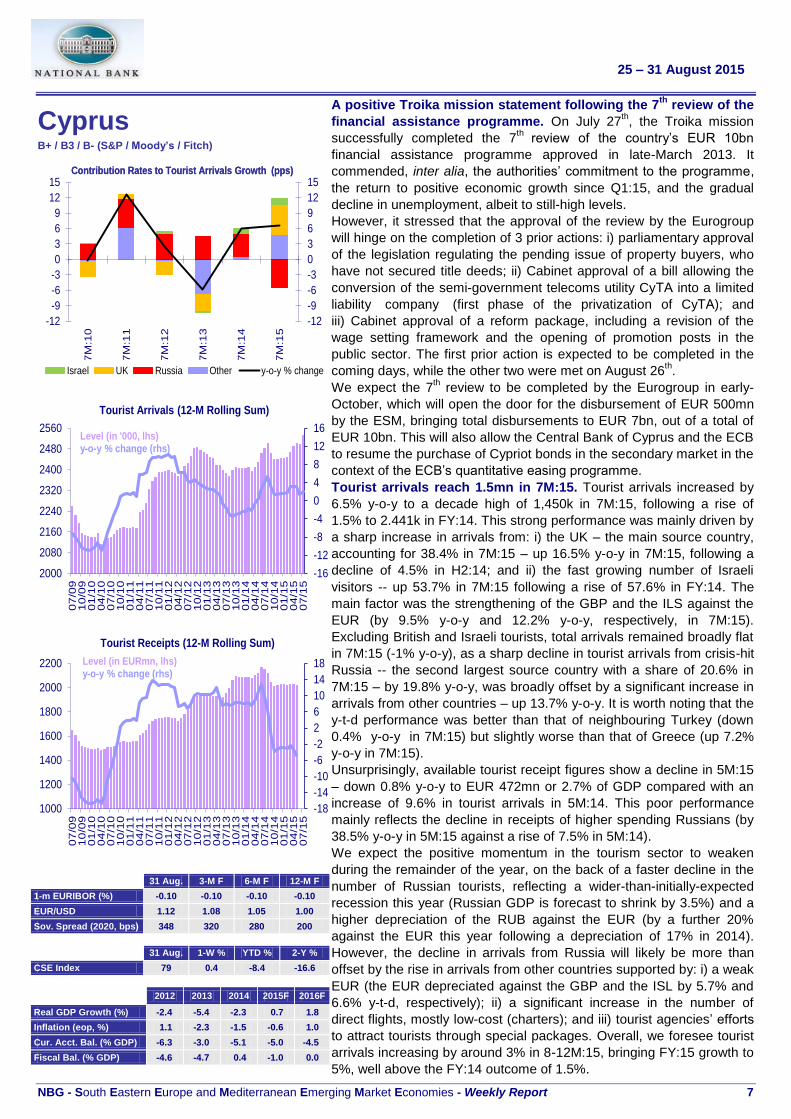
Tourist arrivals reach 1.5mn in 7M:15. Tourist arrivals increased by
6.5% y-o-y to a decade high of 1,450k in 7M:15, following a rise of
1.5% to 2.441k in FY:14. This strong performance was mainly driven by
a sharp increase in arrivals from: i) the UK – the main source country,
accounting for 38.4% in 7M:15 – up 16.5% y-o-y in 7M:15, following a
decline of 4.5% in H2:14; and ii) the fast growing number of Israeli
visitors -- up 53.7% in 7M:15 following a rise of 57.6% in FY:14. The
main factor was the strengthening of the GBP and the ILS against the
EUR (by 9.5% y-o-y and 12.2% y-o-y, respectively, in 7M:15).
Excluding British and Israeli tourists, total arrivals remained broadly flat
in 7M:15 (-1% y-o-y), as a sharp decline in tourist arrivals from crisis-hit
Russia -- the second largest source country with a share of 20.6% in
7M:15 – by 19.8% y-o-y, was broadly offset by a significant increase in
arrivals from other countries – up 13.7% y-o-y. It is worth noting that the
y-t-d performance was better than that of neighbouring Turkey (down
0.4% y-o-y in 7M:15) but slightly worse than that of Greece (up 7.2%
y-o-y in 7M:15).
Unsurprisingly, available tourist receipt figures show a decline in 5M:15
– down 0.8% y-o-y to EUR 472mn or 2.7% of GDP compared with an
increase of 9.6% in tourist arrivals in 5M:14. This poor performance
mainly reflects the decline in receipts of higher spending Russians (by
38.5% y-o-y in 5M:15 against a rise of 7.5% in 5M:14).
We expect the positive momentum in the tourism sector to weaken
during the remainder of the year, on the back of a faster decline in the
number of Russian tourists, reflecting a wider-than-initially-expected
recession this year (Russian GDP is forecast to shrink by 3.5%) and a
higher depreciation of the RUB against the EUR (by a further 20%
against the EUR this year following a depreciation of 17% in 2014).
However, the decline in arrivals from Russia will likely be more than
offset by the rise in arrivals from other countries supported by: i) a weak
EUR (the EUR depreciated against the GBP and the ISL by 5.7% and
6.6% y-t-d, respectively); ii) a significant increase in the number of
direct flights, mostly low-cost (charters); and iii) tourist agencies’ efforts
to attract tourists through special packages. Overall, we foresee tourist
arrivals increasing by around 3% in 8-12M:15, bringing FY:15 growth to
5%, well above the FY:14 outcome of 1.5%.

25 – 31 August 2015
NBG - South Eastern Europe and Mediterranean Emerging Market Economies - Weekly Report 8
Egypt
B- / B3 / B (S&P / Moody’s / Fitch)
Results of Lower House Elections(Nov. 2011 - Jan. 2012)
Wafd(38 seats)
Freedom & Justice
(223 seats)
Nour(111 seats)
Others (24 seats)
Wasat (10 seats)Building & Development (13 seats)
Social Democrats (14 seats)Free Egyptians (17 seats)
Independent (21 seats)
Mubarak-linked(27 seats)
-40
-30
-20
-10
0
10
20
30
40
0
2
4
6
8
10
12
14
2005/0
6
2006/0
7
2007/0
8
2008/0
9
2009/1
0
2010/1
1
2011/1
2
2012/1
3
2013/1
4
2014/1
5
Tourist Arrivals (mn)
Level (left scale) y-o-y % change (right scale)
Start of Revolution: mid-2010/11Overthrow of Islamist President Mursi: early 2013/14
-50-40-30-20-1001020304050
0
2
4
6
8
10
12
2005/0
6
2006/0
7
2007/0
8
2008/0
9
2009/1
0
2010/1
1
2011/1
2
2012/1
3
2013/1
4
2014/1
5
Tourism Revenue (bn USD)
Level (left scale) y-o-y % change (right scale)
Start of Revolution: mid-2010/11Overthrow of Islamist President Mursi: early 2013/14
31 Aug. 3-M F 6-M F 12-M F
1-m CAIBOR (%) 9.3 9.3 8.8 8.8
EGP/USD 7.81 7.65 7.80 8.00
Sov. Spread (2020. bps) 355 255 240 220
31 Aug. 1-W % YTD % 2-Y %
HERMES 100 654 7.8 -21.6 21.1
11/12 12/13 13/14 14/15F 15/16F
Real GDP Growth (%) 2.2 2.1 2.1 4.2 3.8
Inflation (eop. %) 7.3 9.8 8.2 11.4 10.8x
Cur. Acct. Bal. (% GDP) -4.0 -2.4 -0.8 -3.5 -2.8
Fiscal Bal. (% GDP) -10.8 -13.7 -12.8 -13.0 -13.0
Long-awaited parliamentary elections to begin on October 17th
.
The Higher Electoral Commission (HEC) announced on August 30th
that parliamentary elections will be held in two stages, beginning on
October 17th and ending on December 2
nd. Specifically: i) the first
phase of the elections will commence on October 17th-18
th for
Egyptians abroad and on October 18th-19
th for Egyptian residents, with
run-offs on October 26th-27
th and October 27
th-28
th, respectively; and
ii) the second phase will commence on November 21st-22
nd for
Egyptians abroad and November 22nd
-23rd
for Egyptian residents, with
run-offs on November 30th-December 1
st and on December 1
st-2
nd,
respectively.
Parliamentary elections were previously scheduled to be held last
March, but were postponed by the HEC after the Supreme
Constitutional Court ruled unconstitutional two election laws (on the
division of electoral constituencies and the workings of the House of
Representatives). Recall that Egypt has been without a parliament for
more than 3 years, after the House of Representatives, elected in late-
2011, was dissolved in June 2012, following a court ruling that judged
the law that regulated its election to be unconstitutional. Until a newly-
elected Parliament convenes, President el-Sissi will continue to hold
all legislative powers.
Encouragingly, the majority of opposition parties have confirmed that
they will not boycott the upcoming elections, despite their fierce
criticism of the new election law. According to the opposition parties,
the latter will return the country to a system similar to that of the pre-
revolution regime. Specifically, the new law attributes the majority of
seats in Parliament to individuals (448 seats out of a total of 596)
rather than party-list candidates (120 seats); in contrast to previous
post-Revolution legislation (March 2011), which allotted ⅔ of seats to
party lists and ⅓ to individuals. Note that the remaining 28 seats will
be named by the President, according to the Constitution. The new
election law is widely considered as a serious setback for political
parties, but favourable to the wealthy, popular, and “close-to-power”
individuals, as was the case under Mubarak’s rule.
Tourism revenue posted impressive growth in FY:14/15 (c. 43% in
USD terms). Tourist arrivals soared by 28.9% to 10.3mn in FY:14/15
(July 2014-June 2015), following a sharp decline of 34.8% to 8.0mn in
FY:13/14, reflecting increasing security concerns and heightening
violence following the removal of Islamist President Mursi from office
(July 2013). The impressive FY:14/15 performance reflects not only a
base effect, but also easing of security concerns and a calmer political
climate following the election of President el-Sissi in May 2014, which
led several European countries to remove travel bans imposed on
Egypt. However, despite their surge in FY:14/15, tourist arrivals
remain 30.3% below their peak of 14.7mn, reached on the eve of the
January 2011 Revolution.
Moreover, average numbers of overnights and daily spending per
tourist rose to 9.7 and USD 74, respectively, in FY:14/15 from 9.2 and
USD 70 in FY:13/14, resulting in a surge in tourist revenue by 43.1%
to USD 7.3bn (2.2% of GDP).
As a result, the tourism sector -- accounting for c. one tenth of the
country’s GDP and representing one of the main sources of foreign
currency along with workers’ remittances, oil & gas exports, and Suez
Canal – would have: i) added 0.7 pps to overall GDP growth in
FY:14/15 (after having subtracted 0.9 pps in FY:13/14); and ii) seen its
contribution to FX reserves increasing by USD 2.2bn in FY:14/15 from
a multi-year low of USD 5.1bn in FY:13/14.
25 – 31 August 2015
NBG - South Eastern Europe and Mediterranean Emerging Market Economies - Weekly Report 9
FOREIGN EXCHANGE MARKETS, AUGUST 31ST
2015
Against EUR
Currency
2015 2014 2013
SPOT 1-week
%change 1-month %change
YTD %change*
1-year %change
12-month Low
12-month High
3-month Forward
rate**
6-month Forward
rate**
12-month Forward
rate**
%
change*
%
change*
Albania ALL 139.7 0.2 0.9 0.1 0.2 138.7 142.4 144.2 144.2 144.4 0.4 0.0
Bulgaria BGL 1.96 0.0 0.0 0.0 0.0 26.96 26.96 1.96 1.96 1.96 0.0 0.0
Egypt EGP 8.48 1.6 2.2 2.1 14.1 7.96 9.75 9.27 9.26 - - - 10.5 -11.8
FYROM MKD 61.3 0.0 0.0 0.0 0.0 86.3 86.3 61.3 61.3 61.3 0.0 0.0
Romania RON 4.41 0.2 1.8 1.6 1.0 4.37 4.51 4.42 4.44 4.48 -0.3 -1.2
Russia RUB 61.6 0.9 -0.5 19.2 -22.9 47.0 85.7 63.6 65.6 69.2 -38.0 -12.7
Serbia RSD 120.1 0.0 0.5 1.0 -3.2 106.8 123.5 121.8 123.4 128.9 -5.6 -1.8
South Africa ZAR 13.5 1.7 2.5 4.0 7.0 12.7 14.6 13.7 13.9 14.5 3.0 -22.4
Turkey YTL 2.92 -0.3 4.7 -3.3 -1.6 2.63 3.11 3.00 3.08 3.24 4.0 -20.2
Ukraine UAH 24.7 -0.1 0.7 -22.6 -36.4 15.5 38.3 32.1 - - - - - - -40.9 -6.3
US USD 1.08 1.6 4.9 11.8 24.9 1.05 1.35 1.08 1.09 1.09 13.6 -4.1
JAPAN JPY 134.5 1.0 3.5 7.7 1.9 127.0 149.3 134.5 134.5 134.5 -0.1 -20.5
UK GBP 0.70 2.2 2.7 11.7 13.8 0.69 0.80 0.70 0.70 0.70 7.0 -2.3
* Appreciation (+) / Depreciation (-)
** Forward rates have been calculated using the uncovered interest rate parity for Albania Egypt Ukraine and FYROM
MONEY MARKETS, AUGUST 31ST
2015
Albania Bulgaria Cyprus Egypt FYROM Romania Russia Serbia Turkey South Africa
Ukraine EA US
O/N 2.2 0.1 -0.1 8.9 0.9 0.5 12.3 - - - 11.3 5.7 20.5 -0.1 0.1
T/N - - - - - - - - - - - - - - - 0.5 - - - 4.6 - - - - - - - - - - - - - - -
S/W 2.3 0.1 - - - 9.1 - - - 0.7 - - - 4.6 - - - - - - 21.3 - - - - - -
1-Month 2.7 0.3 -0.1 9.3 1.5 1.0 12.4 5.2 11.3 6.0 24.3 -0.1 0.2
3-Month - - - 0.4 0.0 - - - - - - - - - - - - - - - 11.3 - - - - - - 0.0 - - -
6-Month 3.2 0.5 0.0 9.3 1.8 1.3 12.4 5.7 11.3 6.2 27.8 0.0 0.3
9-Month 3.3 1.0 0.0 9.4 2.0 1.6 12.4 6.0 11.3 6.8 - - - 0.0 0.5
1-Year 3.5 1.7 0.2 - - - 2.5 1.6 - - - - - - 11.4 7.4 - - - 0.2 0.8
LOCAL DEBT MARKETS, AUGUST 31ST
2015
Albania Bulgaria Cyprus Egypt FYROM Romania Russia Serbia Turkey South Africa
Ukraine EU US
3-Month 3.0 0.8 - - - 11.5 - - - - - - - - - 5.1 - - - - - - - - - -0.2 0.0
6-Month 3.1 0.8 - - - 11.6 1.3 1.4 - - - 5.6 10.0 - - - - - - -0.2 0.1
12-Month 3.3 1.0 - - - 11.7 1.5 1.6 10.3 6.4 9.8 - - - 7.0 -0.2 0.3
2-Year - - - 1.1 - - - - - - 2.2 1.9 10.7 - - - 9.5 6.7 - - - -0.2 0.7
3-Year 5.5 1.4 - - - - - - 2.7 2.1 10.7 - - - 9.4 7.1 - - - -0.2 1.1
5-Year - - - 1.9 3.5 13.9 2.7 2.9 10.6 9.0 9.4 7.7 - - - 0.1 1.7
7-Year - - - 2.6 - - - 14.3 - - - 3.3 10.6 - - - 9.2 - - - - - - 0.4 2.1
10-Year - - - 3.3 - - - 15.0 3.8 4.0 - - - - - - 9.1 8.2 - - - 0.8 2.4
15-Year - - - - - - - - - - - - 4.0 4.4 10.5 - - - - - - 8.6 - - - 1.0 - - -
25-Year - - - - - - - - - - - - - - - - - - - - - - - - - - - 8.8 - - - 1.4 - - -
30-Year - - - - - - - - - - - - - - - - - - - - - - - - - - - 8.9 - - - 1.5 3.1
*For Albania, FYROM and Ukraine primary market yields are reported

25 – 31 August 2015
NBG - South Eastern Europe and Mediterranean Emerging Market Economies - Weekly Report 10
SOVEREIGN EUROBOND SUMMARY, AUGUST 31ST
2015
Currency
Rating
S&P / Moody’s Maturity
Amount Outstanding (in million)
Mid
Yield
Gov.
Spread
Asset Swap
Spread
Albania 7.5% '15 EUR B/B1 4/11/2015 300 3.3 361 345
Bulgaria 4.25% '17 EUR BB+/Baa2 9/7/2017 950 0.6 81 50
Bulgaria 2.0% '22 EUR BB+/Baa2 26/3/2022 1,250 2.4 219 171
Bulgaria 2.95% '24 EUR BB+/Baa2 3/9/2024 1,493 3.0 239 196
Bulgaria 2.62% '27 EUR BB+/Baa2 26/3/2027 1,000 3.3 255 190
Bulgaria 3.12% '35 EUR BB+/Baa2 26/3/2035 850 4.0 279 221
Cyprus 4.75% '16 EUR NA/NA 25/2/2016 170 3.8 410 382
Cyprus 4.75% '19 EUR B+/NA 25/6/2019 750 3.4 348 314
Cyprus 4.62% '20 EUR B+/B3 3/2/2020 796 3.3 335 303
Cyprus 3.875 ‘22 EUR NA/B3 6/5/2022 1,000 3.5 321 283
Egypt 3.5% '16 USD NA/NA 25/2/2016 1,000 2.5 206 197
Egypt 5.75% '20 USD B-/B3 29/4/2020 1,000 4.7 305 297
Egypt 5.875% ‘25 USD NA/NA 11/6/2025 1,500 6.1 370 352
Egypt 6.875% '40 USD B-/B3 30/4/2040 500 7.1 402 409
FYROM 3.975% '21 EUR BB-/NA 24/7/2021 500 4.6 440 388
Romania 6.5% '18 EUR BBB-/Baa3 18/6/2018 1,500 0.8 96 67
Romania 4.62% '20 EUR BBB-/Baa3 18/9/2020 2,000 1.8 169 141
Romania 4,375% '23 USD BBB-/Baa3 22/8/2023 1,500 3.7 158 147
Romania 3.625% '24 EUR BBB-/Baa3 24/4/2024 1,250 2.7 213 179
Romania 6.125% '44 USD BBB-/Baa3 22/1/2044 1,000 5.1 201 238
Russia 3.25% '17 USD BB+/Ba1 4/4/2017 2,000 2.1 158 120
Russia 3.5% '19 USD BB+/Ba1 16/1/2019 1,500 3.6 193 209
Russia 5% '20 USD BB+/Ba1 29/4/2020 3,500 4.0 238 229
Russia 4.875% '23 USD BB+/Ba1 16/9/2023 3,000 4.9 269 258
Russia 12.75% '28 USD BB+/Ba1 24/6/2028 2,500 6.2 358 483
Serbia 5.25% '17 USD BB-/B1 21/11/2017 750 3.5 305 245
Serbia 5.875% '18 USD BB-/B1 3/12/2018 1,000 4.0 307 266
Serbia 4.875% '20 USD BB-/B1 25/2/2020 1,500 4.5 282 272
Serbia 7.25% '21 USD BB-/B1 28/9/2021 2,000 4.8 278 291
Serbia 6.75% '24 USD BB-/NA 1/11/2024 351 6.5 413 430
S. Africa 8.5% '17 USD BBB-/Baa2 23/6/2017 141 1.1 62 19
S. Africa 6.875% '19 USD BBB-/Baa2 27/5/2017 2,000 2.9 121 145
S. Africa 5.875% '25 USD BBB-/Baa2 16/9/2025 2,000 4.5 209 212
S. Africa 6.25% '41 USD BBB-/Baa2 8/3/2041 750 5.3 218 261
Turkey 7% '16 USD NR/Baa3 26/9/2016 2,000 1.1 67 53
Turkey 5.5% '17 EUR NR/Baa3 16/2/2017 1,500 0.9 118 86
Turkey 5.875% '19 EUR NR/Baa3 2/4/2019 1,250 1.8 211 170
Turkey 7% '20 USD NR/Baa3 5/6/2020 2,000 3.7 205 208
Turkey 6.25% '22 USD NR/Baa3 26/9/2022 2,500 4.3 217 225
Turkey 7.375% '25 USD NR/Baa3 5/2/2025 3,250 4.7 234 256
Turkey 11.875% '30 USD NR/Baa3 15/1/2030 1,500 5.1 251 348
Turkey 8% '34 USD NR/Baa3 14/2/2034 1,500 5.4 250 314
Turkey 6,875% '36 USD NR/Baa3 17/3/2036 2,750 5.5 256 295
Turkey 7.25% '38 USD NR/Baa3 5/3/2038 1,000 5.5 258 304
Turkey 6.75% '40 USD NR/Baa3 30/5/2040 2,000 5.6 256 294
Ukraine 6.58% '16 USD CC/Ca 21/11/2016 1,000 59.2 5,869 3,865
Ukraine 9.25% '17 USD CC/Ca 24/7/2017 2,600 46.7 4,621 3,074
Ukraine 7.75% '20 USD CC/Ca 23/9/2020 1,500 23.5 2,180 1,485
Ukraine 7.8% '22 USD CC/Ca 28/11/2022 2,250 19.1 1,675 1,176
Ukraine 7.5% '23 USD CC/Ca 17/4/2023 1,250 18.5 1,609 1,122

25 – 31 August 2015
NBG - South Eastern Europe and Mediterranean Emerging Market Economies - Weekly Report 11
CORPORATE BONDS SUMMARY, AUGUST 31ST
2015
Currency
Rating
S&P / Moody’s Maturity
Amount Outstanding (in million)
Mid
Yield
Gov.
Spread
Asset Swap
Spread
Bulgaria Bulgaria Energy Hld 4.25% ‘18 EUR NA/NA 7/11/2018 500 4.5 468 420
Bulgarian Telecom. 6.625% ‘18 EUR B/B1 15/11/2018 400 6.0 615 556
Cyprus Bank of Cyprus Pcl 0% '17 EUR ΝΑ/Β3 15/10/2017 1,000 2.8 306 - - -
Aroundtown Property 3% '21 EUR NA/NA 9/12/2021 200 4.1 404 331
Russia VEB-Leasing OAO 5.5% '17 USD NA/NA 30/6/2017 100 3.7 274 276
VEB-Leasing OAO 4% ‘18 USD NA/NA 4/6/2018 100 4.5 355 313
South Africa FirstRand Bank Ltd 4.375% '16 USD BBB-/Baa2 9/6/2016 500 1.2 92 73
FirstRand Bank Ltd 2.25% '20 EUR NA/NA 30/1/2020 100 3.0 293 255
Turkey
Vakiflar Bankasi 3.5% ‘19 EUR NA/Baa3 17/6/2019 500 3.1 323 280
Garanti Bankasi 3.38%‘19 EUR NA/Baa3 8/7/2019 500 2.7 285 243
Arcelik AS 3.875% ‘21 EUR BB+/NA 16/9/2021 350 3.7 385 309
Turkiye Is Bankasi 6% ‘22 USD NA/Ba2 24/10/2022 1,000 5.8 372 354
CREDIT DEFAULT SWAP SPREADS, AUGUST 31ST
2015
Albania Bulgaria Cyprus Egypt FYROM Romania Russia Serbia Turkey South Africa Ukraine
5-year - - - 176 322 313 - - - 124 309 273 215 208 2,207
10-Year - - - 224 346 327 - - - 167 323 314 263 263 - - -
STOCK MARKETS PERFORMANCE, AUGUST 31ST
2015
2015 2014 2013
Local Currency Terms
EUR
Terms
Local Currency
Terms
EUR
terms
Local Currency
terms
EUR
terms
Level 1-week
% change
1-month
% change
YTD
% change
1-year
% change
12-month
Low
12-month
High
YTD
% change % change % change
Bulgaria (SOFIX) 477 1.3 -1.2 -8.6 -11.6 471 560 -8.6 6.2 6.2 43.0 43.0
Cyprus (CSE GI) 77 -0.8 0.1 -9.6 -33.4 75 119 -9.6 -17.0 -17.0 -15.7 -15.7
Egypt (HERMES) 715 5.0 -6.5 -14.3 -16.1 681 946 -12.9 23.5 35.0 19.1 3.1
F.Y.R.O.M (MBI) 1,666 2.7 1.8 -9.7 4.3 1,590 1,876 -9.7 6.1 6.1 0.1 0.1
Romania (BET-BK) 1,423 3.2 5.1 8.8 15.1 1,225 1,423 10.5 3.7 3.5 11.4 12.5
Russia (RTS) 1,627 -1.0 -2.2 16.5 14.4 1,334 1,838 29.0 -7.1 -38.4 -0.7 -13.1
Serbia (BELEX-15) 655 1.0 -2.7 -1.7 12.3 578 747 -0.7 19.5 12.9 6.3 2.9
South Africa (FTSE/JTS) 52,988 1.0 2.3 6.5 2.5 46,673 55,188 10.7 7.6 10.8 15.5 -10.6
Turkey (ISE 100) 81,320 -2.5 -1.4 -5.1 -1.2 72,944 91,413 -8.2 26.4 31.5 -15.3 -32.9
Ukraine (PFTS) 338 -2.0 -3.8 -12.7 -24.3 342 483 -32.0 28.7 -23.9 -9.1 -16.4
MSCI EMF 935 -0.8 -4.0 -2.2 -12.0 905 1,101 9.3 -4.6 8.3 -5.0 -10.8
MSCI EAFE 1,893 1.6 0.6 6.7 -3.0 1,697 1,969 19.2 -7.3 5.3 -7.3 12.6
Greece (ASE-General) 798 0.0 16.0 -3.5 -31.1 681 1,215 -3.5 -28.9 -28.9 22.1 22.1
Germany (XETRA DAX) 11,736 2.2 6.3 19.7 20.7 8,572 12,375 19.7 2.7 2.7 12.0 12.0
UK (FTSE-100) 6,789 0.8 1.2 3.4 0.6 6,183 7,104 15.5 -2.7 4.1 12.0 8.8
Japan (NIKKEI-225) 20,651 2.8 2.4 18.3 35.7 14,533 20,868 27.9 7.1 6.9 52.4 22.1
USA (DJ INDUSTRIALS) 18,100 0.7 0.5 1.6 5.8 16,117 18,312 13.5 7.5 22.1 23.6 17.5
USA (NASDAQ 100) 4,680 4.1 3.7 10.5 18.8 3,765 4,680 23.5 17.9 34.0 30.8 24.8

Strategy and Economic Research Division
86 Eolou Street 102 32 Athens, Greece
Publications
available at https://www.nbg.gr/en/the-group/press-office/e-spot/reports
South Eastern Europe & Mediterranean Emerging Market Economies - Weekly Report
South Eastern Europe & Mediterranean Emerging Market Economies - Quarterly Chart book
South Eastern Europe & Mediterranean Emerging Market Economies - Macroeconomic & Financial Indicators Update
Greece: Greek Macro View
Sectorial Studies - Sectorial Reports
Sectorial Studies - Survey of Greek Small and Medium Enterprises
Global Economy & Markets - Weekly Roundup