south florida environmental report 2009 executive summary
DESCRIPTION
The 2009 South Florida Environmental Report details a year of restoration, scientific and engineering progress in the Kissimmee Basin, Lake Okeechobee, the Everglades and South Florida coastal areas. The independent peer-reviewed report is produced by the South Florida Water Management District and the Florida Department of Environmental Protection.TRANSCRIPT
MARCH 1, 2009
2009SOUTH FLORIDA
E N V I R O N M E N TA LREPORT
E X E C U T I V E S U M M A R Y
2009 SOUTH FLORIDA
The State of Florida and the South Florida Water Management District have documented significant progress toward environmental restoration during the past decade. This year
marked a new milestone for Everglades restoration with a remarkable opportunity to acquire more than 180,000 acres of land south of Lake Okeechobee for further restoration purposes.
Following extensive deliberation, due diligence, and public input, and subject to financing, the District’s Governing Board voted to enter into a historic real estate transaction with the United States Sugar Corporation. The acquisition could provide water managers with unprecedented opportunities to store and treat water on a scale never before contemplated for the benefit of the South Florida ecosystem. The proposed purchase is the largest public land acquisition in Florida’s history and the single most important action to protect the Everglades since the designation of Everglades National Park some 60 years ago.
Other highlights this year include textbook examples of South Florida’s weather extremes: prolonged effects of a multiyear rainfall deficit coupled with a slow-moving tropical storm that brought more than 14 inches of rain to parts of the region. Tropical Storm Fay inched its way through Florida for six days in August 2008, impacting multiple counties and raising Lake Okeechobee’s low water level by more than two feet.
Ongoing efforts to improve Everglades water quality continue to prove successful. More than 775,000 acre-feet of runoff water was treated through six Stormwater Treatment Areas this water year. Since 1994, constructed treatment marshes together with the farming community’s commitment to “Best Management Practices” have prevented more than 2,800 metric tons of phosphorus from entering the Everglades.
As part of the legislatively mandated Northern Everglades and Estuaries Protection Program, a collaboration of agencies and stakeholders completed the Lake Okeechobee Watershed Construction Project Phase II Technical Plan and watershed protection plans for both the St. Lucie and Caloosahatchee rivers and estuaries. Together, these comprehensive plans provide a road map for improving water quality, expanding water storage, and protecting and restoring the heart of the South Florida ecosystem.
Our agencies remain committed to environmental improvements throughout the South Florida region. We are pleased to share this report documenting another year of progress.
Michael W. SoleSecretaryFlorida Department ofEnvironmental Protection
Carol Ann WehleExecutive DirectorSouth Florida Water Management District

The Bottom Line . . . . . . . . . . . . . . . . . . . . .2
Volume I The South Florida Environment . . . . . . . .5
Volume II District Annual Plans and Reports . . . . .35
Glossary . . . . . . . . . . . . . . . . . . . . . . . . . . .46
Acknowledgments . . . . . . . . . . . . . . . . . .48
Cover Feature The Everglades . . . . . . . . . . . . . Back Cover
Foreword
T he 2009 South Florida Environmental Report (SFER) marks the eleventh publication prepared jointly by the South Florida Water Management
District and the Florida Department of Environmental Protection, pursuant to Chapter 2005-36, Laws of Florida, and Subsection 373.036(7), Florida Statutes. Building on the many successes achieved over the past decade, our agencies continue to streamline their annual reporting into a comprehensive two-volume publication, complemented by this high-level Executive Summary. The SFER distinctly serves the public and decision makers with thorough, up-to-date information on the progress of South Florida environmental restoration and other key agency efforts accomplished during the reporting year.
Volume I, The South Florida Environment, documents relevant scientific and engineering efforts throughout South Florida, spanning diverse areas of the interconnected Northern and Southern Everglades systems. This volume satisfies the ever-growing list of annual reporting mandates required by the Everglades Forever Act, the Comprehensive Everglades Restoration Plan, the Northern Everglades and Estuaries Protection Program, and other federal and state laws and permits.
Volume II, District Annual Plans and Reports, comprises eight annual plans and reports required of all of Florida’s water management districts. This volume captures the South Florida Water Management District’s notable progress in implementing the 11 programs outlined in the agency’s Strategic Plan. Marking its five-year milestone, and for the first time web-available, the consolidated database is also included in the SFER to provide cohesive reporting and allow data retrieval of project-related information.
The complete 2009 Report, along with all previous consolidated reports, is available on the District’s web site (www.sfwmd.gov/sfer/) and also on the compact disc inside the back cover of this booklet. Overall, the details highlighted in the SFER provide the scientific foundation of agency programs and projects that ultimately support prudent environmental decision making. With the ongoing support of our stakeholders and the public, the 2009 South Florida Environmental Report proudly showcases our progress and achievements as we work toward sound management and restoration of the entire South Florida region.
ENVIRONMENTAL REPOR T
Table oF ConTenTs

The Bottom Line
The 2009 South Florida Environmental Report incorporates dozens of individual reports unified into a single, two-volume publication. Covering the entire South Florida region, key Volume I findings were derived from various research and monitoring projects during Water Year 2008 (WY2008) and highlight the South Florida Water Management District’s financial management during Fiscal Year 2008 (FY2008). Volume II details the FY2008 planning and project status for eight annual reports statutorily required of all water management districts. A snapshot of the many noteworthy accomplishments in the reporting period is presented below.
Volume I, The south Florida environment
Water Quality in South Florida
During WY2008, the District progressed in implementing •
the Long-Term Plan for Achieving Water Quality Goals (Long-Term-Plan), as required by the Everglades Forever Act. Everglades source controls continue to exceed expectations for improving water quality. Since 1994, Best Management Practices (BMPs) and Stormwater Treatment Areas (STAs) have collectively removed over 2,848 metric tons of total phosphorus (TP) that otherwise would have entered the Everglades Protection Area (EPA).
Similar to previous water years, •
Everglades water quality in WY2008 generally met state numeric criteria, with only a few excursions limited to specific EPA areas. Using WY2004–WY2008 TP data, only the phosphorus-impacted areas of the EPA did not achieve the TP criterion under the state’s four-part test.
The WY2008 TP load into the EPA was about 61 percent •
lower than the previous water year due to reduced flow volumes from the regional drought and lower TP concentrations from improved nutient-removal efficiency by BMPs and STAs.
Median mercury concentrations in largemouth bass in •
the Water Conservation Areas are at the federal criterion for human consumption, while these levels in fish often exceed wildlife protection criteria. Mercury levels in bass and sunfish in the Shark River Slough exceed human health and wildlife criteria. Options for reducing inputs of atmospheric mercury and sulfur in surface water remain key to managing the mercury problem.
Stormwater Treatment Areas
In WY2008, the Stormwater Treatment Areas collectively •
treated over 775,000 acre-feet of water, reducing inflow to outflow TP levels from a flow-weighted mean concentration of 129 parts to 26 parts per billion, respectively. Impressively, the STAs retained 98 metric tons of TP and reduced the inflow TP load to the Everglades by 80 percent.
Spurred by back-to-back years of water shortage •
conditions, this past year the District successfully implemented its drought contingency plan to minimize negative impacts to the STAs. The plan includes proactive strategies and detailed procedures to maintain minimum water levels in each of the STAs, and its use resulted in many operational benefits.
Ongoing research is focused on optimizing and sustaining •
STA performance. Rehabilitation efforts in Stormwater Treatment Area 1 West have yielded positive results, such as establishing desired plant communities and lowering water turbidity and outflow TP levels. Public recreational facilities also were unveiled in 2008 at three STAs.
Phosphorus Source Controls in South Florida
As part of the Northern Everglades and Estuaries •
Protection Program, nutrient source control programs are under development for the Lake Okeechobee watershed and planned for both the Caloosahatchee and St. Lucie River watersheds.
2

3
In the Southern Everglades, the application of source •
control BMPs in the Everglades Construction Project (ECP) basins continues to reduce TP inputs to the Everglades. In WY2008, the Everglades Agricultural Area (EAA) basin achieved a 44 percent reduction in TP load, marking the thirteenth consecutive year of basin compliance. Remarkably, the C-139 basin also achieved its first year of regulatory compliance for TP loads into the EPA.
The District continues to apply source controls for •
non-ECP basins and track their performance through water quality trends. During WY2008, the majority of TP loading from non-ECP basins was from the Feeder Canal basin, and coordinated efforts to improve water quality in this basin are under way.
Hydrology and Ecology Issues in South Florida
The 2006–2008 drought persisted through late summer •
2008 and ended with the arrival of Tropical Storm Fay. During WY2008, the region had more rainfall than WY2007, with only a 3.8-inch deficit compared to the previous 12-inch deficit. Water shortage management continued throughout the water year, particularly due to reduced storage in Lake Okeechobee from the prolonged drought.
In WY2008, dozens of Everglades research projects •
focused on wildlife, plant, and ecosystem ecology continued to support and influence natural resource and water management decisions. Notably, the total number of wading bird nests in the Greater Everglades this water year declined over 50 percent from WY2007. These sizable nest failures were attributed to dry conditions in prior years and poor foraging caused by higher-than-normal rainfall during the dry season.
The District continues to work with lead governmental •
agencies to help manage the ever-growing problem with nonindigenous plants and animals in South Florida. District-led control programs have brought melaleuca under control in most of the Water Conservation Areas and Lake Okeechobee. Biological controls for Lygodium and melaleuca are also showing positive results in tackling these species. Yet, most exotics, including the Burmese python, pose complex, unprecedented problems that need more attention to minimize deleterious impacts on Everglades restoration.
Everglades Restoration
In June 2008, Florida Governor Charlie Crist unveiled a •
strategy to revive America’s River of Grass by acquiring vast tracts of agricultural land south of Lake Okeechobee. As a bold vision for restoration, this potential acquisition would allow water storage and treatment on a scale never
before envisioned, providing invaluable benefits to the Everglades, Lake Okeechobee, and the St. Lucie and Caloosahatchee rivers and estuaries.
Under the Comprehensive Everglades Restoration Plan •
(CERP), several key milestones were achieved during FY2008. Project Implementation Reports for the Indian River Lagoon – South, Picayune Strand Restoration, and Fran Reich Preserve (Site 1 Impoundment) projects were approved by the U.S. Congress in November 2007 under the 2007 Water Resources Development Act – the first authorized since 2000. Project Implementation Reports for the Broward County Water Preserve Areas and C-43 Storage Reservoir also were completed in 2007 but were not part of the congressional authorization. The 2008–2009 federal budget includes the first request for the U.S. Congress to appropriate funds for construction of the CERP Picayune Strand Restoration Project.
Despite funding-related delays in implementing some •
CERP projects, RECOVER continues to refine CERP performance measures, develop related tools, and evaluate systemwide effects of restoration projects on the Everglades ecosystem.
Lake Okeechobee Management and Restoration
Lingering drought in WY2008 was most pronounced in •
Lake Okeechobee, with water levels at an all-time record low in early July 2007. Lake inflows were reduced by 40 percent, and the TP load to the lake was 246 metric tons, representing about 45 percent of baseline (1991–2005) levels. Phase III water use restrictions began in May 2007, and lake water releases for agriculture were reduced by 45 percent. Temporary forward pumps were also deployed to sustain water supply to the EAA despite low lake levels. As water levels improved through April 2008, restrictions were eased back to Phase II.
In WY2008, resuspended sediments from the 2004–2005 •
hurricanes continued to contribute to higher-than-normal TP and turbidity in Lake Okeechobee. In contrast, the lake showed many positive signs of recovery, including lower nearshore turbidity and TP concentrations, increased submerged aquatic vegetation beds, and no severe algal blooms. While future recovery is expected to occur naturally, intervention may be required to help some drought-sensitive species such as the Florida apple snail.
As part of the Northern Everglades initiative, the Phase II •
Technical Plan for the Lake Okeechobee Watershed Construction Project was completed in February 2008. The plan identifies construction projects, along with on-site measures that prevent or reduce pollution at its source, such as agricultural and urban BMPs, needed to achieve the lake’s Total Maximum Daily Load.

4
Current data indicate that there is sufficient legacy •
phosphorus in Lake Okeechobee and its watershed to maintain elevated TP loads to the lake for many future years. Effective load reduction strategies will need to reduce mobility of this legacy phosphorus, as well as control future TP inputs to the watershed.
Kissimmee Basin Restoration
Positive responses to Phase I construction were observed in •
WY2008 data on dissolved oxygen concentrations, vegetation, aquatic invertebrates, fish, and floodplain wading birds and waterfowl. Phase IVA backfilling of two additional miles of the C-38 canal was completed in September 2007, reconnecting four miles of river channel. This is expected to reestablish 512 acres of floodplain wetlands.
Although the Kissimmee River and its floodplain were •
influenced by drought in WY2008, densities of long-legged wading birds and waterfowl in the Phase I area floodplain exceeded restoration expectations, rebounding from WY2007 reductions. Despite these and other encouraging ecological responses, the full suite of restoration expectations will not be fully met until the Headwaters Revitalization water regulation schedule is implemented after the remaining restoration construction, planned for completion in 2013.
Coastal Ecosystem Management and Restoration
The District and its partners are continuing efforts to establish •
freshwater inflows that will protect and restore South Florida coastal ecosystems. Toward this goal, various monitoring, applied research, and modeling efforts were completed in WY2008. Also, the Caloosahatchee and St. Lucie River Watershed Protection Plans were completed by the District and other state agencies in 2008. These plans will help assess existing monitoring systems and needs, and identify strategies for improving water quality and ecosystem restoration.
Everglades Financial Report
The Everglades Long-Term Plan’s initial 13-year phase •
has a projected total cost of approximately $1.6 billion, reflecting approved revisions through the end of FY2008. In FY2008, dedicated funds generated about $88.1 million for the Everglades Forever Act Program, estimated to cost $2.4 billion through FY2016. Proceeds from previously issued Certificates of Participation totaling $244.7 million will be used to supplement funding for the construction of STA buildouts for Compartments B and C.
Volume II, District annual Plans and ReportsEighty-six percent of major District projects were within •
30 days of their planned schedules as of September 30, 2008. During FY2008, the District collected 91 percent of budgeted revenue, down from 110 percent in FY2007. The District spent 88 percent of the total FY2008 budget of approximately $908 million, an increase of 25 percentage points from the FY2007 expenditure rate.
The District has adopted Minimum Flow and Levels for •
12 water bodies, and has adopted Regional Water Availability rules for the Everglades, the Loxahatchee Basin, and the Lake Okeechobee Service Area, including the St. Lucie and Caloosahatchee rivers. In 2009, the District plans to complete rulemaking for the Picayune Strand and Fakahatchee Estuary, Biscayne Bay, and the Kissimmee River and Chain of Lakes.
The District’s total budgeted capital expenditures for FY2009 •
are $2.2 billion, which is 76 percent of the total annual budget of over $2.9 billion, and 51 percent of the projected five-year Capital Improvement Plan budget of $4.4 billion. The FY2009 capital budget is $1.4 billion, almost two times greater than the FY2008 budget of $819.5 million, mainly attributed to planned Everglades restoration.
The District has allocated $5.7 million in FY2009 and •
anticipates spending $17.1 million from FY2009–FY2013 on water resource development projects identified in updated regional water supply plans. These projects include groundwater monitoring, resource assessments, feasibility studies, modeling, conservation, and water resource protection activities.
The District continues its funding program for Alternative •
Water Supply projects. For FY2009, $27 million will be directed to Alternative Water Supply activities, including $3.8 million from the state. When completed, the 39 Alternative Water Supply projects funded in FY2009 will provide an additional 27 million gallons of water per day.
During the 2008 legislative session, the state extended •
funding of the Florida Forever Trust Fund through 2020. Over the next five years, the District intends to use $163 million of Florida Forever Trust funds for land purchases, while the majority of the $850 million Save Our Everglades Trust Fund will be used to construct CERP and Northern Everglades and Estuary Protection Program projects on already acquired lands. In FY2008, the District completed several key acquisitions, including lands for constructing the Caloosahatchee River Basin Water Quality Treatment Testing Facility, Lake Okeechobee Water Quality Treatment Facility, and C-111/L-31N Canal projects.
The District and its partners manage over 1.4 million acres •
of public land while providing recreational opportunities to the public. In FY2008, the District spent $11.5 million for land management, while $4.7 million in revenue was generated from agricultural leases and mitigation banks. Land management costs in FY2009, including capital improvements for recreation, are anticipated to be $12.4 million.
The District operates two regional mitigation projects, •
Corkscrew Regional Ecosystem Watershed and Pennsuco, to compensate for permitted wetland impacts. Neither project still accepts cash payments, but existing funds are used to restore and manage both sites. In FY2008, the District spent over $1.4 million on restoration-associated expenses in treating and monitoring 8,695 acres in the two areas, and anticipates similar combined expenditures for FY2009.
THE SOUTH FLORIDA ENVIRONMENT
Chapter 1 Introduction to the 2009 South Florida Environmental Report – Volume I . . . . . . . . . . . . 6
Chapter 2 hydrology of the South Florida environment . . . . . . . . . . . . . . . . . . . . . . . . . . . . . . . . . . . . 8
Chapter 3a Status of Water Quality in the everglades protection area . . . . . . . . . . . . . . . . . . . . . . . . 10
Chapter 3B Mercury and Sulfur Monitoring, research and environmental assessment in South Florida . . . . . . . . . . . . . . . . . . . . . . . . . . . . . . . . 12
Chapter 4 phosphorus Source Controls for the South Florida environment . . . . . . . . . . . . . . . . . . . 13
Chapter 5 Sta performance, Compliance and Optimization . . . . . . . . . . . . . . . . . . . . . . . . . . . . . . . . 16
Chapter 6 ecology of the everglades protection area . . . . . . . . . . . . . . . . . . . . . . . . . . . . . . . . . . . . . 18
Chapter 7a everglades restoration Update . . . . . . . . . . . . . . . . . . . . . . . . . . . . . . . . . . . . . . . . . . . . . . 20
Chapter 7B reCOVer activities Update . . . . . . . . . . . . . . . . . . . . . . . . . . . . . . . . . . . . . . . . . . . . . . . . . 22
Chapter 8 Implementation of the Long-term plan for achieving Water Quality Goals in the everglades protection area . . . . . . . . . . . . . . . . . . . . . . . . . . . 23
Chapter 9 the Status of Nonindigenous Species in the South Florida environment . . . . . . . . . . . . . 24
Chapter 10 Lake Okeechobee protection program – State of the Lake and Watershed . . . . . . . . . . . 26
Chapter 11 Kissimmee Basin . . . . . . . . . . . . . . . . . . . . . . . . . . . . . . . . . . . . . . . . . . . . . . . . . . . . . . . . . 29
Chapter 12 Management and restoration of Coastal ecosystems . . . . . . . . . . . . . . . . . . . . . . . . . . . . 31
Chapter 13 everglades Forever act annual Financial report . . . . . . . . . . . . . . . . . . . . . . . . . . . . . . . . 33
Volume I
6
Volume I • Chapter 1
Introduction to the 2009 South Florida Environmental Report – Volume I
Consolidated reporting marks Its eleventh Year
Reaching an 11-year milestone, the 2009 South Florida Environmental Report (SFER) unifies over 50 agency reports into a single document.
This introductory chapter provides the reader with a basic understanding of the governmental, scientific, and legal context behind the 2009 SFER – Volume I. Collectively, Volume I addresses various research and monitoring projects throughout the unique regions of South Florida including the Kissimmee Basin, Lake Okeechobee, Everglades, and South Florida’s coastal ecosystems (see opposite map). Updates on the current reporting year, Water Year 2008 (May 1, 2007–April 30, 2008) and Fiscal Year 2008 (October 1, 2007–September 30, 2008), are provided throughout the volume. Overall, this broad report continues to be used by the South Florida Water Management District, the Florida Department of Environmental Protection, and other agencies to support regional environmental management and restoration decisions.
The complete 2009 SFER comprises the two-volume Main Report and Executive Summary. Volume I, The South Florida Environment, is a technically based, peer-reviewed volume that provides data summaries for all major ecosystems across South Florida. In a 13-chapter framework, the topics covered in this volume are generally the same as those in previous SFERs. Following the introduction, the hydrology of South Florida in Chapter 2 provides supporting hydrologic information for subsequent chapters. Chapters 3 through 9 continue the overall objective to summarize information linked to Everglades restoration efforts, including updates on Comprehensive Everglades Restoration Plan (CERP) and RECOVER activities in Chapters 7A and 7B, respectively.
To complete a regional overview of water management, this year’s volume continues its coverage of Lake Okeechobee (Chapter 10), the Kissimmee Basin (Chapter 11), and coastal ecosystems (Chapter 12). Financial reporting during Fiscal Year 2008 for CERP (Chapter 7A), Lake Okeechobee (Chapter 10), and the Everglades (Chapter 13) is also provided. Volume I chapters are supported by dozens of appendices providing data summaries and detailed analyses for the special-interest reader and to fulfill various permit requirements.
everglades restoration is approached From a Systemwide perspective
To succeed with Everglades restoration, the complex issues of water quality, quantity, timing, and distribution must be addressed upstream in order to effectively improve the health of downstream systems. To support better management and reporting on the diverse programs and projects throughout South Florida, a systemwide approach is being used to structure the region into two primary sub-regions – the Northern and Southern Everglades – based on delineated watershed boundaries. The Northern Everglades spans the Kissimmee area lakes and rivers, Lake Okeechobee, and the Caloosahatchee and St. Lucie rivers and estuaries, and encompasses the critical interaction between Lake Okeechobee and its downstream estuaries. The Southern Everglades covers the Water Conservation Areas, Big Cypress National Preserve, Everglades National Park/Florida Bay, and coastal bays and estuaries south of Lake Okeechobee. Importantly, this organization helps integrate the planning and implementation of the agency’s many regional programs and projects toward attaining the restoration goals of the entire Everglades system.

7
Widespread Drought Breaks in 2008, Bringing relief to South Florida
Over the past century, the Kissimmee-Okeechobee-Everglades and coastal systems in South Florida have been altered fundamentally by changes in spatial extent, hydrology, water quality, and ecology. The massive undertaking of environmental management and restoration in South Florida is unique in regional scale and involves multifaceted issues of water quality, flood control, natural systems, and water supply. The sweeping influences of these competing needs, along with related District programs and extensive restoration activities throughout South Florida, are addressed throughout Volume I. Weaving this information together, Chapter 1 provides an inte grated summary of the many opportunities and challenges of these efforts, which have been particularly demanding as extreme variations in meteorological conditions have continued to overwhelm the region in recent years.
During Water Year 2008, the effects of a multiyear rainfall deficit continued to influence South Florida. Following back-to-back years of unprecedented hurricane activity and higher-than-normal rainfall in 2004–2005, drought conditions affected the entire region since late 2006 and up through Water Year 2008. Associated impacts were quite pronounced in the Lake Okeechobee watershed, as demonstrated by record-low water levels and exposed water control structures in the vicinity of the lake during that period. The pendulum swung back with increased rainfall in the region in late summer 2008 due to the passing of Tropical Storm Fay in August 2008.
Notably, emergency water use restrictions have been in place for most of the District’s 16-county region since early 2007. Water use restrictions are expected to continue in order to balance longer-term regional water availability and supply needs. The rule for proposed year-round landscape irrigation measures – a key component of the agency’s comprehensive water conservation program of regulatory, voluntary, incentive-based, education, and marketing strategies – is expected to be finalized in 2009.
LEGEND
MICCOSUKEE INDIAN RESERVATIONBIG CYPRESS SEMINOLE INDIAN RESERVATION
STORMWATER TREATMENT AREAS WATER CONSERVATION AREAS
CANALS
ROTENBERGER AND HOLEY LAND WILDLIFE MANAGEMENT AREAS
NORTHERN EVERGLADES
LoxahatcheeRiver
Naples Bay
Estero Bay
Lake WorthLagoon
CharlotteHarbor
Southern
Caloosahatchee
River
Indian River Lagoon
Kissim
me
e River
ATLANTICOCEAN
WestPalmBeach
FortLauderdale
FortPierce
BiscayneBay
BigCypressNationalPreserve
EvergladesNational
Park
FortMyers
Miami
Naples
FloridaBay
Florida KeysKey West
St. Lucie
River LakeOkeechobee
WCA-3
WCA-2
WCA-1Agricultural
Area
Everglades
GULFOF MEXICO
C-139
LakeKissimmee
Upper Chainof Lakes
Lake Istokpoga
Volume I • Chapter 1
Major areasof the southfloridaenvironMent

Most topics covered in the 2009 SFER – Volume I are strongly linked to regional hydrology, the subject of Chapter 2. Through a comprehensive
update on the hydrology of the area within the District’s boundaries, the chapter provides a basis for understanding the regional water management system and related activities. Water Year 2008 (WY2008) hydrology, including rainfall, potential evapotranspiration, water levels, inflows, and outflows, for all major components of the South Florida water management system is presented and compared to the previous water year (WY2007) and historical conditions. This year’s chapter also highlights record-breaking drought conditions across the South Florida region from late 2006 through 2008.
limited Flows from the Northern to Southern everglades occur in Water Year 2008
The District’s water managers are constantly faced with the many challenges posed by hydrologic variation when managing the day-to-day operations of the South Florida water management system. Remarkably, WY2008 was the fourth consecutive year of record-breaking figures. In contrast to the back-to-back hurricanes experienced
in WY2005 and WY2006 with higher-than-normal rainfall, both WY2007 and WY2008 were marked by a sustained drought with far-ranging hydrologic effects throughout South Florida.
As depicted on the opposite map, regional surface water generally moves from north to the south, and there are water supply and coastal discharges to the east and west. The 2006–2008 drought caused an imbalance in water inputs and outputs, considerably altering the region’s hydrology and reducing surface water flows from the Northern Everglades into the Southern Everglades. During WY2008, discharges from Lake Kissimmee and Lake Istokpoga were 43 and 14 percent of historical average flows, respectively. Lake Okeechobee inflow was half of the historical average and one and a half times that of WY2007 inflows. Outflows from Lake Okeechobee to the Everglades Agricultural Area and the Caloosahatchee and St. Lucie estuaries were sharply reduced due to the limited storage in the lake as well as the diminished inflows into the lake. Notably, the WY2008 outflow from Lake Okeechobee was a record low of 12 percent of the average outflow. Flows into and out of the Everglades Protection Area were also drastically reduced.
Volume I • Chapter 2
Hydrology of the South Florida environment
8
During Water Year 2008, persistent water shortage conditions in Lake Okeechobee continued impact the entire South Florida water management system.
to dramatically

Caloosahatchee
River
Kissimm
ee River
ATLANTICOCEAN
EvergladesNational
Park
St. Lucie
RiverLakeOkeechobee
WCA-3
WCA-2
WCA-1Agricultural
Area
Everglades
GULFOF MEXICO
LakeKissimmee
Upper Chainof Lakes
Lake Istokpoga
1
3
4
6
7
8
9
1011
1213
14
15
5
2
9
Volume I • Chapter 2
pronounced Drought tops Six Driest periods on record
The 2006–2008 drought ranks in the top six of the most severe regional droughts based on the rainfall received across South Florida during the wet and dry seasons of WY2007 and WY2008. Areal rainfall across the District in WY2008 (49.0 inches) was slightly lower than the historical average (52.8 inches) but a marked improvement over the previous water year, which was over 12 inches below the average.
Similar to WY2007, the WY2008 rainfall was below average in most of the District’s 14 rainfall areas. The Upper Kissimmee Basin, Lake Okeechobee, East Everglades Agricultural Area, West Everglades Agricultural Area, and the Lower West Coast areas had very low rainfall. Conversely, the Southeast (Broward, Miami-Dade, Everglades National Park), Palm Beach, and Water Conservation Areas 1 and 2 areas received above-average rainfall. Despite such localized increases, there was not enough rain over the Lake Okeechobee watershed to generate runoff sufficient enough to raise the lake level,
thereby placing further constraints on regional water management during the water year.
lake Water levels Drop to record lows in 2007, with Cascading effects through mid-2008
During WY2008, water levels in lakes in the Kissimmee and Okeechobee watersheds and the Water Conservation Areas were lower than their respective historical averages as a result of the extended rainfall deficits. In July 2007, Lake Okeechobee’s water level declined to 8.82 feet National Geodetic Vertical Datum – the lowest recorded stage since 1931, the start of the period of record (see Volume I, Chapter 10, for further details). As lake levels dropped, the amount of available water for storage and supply decreased drastically for all of South Florida. It is important to note that prolonged drought continued through late summer 2008, until Tropical Storm Fay brought drought relief in August 2008. Looking ahead, heightened efforts to increase water conservation measures and proactively manage regional water resources are expected to continue.
WATER FLOW (ACRE-FEET IN THOUSANDS) Water Year
2008* 2007
1. Lake Kissimmee Outflows 302 121
2. Lake Istokpoga Outflows 31 64
3. Lake Okeechobee Inflows 1013 619
4. Lake Okeechobee Outflows 177 908
5. St. Lucie Canal Inflows 14 82
6. St. Lucie Canal Outflows 0 21
7. Caloosahatchee Inflows 42 180
8. Caloosahatchee Outflows 87 694
9. Water Conservation Area 1 Inflows 242 251
10. Water Conservation Area 1 Outflows 214 232
11. Water Conservation Area 2 Inflows 488 584
12. Water Conservation Area 2 Outflows 512 460
13. Water Conservation Area 3 Inflows 798 849
14. Water Conservation Area 3 Outflows 246 565
15. Everglades National Park Inflows 343 578* Water Year 2008 flows are reflected on map
regional inflowsand outflows
10
Volume I • Chapter 3a
I n the 2009 SFER – Volume I, Chapter 3A assesses water quality within the Everglades Protection Area (EPA) for those water quality parameters that did not meet
state Class III water quality criteria during Water Year 2008 (WY2008) and evaluates conditions affecting water quality in this region. This chapter also fulfills many requirements of the Everglades Forever Act and related permits, and updates information linked to comprehensive water quality monitoring programs reported in both Chapters 3A and 3C of previous SFERs. Comparison of total phosphorus (TP) levels in the EPA against the requirements in the approved phosphorus criterion rule, and an update on nitrogen and phosphorus levels in EPA surface water, are also covered in the chapter.
trend Continues for In-compliance Water Quality in the everglades
Each year, the South Florida Water Management District monitors over 100 water quality parameters in the EPA. The Florida Department of Environmental Protection compares water quality data for about 80 of these parameters with the state’s Class III water quality criteria pursuant to Chapter 62-302, Florida Administrative Code, which establishes enforceable management and societal goals for Everglades water quality conditions. In WY2008, most water quality data from the EPA continued to meet applicable water quality criteria. Similar to earlier years, some parameters exceeded state criteria, with variations in these excursions across different EPA regions due to local environmental conditions and water management activities. Continuing this year-to-year trend, water quality excursions in WY2008 were identified for dissolved oxygen, alkalinity, pH, and specific
conductance. These excursions were localized to specific areas of the EPA, with the exception of dissolved oxygen, which exhibited excursions in all regions except Everglades National Park (Park) and is considered related to natural conditions within the area. Two pesticides, atrazine and chlorpyrifos ethyl, were detected at concentrations above their respective toxicity-based guidelines but similar to other localized areas across the EPA.
everglades Nutrient levels Show marked Decline in Water Year 2008
Large-scale efforts continue to monitor the status and trends of primary nutrients, particularly phosphorus and nitrogen, in surface waters in the EPA. Similar to previous years, WY2008 total phosphorus and total nitrogen concentrations in surface water showed a decreasing trend from north to south across the EPA regions. As shown on the opposite map, the highest TP levels were present in the inflow to the Arthur R. Marshall Loxahatchee National Wildlife Refuge (Refuge) and Water Conservation Area 2A (WCA-2A), with TP concentrations decreasing to a minimum within the Park. WY2008 inflow and interior geometric mean concentrations were typically lower than both the previous water year (WY2007) as well as the most recent four-year period, WY2005–WY2008. During WY2008, geometric mean total nitrogen concentrations at interior marsh and inflow stations were significantly lower than previous water years, with levels from the Park to the Refuge ranging from 0.85 to 1.75 parts per million, respectively. These nutrient reductions are likely due to the continued effectiveness of agricultural Best Management Practices (BMPs), improved treatment by upstream Stormwater Treatment Areas (STAs),
Status of Water Quality in the everglades Protection Area
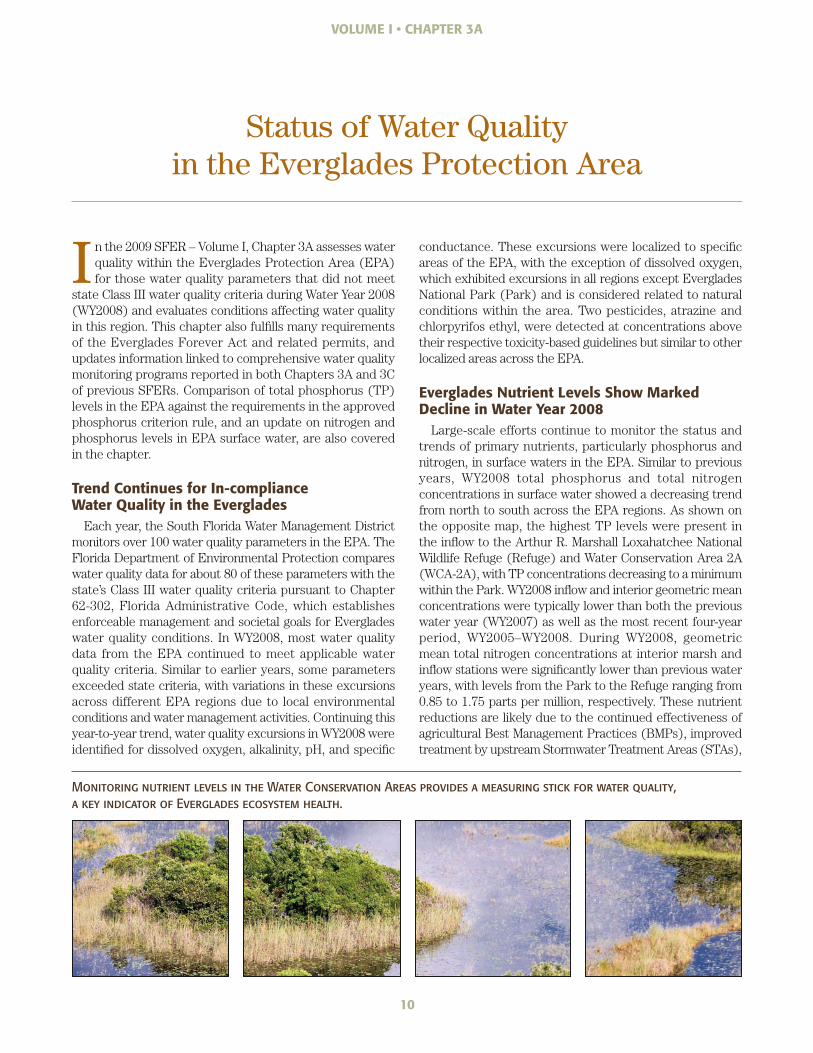
Monitoring nutrient levels in the Water Conservation Areas provides a measuring a key indicator of Everglades ecosystem health.
stick for water quality,

11
EPA, although this is less apparent in the Park where inflow concentrations have remained near background levels and the loading responds more directly to changes in flow and climatic conditions.
the State applies phosphorus Water Quality Criterion Successfully for third Year
The Florida Department of Environmental Protection developed a specific method to assess achievement of the TP criterion, serving as a uniform framework (or template) to guide future phosphorus evaluations in the EPA. Now in its third year of application, the assessment is based on the four-part test outlined in the TP rule and uses available data from existing monitoring sites in the EPA over the most recent five-year period. This test comprises four components, which establish goals for TP concentrations for the monitoring networks within each portion of the EPA and for individual monitoring stations within the EPA on an annual or five-year basis. Importantly, all four components of the test must be achieved for the water body to comply with the phosphorus criterion.
Like the past two water years, the results of the four-part assessment using WY2004–WY2008 data showed that the unimpacted portions of each WCA passed all parts of the test and therefore met the TP criterion. In contrast, WY2004–WY2008 data from portions of each WCA that have been impacted by historical phosphorus enrichment did not meet the criterion due to failing one or more parts of the test. As predicted, the geometric mean TP concentrations for the impacted portions of the WCAs generally exceeded both the 10-ppb, five-year network limit and the 15-ppb, annual site limit. Similar findings are likely to occur for awhile because high TP concentrations in existing soils in the WCAs are expected to take decades to be restored to more historical levels. While TP data are limited in some portions of the EPA, future assessments are expected to show a more complete picture across the Everglades as more robust datasets are established.
Volume I • Chapter 3a
LakeKissimmee
Caloosahatchee
River
Kissimm
ee River
ATLANTICOCEAN
EvergladesNational
Park
St. Lucie
RiverLakeOkeechobee
Upper Chainof Lakes
Water Conservation
Areas
AgriculturalArea
Everglades
GULFOF MEXICO
Lake Istokpoga
REFUGEInflow = 46.9Interior = 10.6
WCA-2AInflow = 19.7Interior = 12.0
PARKInflow = 11.2Interior = 5.2
WCA-3AInflow = 20.1Interior = 8.5
Ever
glad
es P
rote
ctio
n A
rea
Water Year 2008 geometric mean phosphorus concentrations (parts per biLLion)
REFUGE 61.7 11.1 WCA-2A 24.5 14.0 WCA-3A 22.9 9.3 PARK 10.2 5.7
lower stormwater volumes resulting from the 2006–2008 drought, and recovery from the climatic extremes of hurricanes and marsh dryouts experienced in recent years.
During WY2008, TP loads from surface sources to the EPA totaled 36.7 metric tons, with a flow-weighted mean concentration of 24 parts per billion (ppb) – a load decrease of about 61 percent compared to WY2007. This notable reduction resulted primarily from reduced flow volumes associated with the 2006–2008 drought. The effectiveness of the BMP and STA phosphorus removal efforts also continues to be demonstrated by the decreased TP loading to the
Water Year 2005-2008 geometric mean phosphorus concentrations (parts per biLLion)
total PhosPhorusConCentrationsin the evergladesProteCtion area
Volume I • Chapter 3B
mercury and Sulfur monitoring, Research and environmental Assessment in South Florida
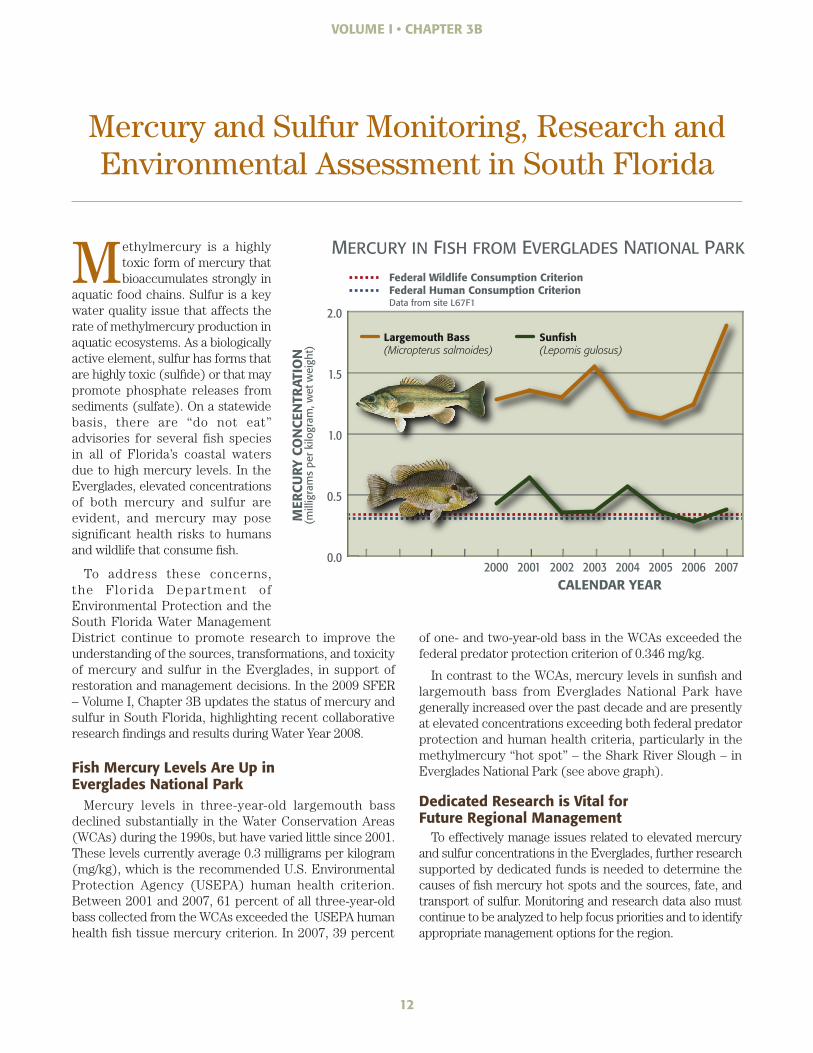
Methylmercury is a highly toxic form of mercury that bioaccumulates strongly in
aquatic food chains. Sulfur is a key water quality issue that affects the rate of methylmercury production in aquatic ecosystems. As a biologically active element, sulfur has forms that are highly toxic (sulfide) or that may promote phosphate releases from sediments (sulfate). On a statewide basis, there are “do not eat” advisories for several fish species in all of Florida’s coastal waters due to high mercury levels. In the Everglades, elevated concentrations of both mercury and sulfur are evident, and mercury may pose significant health risks to humans and wildlife that consume fish.
To address these concerns, the Florida Department of Environmental Protection and the South Florida Water Management District continue to promote research to improve the understanding of the sources, transformations, and toxicity of mercury and sulfur in the Everglades, in support of restoration and management decisions. In the 2009 SFER – Volume I, Chapter 3B updates the status of mercury and sulfur in South Florida, highlighting recent collaborative research findings and results during Water Year 2008.
Fish mercury levels are up in everglades National park
Mercury levels in three-year-old largemouth bass declined substantially in the Water Conservation Areas (WCAs) during the 1990s, but have varied little since 2001. These levels currently average 0.3 milligrams per kilogram (mg/kg), which is the recommended U.S. Environmental Protection Agency (USEPA) human health criterion. Between 2001 and 2007, 61 percent of all three-year-old bass collected from the WCAs exceeded the USEPA human health fish tissue mercury criterion. In 2007, 39 percent
of one- and two-year-old bass in the WCAs exceeded the federal predator protection criterion of 0.346 mg/kg.
In contrast to the WCAs, mercury levels in sunfish and largemouth bass from Everglades National Park have generally increased over the past decade and are presently at elevated concentrations exceeding both federal predator protection and human health criteria, particularly in the methylmercury “hot spot” – the Shark River Slough – in Everglades National Park (see above graph).
Dedicated research is Vital for Future regional management
To effectively manage issues related to elevated mercury and sulfur concentrations in the Everglades, further research supported by dedicated funds is needed to determine the causes of fish mercury hot spots and the sources, fate, and transport of sulfur. Monitoring and research data also must continue to be analyzed to help focus priorities and to identify appropriate management options for the region.
12
0.0
0.5
1.0
1.5
2.0
20072006200520042003200220012000CALENDAR YEAR
MER
CURY
CO
NCE
NTR
ATIO
N(m
illig
ram
s pe
r ki
logr
am, w
et w
eigh
t)
Largemouth Bass(Micropterus salmoides)
Sunfish(Lepomis gulosus)
Federal Wildlife Consumption CriterionFederal Human Consumption CriterionData from site L67F1
mercurY in Fish From evergLaDes nationaL park
Volume I • Chapter 4
13
Phosphorus Source Controls for the South Florida environment
Regionwide source controls are an integral part of restoring the entire Everglades ecosystem. One of the chief strategies for improving water quality in
South Florida has been through applying source controls at the landscape level – also known as Best Management Practices (BMPs) – in the Everglades watersheds, including both agricultural and non-agricultural land uses. To date, efforts have been focused mainly on controlling total phosphorus (TP) levels in land runoff. The South Florida Water Management District requires the application of source controls using a combination of regulatory, cooperative, and educational initiatives that work in conjunction with other local and regional projects. These initiatives are dependent upon several factors, particularly watershed-based water quality goals and statutory requirements for individual elements of source control programs.
In the 2009 SFER – Volume I, Chapter 4 updates the South Florida Water Management District’s progress on
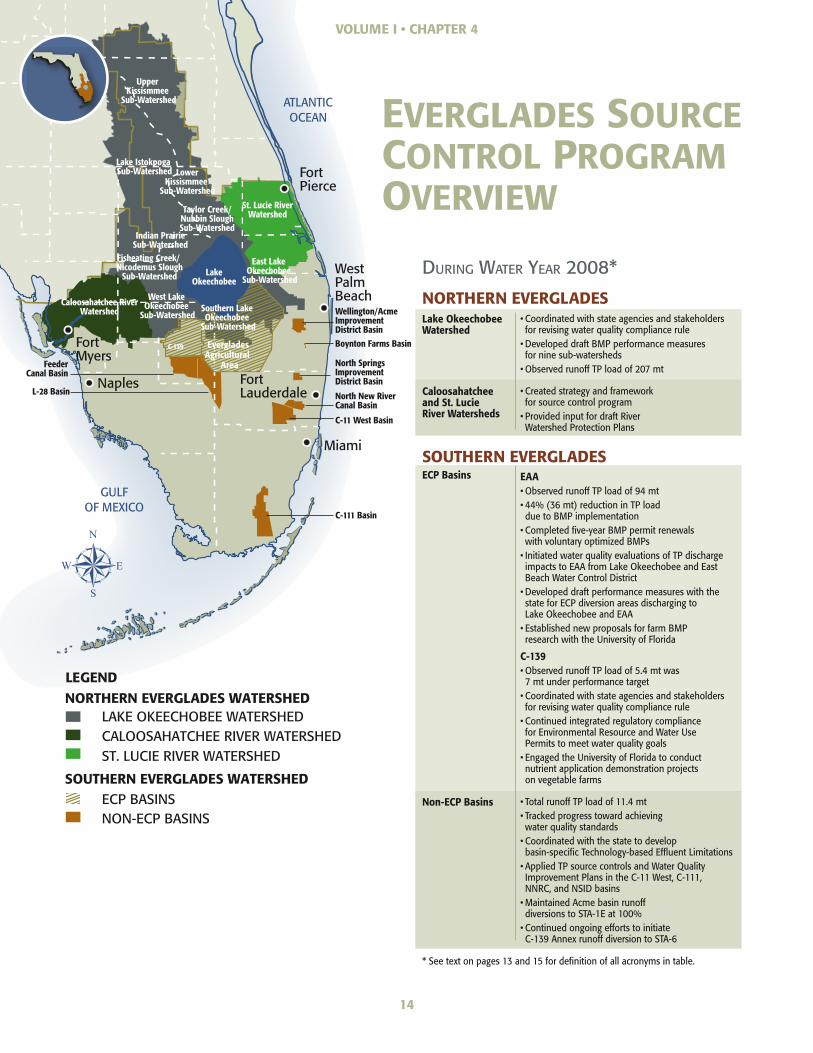
implementing Everglades source control programs during Water Year 2008 (WY2008). These source control programs address the Lake Okeechobee and Caloosahatchee and St. Lucie River watersheds in the Northern Everglades, and the Everglades and Non-Everglades Construction Project (ECP and non-ECP) basins in the Southern Everglades. The chapter summarizes source controls associated with both the Northern and Southern Everglades watersheds to provide a comprehensive view of related programs across the entire region. To also comply with the requirements of the Everglades Forever Act and the Long-Term Plan for Achieving Water Quality Goals, the Southern Everglades-related update for WY2008 covers District phosphorus source control efforts in the ECP and non-ECP basins, and includes basin-specific reporting of permit compliance status, TP levels and monitoring data, and source control strategies. Along with the map, key WY2008 highlights for both the Northern and Southern Everglades are presented in the summary table on the next page.
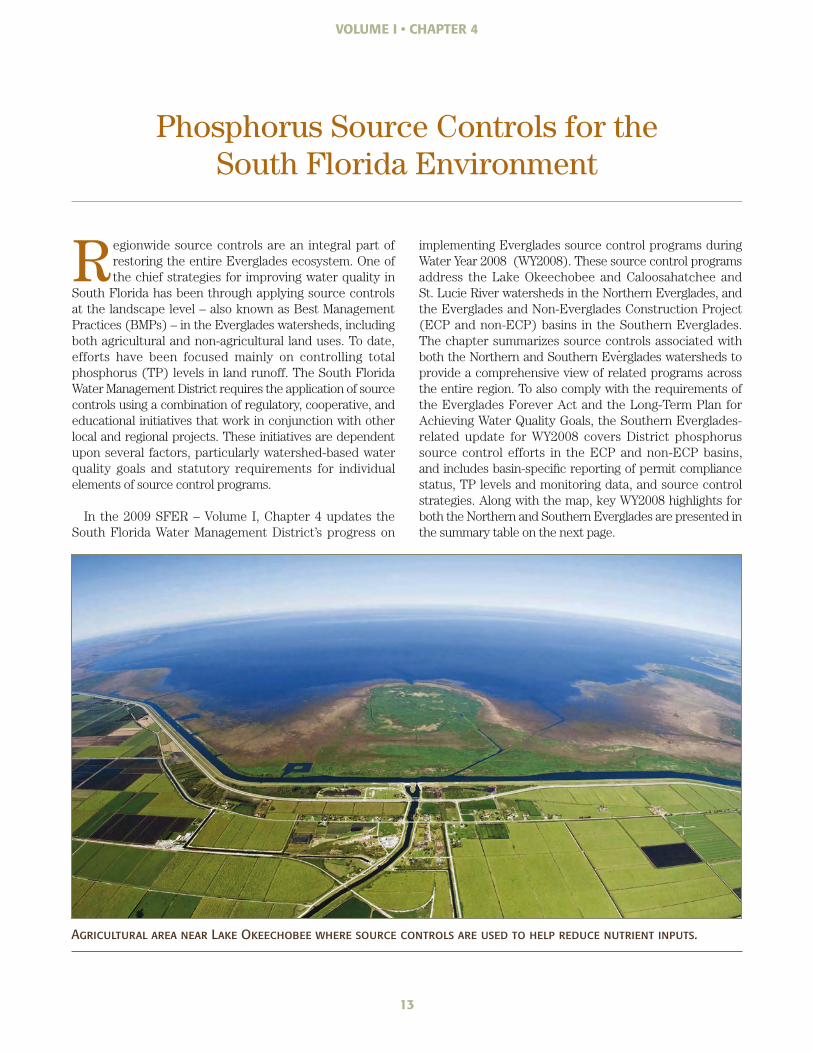
Agricultural area near Lake Okeechobee where source controls are used to help reduce nutrient inputs.
ATLANTICOCEAN
GULFOF MEXICO
LakeOkeechobee
Upper Kissismmee
Sub-Watershed
LowerKissismmee
Sub-Watershed
East Lake Okeechobee
Sub-Watershed
Wellington/AcmeImprovement District Basin
North SpringsImprovement District Basin
North New River Canal Basin
C-11 West Basin
Feeder Canal Basin
L-28 Basin
C-111 Basin
Boynton Farms Basin
West Lake Okeechobee
Sub-WatershedCaloosahatchee River
Watershed Southern Lake Okeechobee
Sub-Watershed
Taylor Creek/Nubbin SloughSub-Watershed
Indian PrairieSub-Watershed
Fisheating Creek/ Nicodemus Slough
Sub-Watershed
St. Lucie RiverWatershed
Lake Istokpoga Sub-Watershed
LEGEND
ECP BASINSNON-ECP BASINS
LAKE OKEECHOBEE WATERSHEDCALOOSAHATCHEE RIVER WATERSHED ST. LUCIE RIVER WATERSHED
NORTHERN EVERGLADES WATERSHED
SOUTHERN EVERGLADES WATERSHED
WestPalmBeach
FortLauderdale
FortPierce
Miami
Naples
FortMyers Agricultural
Area
EvergladesC-139
Volume I • Chapter 4
14
During Water Year 2008*
NORTHERN EVERgLADESlake okeechobee Watershed
Coordinated with state agencies and stakeholders •for revising water quality compliance rule Developed draft BMP performance measures •for nine sub-watershedsObserved runoff TP load of 207 mt•
Caloosahatchee and St. lucie river Watersheds
Created strategy and framework •for source control program Provided input for draft River •Watershed Protection Plans
SOUTHERN EVERgLADESeCp Basins EAA
Observed runoff TP load of 94 mt• 44% (36 mt) reduction in TP load •due to BMP implementation Completed five-year BMP permit renewals •with voluntary optimized BMPs Initiated water quality evaluations of TP discharge •impacts to EAA from Lake Okeechobee and East Beach Water Control District Developed draft performance measures with the •state for ECP diversion areas discharging to Lake Okeechobee and EAA Established new proposals for farm BMP •research with the University of Florida
C-139 Observed runoff TP load of 5.4 mt was •7 mt under performance target Coordinated with state agencies and stakeholders •for revising water quality compliance rule Continued integrated regulatory compliance •for Environmental Resource and Water Use Permits to meet water quality goals Engaged the University of Florida to conduct •nutrient application demonstration projects on vegetable farms
Non-eCp Basins Total runoff TP load of 11.4 mt• Tracked progress toward achieving •water quality standards Coordinated with the state to develop •basin-specific Technology-based Effluent Limitations Applied TP source controls and Water Quality •Improvement Plans in the C-11 West, C-111, NNRC, and NSID basins Maintained Acme basin runoff •diversions to STA-1E at 100% Continued ongoing efforts to initiate •C-139 Annex runoff diversion to STA-6
* See text on pages 13 and 15 for definition of all acronyms in table.
EvErgladEs sourcEcontrol ProgramovErviEw

Volume I • Chapter 4
15
the State Initiates rulemaking for agricultural Source Controls in the Northern everglades
In the Northern Everglades and Estuaries Protection Program, the Lake Okeechobee watershed is required to have a source control program to reduce phosphorus levels in discharges entering Lake Okeechobee. The Caloosahatchee and St. Lucie River watersheds are also mandated to have nutrient control programs to reduce both phosphorus and nitrogen levels entering the estuaries.
Consistent with the Lake Okeechobee Watershed Construction Project Phase II Technical Plan, in 2008 the District began revising regulations to update permit requirements for source controls in the expanded lake watershed. Once revisions are complete, the District will monitor the discharges from each of the lake’s nine sub-watersheds to evaluate the combined performance of all source control program elements. Under the plan, the District will also determine the need for additional requirements at the source level as part of the overall strategy to meet the lake’s Total Maximum Daily Load for TP. Protection plans for the Caloosahatchee and St. Lucie rivers outline source control program components and related goals for these watersheds.
Future SFERs are expected to more comprehensively describe the source control efforts by the District and other coordinating agencies for the entire Northern Everglades watershed area. Further details on the Northern Everglades and Estuaries Protection Program are also presented in Volume I, Chapters 7A, 10, 11, and 12.
everglades Construction project Basins achieve Compliance in Water Year 2008
As one of the District’s strategic priorities, the Southern Everglades phosphorus source control program is essential to achieving water quality standards in the EPA. Within this program, there are two ECP basins that discharge to the EPA, the Everglades Agricultural Area (EAA) and C-139 basins. Overall, the sustained drought in WY2008 contributed to rainfall deficits in both basins, and nearly 50 percent less TP runoff load from the ECP basins was observed compared to WY2007.
For WY2008, the EAA basin was in compliance with its required performance goal for the thirteenth straight year, showing a 44 percent reduction in TP loads. The C-139 basin achieved its first year of compliance with its mandated TP loading level requirements under the current rule in effect. However, this basin failed to meet its TP loading goals during the initial three water years since compliance requirements took effect in 2003. As a result, rulemaking was initiated in WY2007 and continued in WY2008 to revise existing regulations for improving compliance methods.
Related efforts included conducting technical working groups and landowner workshops, evaluating factors impacting compliance, reevaluating BMP plans and scope, and evaluating optimization opportunities. It is anticipated that the revised rule will take effect in WY2009.
Broad measures to reduce phosphorus progress in other everglades tributary Basins
In the Southern Everglades, there are eight other basins with inflows to the EPA (known as the non-ECP basins): C-11 West, North New River Canal (NNRC), North Springs Improvement District (NSID), Feeder Canal, L-28, C-111, Acme Improvement District (Acme), and Boynton Farms. The primary strategy for the non-ECP basins is to enhance the BMP programs initiated a decade ago and to rely on future Everglades restoration projects and other local construction projects for holding or diverting flows that would otherwise be released into the EPA.
The non-ECP basins contribute only about 12 percent of the total loading into the EPA. Unlike the ECP basins, there is no specific TP requirement established at the point of discharge from these basins. Water Quality Improvement Plans for each of the non-ECP basins are expected to significantly contribute to achieving Everglades long-term water quality goals. These basin-specific plans include a combination of BMPs, landowner training and education, modified stormwater permits, cooperative agreements, and basin-specific regulatory programs. Water quality data are also continuously tracked so the plans can be modified adaptively, as needed, to optimize TP reduction at its source.
During WY2008, TP flow-weighted mean concentrations varied widely among the eight tributary basins, ranging from 7 and 101 parts per billion (ppb) in the C-111 and Feeder Canal basins, respectively. A total of 11.4 metric tons (mt) of TP load was discharged by these basins to the EPA, with 63 percent contributed by the Feeder Canal and L-28 basins. Over this year, significant progress was made to reduce TP discharges from the Boynton Farms basin through diversion away from the EPA. This work builds upon previous diversions that began in WY2007 for the Acme and NSID basins, which continue to be successful in reducing TP loading to the EPA. Through integrated efforts, the District is working with local landowners to ensure that the water quality and conservation requirements of Environmental Resource and Water Use permits for all basins are successfully met. Additionally, the District continues to review and optimize source control measures for all non-ECP basins and track their performance against established water quality standards and proposed Technology-based Effluent Limitations.
Volume I • Chapter 5
STA Performance, Compliance and optimization
M andated by the Everglades Forever Act, large freshwater wetlands – known as Stormwater Treatment Areas (STAs) – have been constructed
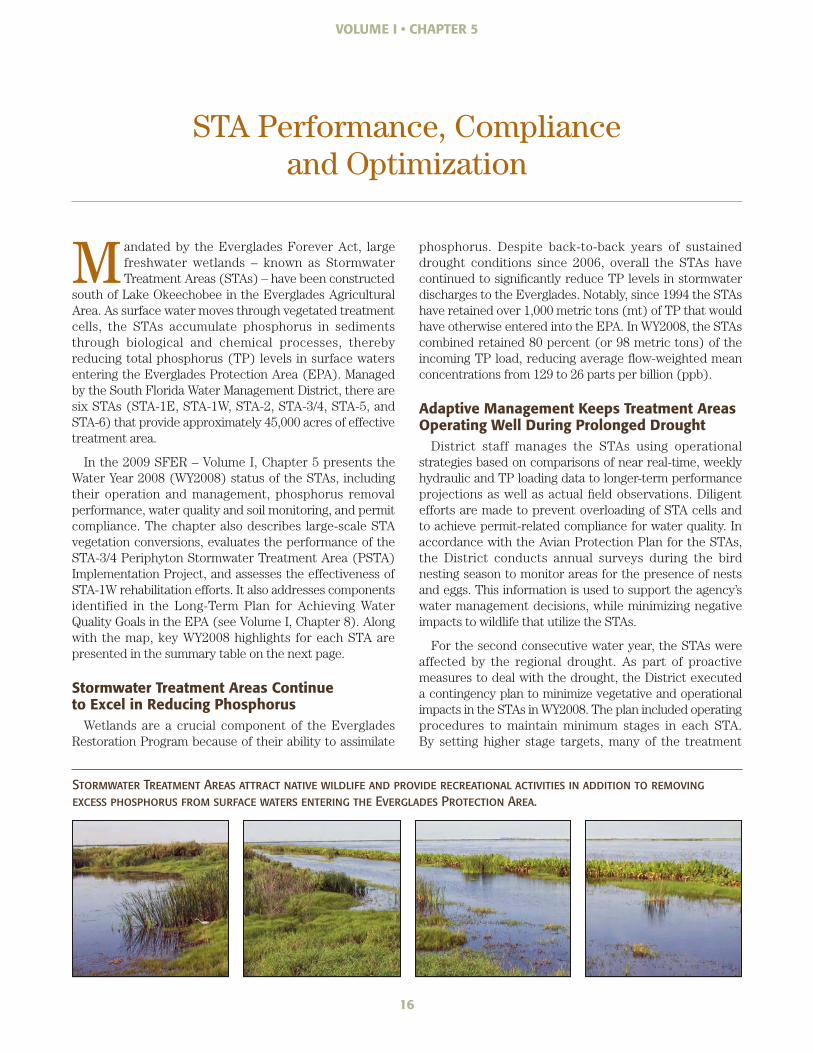
south of Lake Okeechobee in the Everglades Agricultural Area. As surface water moves through vegetated treatment cells, the STAs accumulate phosphorus in sediments through biological and chemical processes, thereby reducing total phosphorus (TP) levels in surface waters entering the Everglades Protection Area (EPA). Managed by the South Florida Water Management District, there are six STAs (STA-1E, STA-1W, STA-2, STA-3/4, STA-5, and STA-6) that provide approximately 45,000 acres of effective treatment area.
In the 2009 SFER – Volume I, Chapter 5 presents the Water Year 2008 (WY2008) status of the STAs, including their operation and management, phosphorus removal performance, water quality and soil monitoring, and permit compliance. The chapter also describes large-scale STA vegetation conversions, evaluates the performance of the STA-3/4 Periphyton Stormwater Treatment Area (PSTA) Implementation Project, and assesses the effectiveness of STA-1W rehabilitation efforts. It also addresses components identified in the Long-Term Plan for Achieving Water Quality Goals in the EPA (see Volume I, Chapter 8). Along with the map, key WY2008 highlights for each STA are presented in the summary table on the next page.
Stormwater treatment areas Continue to excel in reducing phosphorus
Wetlands are a crucial component of the Everglades Restoration Program because of their ability to assimilate
phosphorus. Despite back-to-back years of sustained drought conditions since 2006, overall the STAs have continued to significantly reduce TP levels in stormwater discharges to the Everglades. Notably, since 1994 the STAs have retained over 1,000 metric tons (mt) of TP that would have otherwise entered into the EPA. In WY2008, the STAs combined retained 80 percent (or 98 metric tons) of the incoming TP load, reducing average flow-weighted mean concentrations from 129 to 26 parts per billion (ppb).
adaptive management Keeps treatment areas operating Well During prolonged Drought
District staff manages the STAs using operational strategies based on comparisons of near real-time, weekly hydraulic and TP loading data to longer-term performance projections as well as actual field observations. Diligent efforts are made to prevent overloading of STA cells and to achieve permit-related compliance for water quality. In accordance with the Avian Protection Plan for the STAs, the District conducts annual surveys during the bird nesting season to monitor areas for the presence of nests and eggs. This information is used to support the agency’s water management decisions, while minimizing negative impacts to wildlife that utilize the STAs.
For the second consecutive water year, the STAs were affected by the regional drought. As part of proactive measures to deal with the drought, the District executed a contingency plan to minimize vegetative and operational impacts in the STAs in WY2008. The plan included operating procedures to maintain minimum stages in each STA. By setting higher stage targets, many of the treatment
16
Stormwater Treatment Areas attract native wildlife and provide recreational activities in addition excess phosphorus from surface waters entering the Everglades Protection Area.
to removing
17
Volume I • Chapter 5
WCA-1
WCA-2A
WCA-3A
LakeOkeechobee
AgriculturalArea
Everglades
C
A-2
A-1 B
B
Rotenberger Wildlife
ManagementArea
Holey LandWildlife
ManagementArea
Arthur R. Marshall LoxahatcheeNational Wildlife Refuge
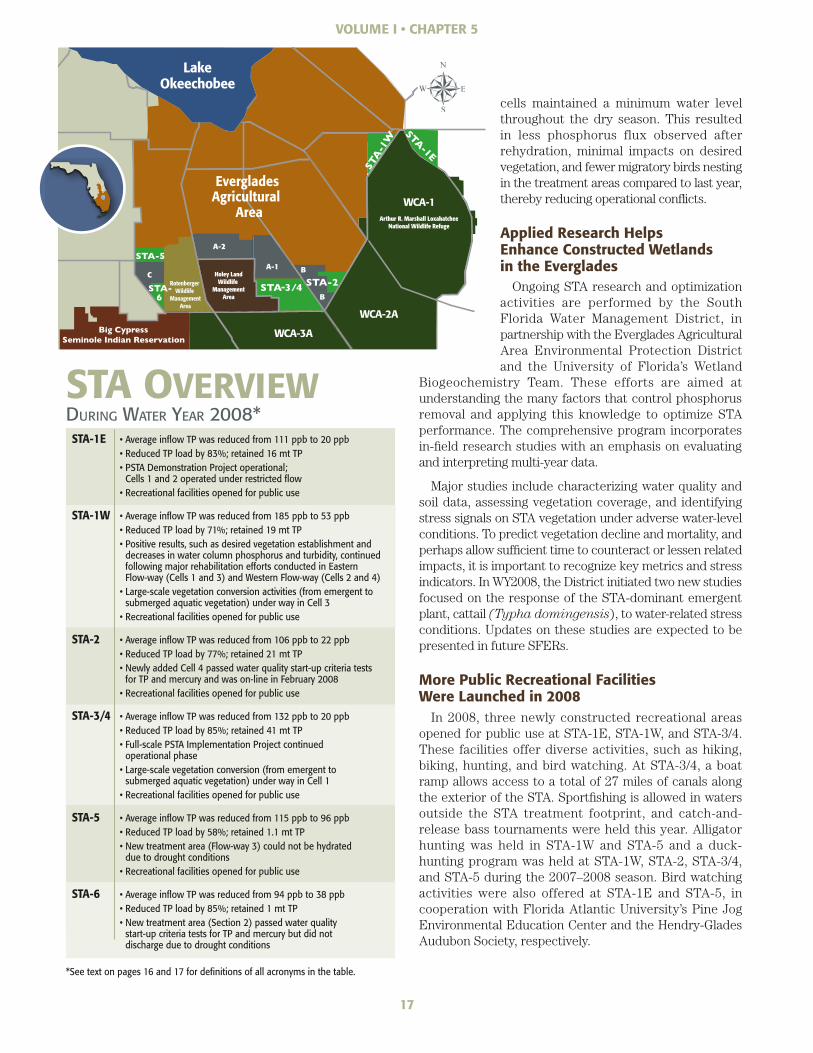
Sta-1e •AverageinflowTPwasreducedfrom111ppbto20ppb •ReducedTPloadby83%;retained16mtTP •PSTADemonstrationProjectoperational;
Cells 1 and 2 operated under restricted flow •Recreationalfacilitiesopenedforpublicuse
Sta-1W •AverageinflowTPwasreducedfrom185ppbto53ppb •ReducedTPloadby71%;retained19mtTP •Positiveresults,suchasdesiredvegetationestablishmentand
decreases in water column phosphorus and turbidity, continued following major rehabilitation efforts conducted in Eastern Flow-way (Cells 1 and 3) and Western Flow-way (Cells 2 and 4)
•Large-scalevegetationconversionactivities(fromemergenttosubmerged aquatic vegetation) under way in Cell 3
•Recreationalfacilitiesopenedforpublicuse
Sta-2 •AverageinflowTPwasreducedfrom106ppbto22ppb •ReducedTPloadby77%;retained21mtTP •NewlyaddedCell4passedwaterqualitystart-upcriteriatests
for TP and mercury and was on-line in February 2008 •Recreationalfacilitiesopenedforpublicuse
Sta-3/4 •AverageinflowTPwasreducedfrom132ppbto20ppb •ReducedTPloadby85%;retained41mtTP •Full-scalePSTAImplementationProjectcontinued
operational phase •Large-scalevegetationconversion(fromemergentto
submerged aquatic vegetation) under way in Cell 1 •Recreationalfacilitiesopenedforpublicuse
Sta-5 •AverageinflowTPwasreducedfrom115ppbto96ppb •ReducedTPloadby58%;retained1.1mtTP •Newtreatmentarea(Flow-way3)couldnotbehydrated
due to drought conditions •Recreationalfacilitiesopenedforpublicuse
Sta-6 •AverageinflowTPwasreducedfrom94ppbto38ppb •ReducedTPloadby85%;retained1mtTP •Newtreatmentarea(Section2)passedwaterquality
start-up criteria tests for TP and mercury but did not discharge due to drought conditions
During Water Year 2008*
cells maintained a minimum water level throughout the dry season. This resulted in less phosphorus flux observed after rehydration, minimal impacts on desired vegetation, and fewer migratory birds nesting in the treatment areas compared to last year, thereby reducing operational conflicts.
applied research helps enhance Constructed Wetlands in the everglades
Ongoing STA research and optimization activities are performed by the South Florida Water Management District, in partnership with the Everglades Agricultural Area Environmental Protection District and the University of Florida’s Wetland
Biogeochemistry Team. These efforts are aimed at understanding the many factors that control phosphorus removal and applying this knowledge to optimize STA performance. The comprehensive program incorporates in-field research studies with an emphasis on evaluating and interpreting multi-year data.
Major studies include characterizing water quality and soil data, assessing vegetation coverage, and identifying stress signals on STA vegetation under adverse water-level conditions. To predict vegetation decline and mortality, and perhaps allow sufficient time to counteract or lessen related impacts, it is important to recognize key metrics and stress indicators. In WY2008, the District initiated two new studies focused on the response of the STA-dominant emergent plant, cattail (Typha domingensis), to water-related stress conditions. Updates on these studies are expected to be presented in future SFERs.
more public recreational Facilities Were launched in 2008
In 2008, three newly constructed recreational areas opened for public use at STA-1E, STA-1W, and STA-3/4. These facilities offer diverse activities, such as hiking, biking, hunting, and bird watching. At STA-3/4, a boat ramp allows access to a total of 27 miles of canals along the exterior of the STA. Sportfishing is allowed in waters outside the STA treatment footprint, and catch-and-release bass tournaments were held this year. Alligator hunting was held in STA-1W and STA-5 and a duck-hunting program was held at STA-1W, STA-2, STA-3/4, and STA-5 during the 2007–2008 season. Bird watching activities were also offered at STA-1E and STA-5, in cooperation with Florida Atlantic University’s Pine Jog Environmental Education Center and the Hendry-Glades Audubon Society, respectively.
*See text on pages 16 and 17 for definitions of all acronyms in the table.
sta overview
Volume I • Chapter 6
ecology of the everglades Protection Area
The South Florida Water Management District and other collaborating agencies sponsor dozens of research projects that focus on several principal
study areas including regional hydrology, water quality, and ecosystem structure and function. These projects support developing performance measures and identifying sound alternatives for Everglades preservation and restoration. In the 2009 SFER – Volume I, Chapter 6 presents information on agency progress of 16 major research studies associated with Everglades wildlife, plant, ecosystem, and landscape ecology in Water Year 2008 (WY2008). Key highlights of some of these projects follow.
multiyear Studies Gather Information to restore Vanishing tree Islands
As a cornerstone of Everglades ecology, tree islands have a unique composition of plant species and are crucial
for many animal species that use these areas for mating, nesting, and foraging. Yet, these distinct habitats have been diminishing at considerable rates over recent decades. Although tree islands possess some inherent resilience to changes in water depth, most of these areas are extremely susceptible to degradation and species loss as a result of marked changes in water levels, especially those caused by drought or flooding.
To improve understanding of tree island dynamics, the District has been conducting studies in the Water Conservation Areas (WCAs) and in constructed island habitats at the Loxahatchee Impoundment Landscape Assessment (LILA) research facility at the Arthur R. Marshall Loxahatchee National Wildlife Refuge. In WY2008, research activities included (1) Old World climbing fern (Lygodium microphyllum) surveys in WCA-3A and 3B, (2) effects of hydrology, light, and soil conditions on woody plant recruitment and survival, (3) in situ plant responses to variations in water levels, and (4) LILA experiments on plant seedling growth and survival. As these multiyear studies continue, crucial findings will be used to better understand natural patterns on tree islands and the potential to restore islands that have been lost across the Everglades.
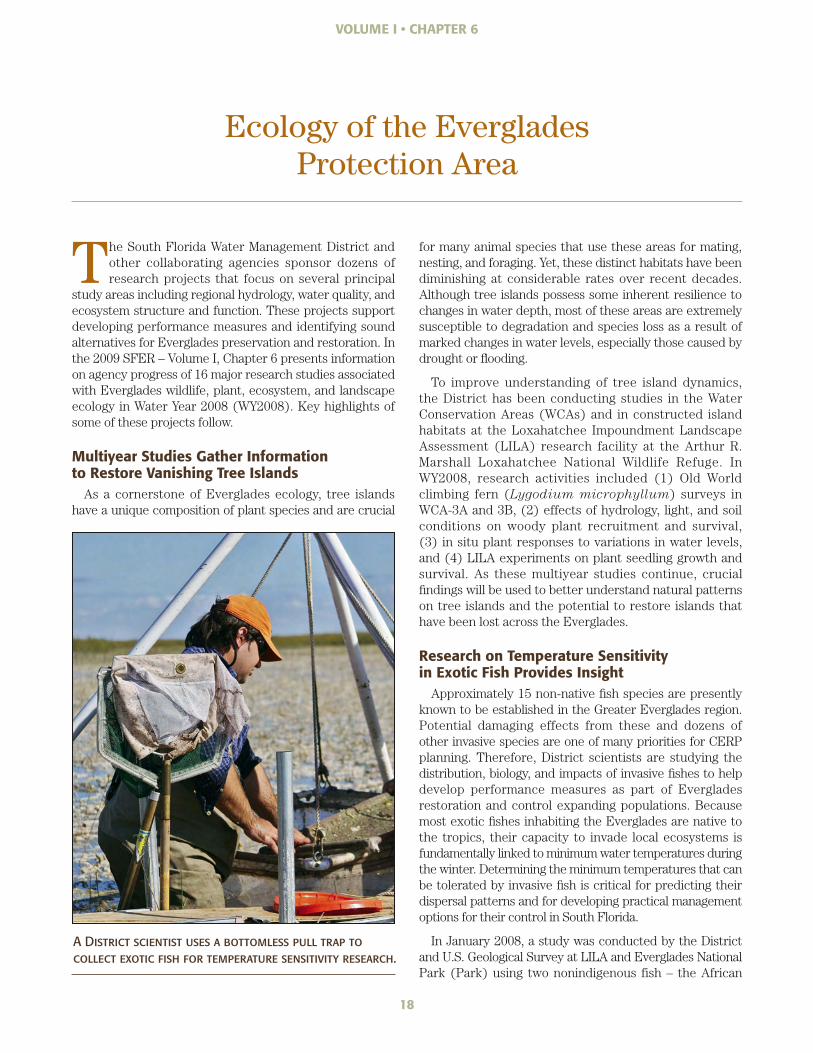
research on temperature Sensitivity in exotic Fish provides Insight
Approximately 15 non-native fish species are presently known to be established in the Greater Everglades region. Potential damaging effects from these and dozens of other invasive species are one of many priorities for CERP planning. Therefore, District scientists are studying the distribution, biology, and impacts of invasive fishes to help develop performance measures as part of Everglades restoration and control expanding populations. Because most exotic fishes inhabiting the Everglades are native to the tropics, their capacity to invade local ecosystems is fundamentally linked to minimum water temperatures during the winter. Determining the minimum temperatures that can be tolerated by invasive fish is critical for predicting their dispersal patterns and for developing practical management options for their control in South Florida.
In January 2008, a study was conducted by the District and U.S. Geological Survey at LILA and Everglades National Park (Park) using two nonindigenous fish – the African
18
A District scientist uses a bottomless pull trap to collect exotic fish for temperature sensitivity research.
19
Volume I • Chapter 6
0
10,000
20,000
30,000
40,000
50,000
WCA-2 and WCA-3
WCA-1
Park
20082007200620052004200320022001200019991998
CALENDAR YEAR
TOTA
L N
UM
BER
OF
NES
TS
LEGEND
44,657
3,7682,973950
16,145
11,436
jewelfish (Hemichromis letourneuxi) and Mayan cichlid (Cichlasoma urophthalmus) – that may have deleterious effects on the Everglades food web. Findings showed that both species have a minimum water temperature tolerance of 10 ºC. These species are susceptible to cold winter conditions in shallow Everglades marshes, but deeper canals provide refuge in warmer waters. As planned efforts continue to restore more natural sheetflow in the marsh system similar to historical conditions and reduce canal water depths, tropical exotic fish such as the jewelfish and cichlid may be better controlled in the Everglades.
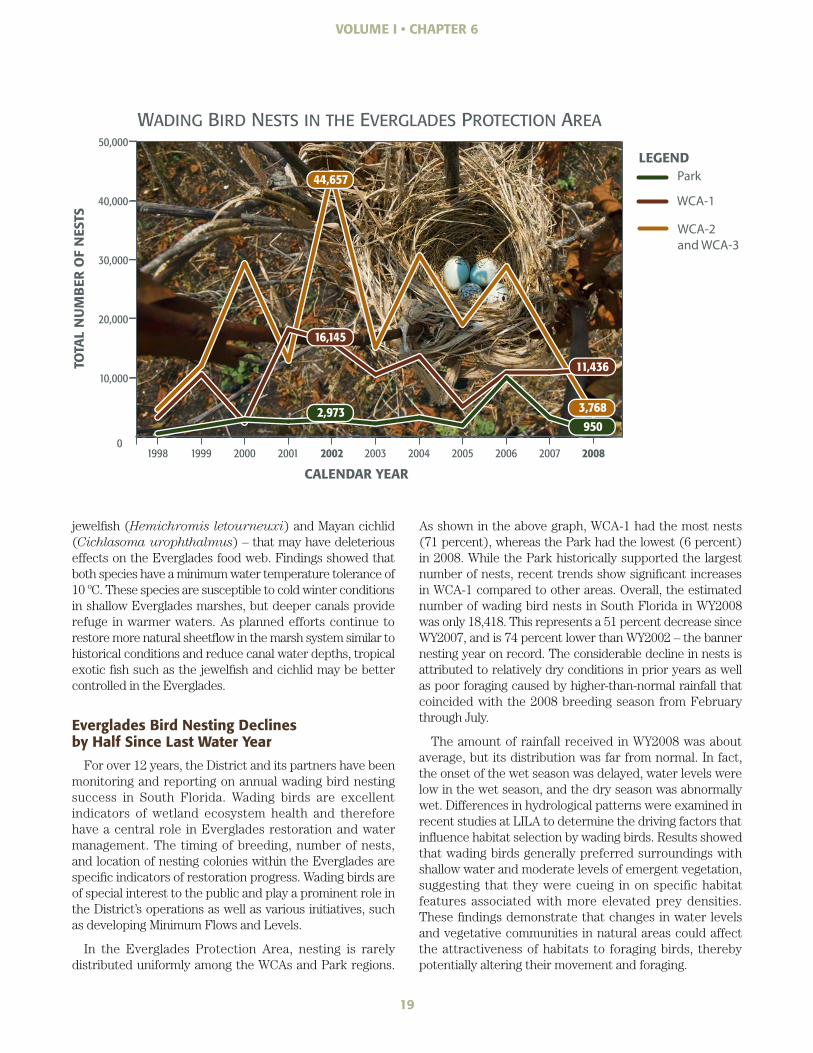
everglades Bird Nesting Declines by half Since last Water Year
For over 12 years, the District and its partners have been monitoring and reporting on annual wading bird nesting success in South Florida. Wading birds are excellent indicators of wetland ecosystem health and therefore have a central role in Everglades restoration and water management. The timing of breeding, number of nests, and location of nesting colonies within the Everglades are specific indicators of restoration progress. Wading birds are of special interest to the public and play a prominent role in the District’s operations as well as various initiatives, such as developing Minimum Flows and Levels.
In the Everglades Protection Area, nesting is rarely distributed uniformly among the WCAs and Park regions.
As shown in the above graph, WCA-1 had the most nests (71 percent), whereas the Park had the lowest (6 percent) in 2008. While the Park historically supported the largest number of nests, recent trends show significant increases in WCA-1 compared to other areas. Overall, the estimated number of wading bird nests in South Florida in WY2008 was only 18,418. This represents a 51 percent decrease since WY2007, and is 74 percent lower than WY2002 – the banner nesting year on record. The considerable decline in nests is attributed to relatively dry conditions in prior years as well as poor foraging caused by higher-than-normal rainfall that coincided with the 2008 breeding season from February through July.
The amount of rainfall received in WY2008 was about average, but its distribution was far from normal. In fact, the onset of the wet season was delayed, water levels were low in the wet season, and the dry season was abnormally wet. Differences in hydrological patterns were examined in recent studies at LILA to determine the driving factors that influence habitat selection by wading birds. Results showed that wading birds generally preferred surroundings with shallow water and moderate levels of emergent vegetation, suggesting that they were cueing in on specific habitat features associated with more elevated prey densities. These findings demonstrate that changes in water levels and vegetative communities in natural areas could affect the attractiveness of habitats to foraging birds, thereby potentially altering their movement and foraging.
WaDing birD nests in the evergLaDes protection area

Volume I • Chapter 7a
everglades Restoration update
The South Florida Water Management District and the U.S. Army Corps of Engineers (USACE) are partners in the largest ecosystem restoration program
in the nation, the Comprehensive Everglades Restoration Plan (CERP). The District also collaborates with other governmental agencies on complementary water quality and ecosystem restoration projects – designed to work together to benefit the Greater Everglades ecosystem by increasing the total spatial extent of natural areas, enhancing habitat and functional quality, and improving native species abundance and diversity. Most projects meet multiple objectives such as increasing water storage, reducing seepage, and improving water quality. The regional environment will benefit as projects are implemented to improve the quantity, quality, timing, and distribution of water.
In previous SFERs, ecosystem restoration work in South Florida was described in this chapter as being accomplished through various federal and state programs and initiatives – CERP, Critical Restoration and expedited projects, Kissimmee River Restoration, Everglades Forever Act and Long-Term Plan projects, Lake Okeechobee Protection Plan, and Northern Everglades and Estuaries Protection Program (NEEPP). As reflected in its name, this year’s chapter is reorganized to report on related programs and projects across the Northern and Southern Everglades regions to focus on the full scope of Greater Everglades restoration. In the 2009 SFER – Volume I, Chapter 7A highlights the progress made in the planning, design, and construction of Everglades restoration projects during Fiscal Year 2008 (FY2008). The chapter also provides an update on the FY2008 status of CERP implementation and related financial information, fulfilling the statutorily mandated CERP Annual Report and other permit-related reporting. Looking ahead, some emerging restoration challenges and opportunities are also covered.
many Successes toward everglades restoration Were achieved in 2008
In recent years since the launch of CERP and other subsequent Everglades restoration initiatives, project planning activities have taken place, project sites have been identified and acquired, and design and construction activities are under way. Continuing with these integrated efforts, the District and USACE are working together to implement the planning, design, and construction of Everglades restoration projects. Highlights of key issues and achievements made during FY2008 follow.
In late 2007, Project Implementation Reports for three •
CERP projects – Indian River Lagoon – South, Picayune Strand Restoration, and the Fran Reich Preserve (Site 1 Impoundment) – were authorized by the U.S. Congress under the Water Resources Development Act (WRDA) 2007, the first WRDA since 2000. Project Implementation Reports for the Broward County Water Preserve Areas and C-43 Storage Reservoir were also completed in 2007 but were not part of the WRDA authorization.
The CERP planning process is beginning to achieve •
results in terms of lining up federal appropriations. The 2008–2009 federal budget includes the first request for the U.S. Congress to appropriate funds for a CERP project. If approved, this appropriation will allow the USACE to initiate construction on the Picayune Strand Restoration Project.
In FY2008, the District completed final plans and •
specifications for three expedited projects: C-44 Reservoir and Stormwater Treatment Area (STA), C-43 West Basin Storage Reservoir, and three components of the Biscayne Bay Coastal Wetlands projects. Expedited design for two large STA expansions, Compartments B and C buildouts, under the Long-Term Plan was also completed by late 2008. Construction will begin on the C-44 Reservoir and STA expansion buildouts in FY2009.
The District has now acquired all the lands needed •
to complete the first phase of the expedited C-111 Spreader Canal Project. Gaining tremendous momentum over the past year, the project’s final design plans and specifications are planned to be completed by May 2009, to be immediately followed by construction start-up.
In May 2008, a federal lawsuit was filed claiming that •
the USACE 404 Dredge and Fill Permit to construct the Everglades Agricultural Area (EAA) Reservoir was inconsistent with the intent of WRDA 2000. Construction was subsequently halted on the EAA Reservoir – the first above-ground, water storage facility planned to be built for CERP – to avoid significant financial risks associated with mobilizing a massive workforce and related equipment.
During FY2008, 5,442 acres were acquired for CERP •
projects at a total cost of $131.6 million. Key acquisitions include lands for the Indian River Lagoon – South and North Palm Beach County – Part 1 projects. Totaling over 229,000 acres, nearly 59 percent of the land planned for CERP has been acquired as of the end of the fiscal year.
20

21
Volume I • Chapter 7a
Much progress was made on fulfilling NEEPP requirements, as the Lake Okeechobee Watershed Construction Project Phase II Technical Plan, Northern Everglades Work Plan, and Caloosahatchee and St. Lucie River Watershed Protection Plans were all timely completed in 2008. Plan objectives are to identify required storage and water quality features, areas for restoring wetlands, urban and agricultural Best Management Practices, and options for removing muck from water bodies to achieve water clarity and quality goals. These goals are intended to curtail habitat loss and allow recovery of more desirable estuarine habitats.
Studies Investigate possible effects of Sea level rise on Water management and everglades restoration
As a state virtually surrounded by salt water, the consequence of future sea level rise is of utmost concern to Florida’s water managers. Although the impacts of global warming regionally in Florida are not well understood, potential implications of climate change and sea level rise on water management in general, and Everglades restoration in particular, could be significant. Specifically, in South Florida, further inland movement of the seawater front could have impacts on underground water supply wellfields, the continued effectiveness of coastal structures to control water flow in canals, and planning assumptions for ecosystem restoration and other water resource projects.
In summer 2008, the District began an effort to better understand the climate change vulnerabilities and adaptation strategies for regional water management and restoration. In FY2009, the District is planning to determine the future research necessary for identifying specific vulnerabilities and adaptation strategies to counter potential impacts of climate change. The District’s efforts will be closely coordinated with those of the Florida Department of Environmental Protection and the Florida Governor’s Action Team on Energy and Climate Change (www.dep.state.fl.us/climatechange).
State takes Steps toward historic acquisition to revive the River of Grass
In June 2008, the South Florida Water Management District entered into a nonbinding Statement of Principles with the United States Sugar Corporation regarding acquisition of the company’s land for the purpose of Everglades restoration. After five months of extensive deliberation, due diligence, and public input, the District’s Governing Board voted in December 2008 to accept a contract with the United States Sugar Corporation to acquire, subject to financing, more than 180,000 acres of agricultural land for Everglades restoration. The land, located south of Lake Okeechobee, could be used to reestablish a hydrologic connection between the lake and the remnant Everglades through a managed system of water storage and treatment.
The proposed land acquisition offers water managers the potential to store, clean, and manage water on a massive scale. The District expects that the opportunity to dedicate significantly more land in the EAA toward restoration could build upon and enhance CERP and NEEPP goals to restore and protect Lake Okeechobee and the downstream St. Lucie and Caloosahatchee estuaries. This proposed purchase would be the largest public land acquisition in Florida’s history and the single most important action to protect the Everglades since the designation of Everglades National Park 60 years ago.
Benefits from the proposed land acquisition Include:
• Huge increases in the availability of water storage, significantly reducing the potential for harmful discharges from Lake Okeechobee to Florida’s coastal rivers and estuaries when lake levels are high
•TheabilitytodelivercleanerwatertotheEvergladesduring dry times and greater water storage to protect the natural system during wet years
•Preventingtonsofphosphorusfromentering the Everglades
•Significantlyreducingtheneedforback-pumpingwaterinto Lake Okeechobee from the Everglades Agricultural Area to augment regional water supply needs
•Additionalwaterstoragealternatives,relievingsome pressures on the Herbert Hoover Dike while the federal government undertakes repairs
•SignificantflexibilityinmanagingLakeOkeechobeelevels in a more environmentally friendly way
Reviving theRiveR of GRass
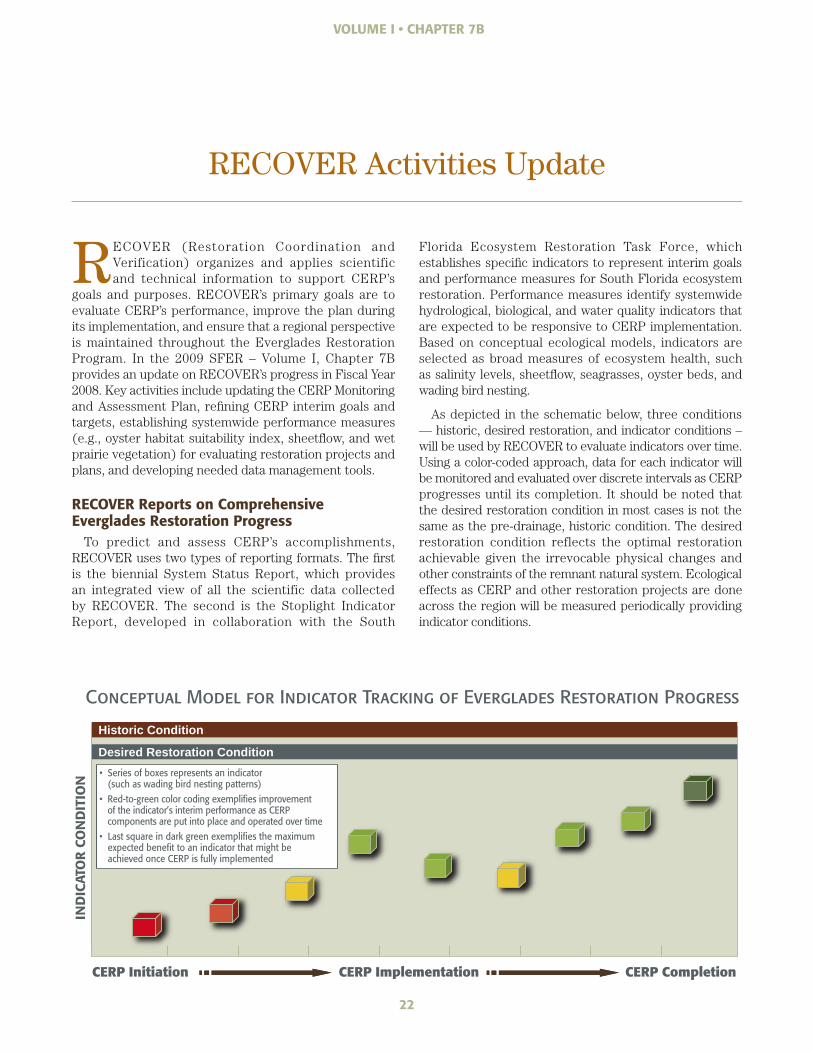
ReCoVeR Activities update
RECOVER (Restoration Coordination and Verification) organizes and applies scientific and technical information to support CERP’s
goals and purposes. RECOVER’s primary goals are to evaluate CERP’s performance, improve the plan during its implementation, and ensure that a regional perspective is maintained throughout the Everglades Restoration Program. In the 2009 SFER – Volume I, Chapter 7B provides an update on RECOVER’s progress in Fiscal Year 2008. Key activities include updating the CERP Monitoring and Assessment Plan, refining CERP interim goals and targets, establishing systemwide performance measures (e.g., oyster habitat suitability index, sheetflow, and wet prairie vegetation) for evaluating restoration projects and plans, and developing needed data management tools.
reCoVer reports on Comprehensive everglades restoration progress
To predict and assess CERP’s accomplishments, RECOVER uses two types of reporting formats. The first is the biennial System Status Report, which provides an integrated view of all the scientific data collected by RECOVER. The second is the Stoplight Indicator Report, developed in collaboration with the South
Florida Ecosystem Restoration Task Force, which establishes specific indicators to represent interim goals and performance measures for South Florida ecosystem restoration. Performance measures identify systemwide hydrological, biological, and water quality indicators that are expected to be responsive to CERP implementation. Based on conceptual ecological models, indicators are selected as broad measures of ecosystem health, such as salinity levels, sheetflow, seagrasses, oyster beds, and wading bird nesting.
As depicted in the schematic below, three conditions –– historic, desired restoration, and indicator conditions – will be used by RECOVER to evaluate indicators over time. Using a color-coded approach, data for each indicator will be monitored and evaluated over discrete intervals as CERP progresses until its completion. It should be noted that the desired restoration condition in most cases is not the same as the pre-drainage, historic condition. The desired restoration condition reflects the optimal restoration achievable given the irrevocable physical changes and other constraints of the remnant natural system. Ecological effects as CERP and other restoration projects are done across the region will be measured periodically providing indicator conditions.
22
Volume I • Chapter 7B
Historic Condition
Desired Restoration Condition
CERP Initiation CERP Implementation CERP Completion
IND
ICAT
OR
CO
ND
ITIO
N
Series of boxes represents an indicator •(such as wading bird nesting patterns) Red-to-green color coding exemplifies improvement •of the indicator’s interim performance as CERP components are put into place and operated over time Last square in dark green exemplifies the maximum •expected benefit to an indicator that might be achieved once CERP is fully implemented
Conceptual Model for Indicator Tracking of Everglades Restoration Progress

Volume I • Chapter 8
The long-term Everglades water quality goal is for all surface water discharges to the Everglades Protection Area (EPA) to achieve and maintain
water quality standards, in accordance with the Everglades Forever Act. To attain this goal, the South Florida Water Management District is strategically implementing projects outlined in the 2003 Long-Term Plan for Achieving Water Quality Goals in the EPA (known as the Long-Term Plan) and its subsequent amendments.
In the 2009 SFER – Volume I, Chapter 8 updates the agency’s progress on fulfilling the Long-Term Plan requirements. The diverse activities in this plan are covered in several Volume I chapters including Chapter 3A (Everglades water quality), Chapter 4 (phosphorus source controls for Everglades tributary basins), Chapter 5 (performance and enhancements of the Stormwater Treatment Areas), Chapter 6 (research on impacted Everglades ecosystems), Chapter 7A (STA Expansions under Everglades restoration), and Chapter 13 (financial reporting on Long-Term Plan activities).
Strategic measures Surpass expectations for attaining Water Quality Goals
Substantial progress toward reducing total phosphorus (TP) levels discharged into the EPA has been made by the state of Florida and other stakeholders. Since their
inception and through the end of April 2008, the Everglades Agricultural Area’s Best Management Practices and the Stormwater Treatment Areas combined have removed 2,848 metric tons of TP that otherwise would have entered the Everglades. Of this amount, approximately 170 metric tons of TP were removed in Water Year 2008. Adding to this progress, further measures are necessary to meet water quality goals. Therefore, continuing phosphorus source controls are being carried out strategically in urban and other tributary basins in the Everglades.
everglades long-term plan adaptively Integrates New Information
Consistent with the Everglades Forever Act requirements, the Long-Term Plan is revised in an adaptive manner to ensure that new information is incorporated as expeditiously as possible. Through Fiscal Year 2008, nine revisions to the plan have been approved by the Florida Department of Environmental Protection. The first eight revisions are highlighted in Volume I, Chapter 8, of the 2005–2008 SFERs. Highlighted in this year’s SFER, the most recent revision was approved during Fiscal Year 2008. All revisions have been done through collective input from the state, stakeholders, and the public, and will aid in the state’s comprehensive efforts to meet the Everglades water quality goals.
Implementation of the long-Term Plan for Achieving Water Quality Goals in the
everglades Protection Area
23
The Long-Term Plan contains diverse projects – Stormwater Treatment Area enhancements, monitoring, and optimization, as well as upstream source controls and downstream monitoring and recovery research.
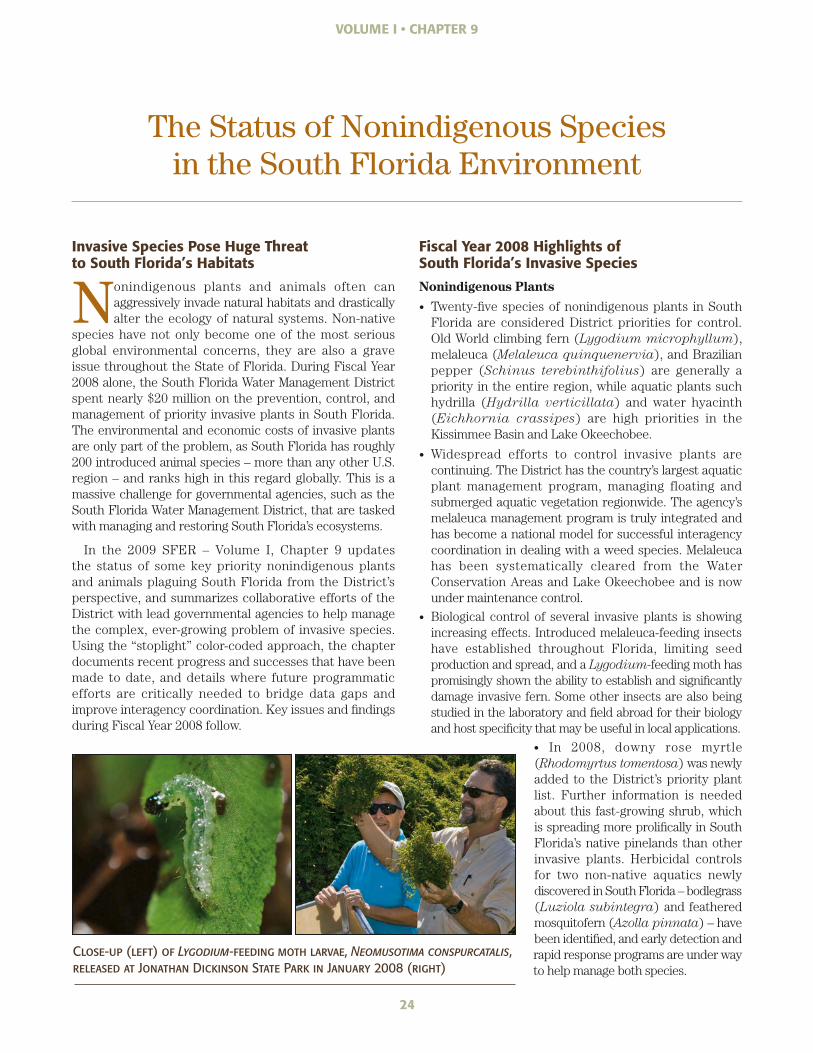
24
Invasive Species pose huge threat to South Florida’s habitats
Nonindigenous plants and animals often can aggressively invade natural habitats and drastically alter the ecology of natural systems. Non-native
species have not only become one of the most serious global environmental concerns, they are also a grave issue throughout the State of Florida. During Fiscal Year 2008 alone, the South Florida Water Management District spent nearly $20 million on the prevention, control, and management of priority invasive plants in South Florida. The environmental and economic costs of invasive plants are only part of the problem, as South Florida has roughly 200 introduced animal species – more than any other U.S. region – and ranks high in this regard globally. This is a massive challenge for governmental agencies, such as the South Florida Water Management District, that are tasked with managing and restoring South Florida’s ecosystems.
In the 2009 SFER – Volume I, Chapter 9 updates the status of some key priority nonindigenous plants and animals plaguing South Florida from the District’s perspective, and summarizes collaborative efforts of the District with lead governmental agencies to help manage the complex, ever-growing problem of invasive species. Using the “stoplight” color-coded approach, the chapter documents recent progress and successes that have been made to date, and details where future programmatic efforts are critically needed to bridge data gaps and improve interagency coordination. Key issues and findings during Fiscal Year 2008 follow.
Fiscal Year 2008 highlights of South Florida’s Invasive Species
Nonindigenous Plants
Twenty-five species of nonindigenous plants in South •
Florida are considered District priorities for control. Old World climbing fern (Lygodium microphyllum), melaleuca (Melaleuca quinquenervia), and Brazilian pepper (Schinus terebinthifolius) are generally a priority in the entire region, while aquatic plants such hydrilla (Hydrilla verticillata) and water hyacinth (Eichhornia crassipes) are high priorities in the Kissimmee Basin and Lake Okeechobee.
Widespread efforts to control invasive plants are •
continuing. The District has the country’s largest aquatic plant management program, managing floating and submerged aquatic vegetation regionwide. The agency’s melaleuca management program is truly integrated and has become a national model for successful interagency coordination in dealing with a weed species. Melaleuca has been systematically cleared from the Water Conservation Areas and Lake Okeechobee and is now under maintenance control.
Biological control of several invasive plants is showing •
increasing effects. Introduced melaleuca-feeding insects have established throughout Florida, limiting seed production and spread, and a Lygodium-feeding moth has promisingly shown the ability to establish and significantly damage invasive fern. Some other insects are also being studied in the laboratory and field abroad for their biology and host specificity that may be useful in local applications.
• In 2008, downy rose myrtle (Rhodomyrtus tomentosa) was newly added to the District’s priority plant list. Further information is needed about this fast-growing shrub, which is spreading more prolifically in South Florida’s native pinelands than other invasive plants. Herbicidal controls for two non-native aquatics newly discovered in South Florida – bodlegrass (Luziola subintegra) and feathered mosquitofern (Azolla pinnata) – have been identified, and early detection and rapid response programs are under way to help manage both species.
The Status of Nonindigenous Species in the South Florida environment
Volume I • Chapter 9
Close-up (left) of Lygodium-feeding moth larvae, Neomusotima conspurcatalis, released at Jonathan Dickinson State Park in January 2008 (right)
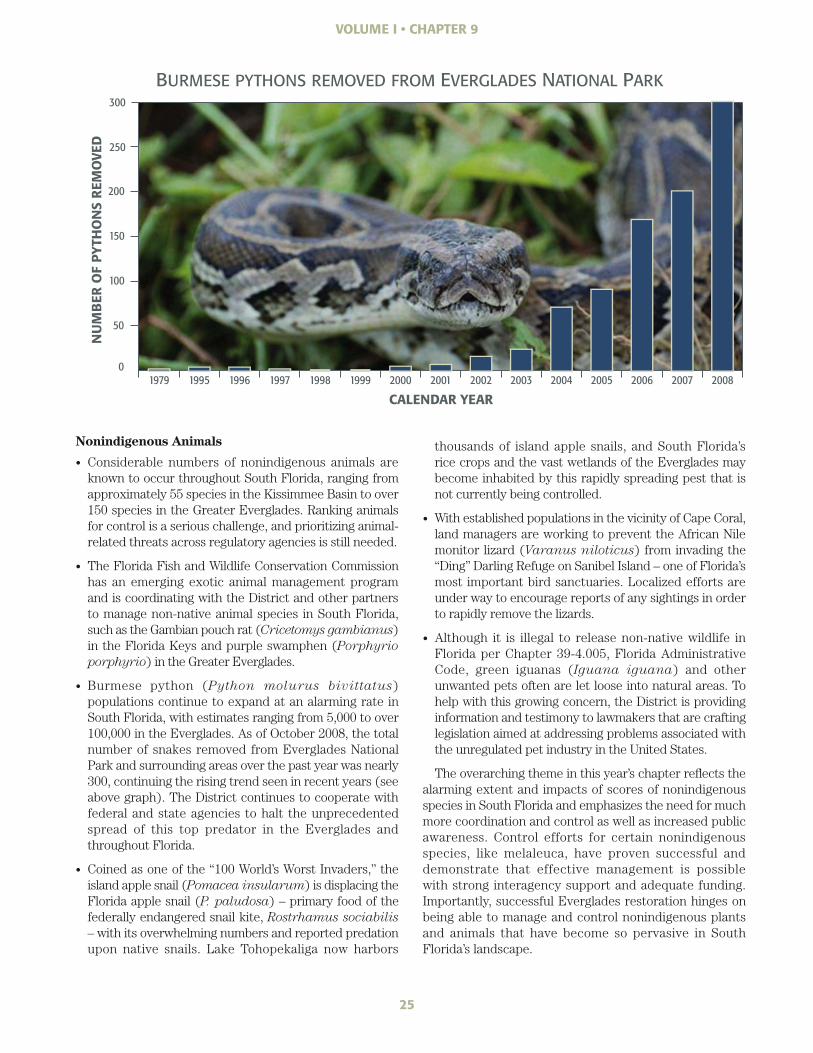
Volume I • Chapter 9
25
0
50
100
150
200
250
300
200820072006200520042003200220012000199919981997199619951979
NU
MB
ER O
F PY
THO
NS
REM
OVE
D
CALENDAR YEAR
Nonindigenous Animals
Considerable numbers of nonindigenous animals are •
known to occur throughout South Florida, ranging from approximately 55 species in the Kissimmee Basin to over 150 species in the Greater Everglades. Ranking animals for control is a serious challenge, and prioritizing animal-related threats across regulatory agencies is still needed.
The Florida Fish and Wildlife Conservation Commission •
has an emerging exotic animal management program and is coordinating with the District and other partners to manage non-native animal species in South Florida, such as the Gambian pouch rat (Cricetomys gambianus) in the Florida Keys and purple swamphen (Porphyrio porphyrio) in the Greater Everglades.
Burmese python (• Python molurus bivittatus) populations continue to expand at an alarming rate in South Florida, with estimates ranging from 5,000 to over 100,000 in the Everglades. As of October 2008, the total number of snakes removed from Everglades National Park and surrounding areas over the past year was nearly 300, continuing the rising trend seen in recent years (see above graph). The District continues to cooperate with federal and state agencies to halt the unprecedented spread of this top predator in the Everglades and throughout Florida.
Coined as one of the “100 World’s Worst Invaders,” the •
island apple snail (Pomacea insularum) is displacing the Florida apple snail (P. paludosa) – primary food of the federally endangered snail kite, Rostrhamus sociabilis – with its overwhelming numbers and reported predation upon native snails. Lake Tohopekaliga now harbors
thousands of island apple snails, and South Florida’s rice crops and the vast wetlands of the Everglades may become inhabited by this rapidly spreading pest that is not currently being controlled.
With established populations in the vicinity of Cape Coral, •
land managers are working to prevent the African Nile monitor lizard (Varanus niloticus) from invading the “Ding” Darling Refuge on Sanibel Island – one of Florida’s most important bird sanctuaries. Localized efforts are under way to encourage reports of any sightings in order to rapidly remove the lizards.
Although it is illegal to release non-native wildlife in •
Florida per Chapter 39-4.005, Florida Administrative Code, green iguanas (Iguana iguana) and other unwanted pets often are let loose into natural areas. To help with this growing concern, the District is providing information and testimony to lawmakers that are crafting legislation aimed at addressing problems associated with the unregulated pet industry in the United States.
The overarching theme in this year’s chapter reflects the alarming extent and impacts of scores of nonindigenous species in South Florida and emphasizes the need for much more coordination and control as well as increased public awareness. Control efforts for certain nonindigenous species, like melaleuca, have proven successful and demonstrate that effective management is possible with strong interagency support and adequate funding. Importantly, successful Everglades restoration hinges on being able to manage and control nonindigenous plants and animals that have become so pervasive in South Florida’s landscape.
burmese pYthons removeD From evergLaDes nationaL park
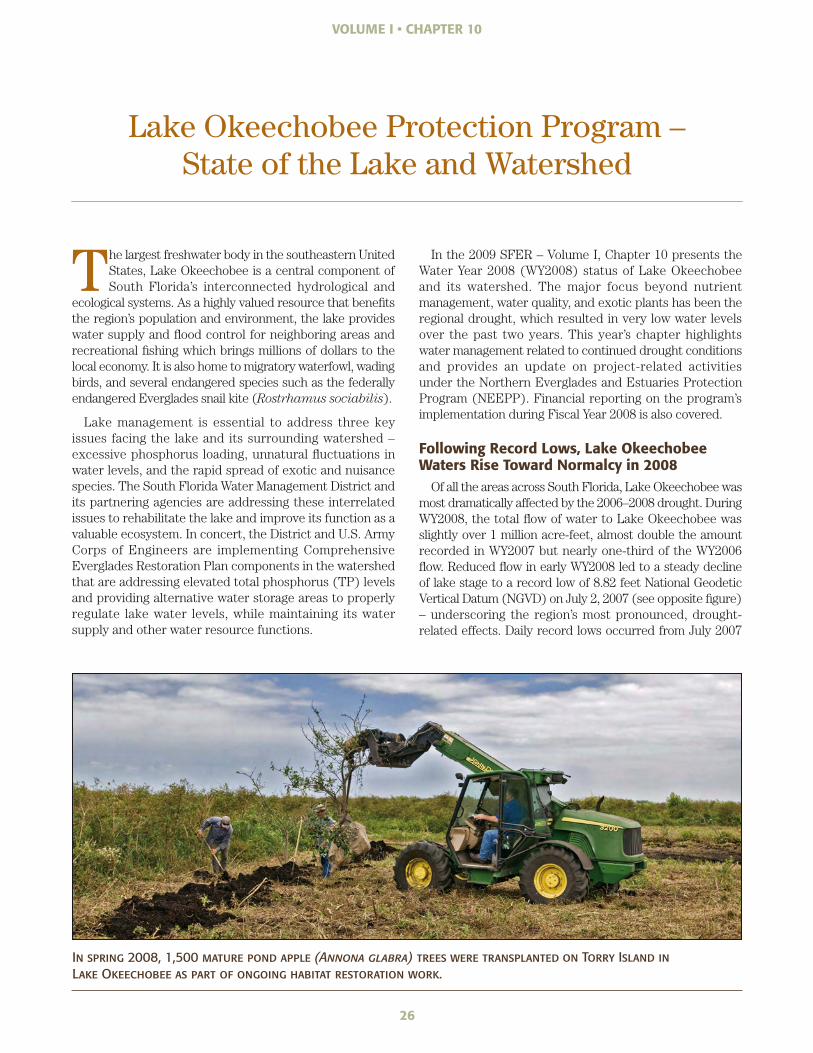
lake okeechobee Protection Program – State of the lake and Watershed
Volume I • Chapter 10
26
The largest freshwater body in the southeastern United States, Lake Okeechobee is a central component of South Florida’s interconnected hydrological and
ecological systems. As a highly valued resource that benefits the region’s population and environment, the lake provides water supply and flood control for neighboring areas and recreational fishing which brings millions of dollars to the local economy. It is also home to migratory waterfowl, wading birds, and several endangered species such as the federally endangered Everglades snail kite (Rostrhamus sociabilis).
Lake management is essential to address three key issues facing the lake and its surrounding watershed – excessive phosphorus loading, unnatural fluctuations in water levels, and the rapid spread of exotic and nuisance species. The South Florida Water Management District and its partnering agencies are addressing these interrelated issues to rehabilitate the lake and improve its function as a valuable ecosystem. In concert, the District and U.S. Army Corps of Engineers are implementing Comprehensive Everglades Restoration Plan components in the watershed that are addressing elevated total phosphorus (TP) levels and providing alternative water storage areas to properly regulate lake water levels, while maintaining its water supply and other water resource functions.
In the 2009 SFER – Volume I, Chapter 10 presents the Water Year 2008 (WY2008) status of Lake Okeechobee and its watershed. The major focus beyond nutrient management, water quality, and exotic plants has been the regional drought, which resulted in very low water levels over the past two years. This year’s chapter highlights water management related to continued drought conditions and provides an update on project-related activities under the Northern Everglades and Estuaries Protection Program (NEEPP). Financial reporting on the program’s implementation during Fiscal Year 2008 is also covered.
Following record lows, lake okeechobee Waters rise toward Normalcy in 2008
Of all the areas across South Florida, Lake Okeechobee was most dramatically affected by the 2006–2008 drought. During WY2008, the total flow of water to Lake Okeechobee was slightly over 1 million acre-feet, almost double the amount recorded in WY2007 but nearly one-third of the WY2006 flow. Reduced flow in early WY2008 led to a steady decline of lake stage to a record low of 8.82 feet National Geodetic Vertical Datum (NGVD) on July 2, 2007 (see opposite figure) – underscoring the region’s most pronounced, drought-related effects. Daily record lows occurred from July 2007
In spring 2008, 1,500 mature pond apple (Annona glabra) trees were transplanted Lake Okeechobee as part of ongoing habitat restoration work.
on Torry Island in

8.5
9.0
9.5
10.0
10.5
11.0
11.5
12.0
12.5
JAN FEB MAR APR MAY JUN JUL AUG SEP OCT NOV DEC
2008
2007
1982
2001
1981
1956
LEGEND
FEET
NAT
ION
AL
GEO
DET
IC V
ERTI
CAL
DAT
UM
CALENDAR YEAR
Volume I • Chapter 10
until April 2008 when water levels increased to over 10.5 feet NGVD. Persistent low water levels in Lake Okeechobee were a key reason for the District establishing water use restrictions throughout South Florida. These restrictions were strengthened from November 2006 through early 2008, but were eased in April 2008 as water levels improved. Fourteen temporary forward pumps were also deployed in Lake Okeechobee in March and April 2007 to maintain water supply to the Everglades Agricultural Area.
temporary lake regulation Schedule is approved in 2008
In April 2008, the U.S. Army Corps of Engineers approved a new regulation schedule for Lake Okeechobee (known as LORS2008) to replace the existing Water Supply and Environment regulation schedule in effect since 2000. Started in April 2008, the revised schedule will help optimize operations within existing structural constraints to meet the diverse requirements of the lake, its receiving waters, and its users. LORS2008 is expected to result in lower average lake levels than those under current regulations. As such, a revised Water Shortage Management Plan has been developed to mitigate the effects of very low water levels, which may be more severe and frequent under the new schedule.
It is important to note that LORS2008 is intended to be a temporary schedule that focuses on public health and safety considerations associated with the integrity of the Herbert Hoover Dike. It is expected to be in effect until either the risk of dike failure is reduced with improvements to targeted dike areas or certain Comprehensive Everglades Restoration Plan projects are completed. A longer-term, alternative schedule will be needed eventually to address prolonged low lake levels and related impacts on the lake’s ecology and water supply.
Comprehensive measures are Designed to Improve lake and estuary health
Excessive phosphorus loads to Lake Okeechobee are predominantly associated with agricultural and urban activities in its watershed. To address these loads, the 2000 Lake Okeechobee Protection Act mandates that the lake’s Total Maximum Daily Load (TMDL) of 140 metric tons (mt) per year be met by 2015. This is considered necessary to achieve the in-lake TP target of 40 parts per billion (ppb). In April 2007, the Florida legislature substantially expanded the act to include protection and restoration of the Lake Okeechobee watershed and the Caloosahatchee River and St. Lucie River watersheds and estuaries, known as the Northern
27
2008 Lake okeechobee minimum Water LeveLscompareD to previous Years (1931–2007)
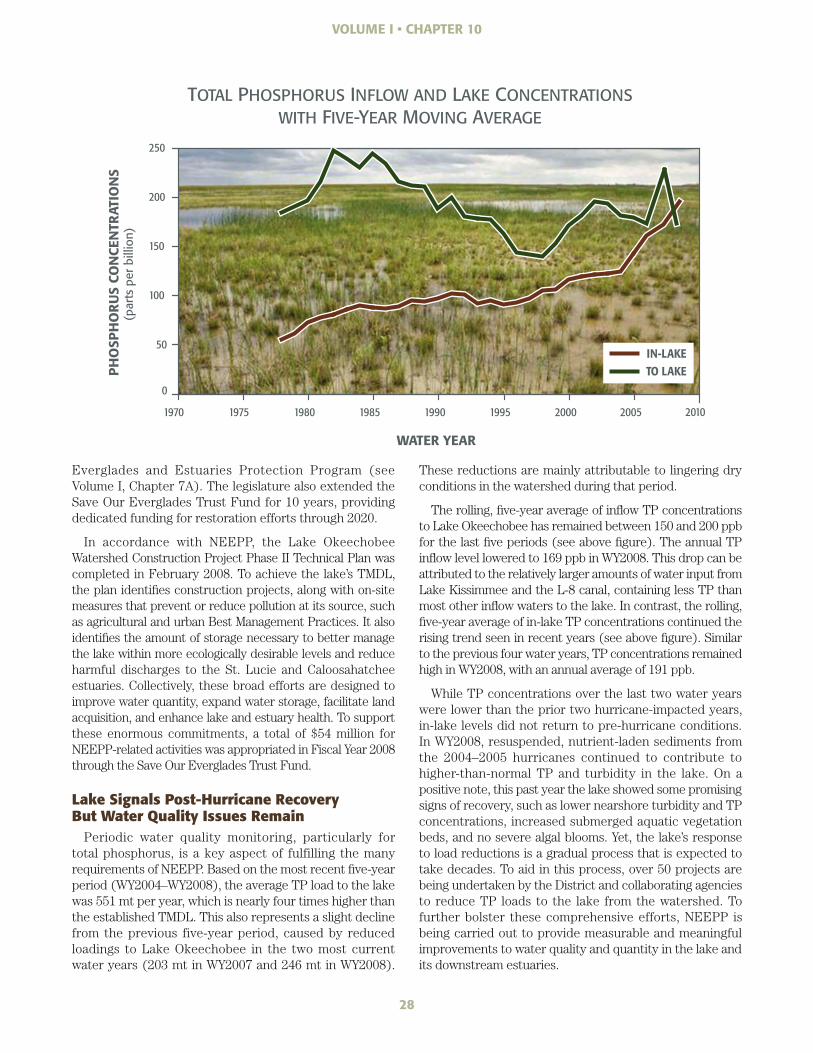
0
50
100
150
200
250
1970 1975 1980 1985 1990 1995 2000 2005 2010
WATER YEAR
PH
OSP
HO
RU
S CO
NCE
NTR
ATIO
NS
(par
ts p
er b
illio
n)
TO LAKEIN-LAKE
Everglades and Estuaries Protection Program (see Volume I, Chapter 7A). The legislature also extended the Save Our Everglades Trust Fund for 10 years, providing dedicated funding for restoration efforts through 2020.
In accordance with NEEPP, the Lake Okeechobee Watershed Construction Project Phase II Technical Plan was completed in February 2008. To achieve the lake’s TMDL, the plan identifies construction projects, along with on-site measures that prevent or reduce pollution at its source, such as agricultural and urban Best Management Practices. It also identifies the amount of storage necessary to better manage the lake within more ecologically desirable levels and reduce harmful discharges to the St. Lucie and Caloosahatchee estuaries. Collectively, these broad efforts are designed to improve water quantity, expand water storage, facilitate land acquisition, and enhance lake and estuary health. To support these enormous commitments, a total of $54 million for NEEPP-related activities was appropriated in Fiscal Year 2008 through the Save Our Everglades Trust Fund.
Lake Signals Post-Hurricane Recovery But Water Quality Issues Remain
Periodic water quality monitoring, particularly for total phosphorus, is a key aspect of fulfilling the many requirements of NEEPP. Based on the most recent five-year period (WY2004–WY2008), the average TP load to the lake was 551 mt per year, which is nearly four times higher than the established TMDL. This also represents a slight decline from the previous five-year period, caused by reduced loadings to Lake Okeechobee in the two most current water years (203 mt in WY2007 and 246 mt in WY2008).
These reductions are mainly attributable to lingering dry conditions in the watershed during that period.
The rolling, five-year average of inflow TP concentrations to Lake Okeechobee has remained between 150 and 200 ppb for the last five periods (see above figure). The annual TP inflow level lowered to 169 ppb in WY2008. This drop can be attributed to the relatively larger amounts of water input from Lake Kissimmee and the L-8 canal, containing less TP than most other inflow waters to the lake. In contrast, the rolling, five-year average of in-lake TP concentrations continued the rising trend seen in recent years (see above figure). Similar to the previous four water years, TP concentrations remained high in WY2008, with an annual average of 191 ppb.
While TP concentrations over the last two water years were lower than the prior two hurricane-impacted years, in-lake levels did not return to pre-hurricane conditions. In WY2008, resuspended, nutrient-laden sediments from the 2004–2005 hurricanes continued to contribute to higher-than-normal TP and turbidity in the lake. On a positive note, this past year the lake showed some promising signs of recovery, such as lower nearshore turbidity and TP concentrations, increased submerged aquatic vegetation beds, and no severe algal blooms. Yet, the lake’s response to load reductions is a gradual process that is expected to take decades. To aid in this process, over 50 projects are being undertaken by the District and collaborating agencies to reduce TP loads to the lake from the watershed. To further bolster these comprehensive efforts, NEEPP is being carried out to provide measurable and meaningful improvements to water quality and quantity in the lake and its downstream estuaries.
Volume I • Chapter 10
28
totaL phosphorus inFLoW anD Lake concentrations With Five-Year moving average

Volume I • Chapter 11
Kissimmee Basin
29
Encompassing approximately 3,000 square miles, the Kissimmee Basin forms the headwaters of the Kissimmee-Okeechobee-Everglades system. The
watershed is comprised of a diverse group of wetland and lake ecosystems within its Upper Basin – with more than two dozen water bodies and their tributary streams, known as the Kissimmee Chain of Lakes – and the Kissimmee River and floodplain in the Lower Basin. In the 1960s, the meandering Kissimmee River was channelized to prevent catastrophic flooding and much of the original floodplain was drained. However, there were pronounced impacts on the ecosystem – drastic declines in wetlands and wintering waterfowl, wading bird, and fish populations and associated loss of ecosystem functions. In the 2009 SFER, Volume I, Chapter 11 highlights major projects and key activities during Water Year 2008 (WY2008) associated with the Kissimmee River Restoration Project and other Kissimmee Basin initiatives. The chapter also summarizes the mission-critical activities of the South Florida Water Management District for flood control, water supply, water quality, and natural systems in the Upper and Lower Kissimmee basins.
Wading Birds in the Kissimmee river Floodplain rebound in 2008
During WY2008, environmental conditions in the Kissimmee Basin remained strongly influenced by lingering drought. While the drought’s severity lessened in WY2008, rainfall totals remained slightly below average for the Upper and Lower basins, representing 87 and 98 percent of historical annual averages, respectively. After the halt of releases from the Upper Basin into the Kissimmee River for nearly nine months, water flow into the river was restored in July 2007 with the return of a relatively normal wet season. Unlike WY2007, Upper Basin inflows by the end of WY2008 had increased sufficiently to inundate a portion of the floodplain for about six weeks. Densities of long-legged wading birds and waterfowl on the restored floodplain rebounded in WY2008. Exceeding restoration expectations, bird densities were over three times higher than last year’s drought-related, six-year low. This increase was likely in response to the summer flooding, which created adequate foraging conditions that attracted flocks of birds.
thousands of acres of Kissimmee Basin Wetlands are Being reclaimed
The South Florida Water Management District and the U.S. Army Corps of Engineers are collaborating on the Kissimmee River Restoration and the Kissimmee River Headwaters Revitalization projects. Together, these large-scale restoration projects will (1) reestablish the river-floodplain system’s ecological integrity by reconstructing the river’s physical form and reestablishing pre-channelization hydrologic characteristics (stage and discharge), (2) provide the water storage and regulation schedule modifications needed to approximate the historical flow characteristics of the Kissimmee River system, and (3) increase the quantity and quality of shoreline habitat in lakes Kissimmee, Hatchineha, Tiger, and Cypress for the benefit of fish and wildlife.
As water levels recede in the dry season, isolated pools with concentrated prey attract foraging wading birds, such as white ibis (Eudocimus albus).
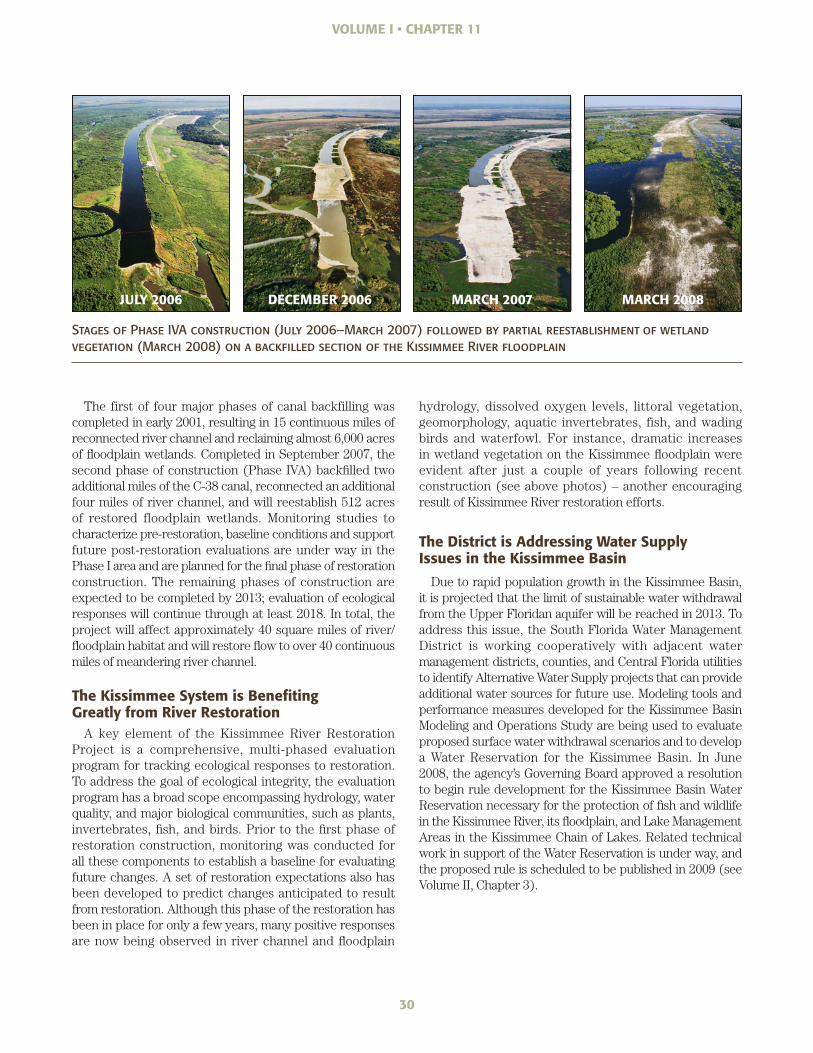
30
Volume I • Chapter 11
JulY 2006 DeCemBer 2006 marCh 2007 marCh 2008
The first of four major phases of canal backfilling was completed in early 2001, resulting in 15 continuous miles of reconnected river channel and reclaiming almost 6,000 acres of floodplain wetlands. Completed in September 2007, the second phase of construction (Phase IVA) backfilled two additional miles of the C-38 canal, reconnected an additional four miles of river channel, and will reestablish 512 acres of restored floodplain wetlands. Monitoring studies to characterize pre-restoration, baseline conditions and support future post-restoration evaluations are under way in the Phase I area and are planned for the final phase of restoration construction. The remaining phases of construction are expected to be completed by 2013; evaluation of ecological responses will continue through at least 2018. In total, the project will affect approximately 40 square miles of river/floodplain habitat and will restore flow to over 40 continuous miles of meandering river channel.
the Kissimmee System is Benefiting Greatly from river restoration
A key element of the Kissimmee River Restoration Project is a comprehensive, multi-phased evaluation program for tracking ecological responses to restoration. To address the goal of ecological integrity, the evaluation program has a broad scope encompassing hydrology, water quality, and major biological communities, such as plants, invertebrates, fish, and birds. Prior to the first phase of restoration construction, monitoring was conducted for all these components to establish a baseline for evaluating future changes. A set of restoration expectations also has been developed to predict changes anticipated to result from restoration. Although this phase of the restoration has been in place for only a few years, many positive responses are now being observed in river channel and floodplain
hydrology, dissolved oxygen levels, littoral vegetation, geomorphology, aquatic invertebrates, fish, and wading birds and waterfowl. For instance, dramatic increases in wetland vegetation on the Kissimmee floodplain were evident after just a couple of years following recent construction (see above photos) – another encouraging result of Kissimmee River restoration efforts.
the District is addressing Water Supply Issues in the Kissimmee Basin
Due to rapid population growth in the Kissimmee Basin, it is projected that the limit of sustainable water withdrawal from the Upper Floridan aquifer will be reached in 2013. To address this issue, the South Florida Water Management District is working cooperatively with adjacent water management districts, counties, and Central Florida utilities to identify Alternative Water Supply projects that can provide additional water sources for future use. Modeling tools and performance measures developed for the Kissimmee Basin Modeling and Operations Study are being used to evaluate proposed surface water withdrawal scenarios and to develop a Water Reservation for the Kissimmee Basin. In June 2008, the agency’s Governing Board approved a resolution to begin rule development for the Kissimmee Basin Water Reservation necessary for the protection of fish and wildlife in the Kissimmee River, its floodplain, and Lake Management Areas in the Kissimmee Chain of Lakes. Related technical work in support of the Water Reservation is under way, and the proposed rule is scheduled to be published in 2009 (see Volume II, Chapter 3).
Stages of Phase IVA construction (July 2006–March 2007) followed by partial reestablishment vegetation (March 2008) on a backfilled section of the Kissimmee River floodplain
of wetland

Volume I • Chapter 12
Management and Restoration of Coastal Ecosystems
South Florida’s coastal resources encompass 10 major watershed-estuarine systems: Southern Indian River Lagoon including the St. Lucie River and
Estuary, Loxahatchee River and Estuary, Lake Worth Lagoon, Caloosahatchee River and Estuary, Southern Charlotte Harbor, Estero Bay, Naples Bay, Biscayne Bay, and Florida Bay and the Florida Keys. One of the South Florida Water Management District’s primary goals is to manage freshwater discharges to coastal estuaries in a way that preserves, protects and, where possible, restores these critical ecosystems. Three major issues – altered delivery of fresh water, declining water quality, and continued habitat loss – are considerably impacting South Florida’s coastal areas. The cumulative impact of these stresses has altered ecosystem structure and impaired function throughout the region. The District is working with many organizations to produce a broad range of information and tools for better managing freshwater inputs to coastal systems. In the 2009 SFER – Volume I, Chapter 12 highlights aspects of this progress and related collaborative management and restoration efforts, with a special focus on the Caloosahatchee and St. Lucie River estuaries.
monitoring, modeling and research Supports ecosystem management
Coastal estuaries depend on fresh water for their existence and health. Over the past year, the District continued its efforts to better understand the links between healthy estuarine function and inflow of fresh water to help guide day-to-day management, restoration projects, and long-term planning. Along with partnering agencies, this has been accomplished through a combination of monitoring, applied research, and model development. There also has been continued support in establishing technical criteria for developing Minimum Flows and Levels (MFLs) and Water Reservations for several water bodies (see Volume II, Chapter 3). Water quality continues to be a major concern, and the District routinely coordinates with the Florida Department of Environmental Protection to address regional water quality concerns. Ongoing investigations are being conducted to quantify controls on coastal water quality, particularly as quality is affected by freshwater inflow and its management. An overview of the many efforts undertaken in Water Year 2008 (WY2008) follows.
Water Year 2008 highlights of South Florida Coastal ecosystems
Monitoring
In WY2008, submerged aquatic vegetation was mapped in portions of the Indian River Lagoon and Loxahatchee River Estuary to determine changes in cover from earlier years. An additional salinity and water stage monitoring site was established in the northern St. Lucie Estuary to better monitor freshwater inflow effects. Twelve new water quality monitoring sites were set up within Lake Worth Lagoon and three new sites in Naples Bay were added to create quality datasets to detect responses to restoration efforts. Water quality data from the Caloosahatchee River Estuary and Biscayne Bay are being used to detect trends,
31
The St. Lucie Estuary provides habitat for of native species and supports recreational activities.
hundredscommercial and

make comparisons, and assess performance. In Florida Bay, WY2008 monitoring results showed a decline in the lingering, large-scale algal bloom in the eastern bay. In contrast, water quality near the Florida Keys in the southern bay became a greater concern, as evidenced by a mass mortality of sponges in summer 2007.
Modeling
During WY2008, a three-dimensional hydrodynamic and water quality model was developed for the St. Lucie Estuary using tidal, salinity, and water quality data collected from 1997–2005. This model is being used to assess nutrient cycling processes, algal growth, and dissolved oxygen dynamics in the estuary. Also, a new seagrass/phytoplankton model for Florida Bay was developed and is being refined using in-field experiments, bioassays, and monitoring data. It is being calibrated with seagrass, phytoplankton, and nutrient cycling data, and various physical parameters.
Applied Research
In early 2008, three studies were conducted to estimate benthic fluxes of nitrogen and phosphorus during the dry season in the Caloosahatchee River and St. Lucie estuaries in support of developing Total Maximum Daily Load criteria. In WY2008, the District continued studying the effects of oxygenated fertilizer on enhancing survival of bald cypress (Taxodium distichum) seedlings in the Loxahatchee River floodplain. Several years of fish data collected in nearshore Biscayne Bay were correlated to salinity conditions, characterizing fish communities according to their habitat types. A fish study in Estero Bay was also completed, demonstrating a direct relationship between biodiversity and salinity conditions. Research activities in Florida Bay focused on meeting informational needs for updating the bay’s MFL, conducting weekly operations, and understanding the dynamics of algal blooms. Additionally, agency staff provided recommendations on causeway removal in Lake Surprise and established an ecological baseline for the first phase of the CERP C-111 Spreader Canal Project.
2009 Special Feature: Caloosahatchee and St. lucie river estuaries
Under the Northern Everglades and Estuaries Protection •
Program, the Caloosahatchee and St. Lucie River Watershed Protection Plans were completed in 2008. To improve long-term delivery and quality of water, four planning alternatives were formulated. For each sub-watershed within the Caloosahatchee and St. Lucie rivers and their watersheds, nutrient loads and
concentrations, land use, and other factors were evaluated and excess stormwater runoff was identified based on hydrologic simulations. This information was used to identify strateiges for achieving overall project objectives for water quality and quantity. To better understand the contribution of nutrient loads from upstream sources, a benthic flux study was also completed in both estuaries.
St. Lucie River Estuary.• Analysis of WY2008 monitoring results indicated that some seagrass cover has recovered from the damaging effects of the 2004–2005 hurricanes. Monitoring of bottom vegetation and Eastern oyster (Crassostrea virginica) abundance and distribution has been improved so that changes can be more readily detected for these important indicators of estuarine health. Eastern oysters, which were absent in the inner estuary in 2005, repopulated and continued to grow. Freshwater inflows to the estuary met the minimum flow criterion in WY2008.
Caloosahatchee River Estuary.• In WY2008, seagrass densities changed slightly depending on species and location. Shoal grass (Halodule wrightii) density declined toward the end of the water year, possibly as a result of prior dry conditions and reduced freshwater inflow, while turtle grass (Thalassia testudinum), which thrives in more salty and stable habitats, increased in some locations. Tape grass (Vallisneria americana), a species that lives in very low salinity habitats, was absent from monitored sites. Tape grass was replanted upstream of the S-79 structure so that mature plants can be a seed source as salinity conditions recover downstream. Despite unfavorable seasonal freshwater flow patterns in the river, Eastern oyster densities remained relatively stable overall. MFL salinity criteria were exceeded regularly in WY2008.
Volume I • Chapter 12
32
Extensive seagrass beds, sand flats, and mangrove forests span the lower reaches of the Caloosahatchee River Estuary.

Pursuant to the 1997 Everglades Oversight Act, the South Florida Water Management District is required to annually provide detailed financial
information on Everglades restoration. The Everglades Forever Act (EFA) also requires the District to account for all monies used to fund the Everglades Construction Project (ECP) and the Long-Term Plan for Achieving Water Quality Goals for Everglades Protection Area Tributary Basins (Long-Term Plan), and to provide a comparison annually of actual versus projected revenues and a projection of costs and revenues over the next five-year period. These annual financial reports are central to the 2009 SFER – Volume I, Chapter 13.
Dedicated Sources Continue to Support Southern everglades restoration
The 1994 Everglades Construction Project, a major element of the Everglades Restoration Program and the Everglades Forever Act, is one of the nation’s largest environmental restoration projects, originally with a projected cost of $836.2 million over 20 years. The 2003 state legislative session amended the 1994 EFA to include the Long-Term Plan as the strategy for achieving the Everglades long-term water quality goals. The amended EFA also expanded the use of the 1/10 mill ad valorem tax to include the initial phase of the Long-Term Plan,
including Stormwater Treatment Area (STA) enhancements, research, optimization, source control, and operation and maintenance. For Fiscal Year 2009 (FY2009), the EFA millage rate is 0.0894 mill. This reduced rate resulted from legislative-mandated changes to state property taxes that occurred in 2007.
The 2003 Long-Term Plan continues and expands the goals and objectives of the 1994 ECP and is a critical component of the overall effort to restore and protect the Everglades. Currently, the Long-Term Plan’s initial 13-year phase has a projected total cost of approximately $1.6 billion. This adjusted estimate reflects approved revisions to the Long-Term Plan through the end of FY2008. Further information on the STAs and the Long-Term Plan is presented in Volume I, Chapters 5 and 8, respectively.
The Florida Bay Restoration Program has a projected total cost of $367 million. In 1996, the District and the Florida Department of Transportation received federal authorization to redirect the use of Alligator Alley tolls for both restoration programs. A total of $39.1 million – split equally between both restoration programs – has been received since 1997. Further information on Florida Bay is presented in Volume I, Chapter 12.
Volume I • Chapter 13
everglades Forever Act Annual Financial Report
33
Committed funds help support Everglades restoration efforts to revive and preserve the River of Grass.
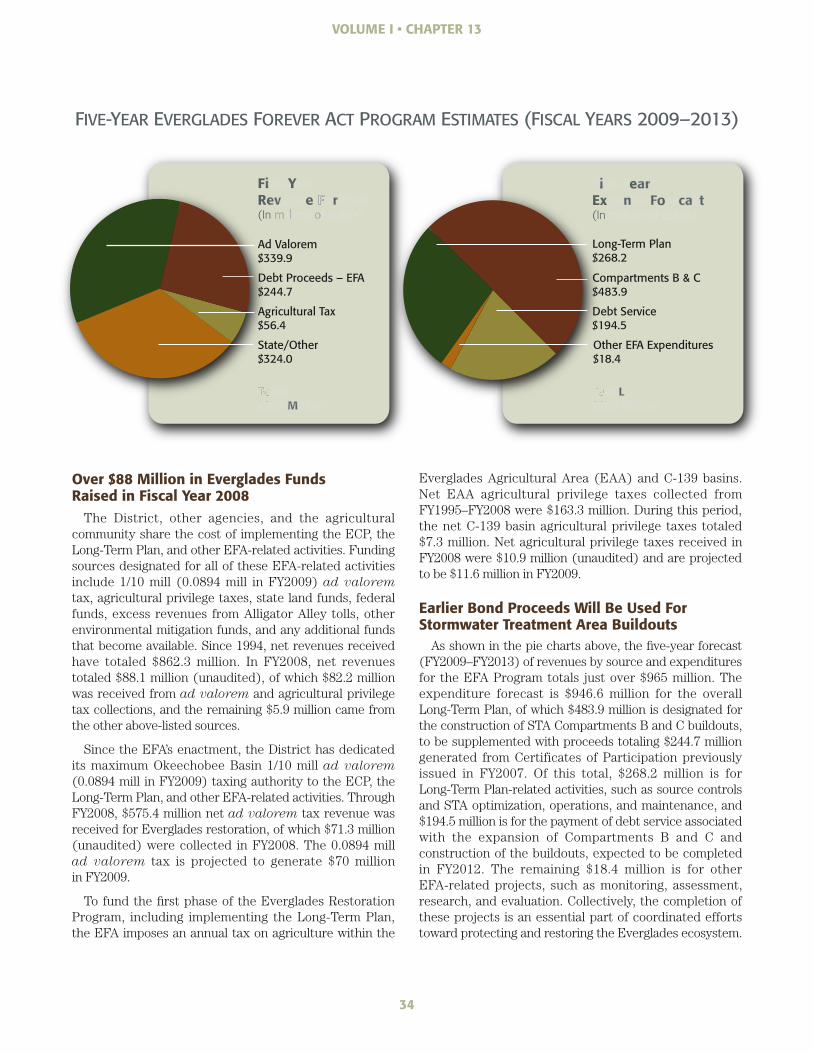
Volume I • Chapter 13
over $88 million in everglades Funds raised in Fiscal Year 2008
The District, other agencies, and the agricultural community share the cost of implementing the ECP, the Long-Term Plan, and other EFA-related activities. Funding sources designated for all of these EFA-related activities include 1/10 mill (0.0894 mill in FY2009) ad valorem tax, agricultural privilege taxes, state land funds, federal funds, excess revenues from Alligator Alley tolls, other environmental mitigation funds, and any additional funds that become available. Since 1994, net revenues received have totaled $862.3 million. In FY2008, net revenues totaled $88.1 million (unaudited), of which $82.2 million was received from ad valorem and agricultural privilege tax collections, and the remaining $5.9 million came from the other above-listed sources.
Since the EFA’s enactment, the District has dedicated its maximum Okeechobee Basin 1/10 mill ad valorem (0.0894 mill in FY2009) taxing authority to the ECP, the Long-Term Plan, and other EFA-related activities. Through FY2008, $575.4 million net ad valorem tax revenue was received for Everglades restoration, of which $71.3 million (unaudited) were collected in FY2008. The 0.0894 mill ad valorem tax is projected to generate $70 million in FY2009.
To fund the first phase of the Everglades Restoration Program, including implementing the Long-Term Plan, the EFA imposes an annual tax on agriculture within the
Everglades Agricultural Area (EAA) and C-139 basins. Net EAA agricultural privilege taxes collected from FY1995–FY2008 were $163.3 million. During this period, the net C-139 basin agricultural privilege taxes totaled $7.3 million. Net agricultural privilege taxes received in FY2008 were $10.9 million (unaudited) and are projected to be $11.6 million in FY2009.
earlier Bond proceeds Will Be used For Stormwater treatment area Buildouts
As shown in the pie charts above, the five-year forecast (FY2009–FY2013) of revenues by source and expenditures for the EFA Program totals just over $965 million. The expenditure forecast is $946.6 million for the overall Long-Term Plan, of which $483.9 million is designated for the construction of STA Compartments B and C buildouts, to be supplemented with proceeds totaling $244.7 million generated from Certificates of Participation previously issued in FY2007. Of this total, $268.2 million is for Long-Term Plan-related activities, such as source controls and STA optimization, operations, and maintenance, and $194.5 million is for the payment of debt service associated with the expansion of Compartments B and C and construction of the buildouts, expected to be completed in FY2012. The remaining $18.4 million is for other EFA-related projects, such as monitoring, assessment, research, and evaluation. Collectively, the completion of these projects is an essential part of coordinated efforts toward protecting and restoring the Everglades ecosystem.
34
Debt Proceeds – EFA$244.7
Agricultural Tax $56.4
M
Ad Valorem $339.9
State/Other $324.0
Other EFA Expenditures$18.4
Fi YRev e F r(In m l o
Compartments B & C $483.9
Debt Service$194.5
L
Long-Term Plan $268.2
i earEx n Fo ca t (In
Five-Year evergLaDes Forever act program estimates (FiscaL Years 2009–2013)
District AnnuAl PlAns AnD rePorts
Volume II Chapter 1 Introduction to the 2009 South Florida Environmental Report – Volume II . . . . . . . . . . . 36
Chapter 2 Fiscal Year 2008 annual Work plan report . . . . . . . . . . . . . . . . . . . . . . . . . . . . . . . . . . . . 37
Chapter 3 2009 priority List and Schedule for Minimum Flows and Levels, Water reservations and Water availability rules . . . . . . . . . . . . . . . . . . . . . . . . . . . . . . . 38
Chapter 4 Five-Year Capital Improvements plan . . . . . . . . . . . . . . . . . . . . . . . . . . . . . . . . . . . . . . . . . 40
Chapter 5a Five-Year Water resource Development Work program . . . . . . . . . . . . . . . . . . . . . . . . . . 41
Chapter 5B alternative Water Supply annual report . . . . . . . . . . . . . . . . . . . . . . . . . . . . . . . . . . . . . . 42
Chapter 6a Florida Forever Work plan, 2009 annual Update . . . . . . . . . . . . . . . . . . . . . . . . . . . . . . . . 43
Chapter 6B Land Stewardship annual report . . . . . . . . . . . . . . . . . . . . . . . . . . . . . . . . . . . . . . . . . . . . 44
Chapter 7 Mitigation Donation annual report . . . . . . . . . . . . . . . . . . . . . . . . . . . . . . . . . . . . . . . . . . 45

36
Volume II • Chapter 1
Introduction to the 2009 South Florida Environmental Report – Volume II
I n the 2009 South Florida Environmental Report (SFER) – Volume II, Chapter 1 provides an overview of the reporting objectives, as well as a basic understanding
of the governmental and legal basis for this volume. This chapter has been prepared in accordance with Chapter 2005-36, Laws of Florida, and Subsection 373.036(7), Florida Statutes, which direct each of the state’s water management districts to consolidate its annual plans and reports submitted to Florida’s governor and legislature.
statewide reporting reaches Five-Year Milestone
Whereas Volume I of the SFER includes reports unique to the South Florida Water Management District, Volume II, District Annual Plans and Reports, incorporates eight plans and reports that are required annually by each of Florida’s five water management districts. All the districts now consolidate these documents to improve reporting efficiency, quality, and accessibility. This unified reporting facilitates communication by making information more accessible to policymakers, stakeholders, and the public. Consistent with chapter topics and content in corresponding reports of the other districts, Volume II chapters cover the following eight reports:
Annual Work Plan Report•
Minimum Flows and Levels Priority List and Schedule•
Five-Year Capital Improvements Plan •
Five-Year Water Resource Development Work Program•
Alternative Water Supply Annual Report •
Florida Forever Work Plan, Annual Update•
Land Stewardship Annual Report•
Mitigation Donation Annual Report•
In addition to fulfilling mandated reporting requirements, this single submission is designed to facilitate comparisons to earlier separate reports and enable statewide evaluations with corresponding chapters in consolidated reports of other water management districts. The project-related information in this volume is described on a fiscal-year basis (from October 1–September 30), representing the 12-month period for which the District’s Performance Management cycle – the Strategic Plan, Annual Work Plan, Annual Budget, and Reporting and Evaluation – is developed and implemented.
Agency Database is now Web-Accessible
In its fifth year, the Consolidated Project Report Database has been updated with current descriptions of District projects (activities with start and end dates) and processes (ongoing activities) that are referenced in the 2009 SFER. The comprehensive database is designed to uniformly describe projects and processes linked to report-related planning efforts, while providing these details only once rather than repeating them in several reports. It also enables rapid data sorting, searches, and retrieval for efficient information and project management. As a newly added feature to this year’s report, further details on the 2009 database are available at www.sfwmd.gov/sfer, under the Database tab.
The South Florida Water Management District’s mission is to manage and protect regional water resources by balancing and improving water quality, flood control, natural systems, and water supply.

Volume II • Chapter 2
Fiscal Year 2008 Annual Work Plan Report
T he South Florida Water Management District’s annual business cycle is composed of four main elements: the Strategic Plan, Annual Work Plan,
Annual Budget, and Reporting and Evaluation. In this process, Work Plan Reports on the agency’s project and financial status are prepared semiannually, and the Year-End Financial Report represents the status at the end of the fiscal year. In the 2009 SFER – Volume II, Chapter 2 presents the year-end report of the Annual Work Plan, the final step of the annual process, and details the District’s major project activities during Fiscal Year 2008 (FY2008). This chapter reports on the status of planned project schedules, financial summaries for the agency’s 11 programs, and the values of the success indicators for each of these programs, as outlined in the Strategic Plan.
District Annual Work Plan Performance remains strong
In FY2008, adherence to the planned schedules for major District projects was categorized using color-coded criteria (see pie chart), with green representing those projects fully on-track with their planned schedules outlined in the Annual Work Plan. Using these criteria, 86 percent of District projects were green, an improvement of 6 percentage points from FY2007. During FY2008, 4 percent of the projects were yellow, which combined with the green projects means that 90 percent of all projects in FY2008 were within 60 days of their planned schedules – a solid performance in meeting this year’s Annual Work Plan objectives.
Spending rates Improve in Fiscal Year 2008The Annual Work Plan Report tracks the status of
revenues and expenditures as an indicator of overall program activity. During FY2008, the District collected 91 percent of budgeted revenue, or $860 million – down from 110 percent in FY2007. This FY2008 revenue included 99 percent of budgeted taxes (both ad valorem and agricultural privilege taxes), 68 percent of budgeted intergovernmental revenues, 421 percent of budgeted investment earnings, and 141 percent of other budgeted items, which include leases, licenses, permits, fees, and receipts from property sales.
In FY2008, the District spent 88 percent of the total budget, excluding personnel and reserves, of about $908 million. This is an increase of 25 percentage points from the 63 percent rate in FY2007. Both discretionary (90 percent) and restricted (87 percent) FY2008 budget expenditure rates also were greater than FY2007 levels (81 and 58 percent, respectively). Ten of the 11 programs achieved overall expenditure rates higher than in FY2007, and the eleventh program had a combined expenditure rate equal to FY2007. Aggressive efforts were made to close outstanding contract balances and set funds aside for the FY2009 budget. FY2008 expenditure rate increases were also driven by emergency structural repairs, higher fuel prices, land acquisition for the North Palm Beach County – Part 1 and Indian River Lagoon – South projects, and the final design for Compartments B and C of Stormwater Treatment Area expansions.
37
315 roj cts
35 rojects
TOT L 66
Within 30 days of schedule
Within 60 days of schedule
Behind schedule by over 60 days
LEGEND
(October 1, 2007–September 30, 2008)
FiScal year 2008 STaTuS oFMajor diSTricT projecTS

38
Volume II • Chapter 3
2009 Priority list and Schedule for minimum Flows and levels, Water Reservations
and Water Availability Rules
T he diverse natural systems in the South Florida region include wetlands, rivers, lakes, estuaries, bays, and aquifers. The South Florida
Water Management District uses three primary mechanisms to protect water supplies for these natural systems: (1) Minimum Flows and Levels (MFLs), (2) Water Reservations, and (3) Water Availability rules. In the 2009 SFER – Volume II, Chapter 3 highlights the general process and legal requirements for developing system-specific MFLs, Water Reservations, and Water Availability rules. The chapter also provides a summary of current rules in effect during 2009 and the priorities and schedule for developing new rules planned for 2010.
Florida has adopted minimum Flows and levels for 12 regional Water Bodies
Florida law requires that all water management districts establish MFLs for surface waters and aquifers within their jurisdiction. As depicted on the opposite map, MFL criteria have been adopted for 12 water bodies within the South Florida Water Management District’s boundaries, including eight water bodies in 2001, two in 2002, and two in 2006. These water bodies include Lake Okeechobee, four areas of the Everglades (Water Conservation Areas 1, 2, and 3, and Everglades National Park), Florida Bay, most of the Biscayne aquifer, Lower West Coast aquifers, Caloosahatchee River and Estuary, St. Lucie River and Estuary, the Northwest Fork of the Loxahatchee River, and Lake Istokpoga.
two new Approaches Will set Water Aside for Fish and Wildlife
In 2007 and 2008, the South Florida Water Management District took proactive steps to establish two new types of rules – Regional Water Availability and Water Reservation rules – designed to set aside water for natural systems in South Florida. In February 2007, the District’s Governing Board adopted the Regional Water Availability Rule, which restricts permitting of additional consumptive uses of water taken from the Everglades and Loxahatchee River watershed. In October 2008, the second Regional Water Availability Rule was adopted to expand coverage to the Lake Okeechobee, St. Lucie River, and Caloosahatchee River service areas (see opposite map).
State law also allows for the establishment of Water Reservations. The District is developing Water Reservations based on the evaluation of existing water availability and consideration of future water that may be made available by restoration projects. Water provided by restoration projects that are federally funded under the Water Resources Development Act (2000, as reauthorized in 2007) also requires that such water will be “reserved” for fish and wildlife and will not be permitted for consumptive use. In 2008, peer review and rule development were completed for the proposed Picayune Strand and Fakahatchee Estuary Water Reservations. The project is in the final stages of rule development with the final rule planned to be adopted by the District’s Governing Board in 2009.
Scenic view of the restored Prairie Canal in Picayune Strand Restoration Project area
the

Caloosahatchee
River
Kissimm
ee River
ATLANTICOCEAN
St. Lucie
River
GULFOF MEXICO
LakeKissimmee
Upper Chainof Lakes
Lake Istokpoga
LEGEND
WATER AVAILABILITY RULES 2007 – EVERGLADES AND LOXAHATCHEE 2008 – LAKE OKEECHOBEE, ST. LUCIE, AND CALOOSAHATCHEE
MINIMUM FLOWS AND LEVELS 2001 2006 2002 2009
WATER RESERVATIONS 2009 2010
Lower West Coast Aquifer System
BiscayneAquifer
BiscayneBay
St. LucieRiver
LoxahatcheeRiver
Picayune Strand
FakahatcheeEstuary
EvergladesNational
Park
FloridaBay
LakeOkeechobee
WCA-3
WCA-2
WCA-1
Volume II • Chapter 3
2009 priorities Focus on new Water reservations
The 2009 Priority List and Schedule was adopted by the District’s Governing Board in October 2008 and is expected to be approved by the Florida Department of Environmental Protection in early 2009. As reflected on the map, highlights of the District’s priority list for 2009 are presented below.
Picayune Strand and Fakahatchee Estuary Water •
Reservations. As noted above, the final Water Reservation rule, which includes water for both freshwater wetlands and the downstream estuary, is scheduled to be published in 2009. Once approved, these will be the District’s first Water Reservations.
Kissimmee River and Chain of Lakes Water Reservations.• The Water Reservations will target 19 lakes related to Kissimmee River restoration. These water bodies are a high priority due to the importance of restoring the Kissimmee River, and to identify future public water supplies in Central Florida that are being coordinated among neighboring water management districts. The expedited process is designed to complete rulemaking in 2009.
Biscayne Bay.• A scientific peer-review workshop was held in October 2008 to provide an independent review of the science that will support rule development across the entire bay system – from Snake Creek (north) to Barnes Sound (south), and including Biscayne National Park (central). The panel’s final report, received in November 2008, will be key to selecting an approach to MFL or Water Reservation rule development in 2009.
The list may be modified in the future, as necessary, to reflect federal authorizations and appropriations by the U.S. Congress for specific Everglades restoration projects that would require Water Reservations in advance of Project Cooperation Agreements with the U.S. Army Corps of Engineers.
39
Regional PRioRity WateR Bodies

The Five-Year Capital Improvements Plan (CIP) includes estimated capital project expenditures, anticipated revenues, and project descriptions for
the five-year period from Fiscal Years (FY) 2009–2013. The CIP reflects the District’s priorities as outlined in its Strategic Plan, provides a formal mechanism for decision making, and serves as a financial management tool and reporting document. It supports the agency’s mission by efficiently directing resources to District programs based on strategic priorities. Capital improvement projects include improvement/refurbishment, construction, and land acquisition for eight of the 11 District programs, as shown in the table below.
In the 2009 SFER – Volume II, Chapter 4 updates information presented in last year’s CIP. This chapter provides the five-year financial schedule of revenues and expenditures for those capital projects approved for FY2009, along with a four-year forecast. Descriptions of the capital projects are provided in the Consolidated Project Report Database.
strategic Priorities Guide Funds for Agency Programs
As reflected in the chart, the annual capital budget is consistent with the strategic priorities established by the District’s Governing Board. These priorities are to (1) restore the Everglades by acquiring land and planning projects to expand water storage and treatment options south of Lake Okeechobee to revive the River of Grass, advancing construction schedules of existing key projects, implementing the Long-Term Plan to achieve water quality standards; (2) protect and restore natural systems in the Northern Everglades (Kissimmee, Lake Okeechobee, Caloosahatchee, and St. Lucie watersheds) by increasing storage capacity and water quality treatment; and (3) refurbish the regional water management system by implementing the 50-year Plan. Everglades Restoration is planned to receive the major share of projected funds.
plan Forecasts Spending $4.4 Billion over the next Five Years
The five-year CIP represents $4.4 billion in project costs. As presented in the chart, the total FY2009 budgeted capital expenditures are $2.2 billion, which represents 76 percent of the total District FY2009 budget of over $2.9 billion and 51 percent of the total five-year CIP projected budget. The FY2009 capital budget is $1.4 million, almost two times greater than last year’s budget of $819.5 million. The increase is attributed to Everglades restoration, mainly due to the proposed River of Grass land acquisition, which is 78 percent of the capital budget. Although there is a significant increase in FY2009 for capital improvements, there were decreases within five programs. Reductions within the Coastal Watersheds and Lake Okeechobee programs are due to the completion of large land purchases. Other cost savings reflect reprioritizing funds and changing project schedules and scopes, largely in response to projected reductions in ad valorem revenue and available state funds.
Volume II • Chapter 4
Five-Year Capital Improvements Plan
40
MIL
LIO
NS
Y
$2247.1
$667.5 $580.5
$450.4 $441.6
$0
$500
$1,000
$1,500
$2,000
$2,500
Coastal Watersheds $8.2 $0 $0 $73.0 $7.0
Lake Okeechobee $70.8 $1.0 $14.8 $93.7 $40.4
Kissimmee Watershed $0.7 $0.7 $14.3 $0 $0
Everglades Restoration $2,104.1 $592.9 $482.7 $219.4 $332.6
Mission Support $0.3 $1.2 $0.2 $0.1 $0.1
Modeling & Scientific Support $1.6 $8.0 $2.5 $0 $0
Land Stewardship $4.6 $12.0 $12.4 $10.8 $10.3
Operations & Maintenance $56.8 $51.7 $53.6 $53.3 $51.2
total $2,247 .1 $667 .5 $580 .5 $450 .4 $441 .6
Five-year annual capiTal budgeT
eSTiMaTeS (FiScal yearS 2009–2013)
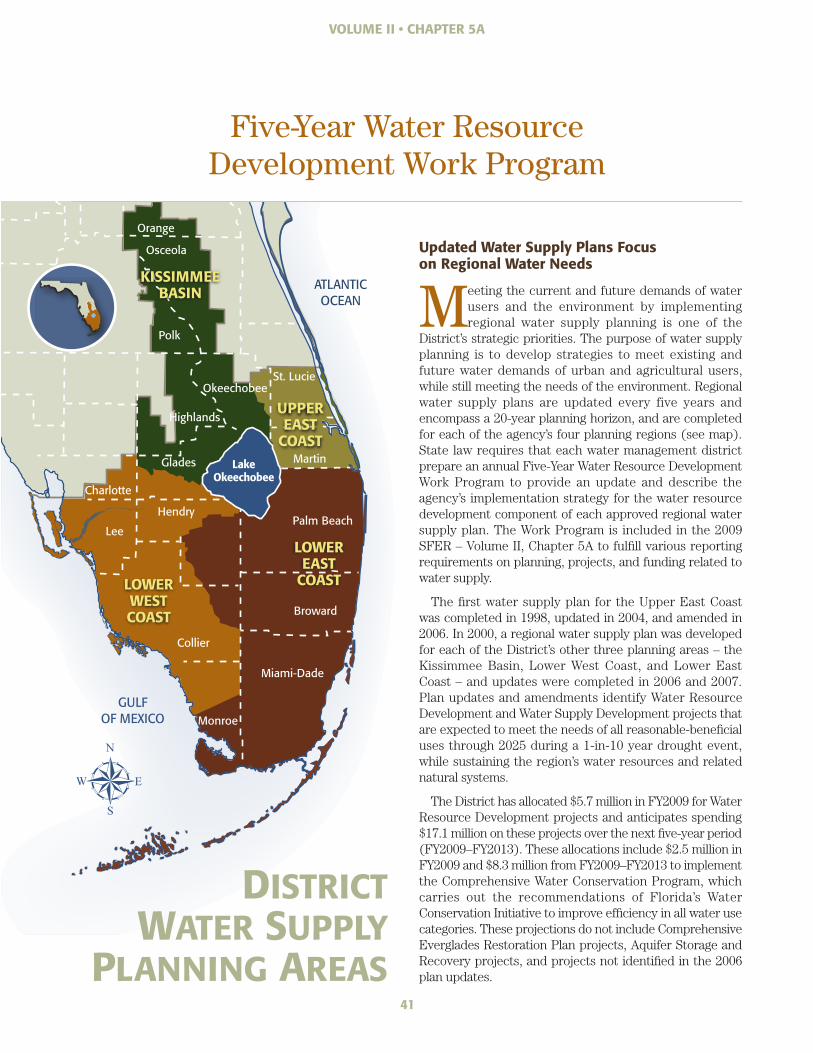
updated Water supply Plans Focus on regional Water needs
meeting the current and future demands of water users and the environment by implementing regional water supply planning is one of the
District’s strategic priorities. The purpose of water supply planning is to develop strategies to meet existing and future water demands of urban and agricultural users, while still meeting the needs of the environment. Regional water supply plans are updated every five years and encompass a 20-year planning horizon, and are completed for each of the agency’s four planning regions (see map). State law requires that each water management district prepare an annual Five-Year Water Resource Development Work Program to provide an update and describe the agency’s implementation strategy for the water resource development component of each approved regional water supply plan. The Work Program is included in the 2009 SFER – Volume II, Chapter 5A to fulfill various reporting requirements on planning, projects, and funding related to water supply.
The first water supply plan for the Upper East Coast was completed in 1998, updated in 2004, and amended in 2006. In 2000, a regional water supply plan was developed for each of the District’s other three planning areas – the Kissimmee Basin, Lower West Coast, and Lower East Coast – and updates were completed in 2006 and 2007. Plan updates and amendments identify Water Resource Development and Water Supply Development projects that are expected to meet the needs of all reasonable-beneficial uses through 2025 during a 1-in-10 year drought event, while sustaining the region’s water resources and related natural systems.
The District has allocated $5.7 million in FY2009 for Water Resource Development projects and anticipates spending $17.1 million on these projects over the next five-year period (FY2009–FY2013). These allocations include $2.5 million in FY2009 and $8.3 million from FY2009–FY2013 to implement the Comprehensive Water Conservation Program, which carries out the recommendations of Florida’s Water Conservation Initiative to improve efficiency in all water use categories. These projections do not include Comprehensive Everglades Restoration Plan projects, Aquifer Storage and Recovery projects, and projects not identified in the 2006 plan updates.
Five-Year Water Resource Development Work Program
Volume II • Chapter 5a
41
ATLANTICOCEAN
GULFOF MEXICO
LOWER EAST
COASTLOWER WESTCOAST
KISSIMMEEBASIN
UPPEREAST
COASTLake
Okeechobee
Monroe
Miami-Dade
Broward
Palm Beach Hendry
Collier
Lee
Charlotte
Glades
Highlands
Okeechobee
Polk
Osceola
Orange
St. Lucie
Martin
distRictWateR suPPly
Planning aReas

Volume II • Chapter 5B
42
Alternative Water Supply Annual Report
alternative Water Supplies help Satisfy regional Demands
Due to the limitations that exist on establishing traditional freshwater sources within the South Florida Water Management District, most future regional water needs will be met primarily through developing alternative water sources. To proactively address this important need, the District has had a very successful grant program to support the development of Alternative Water Supply (AWS) projects for over a decade. This program has invested approximately $163 million since 1996 for the construction of over 400 AWS projects. Projects eligible for funding under this program include the use of nontraditional water supply
sources, such as reclaimed water, stormwater, salt water, and brackish water; surface water captured predominately during wet-weather flows; and sources made available through additional storage capacity. In the 2009 SFER – Volume II, Chapter 5B provides an annual update on the agency’s AWS funding efforts during Fiscal Year 2008 (FY2008).
Daily Water Capacity Increases threefold Since Water Year 2006
In 2005, the Florida legislature created the Water Protection and Sustainability Program (WPSP), which provides annually recurring state funding to the South Florida Water Management District for the construction
of AWS projects. This included $30 million in FY2006 (the first year of the program), $18 million in FY2007, $15.6 million in FY2008, and $3.8 million in FY2009. The District’s AWS Funding Program, which administers WPSP funding, continues to be a success. During the three years prior to the WPSP legislation (FY2003–FY2005), the District funded 79 projects with $15 million that created 68 million gallons per day (mgd) of additional alternative water capacity. From FY2006–FY2008, the District approved over $116 million in funding, including WPSP funds, for 216 projects that created 218 mgd of additional alternative water capacity – nearly three times more than the previous three years combined.
For the FY2009 funding year, the District received 62 applications during the solicitation period from April–June 2008. In September and November 2008, the District’s Governing Board approved over $27 million to fund 39 AWS projects for FY2009. These projects are expected to create an additional 27 mgd, bringing the anticipated total water made available under the WPSP through FY2009 to 245 mgd.
Alternative Water Supply projects demonstrate the District’s commitment to provide a reliable, sustainable water supply for local communities.
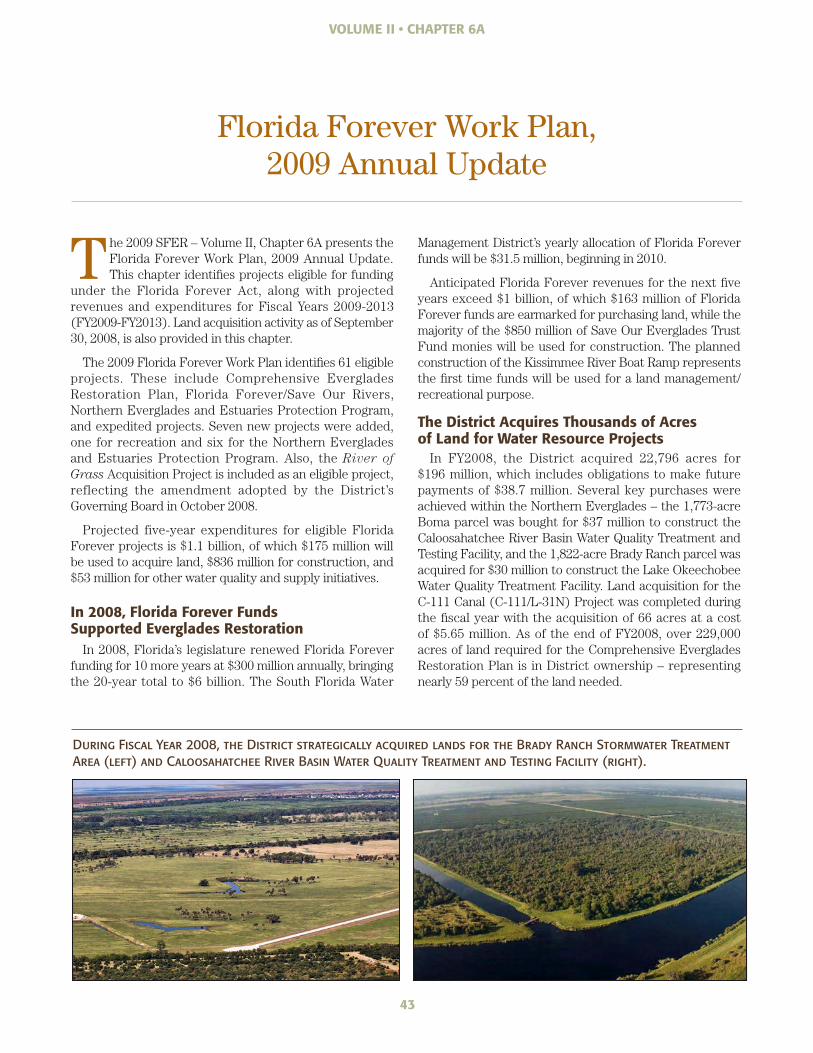
43
Volume II • Chapter 6a
Florida Forever Work Plan, 2009 Annual update
T he 2009 SFER – Volume II, Chapter 6A presents the Florida Forever Work Plan, 2009 Annual Update. This chapter identifies projects eligible for funding
under the Florida Forever Act, along with projected revenues and expenditures for Fiscal Years 2009-2013 (FY2009-FY2013). Land acquisition activity as of September 30, 2008, is also provided in this chapter.
The 2009 Florida Forever Work Plan identifies 61 eligible projects. These include Comprehensive Everglades Restoration Plan, Florida Forever/Save Our Rivers, Northern Everglades and Estuaries Protection Program, and expedited projects. Seven new projects were added, one for recreation and six for the Northern Everglades and Estuaries Protection Program. Also, the River of Grass Acquisition Project is included as an eligible project, reflecting the amendment adopted by the District’s Governing Board in October 2008.
Projected five-year expenditures for eligible Florida Forever projects is $1.1 billion, of which $175 million will be used to acquire land, $836 million for construction, and $53 million for other water quality and supply initiatives.
In 2008, Florida Forever Funds supported everglades restoration
In 2008, Florida’s legislature renewed Florida Forever funding for 10 more years at $300 million annually, bringing the 20-year total to $6 billion. The South Florida Water
Management District’s yearly allocation of Florida Forever funds will be $31.5 million, beginning in 2010.
Anticipated Florida Forever revenues for the next five years exceed $1 billion, of which $163 million of Florida Forever funds are earmarked for purchasing land, while the majority of the $850 million of Save Our Everglades Trust Fund monies will be used for construction. The planned construction of the Kissimmee River Boat Ramp represents the first time funds will be used for a land management/recreational purpose.
the District Acquires thousands of Acres of land for Water resource Projects
In FY2008, the District acquired 22,796 acres for $196 million, which includes obligations to make future payments of $38.7 million. Several key purchases were achieved within the Northern Everglades – the 1,773-acre Boma parcel was bought for $37 million to construct the Caloosahatchee River Basin Water Quality Treatment and Testing Facility, and the 1,822-acre Brady Ranch parcel was acquired for $30 million to construct the Lake Okeechobee Water Quality Treatment Facility. Land acquisition for the C-111 Canal (C-111/L-31N) Project was completed during the fiscal year with the acquisition of 66 acres at a cost of $5.65 million. As of the end of FY2008, over 229,000 acres of land required for the Comprehensive Everglades Restoration Plan is in District ownership – representing nearly 59 percent of the land needed.
During Fiscal Year 2008, the District strategically acquired lands for the Brady Ranch Stormwater Treatment Area (left) and Caloosahatchee River Basin Water Quality Treatment and Testing Facility (right).

Volume II • Chapter 6B
Land Stewardship Annual Report
public land Stewardship offers many regional Benefits
The Land Stewardship Program is responsible for planning and managing the South Florida Water Management District’s lands. This includes Save Our Rivers and other lands for natural system conservation, as well as those lands being held for future water resource projects. The Land Stewardship Program is also responsible for implementing and administrating mitigation banks and regional off-site mitigation areas, as well as for overseeing recreation on District lands. The program’s principal funding source is the Water Management Lands Trust Fund, which uses a portion of the state’s documentary tax revenue to pay for land management activities. Other funding sources include off-site mitigation, mitigation bank revenues, lease revenues, grants for wetland restoration and exotic control projects, the Everglades Restoration Trust Fund, and ad valorem tax revenues for Comprehensive Everglades Restoration Plan recreational programs.
Each year, the District is required to report on land management activities for all agency-owned properties and associated project areas. In the 2009 SFER – Volume II, Chapter 6B highlights the 21 Save Our Rivers and Florida Forever natural lands projects for the District’s five land management regions – Upper Lakes, Kissimmee/Okeechobee, East Coast, Everglades, and West Coast – and Fiscal Years (FY) 2008 and 2009 land management activities and acquisition status for each region. The chapter also includes project-specific descriptions for each of the Land Stewardship Program’s major components – hydrologic and habitat restoration, vegetation management, exotic species control, prescribed burning, wildlife management, public use, environmental education, law enforcement, mitigation, infrastructure management, planning, monitoring, and the management of project lands – which are those lands acquired for future implementation of the Comprehensive Everglades Restoration Plan and other water resource projects.
multiagency partnerships manage over 1.4 million acres of public lands
Over the course of its history, the South Florida Water Management District and its partnering agencies have acquired nearly 1.2 million acres of environmentally sensitive lands. These lands span across the South Florida
region from the northern reaches of the Kissimmee Chain of Lakes to the Southern Glades Wildlife and Environmental Area near Everglades National Park. As of September 2008, the District owns, and with its partners, manages almost 1.4 million acres of Save Our Rivers and other valued lands, including key designated areas for planned Everglades restoration projects. To support extensive land management efforts, the District uses more than 100 separately managed contracts, agreements, and leases with other governmental agencies and private entities. The FY2008 budget for the Land Stewardship Program was $11.5 million. Revenue generated from agricultural leases, sale of products, mitigation banks, and other alternative sources for FY2008 was in excess of $4.7 million. Management activities for FY2009 are anticipated to have a total cost of $12.4 million.
44
The District manages its lands to ensure between wide public use and restoring and protecting natural conditions.
a balance
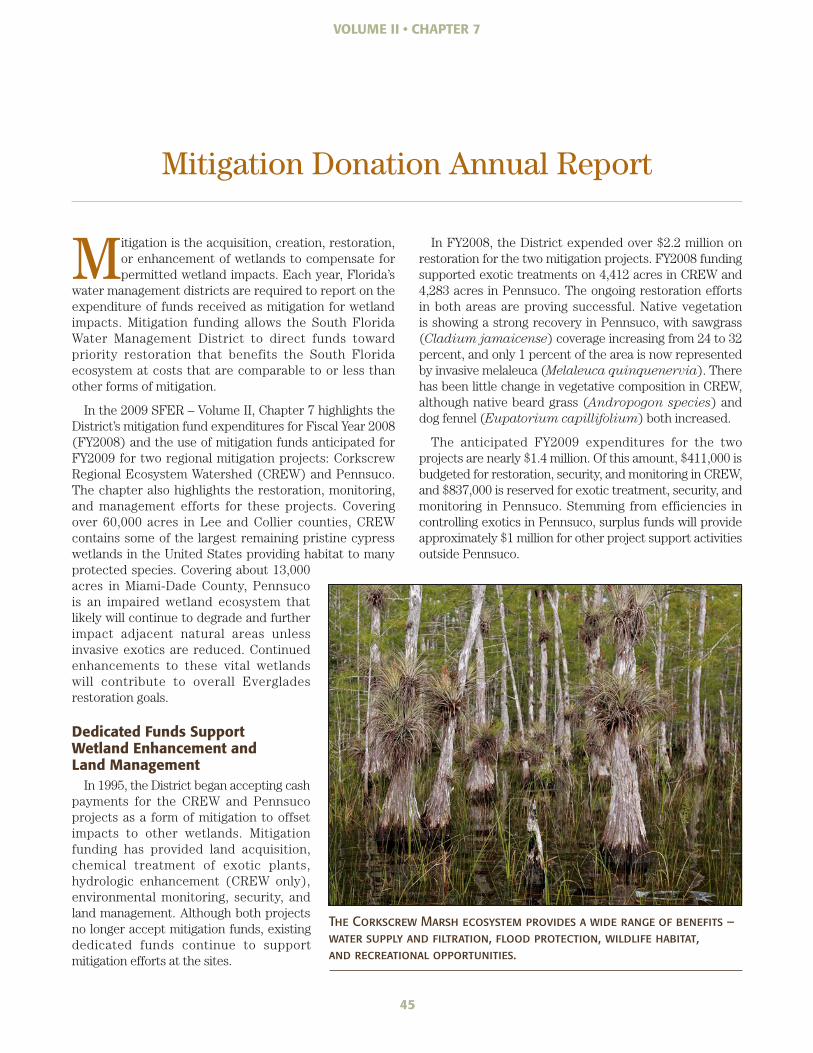
Volume II • Chapter 7
Mitigation Donation Annual Report
Mitigation is the acquisition, creation, restoration, or enhancement of wetlands to compensate for permitted wetland impacts. Each year, Florida’s
water management districts are required to report on the expenditure of funds received as mitigation for wetland impacts. Mitigation funding allows the South Florida Water Management District to direct funds toward priority restoration that benefits the South Florida ecosystem at costs that are comparable to or less than other forms of mitigation.
In the 2009 SFER – Volume II, Chapter 7 highlights the District’s mitigation fund expenditures for Fiscal Year 2008 (FY2008) and the use of mitigation funds anticipated for FY2009 for two regional mitigation projects: Corkscrew Regional Ecosystem Watershed (CREW) and Pennsuco. The chapter also highlights the restoration, monitoring, and management efforts for these projects. Covering over 60,000 acres in Lee and Collier counties, CREW contains some of the largest remaining pristine cypress wetlands in the United States providing habitat to many protected species. Covering about 13,000 acres in Miami-Dade County, Pennsuco is an impaired wetland ecosystem that likely will continue to degrade and further impact adjacent natural areas unless invasive exotics are reduced. Continued enhancements to these vital wetlands will contribute to overall Everglades restoration goals.
Dedicated Funds Support Wetland Enhancement and Land Management
In 1995, the District began accepting cash payments for the CREW and Pennsuco projects as a form of mitigation to offset impacts to other wetlands. Mitigation funding has provided land acquisition, chemical treatment of exotic plants, hydrologic enhancement (CREW only), environmental monitoring, security, and land management. Although both projects no longer accept mitigation funds, existing dedicated funds continue to support mitigation efforts at the sites.
In FY2008, the District expended over $2.2 million on restoration for the two mitigation projects. FY2008 funding supported exotic treatments on 4,412 acres in CREW and 4,283 acres in Pennsuco. The ongoing restoration efforts in both areas are proving successful. Native vegetation is showing a strong recovery in Pennsuco, with sawgrass (Cladium jamaicense) coverage increasing from 24 to 32 percent, and only 1 percent of the area is now represented by invasive melaleuca (Melaleuca quinquenervia). There has been little change in vegetative composition in CREW, although native beard grass (Andropogon species) and dog fennel (Eupatorium capillifolium) both increased.
The anticipated FY2009 expenditures for the two projects are nearly $1.4 million. Of this amount, $411,000 is budgeted for restoration, security, and monitoring in CREW, and $837,000 is reserved for exotic treatment, security, and monitoring in Pennsuco. Stemming from efficiencies in controlling exotics in Pennsuco, surplus funds will provide approximately $1 million for other project support activities outside Pennsuco.
45
The Corkscrew Marsh ecosystem provides a wide range water supply and filtration, flood protection, and recreational opportunities.
of benefits –wildlife habitat,
46
GlossaryAcre-feet (ac-ft): The volume required to cover one acre to a depth of one foot, commonly used to express large volumes of water (1 acre-foot = 325,900 gallons).
Ad valorem tax: A tax imposed on the value of real and personal property, as certified by the property appraiser in each county.
Alternative Water supply (AWs): A supply of water that has been reclaimed after municipal, commercial, and/or agricultural uses; or a supply of storm water, or brackish or salt water, that has been treated in accordance with applicable rules and standards sufficient to supply an intended use.
Aquifer storage and recovery (Asr): The injection of fresh water into a confined saline aquifer when water supply exceeds demand, and recovering it when there is a supply deficit.
Best management practices (Bmps): Land, agricultural, industrial, and waste management techniques that reduce pollutant export from a specified area.
Certificates of participation: As defined by Florida law (Section 373.584, Florida Statutes), a type of revenue bond that water management districts may issue to finance undertaking of any capital or other project for purposes permitted by the state’s constitution.
compliance monitoring: In a water quality management program, compliance is associated with meeting permit conditions as well as ambient standards. Periodic monitoring provides water quality data that are used to assess compliance.
Discharge (or Flow): The rate of water movement past a reference point, measured as volume per unit time (usually expressed as cubic feet or cubic meters per second).
Drought: An extended period of low rainfall, below normal flowstream, and depleted surface and subsurface storage.
estuary: The part of the wide lower course of a river where its current is met by ocean tides or an arm of the sea at the lower end of a river where fresh and salt water meet.
everglades Agricultural Area (eAA): An area extending south from Lake Okeechobee to the northern levee of Water Conservation Area 3A, from its eastern boundary at the L-8 canal to the western boundary along the L-1, L-2, and L-3 levees. The EAA incorporates almost 3,000 square kilometers (1,158 square miles) of highly productive agricultural land.
everglades construction Project (ecP): The foundation of a large ecosystem restoration program, composed of 12 interrelated construction projects between Lake Okeechobee and the Everglades, currently including nearly 45,000 acres of Stormwater Treatment Areas with an additional 15,000 acres planned for future completion. It also contains four hydropattern restoration projects that will improve the volume, timing, and distribution of water entering the Everglades.
everglades Forever Act (eFA): A 1994 Florida law (Section 373.4592, Florida Statutes), amended in 2003, to promote Everglades restoration and protection. This will be achieved through comprehensive and innovative solutions to issues of water quality, water quantity, hydroperiod, and invasion of exotic species to the Everglades ecosystem.
everglades Protection Area (ePA): As defined in the Everglades Forever Act, the EPA comprises Water Conservation Areas 1, 2A, 2B, 3A, and 3B, the Arthur R. Marshall Loxahatchee National Wildlife Refuge, and Everglades National Park.
expenditure: The disbursement of appropriated funds to purchase goods or services.
Fiscal Year (FY): The 12-month period for which the annual budget is developed and implemented. The fiscal year for the District begins on October 1 and ends on September 30.
Florida Forever Act: A 1999 Florida law (Section 259.105, Florida Statutes) authorizing the issuance of bonds to fund land acquisition, water resource development, stormwater management projects, water body restoration activities, recreational facilities, public access improvements, and invasive plant removal.
Florida statutes (F.s.): A permanent collection of state laws organized by subject area into a code made up of titles, chapters, parts, and sections. The Florida Statutes are updated annually by laws that create, amend, or repeal statutory material.
46

Flow-weighted mean concentration: The average concentration of a substance in water, corrected for the volume of water flow at the time of sampling. Samples taken when flow is high are given greater weight in the average.
Geometric mean: A statistical average of a set of transformed numbers, often used to represent a central tendency in highly variable data, such as water quality. It is calculated from data transformed using powers or logarithms and then transformed back to original scale after averaging.
loading (or mass loading): The amount of material carried by water into a specified area, expressed as mass per unit of time. One example is phosphorus loading into WCA-2A, measured in metric tons per year. Note that 1 metric ton (mt) is equivalent to 1,000 kilograms, or 2,205 pounds.
Minimum Flows and levels (MFls): Florida law (Chapter 373, Florida Statutes) requires the state’s water management districts to set water levels for each major body of water “…at which further withdrawals would be significantly harmful to the water resources or ecology of the area.”
northern everglades and estuaries Protection Program (neePP): As defined by Florida law (Section 373.4595, Florida Statutes), an initiative to holistically restore the Everglades through increased focus and integration of regional projects in the Northern Everglades, including the Lake Okeechobee watershed, and the Caloosahatchee and St. Lucie River watersheds and estuaries.
Parts per billion (ppb): A unit of measure, equivalent to micrograms per liter (1 ppb = 1 μg/L).
revenue: Monies received from all sources, with the exception of fund balances, that will be used to fund expenditures in a fiscal year.
stage: The height of a water surface above an established reference point. This vertical control measurement is usually expressed as feet National Geodetic Vertical Datum of 1929 or feet North American Vertical Datum of 1988.
stormwater treatment Area (stA): A large, constructed wetland designed to remove pollutants, particularly nutrients, from stormwater runoff using natural processes.
submerged aquatic vegetation (sAV): Wetland plants that exist completely below the water surface.
technology-based effluent limitation (tBel): An effluent limitation for a pollutant that is based on the capability of a treatment method to reduce the pollutant to a certain concentration.
total Maximum Daily load (tMDl): The maximum allowed level of pollutant loading for a water body, while still protecting its uses and maintaining compliance with water quality standards, as defined in the Clean Water Act.
total Phosphorus (tP): An estimate of the concentration of phosphorus in both organic and inorganic forms in a water sample. In freshwater environments, increased levels of this nutrient can promote the growth of algae and other plants.
Water conservation Areas (WcAs): Diked areas of the remnant Everglades that are hydrologically controlled for flood control and water supply purposes. The primary targets of Everglades restoration, and major components of the Everglades Protection Area.
Water quality: The physical, chemical, and biological condition of water as applied to a specific use, typically propagation of fish and wildlife, public water supply, industry, or recreation.
Water quality criteria: Constituent concentrations based on scientific data and judgments on the relationship between pollutant concentrations and environmental and human health effects.
Water reservations: As defined by Florida law (Section 373.223(4), Florida Statutes), water set aside or designated for use, in a certain location, time, or quantity, as may be required for protecting fish and wildlife or public health and safety.
Watershed: A region or area bounded peripherally by a water parting and draining ultimately to a particular watercourse or body of water.
Water Year (WY): The period from May 1 through April 30, during which water quality and other data were collected and reported in the South Florida Environmental Report.
47
The South Florida Water Management District wishes to gratefully acknowledge the outstanding contributions of the many professionals who have made the 2009 South Florida Environmental Report a reality.
Authors: Teamwork and collaboration across organizational units and agencies for the SFER reporting process is world-class and highly recognized. The 2009 Report could not exist without the competence of the over 200 authors and contributors that have played an important role in the development of this large, complex document. The professionalism and dedication of these many individuals are gratefully acknowledged.
editorial and Production team: To organize the development of this lengthy report under tight deadlines, continuous project management and close teamwork by the SFER production management team is required throughout the report production process. The team demonstrates advanced organizational skills as it expertly guides this annual process. The exceptional cooperation and productivity of the 2009 SFER editorial and production team are respectfully acknowledged, as well as the support of the District’s Creative Services Department in producing the 2009 SFER Executive Summary. The outstanding work performed under contract by Aquent, Inc., for technical editing and graphic design services is also immensely appreciated.
Project team: The management of Volume I is centered in the District’s Environmental Resource Assessment Department. The Volume I staff works closely with the Florida Department of Environmental Protection’s Water Quality Standards and Special Projects Program to jointly coordinate the creation of Volume I, Chapter 3, and its associated appendices. This year’s inclusion of a
web-accessible project database was enabled by prompt and diligent efforts by the District’s Information Technology Department. The District’s Budget Division provides oversight and support for the development of Volume II. Along with the significant contributions of these project management teams, this large, multidisciplinary document could not be produced without the guidance of our agencies’ executive managers.
Peer review and Public Workshop: The incredible knowledge and experience of the expert panel assembled for the 2009 SFER Peer Review and Public Workshop are greatly valued. The panel provided insightful and thorough scientific peer review in the major subject areas covered in Volume I. The District’s Environmental Resource Assessment staff is also recognized for their vital assistance in conducting this year’s workshop.
other contributors: The extensive amount of data and other information provided throughout Volume I are largely supported by the three divisions of the District’s Environmental Resource Assessment Department – Water Quality Monitoring, Water Quality Analysis, and Water Quality Assessment. The long list of individuals throughout these divisions that have contributed to the essential data collection, monitoring, analyses, validation, and technical assessments for multiple Volume I chapters and appendices continues to contribute to the enormous success of this report, and their efforts are deeply appreciated. Project managers and chapter authors are also appreciatively recognized for updating the 2009 SFER Consolidated Project Report Database.
For further reference, a more detailed list of authors and contributors is presented on the acknowledgments page of the 2009 Main Report.
FoR FuRTheR InFoRmATIon PleASe ConTACT:
FoR Volume I: FoR Volume II:
Garth Redfield, PhD David Gilpin-HudsonEnvironmental Resource Assessment Department Budget DivisionSouth Florida Water Management District South Florida Water Management District 3301 Gun Club Road, West Palm Beach, FL 33406 3301 Gun Club Road, West Palm Beach, FL 33406561-682-6611 [email protected] 561-682-6784 [email protected]
FoR Volume I, ChAPTeR 3:
Frank NearhoofWater Quality Standards and Special Projects ProgramFlorida Department of Environmental Protection2600 Blair Stone Road, Mail Station 3560, Tallahassee, FL 32399850-245-8420 [email protected]
For additional 2009 South Florida Environmental Report copies, please contact the District’s Reference Center at 561-682-6075. The complete 2009 Report is also available online at www.sfwmd.gov/sfer/
Acknowledgments

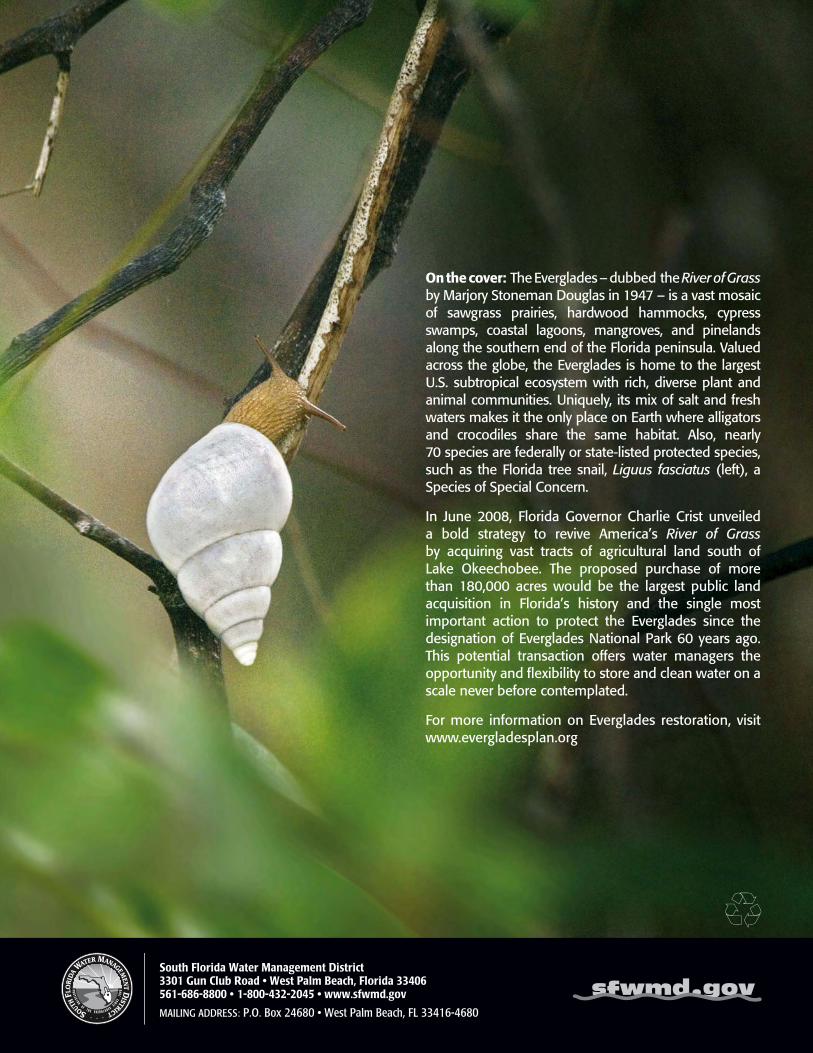
On the cover: The Everglades – dubbed the River of Grassby Marjory Stoneman Douglas in 1947 – is a vast mosaic of sawgrass prairies, hardwood hammocks, cypress swamps, coastal lagoons, mangroves, and pinelands along the southern end of the Florida peninsula. Valued across the globe, the Everglades is home to the largest U.S. subtropical ecosystem with rich, diverse plant and animal communities. Uniquely, its mix of salt and fresh waters makes it the only place on Earth where alligators and crocodiles share the same habitat. Also, nearly 70 species are federally or state-listed protected species, such as the Florida tree snail, Liguus fasciatus (left), a Species of Special Concern.
In June 2008, Florida Governor Charlie Crist unveiled a bold strategy to revive America’s River of Grass by acquiring vast tracts of agricultural land south of Lake Okeechobee. The proposed purchase of more than 180,000 acres would be the largest public land acquisition in Florida’s history and the single most important action to protect the Everglades since the designation of Everglades National Park 60 years ago. This potential transaction offers water managers the opportunity and flexibility to store and clean water on a scale never before contemplated.
For more information on Everglades restoration, visit www.evergladesplan.org