south london joint waste development plan … london joint waste development plan document building...
TRANSCRIPT
South London Joint Waste Development Plan Document
Building the Evidence Base for Issues and Options
Final Report 07 May 2008 Produced for Emma Smyth Prepared by Lindsay Reed Senior Waste Consultant West Hall Parvis Road West Byfleet Surrey KT14 6EZ UK T +44 (0)1932 337000 M 07753971611

South London Joint Waste Development Plan Document Building the Evidence Base for Issues and Options
© Mouchel 2008 i
Document Control Sheet
Project Title Final Report
Report Title South London Joint Waste Development Plan Document
Revision 2
Status Draft
Control Date 30 April 2008
Record of Issue
Issue Status Author Date Check Date Authorised Date
1 Draft L Reed, K Lawson, A Beattie
14/03/08 C Lee 14/03/08 C Lee 14/03/08
2 Draft L Reed, K Lawson, A Beattie
26/03/08 C Lee 26/03/08 C Lee 26/03/08
3 Draft Final
L Reed, K Lawson, A Beattie
30/04/08 C Lee 30/04/08 C Lee 30/04/08
4 Final L Reed, K Lawson, A Beattie
06/05/08 C Lee 06/05/08 C Lee 06/05/08
Distribution
Organisation Contact Copies
Royal Borough of Kingston upon Thames
Emma Smyth 1

South London Joint Waste Development Plan Document Building the Evidence Base for Issues and Options
© Mouchel 2008 ii
Contents
Document Control Sheet............................................................................................. i
Contents...................................................................................................................... ii
Glossary ..................................................................................................................... iv
1 Introduction........................................................................................................ 1
2 Waste Arisings................................................................................................... 3
Introduction................................................................................................................... 3
Municipal Solid Waste (MSW) Arisings ......................................................................... 3
Future municipal solid waste arisings............................................................................ 6
Commercial and Industrial Waste Arisings.................................................................... 8
Apportionment ............................................................................................................ 11
Construction, Demolition and Excavation Waste Arisings ........................................... 15
Hazardous Waste Arisings.......................................................................................... 15
Agricultural Waste Arisings ......................................................................................... 18
Total Arisings Figures ................................................................................................. 18
3 Waste Management Capacity.......................................................................... 20
4 Locational Opportunities and Constraints..................................................... 25
5 Identifying Issues and Options....................................................................... 32
Introduction................................................................................................................. 32
Aims of Issues and Options document........................................................................ 32
Initial Issues and questions......................................................................................... 33

South London Joint Waste Development Plan Document Building the Evidence Base for Issues and Options
© Mouchel 2008 iii
6 Appendices ...................................................................................................... 36
Appendix A ................................................................................................................. 36
Appendix B ................................................................................................................. 40

South London Joint Waste Development Plan Document Building the Evidence Base for Issues and Options
© Mouchel 2008 iv
Glossary
Agricultural Waste Waste generated on farms or other agricultural premises such as market gardens. It consists of a diverse range of both natural (organic) and non-natural wastes including discarded pesticide containers, plastics such as silage wrap, bags and sheets, packaging waste, tyres, batteries, old machinery and oil etc.
Apportionment See London Plan Apportionment.
Biodegradable Biodegradable materials are generally organic, such as plant and animal matter and other substances originating from living organisms. They can be chemically broken down by naturally occurring micro-organisms into simpler compounds. Waste which contains organic material can decompose producing bio-gas, leachate and other by-products.
Biodegradable Municipal Waste (BMW) Waste that is capable of undergoing natural decomposition such as paper and cardboard, garden and food waste from municipal waste services.
Bulky Materials Materials that are too large to fit in a dustbin, for example items of furniture, white goods, DIY waste.
Civic Amenity Site (CAS) Facilities where members of the public can bring a variety of household waste. Materials accepted include for example paper, plastic, metal, glass and bulky waste such as tyres, refrigerators, electronic products, waste from DIY activities and garden waste. These sites are also known as ‘HWRCS’ Household Waste Recycling Centres, or ‘RRCs’ Reuse and Recycling Centres.
Climate Change Regional or global-scale changes in historical climate patterns arising from natural and/or man-made causes that produce an increasing mean global surface temperature.
Clinical Waste Waste arising from medical, nursing, veterinary, pharmaceutical, dental or related practices, where risk of infection may be present.
Commercial Waste Waste produced from premises used solely or mainly, for the purpose of a trade or business or for sport, recreation or entertainment.
Commercial and Industrial Waste (C&I) Waste arising from business and industry. Industrial waste is waste generated by factories and industrial plants. Commercial waste is waste arising from the activities of traders, catering establishments, shops, offices and other businesses. Commercial and Industrial waste may for example include food waste, packaging and old computer equipment.
Composting A biological process which takes place in the presence of oxygen (aerobic) in which organic wastes, such as garden and kitchen waste are converted into a stable granular material. This can be applied to land to improve soil structure and enrich the nutrient content of the soil.

South London Joint Waste Development Plan Document Building the Evidence Base for Issues and Options
© Mouchel 2008 v
Construction, Demolition and Excavation Waste (CD&E) Waste arising from the construction, maintenance, repair and demolition of roads, buildings and structures. It is mostly comprised of concrete, brick, stone and soil, but can also include metals, plastics, timber and glass.
Department for the Environment Food and Rural Affairs (DEFRA) Government department with national responsibility for sustainable waste management
Development Plan Document (DPD) These are statutory local development documents prepared under the Planning and Compulsory Purchase Act 2004, which set out the spatial planning strategy and policies for an area. They have the weight of development plan status and are subject to community involvement, public consultation and independent examination.
Energy from Waste (EfW) Energy that is recovered through thermally treating waste.
Energy Recovery The combustion of waste under controlled conditions in which the heat released is recovered to provide hot water and steam (usually) for electricity generation (see also Recovery).
Environment Agency (EA) Environmental regulatory authority formed in 1996, combining the functions of the former National Rivers Authority, Waste Regulation Authorities and Her Majesty’s Inspectorate of Pollution.
Exempt Sites Exempt from Waste Management Licensing.
Greater London Authority (GLA) The GLA is a unique form of strategic citywide government for London. It is made up of a directly elected Mayor – the Mayor of London - and a separately elected Assembly – the London Assembly.
Green Belt A planning designation aimed at preventing urban sprawl and encroachment into the countryside.
Hazardous Waste Waste that contains potentially damaging properties which may make it harmful to human health or the environment. It includes materials such as asbestos, fluorescent light tubes and lead-acid batteries. The European Commission has issued a Directive on the controlled management of hazardous waste; wastes are defined as hazardous on the basis of a list created under that Directive.
Household Waste Waste from a private dwelling or residential house or other such specified premises, and includes waste taken to civic amenity sites.
Incineration The burning of waste at high temperatures in the presence of sufficient air to achieve complete combustion, either to reduce its volume (in the case of municipal solid waste) or its toxicity (such as for organic solvents). Municipal solid waste incinerators recover power and/or heat.
South London Joint Waste Development Plan Document Building the Evidence Base for Issues and Options
© Mouchel 2008 vi
Industrial Waste Waste from a factory or industrial process.
Landfill The deposit of waste onto and into land, in such a way that pollution or harm to the environment is prevented and, through restoration, to provide land which may be used for another purpose.
Landfill Allowance Trading Scheme (LATS) Process of apportionment, by waste disposal authority, of the tonnage of biodegradable municipal waste that may be disposed of to landfill to meet EU Landfill Directive targets.
London Plan This document was produced by the Mayor of London to provide a strategic framework for the boroughs' Unitary Development Plans. It will now perform this function in respect of Local Development Frameworks. It was first published in February 2004 and alterations have since been published in September 2006 and 2007. It has recently been published in February 2008 incorporating all alterations since 2004. It has the status of a development plan under the Planning & Compulsory Purchase Act.
London Plan Apportionment The London Plan provides targets for the amount of Municipal Solid Waste and Commercial & Industrial waste to be managed in London for the years 2010, 2015 and 2020 to ensure maximum self sufficiency for the capital. The London Plan borough level apportionment allocates to each individual borough a given proportion of this London total (expressed in tonnes) for which sufficient sites for managing and processing waste must be identified within their Development Plan Documents.
Materials Recycling Facility or Materials Recovery Facility (MRF) A special sorting ‘factory’ where mixed recyclables are separated into individual materials prior to despatch to reprocessors who wash and prepare the materials for manufacturing into new recycled products.
Mechanical Biological Treatment (MBT) A combination of mechanical separation techniques and biological treatment – either aerobic or anaerobic, or a combination of the two, which are designed to extract and / or treat fractions of waste.
Municipal Solid Waste (MSW) Household waste and waste from municipal parks and gardens, fly tipped materials, rubble and street sweepings. This is also known as municipal waste.
Planning Policy Statement 10 (PPS10) Guidance documents relating to ‘Planning for Sustainable Waste Management’ which set out a number of key concepts which should be considered and statutory requirements of local and regional planning policy documents.
Pollution Prevention and Control (PPC) Regulates certain types of business, such as those carrying out power generation, waste management activities, manufacturing and other industrial and agricultural activities. A PPC permit is required by companies carrying out activities covered under PPC. PPC is regulated by the Environment Agency or local council, depending on the activity.

South London Joint Waste Development Plan Document Building the Evidence Base for Issues and Options
© Mouchel 2008 vii
Recovery The process of extracting a product of value from waste materials, including recycling, composting and energy recovery.
Recycling Recovering re-usable materials from waste or using a “waste” material for a positive purpose.
Reprocessing Using materials recovered from waste to manufacture a new product.
Re-use The re-use of materials in their original form, without any processing other than cleaning.
Self-sufficiency Dealing with wastes within the administrative region (such as London) where they are produced.
South London Waste Partnership (SLWP) A partnership between the four South London boroughs (Croydon, Kingston, Merton and Sutton) set up for the purposes of a joint waste procurement exercise. The SLWP will procure and run a joint contract that will cover the treatment and disposal of waste and, the management of the four boroughs' household re-use and recycling centres and the transport of waste. The contract will only cover municipal solid waste.
Sub-Region A division of a region – London is a region and South London is a sub-region.
Sustainable Waste Management Using material resources efficiently to cut down on the amount of waste we produce and, where waste is generated, dealing with it in a way that actively contributes to economic, social and environmental goals of sustainable development.
Transport for London (TfL) An integrated body responsible for the Capital's transport system. The primary role of TfL, which is a functional body of the Greater London Authority, is to implement the Mayor of London's Transport Strategy and manage transport services across London
Waste Arising The amount of waste generated in a given locality over a given period of time.
Waste Collection Authority (WCA) Organisation responsible for collection of household waste e.g. your local council.
Waste Disposal Authority (WDA) Organisation responsible for disposing of municipal waste.
Waste Electrical and Electronic Equipment (WEEE) Directive Aims to prevent the disposal of electrical and electronic goods and ensure greater levels of recovery and disassembly.
Waste Hierarchy An order of waste management methods based on their predicted sustainability.

South London Joint Waste Development Plan Document Building the Evidence Base for Issues and Options
© Mouchel 2008 viii
Waste Management Capacity The amounts of waste able to be managed (recycled or energy recovered) by waste management facilities within South London.
Waste Management Licence (WML) The licence required by anyone who proposes to deposit, recover or dispose of controlled waste. Licences are issued and monitored by the Environment Agency.
Waste Minimisation Reducing the volume of waste that is produced. This is at the top of the Waste Hierarchy.
Waste Planning Authority (WPA) Local authority responsible for waste planning. In South London all four boroughs are the Waste Planning Authority for that area.
Waste Return Form returned to the Environment Agency quarterly by waste management licence holders detailing the type and quantity of waste processed at each licenced site.
Waste Transfer Station A facility where waste is delivered for sorting prior to transfer to another place for recycling, treatment or disposal.

South London Joint Waste Development Plan Document Building the Evidence Base for Issues and Options
© Mouchel 2008 1
1 Introduction
1.0 This document provides the supporting information and the data gathered in building an evidence base for the South London Joint Waste Development Plan Document (JWDPD) Issues and Options document.
1.1 The area covered by the South London JWDPD encompasses 4 London Boroughs. Each of the Boroughs is a unitary authority and is therefore responsible for the collection, treatment and disposal of municipal waste in their area.
1.2 London is comprised of 33 Local Authorities. There are 12 unitary authorities which have responsibility for the disposal of their own municipal waste (a single tier system). The remaining 21 London boroughs are arranged into four statutory joint waste disposal authorities (WDA) (a two tier system). The statutory joint authorities are led by a committee of councillors from their constituent boroughs and are responsible for making arrangements for disposal on behalf of the constituent councils. The structure is summarised below:
• 4 Waste Disposal Authorities (WDAs)
• 21 Waste Collection Authorities (WCAs)
• 12 Combined Collection and Disposal Authorities (Unitary Authorities)
1.3 In setting the context for the South London JWDPD it is useful to compare the statistics of the 4 boroughs with that of the other unitary and waste disposal authorities in London (Table 1.1). Croydon is the largest of the 4 South London boroughs by area and has twice as many households as the other South London boroughs. Croydon is the most densely populated of all the unitary authorities in London with 15,000 more households than Bromley which is nearly double the area of Croydon.

South London Joint Waste Development Plan Document Building the Evidence Base for Issues and Options
© Mouchel 2008 2
Table 1.1 Statistics for London authorities
Unitary Authority Area Number of
Households Population
Bexley 60.8km2 91,000 220,300
Bromley 149.9km2 129,000 301,900
City of London 2.8km2 5,000 9,200
City of Westminster 20.9km2 111,000 244,400
Croydon 86.7km2 144,000 342,700
Greenwich 46.8km2 99,000 228100
Kingston 36.9km2 63,000 153,000
Lewisham 34.9km2 107,000 247,500
Merton 37.9km2 81,000 194,700
Southwark 28.7km2 110,000 257,700
Sutton 43.9km2 76,000 177,700
Tower Hamlets 19.9km2 84,000 213,200
East London Waste Authority 239.9km2 348,000 888,400
West London Waste Authority 377.8km2 455,800 1,437,100
North London Waste Authority
292.6km2 696,000 1,675,200
Western Riverside Waste Authority
88.96km2 407,000 926,600
South London Boroughs Combined Total
205.4 km2 364,000 868,100
Capitalwastefacts.com, 2008

South London Joint Waste Development Plan Document Building the Evidence Base for Issues and Options
© Mouchel 2008 3
2 Waste Arisings
Introduction 2.0 To understand how much waste the four south London boroughs must plan to manage in the South London JWDPD it is useful to ascertain how much waste is expected to be produced within the area over the plan period. Data on waste arisings is variable in its accuracy and origin. This section of the report considers each of the following waste streams and their predicted arisings, where available:
• Municipal Solid Waste (MSW)
• Commercial and Industrial waste (C&I)
• Construction, Demolition and Excavation waste (CDE)
• Hazardous Waste
• Agricultural waste
2.1 The apportionment, as set out in the London Plan, is considered after the MSW and C&I wastes as the apportionment takes account of these wastes. There are no apportionment figures set out for CDE, hazardous and agricultural wastes in the London Plan and therefore those wastes are considered in this report but not in terms of meeting the apportionment.
Municipal Solid Waste (MSW) Arisings 2.2 MSW arisings for the regions in 2006/07 are shown in Figure 2.1. England generated just over 29 million tonnes of municipal waste in 2006/07 with London, the South East and the North West regions generating a larger quantity of municipal waste than the other regions. London’s MSW Arisings of 4.2 million tonnes accounted for almost 14% of England’s total MSW arisings in 2006/07.

South London Joint Waste Development Plan Document Building the Evidence Base for Issues and Options
© Mouchel 2008 4
Figure 2.1 Municipal Solid Waste arisings in the regions (England 2006/07)
0
500,000
1,000,000
1,500,000
2,000,000
2,500,000
3,000,000
3,500,000
4,000,000
4,500,000
5,000,000
North
East
East M
idlan
ds
Yorks
hire/H
umbe
r
South
Wes
t
Wes
t Midl
ands
East
North
Wes
t
Lond
on
South
East
Region
Tonn
es
Department for Environment, Food and Rural Affairs (2006/07) http://www.defra.gov.uk/environment/statistics/waste/index.htm
2.3 The South London boroughs produced 457,000 tonnes of MSW in 2006/07 (Figure 2.2) with Croydon’s MSW arisings accounting for approximately 190,000 tonnes. Croydon has the largest MSW arising as it is the largest and most densely populated of the four boroughs. Kingston however achieved the highest municipal waste recycling rate of the four boroughs in 2006/07 (Figure 2.3).

South London Joint Waste Development Plan Document Building the Evidence Base for Issues and Options
© Mouchel 2008 5
Figure 2.2 Municipal Solid Waste arisings in London 2006/07
-
200,000
400,000
600,000
800,000
1,000,000
1,200,000
City of
Lond
on
Kingsto
n
Sutton
Merton
Tower
Ham
lets
Green
wich
Bexley
Southw
ark
Lewish
am
Bromley
Croyd
on
City of
Wes
tmins
ter
South
Lond
on B
orou
ghs (
combin
ed fig
s)
Wes
tern R
iversi
de W
aste
Author
ity
East L
ondo
n Was
te Auth
ority
Wes
t Lon
don W
aste
Author
ity
North
Lond
on W
aste
Author
ity
Ton
nes
Department for Environment, Food and Rural Affairs (2006/07) http://www.defra.gov.uk/environment/statistics/wastats/bulletin07.htm
Figure 2.3 Municipal Solid Waste arisings and recycling figures for South London 2006/07
-
50,000
100,000
150,000
200,000
250,000
300,000
350,000
400,000
450,000
500,000
Ton
nes
Total Municipal Recycling 38,627 23,135 19,864 25,393 107,020
Total Municipal Waste 189,866 75,725 96,259 95,209 457,059
Croydon Kingston Merton SuttonSouth London
Boroughs (combined figures)
Department for Environment, Food and Rural Affairs (2006/07) http://www.defra.gov.uk/environment/statistics/wastats/bulletin07.htm

South London Joint Waste Development Plan Document Building the Evidence Base for Issues and Options
© Mouchel 2008 6
2.4 When considering the treatment and disposal of MSW in the South London boroughs it is noted that there is a significant reliance on landfill with 76% of MSW being disposed on in this way compared to 57% for London as a whole (Figure 2.4). There is a negligible quantity of waste from the South London boroughs treated by energy from waste plants and the recycling rate for the four boroughs combined (23%) is higher than that of London as a whole (20%).
Figure 2.4 Comparison of fate of Municipal Solid Waste produced in London with that produced by the South London (2006/07)
-
10
20
30
40
50
60
70
80
90
Landfill % EFW % Recycling/Composting %
%
South London Boroughs London
Future municipal solid waste arisings 2.5 Generally, waste production increases every year, unless waste minimisation campaigns are successful such as home composting or reuse of bulky materials. When predicting future arisings it is sensible to assume a level of growth similar to previous years and reduce the growth accordingly depending on the timing and predicted success of waste minimisation efforts. Both the Greater London Authority (GLA) and the South London Waste Partnership (SLWP) have estimated waste growth for Municipal Solid Waste for South London up to 2020. The figures are different as the growth assumptions are based on separate research and are applied to waste arising figures from different years as a starting point. The differing growth profiles are shown in Figure 2.5 in addition to a separate profile created by applying a nominal growth rate to the MSW arising figure for 2006/07 as reported by DEFRA in Waste Strategy 20071. The growth profiles are described as follows:
1 DEFRA Waste Strategy for England 2007. Available from http://www.defra.gov.uk/environment/waste/strategy/strategy07/pdf/waste07-strategy.pdf

South London Joint Waste Development Plan Document Building the Evidence Base for Issues and Options
© Mouchel 2008 7
• The Greater London Authority projection is based on 2003/04 DEFRA data projected by 1.5% growth per annum;
• The data from South London Waste Partnership’s procurement model is based on applying a growth rate to 2006/07 data. The growth rate for each of the four boroughs is dependant on their individual population increases but across the 4 boroughs the growth rate is approximately 1% per annum from 2006/07 until 2017/18, decreasing to 0% from 2018/19 to 2020.
• The MSW arising figures for each of the four south London boroughs for the years 2003/04 to 2006/07 as reported by DEFRA projected at 0.5% per annum from 2007/08 until 2020.
2.6 It can be noted from the comparison of growth profiles that the GLA profile predicts much higher MSW arisings than the SLWP growth profile. The total arisings predicted in 2020 using the GLA profile are over 130,000 tonnes greater than the figure from the SLWP profile. Clearly this is a significant difference. However, it is likely that the SLWP data is more recent and likely to be more accurate given that the actual DEFRA figure for MSW arisings in 2006/07 is very closely aligned to the SLWP profile starting figure. To further investigate the differences in projected arisings the actual figures for MSW arisings were obtained from each of the four boroughs for the years 2003 to 2006 and compared with the arisings projected from 2003 by The London Plan. The Boroughs’ reported arisings for 2003 is 8,471 tonnes less than the figure used in The London Plan. The actual arisings figures also showed a 5% decrease in MSW in the four boroughs in 2005 which explains the difference between the projected and actual figures for the following year. Figure 2.5 shows the London Plan projected figures (2003-2020) against the SLWP figures (2006-2020) and the actual DEFRA reported figures from boroughs (2003 to 2006) projected at 0.5% per annum to 2020. 2.7 Paragraph 4.11 of the PPS10 Companion Guide states that when forecasting data, it is important to examine the reasons behind historic growth rates, as these may not be perpetuated. The individual boroughs’ commitment to minimise waste through a variety of activities and campaigns with householders and businesses is likely to slow future waste growth within the JWDPD area and more closely align municipal waste growth with the SLWP model than the GLA’s forecast. 2.8 However, The London Plan has been through several rounds of consultation and independent examination and the projected growth figures have stood such testing. Equally, given the regionally determined nature of the GLA growth projections and their use in defining the apportionment totals for London, they are required to ‘make sense’ at the strategic level. The plan, monitor and manage approach and regular review at both the sub-regional and regional level could potentially deal with any emerging discrepancies on growth projections and actual waste arisings. In addition, paragraph 17 of PPS10 states that, waste planning authorities should allocate sites and areas suitable for new or enhanced waste management facilities to support the apportionment set out in the Regional Spatial Strategy. Going forwards, the Joint Waste DPD will therefore use the GLA forecasts for Municipal waste growth and identify the tracking of actual arisings, against forecast arisings, as a monitoring indicator.

South London Joint Waste Development Plan Document Building the Evidence Base for Issues and Options
© Mouchel 2008 8
Figure 2.5 Projected Municipal Solid Waste arisings for South London using GLA and SLWP growth profiles in addition to a profile based on actual and projected Defra figures.
400000
450000
500000
550000
600000
650000
2003 2004 2005 2006 2007 2008 2009 2010 2011 2012 2013 2014 2015 2016 2017 2018 2019 2020 2021
Year
Tonn
es
MSW projections based on DEFRA figures MSW projections from SLWPMSW projections from London Plan MSW arisings actual figures
Commercial and Industrial Waste Arisings 2.9 Environment Agency (EA) data from 2002/032 reports that South London produced nearly 850,000 tonnes of commercial and industrial waste in that year, with 78% coming from industrial sources. Unfortunately this dataset includes the borough of Bromley and therefore it is not possible to understand exactly how much was produced in the four South London boroughs. However, by subtracting the estimated proportion of this waste attributed to Bromley (using the methodology detailed in the paragraph overleaf), it is possible to estimate that 644,000 tonnes of commercial and industrial waste was produced in the Joint Waste DPD area.
2.10 When considering disposal of this waste stream, the 2002/3 EA data shows that only 28% of C&I waste was reused or recycled in South London (including Bromley) and 61% disposed of at landfill. Although better than the recycling rates for North London and Central London (who recycled only 20% of this waste stream), it is in stark contrast to the West London sub-region, which the survey found recycled 68% of C&I waste.
2 Strategic Waste Management Assessment London (2002/03) Environment Agency

South London Joint Waste Development Plan Document Building the Evidence Base for Issues and Options
© Mouchel 2008 9
Figure 2.6 Fate of commercial and industrial waste in South London 2002/03 (including Bromley)
61%
28%
5%
3%3%
Land disposal
Re-used/ Recycled
Thermal
Treatment &Transfer
Not recorded
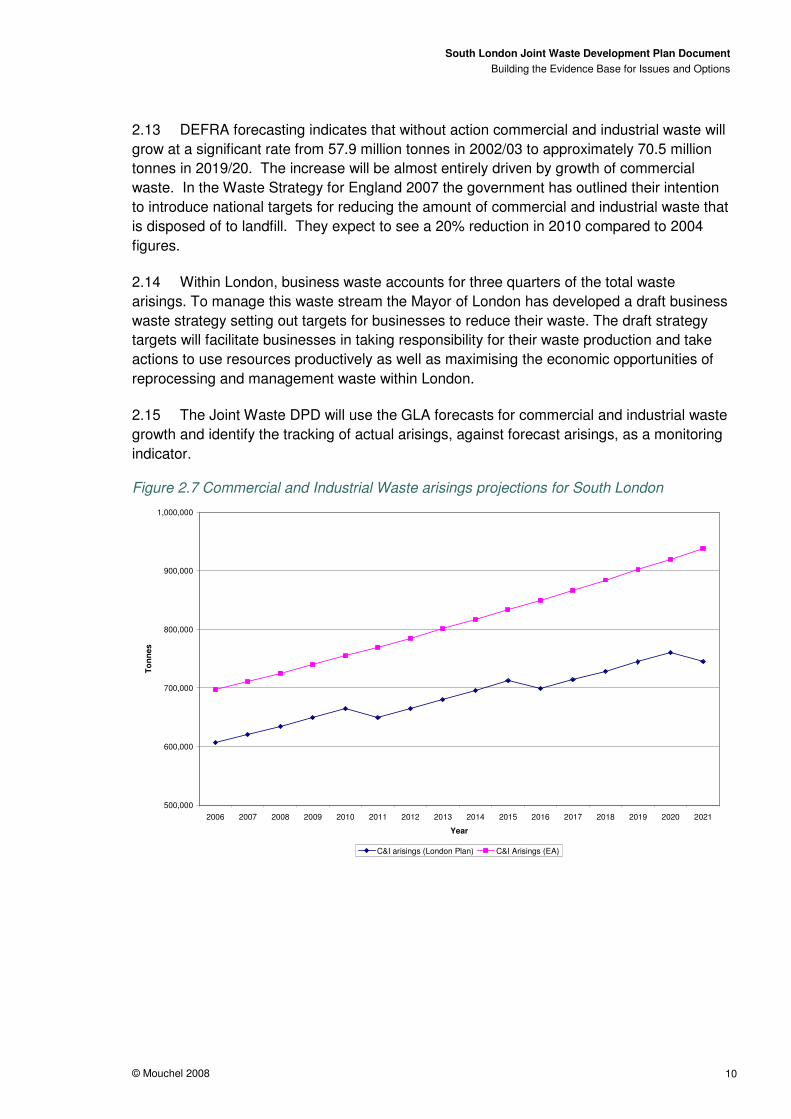
2.11 Figure 2.7 shows the projected C&I arisings for the South London boroughs based on The London Plan3 assumptions of 2% growth per annum and a 2% reduction in growth every 5 years. The GLA figures are based on data from 2000 and predict that there will be over 750,000 tonnes of C&I waste arising in the 4 boroughs by 2020. Extrapolating this figure to 2021 means that there is expected to be just under 750,000 tonnes of C&I waste arising in the 4 boroughs in that year as, following the growth rates used in The London Plan data, the growth rate reduces by 2% every fifth year.
2.12 To compare the EA and London Plan datasets, the predicted C&I arisings for Bromley from The London Plan were added to the predicted arisings for the 4 South London boroughs. The proportion of the total waste attributed to Bromley was calculated at 24%. 24% of the total EA predicted arisings was removed thereby allowing an estimate of the EA arisings attributable to the 4 South London boroughs. The arisings are then projected at an increase of 2% per year to 2021. There is a difference of approximately 100,000 tonnes between the 2 datasets as the London Plan arisings are projected from a lower starting point and have waste reduction measure built into the growth rates.
3 The London Plan (Spatial Development Strategy for Greater London)(Consolidated with alterations since 2004) Greater London Authority, February 2008
South London Joint Waste Development Plan Document Building the Evidence Base for Issues and Options
© Mouchel 2008 10
2.13 DEFRA forecasting indicates that without action commercial and industrial waste will grow at a significant rate from 57.9 million tonnes in 2002/03 to approximately 70.5 million tonnes in 2019/20. The increase will be almost entirely driven by growth of commercial waste. In the Waste Strategy for England 2007 the government has outlined their intention to introduce national targets for reducing the amount of commercial and industrial waste that is disposed of to landfill. They expect to see a 20% reduction in 2010 compared to 2004 figures.
2.14 Within London, business waste accounts for three quarters of the total waste arisings. To manage this waste stream the Mayor of London has developed a draft business waste strategy setting out targets for businesses to reduce their waste. The draft strategy targets will facilitate businesses in taking responsibility for their waste production and take actions to use resources productively as well as maximising the economic opportunities of reprocessing and management waste within London.
2.15 The Joint Waste DPD will use the GLA forecasts for commercial and industrial waste growth and identify the tracking of actual arisings, against forecast arisings, as a monitoring indicator.
Figure 2.7 Commercial and Industrial Waste arisings projections for South London
500,000
600,000
700,000
800,000
900,000
1,000,000
2006 2007 2008 2009 2010 2011 2012 2013 2014 2015 2016 2017 2018 2019 2020 2021
Year
Tonn
es
C&I arisings (London Plan) C&I Arisings (EA)

South London Joint Waste Development Plan Document Building the Evidence Base for Issues and Options
© Mouchel 2008 11
Apportionment 2.16 The recently adopted London Plan4 provides self-sufficiency targets for 2010, 2015 and 2020 for the amount of MSW, C&I and CDE waste to be managed in London. Table 2.0 shows that by 2020 it is expected that London will manage 80% of MSW, 85% of C&I and 95% of CDE wastes produced in London. These self sufficiency targets will ensure that wastes produced in London are no longer exported to areas outside of London to be treated or disposed of.
Table 2.1 Self-Sufficiency targets for London
Waste stream 2010 2015 2020
Municipal Solid Waste 50% 75% 80% Commercial & Industrial 75% 80% 85% Construction, Demolition & Excavation
95% 95% 95%
All wastes 75% 80% 85%
2.17 To ensure that the self sufficiency targets for London are achieved, the amount of waste required to be managed across London has been apportioned to boroughs on the basis of ‘suitability’ i.e. the amount of existing facilities, suitable land and supporting infrastructure, that exist in the borough to manage wastes. The borough’s apportionment only considers MSW and C&I wastes as CDE wastes are expected to be largely reused or recycled on the site in which they arise. The borough level apportionment also requires boroughs to identify sufficient land to provide capacity to manage the apportioned tonnages of MSW and C&I waste in their development plan documents (DPD). As the four South London boroughs are developing a joint waste DPD their individual apportionments have been pooled and they must collectively make provision for the pooled amount of waste to be managed within the area. The borough level apportionment (in thousand tonnes/year) for South London is shown in table 2.1. Although the London Plan envisages all boroughs meeting their apportionment (either individually or collectively) it stresses that the meeting of the apportionment should be seen as a minimum requirement and all boroughs should strive to maximise self-sufficiency.
2.18 The London Plan provides an apportionment of waste only to the year 2020. Since the timetable for production of the South London JWDPD currently anticipates adoption of the Plan in 2011 and PPS10 requires all Development Plan Documents to plan for at least a 10 year period, it is necessary to calculate an apportionment to plan for 2021. In the absence of guidance on forecasting the apportionment, the calculated apportionment is
4 The London Plan (Spatial Development Strategy for Greater London)(Consolidated with alterations since 2004) Greater London Authority, February 2008

South London Joint Waste Development Plan Document Building the Evidence Base for Issues and Options
© Mouchel 2008 12
based on a continuing ambition for London to be 85% self-sufficient in 2021, coupled with maintaining the levels of self-sufficiency identified for South London at 2020.
Table 2.2 Apportionment figures for the South London boroughs
2010 2015 2020 2021 Borough
MSW C&I Total MSW C&I Total MSW C&I Total MSW C&I Total
Croydon 73 179 252 119 215 334 138 255 393
Kingston 47 117 164 77 140 218 90 166 256
Merton 69 171 240 113 205 318 131 243 373
Sutton 57 141 199 94 170 263 108 201 310
Total 246 608 854 403 730 1130 467 865 1332 474 848 1322
Grand Total
854 1130 1332 1322
(rounded to nearest thousand tonnes/year)
2.19 When considering predicted arisings for MSW against the London Plan growth projections it is noted that the South London boroughs are predicted to be a net exporter of wastes in terms of meeting the apportionment (Figure 2.8). If GLA MSW arisings are considered then achieving the boroughs’ apportionment is only 44,000 tonnes short of becoming self-sufficient in 2021.

South London Joint Waste Development Plan Document Building the Evidence Base for Issues and Options
© Mouchel 2008 13
Figure 2.8 Predicted MSW arisings and MSW apportionment for South London
-
100,000
200,000
300,000
400,000
500,000
600,000
700,000
2006 2007 2008 2009 2010 2011 2012 2013 2014 2015 2016 2017 2018 2019 2020 2021Year
Tonn
es
Total MSW projections (DEFRA 06/07 data projected 0.5% per annum)Total MSW projections (SLWP)Total MSW projections (London Plan)MSW Apportionment
2.20 It is noted that the South London boroughs are expected to be a net importer of C&I wastes by 2020 (Figure 2.9). The London Plan apportionment is an aggregated requirement across both MSW and C&I waste streams and for the purposes of site allocation there should be no differentiation between the two streams. Therefore of critical importance is the assessment of the total apportionment for the South London boroughs in relation to total MSW and C&I arisings. Figure 2.9 Predicted C&I arisings and C&I apportionment for South London.
0
100,000
200,000
300,000
400,000
500,000
600,000
700,000
800,000
900,000
1,000,000
2006 2007 2008 2009 2010 2011 2012 2013 2014 2015 2016 2017 2018 2019 2020 2021Year
Tonn
es
Total C&I projections (London Plan)C&I Apportionment
Total C&I projections (Environment Agency data excluding Bromley)

South London Joint Waste Development Plan Document Building the Evidence Base for Issues and Options
© Mouchel 2008 14
Figure 2.10 Predicted MSW and C&I arisings and total apportionment for South London
0
200000
400000
600000
800000
1000000
1200000
1400000
1600000
2006 2010 2015 2020 2021
Year
Ton
nes
Total projected MSW and C&I arisings (London Plan Figures)
Total projected MSW and C&I arisings (SLWP MSW figures and London Plan C&I figures)
Total Apportionment
2.21 In analysing the predicted arisings and the apportionment for MSW and C&I together (Figure 2.10) it can be seen that South London’s apportionment is well below the predicted arisings for 2010 but by 2020 the apportionment is higher than the predicted arisings, if SLWP data is considered, or similar to the predicted arisings when considering the London Plan data.
Table 2.3 South London Arisings figures for target years
Waste Arisings 2010 2015 2020 2021
Municipal Solid Waste (London Plan figures) 528,000 567,000 611,000 621,000
Municipal Solid Waste (SLWP figures) 463,000 481,000 488,000 488,000
Commercial & Industrial (London Plan figures) 664,000 712,000 760,000 745,000
Commercial & Industrial (Environment Agency figures) 755,000 833,000 920,000 938,000
Total MSW and C&I (London Plan figures) 1,192,000 1,280,000 1,372,000 1,366,000
Total Apportionment 854,000 1,133,000 1,332,000 1,322,000 Apportionment as an equivalent percentage of total arisings 72% 89% 97% 97%
All figures rounded to nearest thousand tonnes
South London Joint Waste Development Plan Document Building the Evidence Base for Issues and Options
© Mouchel 2008 15
0
1
2
3
4
5
6
7
8
9
Recycled by crushers/screens
Used/disposed of atlandfill
Spread on registeredexempt sites
Total
mill
ion
tonn
es
2003
2005
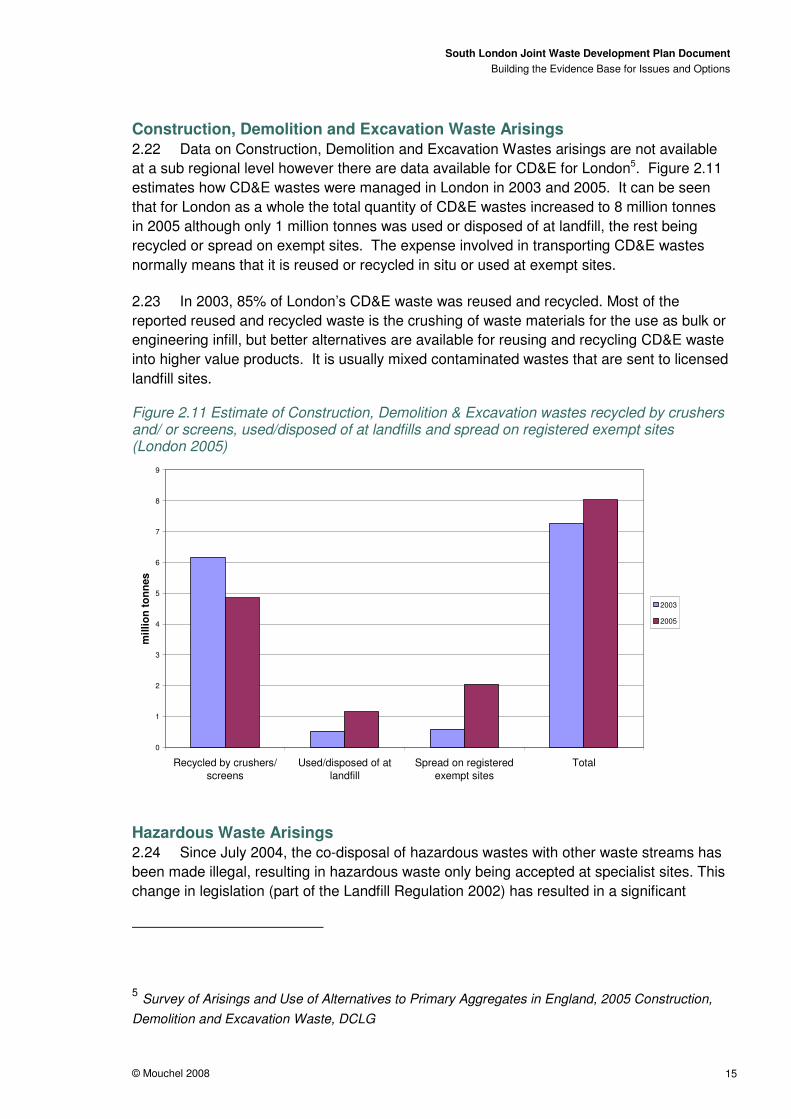
Construction, Demolition and Excavation Waste Arisings 2.22 Data on Construction, Demolition and Excavation Wastes arisings are not available at a sub regional level however there are data available for CD&E for London5. Figure 2.11 estimates how CD&E wastes were managed in London in 2003 and 2005. It can be seen that for London as a whole the total quantity of CD&E wastes increased to 8 million tonnes in 2005 although only 1 million tonnes was used or disposed of at landfill, the rest being recycled or spread on exempt sites. The expense involved in transporting CD&E wastes normally means that it is reused or recycled in situ or used at exempt sites.
2.23 In 2003, 85% of London’s CD&E waste was reused and recycled. Most of the reported reused and recycled waste is the crushing of waste materials for the use as bulk or engineering infill, but better alternatives are available for reusing and recycling CD&E waste into higher value products. It is usually mixed contaminated wastes that are sent to licensed landfill sites.
Figure 2.11 Estimate of Construction, Demolition & Excavation wastes recycled by crushers and/ or screens, used/disposed of at landfills and spread on registered exempt sites (London 2005)
Hazardous Waste Arisings 2.24 Since July 2004, the co-disposal of hazardous wastes with other waste streams has been made illegal, resulting in hazardous waste only being accepted at specialist sites. This change in legislation (part of the Landfill Regulation 2002) has resulted in a significant
5 Survey of Arisings and Use of Alternatives to Primary Aggregates in England, 2005 Construction, Demolition and Excavation Waste, DCLG
South London Joint Waste Development Plan Document Building the Evidence Base for Issues and Options
© Mouchel 2008 16
reduction in the capacity of landfill sites for hazardous waste from 240 sites to fewer to than 15 across the country and the cost of disposal has risen as a result.
2.25 During 2004 the Hazardous Waste arisings in the four South London boroughs amounted to 13,957 tonnes6, over half of which was classed as ‘C&D Waste and asbestos’. The most recent Environment Agency data from 2006 reports arisings of 15,668 tonnes of hazardous waste from the four South London Boroughs. 85% of this waste stream went for final disposal in the South East, East of England, East Midlands and London regions (Figure 2.12).
2.26 Of the 15,668 tonnes of hazardous waste recorded, the highest proportions of waste by European Waste Catalogue (EWC) code were (Figure 2.13):
• 19 12 11 - Other wastes (including mixtures of materials) from mechanical treatment of waste containing dangerous substances
• 18 01 03 – Infectious Clinical waste
• 17 06 05 - Construction materials containing asbestos
• 17 05 03 - Soil and stones containing dangerous substances
• 13 02 05 - mineral-based non-chlorinated engine, gear and lubricating oils
2.27 London creates the second lowest amount of hazardous waste in the country, when comparing the regions. But London has the lowest self sufficiency as only approximately four per cent of waste is disposed of within London. The lack of suitable treatment and disposal infrastructure to handle hazardous waste will result in hazardous waste being transported further incurring higher haulage costs and increased road traffic and air pollution.
2.28 The waste data between 1999 and 2002 shows that overall hazardous waste arising in South London has decreased. The rise in 2004 could be attributed to the need to dispose of hazardous waste before the Landfill Regulations came into effect. The arisings decrease again after 2004 (Figure 2.14).
6 Special Waste Database (SWaT), 2004, Environment Agency

South London Joint Waste Development Plan Document Building the Evidence Base for Issues and Options
© Mouchel 2008 17
Figure 2.12 Final disposal destinations for hazardous waste arising in South London2006
39%
20%
16%
10%
4%
4%
4%1%
1%
1%
South East
East of England
East Midlands
London
South West
Wales
West Midlands
North West
North East
Yorkshire and the Humber
Figure 2.13 The greatest proportion of hazardous waste as described by EWC, arising in the four South London Boroughs,2006
0
500
1000
1500
2000
2500
engine, gear andlubricating oils
insulation materialscontaining asbestos
infectious clinicalwastes
other wastescontainingdangeroussubstances
constructionmaterials containing
asbestos
soil and stonescontainingdangeroussubstances
EWC code
Tonn
es

South London Joint Waste Development Plan Document Building the Evidence Base for Issues and Options
© Mouchel 2008 18
Figure 2.14 Hazardous Waste arisings in South London7
0
10,000
20,000
30,000
40,000
50,000
60,000
70,000
1999 2000 2001 2002 2003 2004 2006
Year
Ton
nes
Agricultural Waste Arisings 2.29 Data from the Environment Agency states that agricultural activity in the London Region in 2003 produced only 35,000 tonnes of waste and the majority of these wastes were compostable and/or digestible8. The agricultural waste arising in London in 2003 was less than two thirds of that produced in 1998.
2.30 Agricultural waste is any waste that is created from farming, forestry, horticulture and similar activities. Agricultural waste in general comprises plastic packaging, paper and card packaging, non-packaging plastics, animal health products, oil, sheep dip waste, pesticides and milk. Agricultural waste has been reclassified under the Waste Management Regulations 2006 and is now under the same controls as commercial and industrial waste.
Total Arisings Figures 2.31 The total arisings are comprised of the MSW and C&I projections from the London Plan. In using the London Plan figures, the South London boroughs will be in conformity with the Spatial Development Strategy and will also afford themselves some contingency when making land provision for wastes to achieve self sufficiency over and above the
7 Special Waste Database (SWaT), 2003, Environment Agency
8 Agricultural waste and by-products in England 2003, Environment Agency

South London Joint Waste Development Plan Document Building the Evidence Base for Issues and Options
© Mouchel 2008 19
apportionment. The London Plan does not have an apportionment for other wastes apart from MSW and C&I and it is difficult to ascertain predicted arisings for other wastes at a sub regional level. The consideration of CDE, hazardous and agricultural wastes is therefore more practically dealt with in the policies for the JWDPD, for example encouraging in situ reuse and recycling of CDE and agricultural wastes.

South London Joint Waste Development Plan Document Building the Evidence Base for Issues and Options
© Mouchel 2008 20
3 Waste Management Capacity
3.0 Data gathered from the Environment Agency on all existing sites within the four south London boroughs with a waste management licence, pollution prevention and control (PPC) permit or exemption are listed in table 3.1. It is assumed for the purposes of this plan that all existing facilities will remain use as waste management facilities for the duration of the plan. A full list of facilities is at Appendix A.
Table 3.1 Existing Capacity across the South London Area by Facility Type
Facility Type Number of Facilities
Annual Existing Capacity (tonnes)
Annual Estimated
Throughput (tonnes)
Annual Estimated
surplus Capacity (tonnes)
Transfer Facilities
Household, Commercial and Industrial Waste Transfer Station
13 848,000 637,500 210,500
Special waste transfer station
1 50,000 37,500 12,500
Clinical Waste Transfer Station
3 5000 3,750 1,250
Transfer Station Taking Non
Biodegradable Wastes
1 128,750 96,500 32,250
Waste Treatment/Management Facilities
Metal Recycling Site (Vehicle Dismantler)
3 6,000 4,000 2,000
Metal Recycling Site (Mixed
MRS's) 1 75,000 75,000 0
Civic Amenity Site 3 64,500 48,500 16,000
Physical 1 54,500 54,500 0

South London Joint Waste Development Plan Document Building the Evidence Base for Issues and Options
© Mouchel 2008 21
Facility Type Number of Facilities
Annual Existing Capacity (tonnes)
Annual Estimated
Throughput (tonnes)
Annual Estimated
surplus Capacity (tonnes)
Treatment Facility
End of life vehicle facility 1 78,000 58,500 19,500
Composting Facility 2 24,800 2,000 22,800
Materials Recycling Facility 3 442,600 332,000 110,600
Total 32 1,777,150 1,349,750 447,400
Total excluding Transfer Facilities
14 745,400 574,500 170,900
(An assumption of 75% utilisation of licensed capacity is used where data has not been submitted at this time)
Table 3.2 Sites with Pollution Prevention & Control permits.
Case number
Operator Name
MP3437MX Waste water treatment
YP3430LL Waste water treatment
ZP3233MG Landfill

South London Joint Waste Development Plan Document Building the Evidence Base for Issues and Options
© Mouchel 2008 22
Table 3.3 Number of sites operating under exemptions in south London
Activity Description Number of Sites
Composting of biodegradable waste 1
Manufacture of products from waste 2
Recovery for reuse of recyclables 3
Recovery of waste from scrap metal/motor vehicles
8
Repair or refurbishment of non-hazardous WEEE
1
Storage of demolition/construction/excavation waste
1
Storage of recyclables for reuse 4
Storage of waste for manufacture of soil etc. 1
Treatment of waste soil, rock for spreading on land
1
Use of demolition/storage/excavation waste 1
3.1 Across the four south London boroughs there is a total of 1,777,150 tonnes of licensed existing capacity for handling waste. Table 3.1 shows that at present there is 447,400 tonnes of spare capacity (based on an assumption that some of the sites are working at 75% of their capacity). Capacity data was not available for the exempt and PPC permitted facilities shown in Tables 3.2 and 3.3.
3.2 It is important to note that whilst the facility may be licensed to accept a given quantity of waste, the facility may not physically be able to manage that quantity. For example a company may be granted a licence for 100,000 tonnes but only build a facility that can accept 75,000 tonnes with a view to expanding the facility in the future.
3.3 The largest capacity is attributable to waste transfer facilities which are used to handle and transfer waste before treatment. Within the London Plan, and for the purposes of meeting the apportionment, transfer facilities are not classed as waste management capacity. Excluding transfer capacity, there are 745,400 tonnes of existing capacity, of
South London Joint Waste Development Plan Document Building the Evidence Base for Issues and Options
© Mouchel 2008 23
which approximately 171,000 tonnes of which is spare capacity. Capacity gap calculations have been based on licensed capacity rather than on used capacity as the purpose of the plan is to make land provision for waste management and it is therefore assumed that all existing facilities will operate at full capacity and future provision will be made for waste above this level.
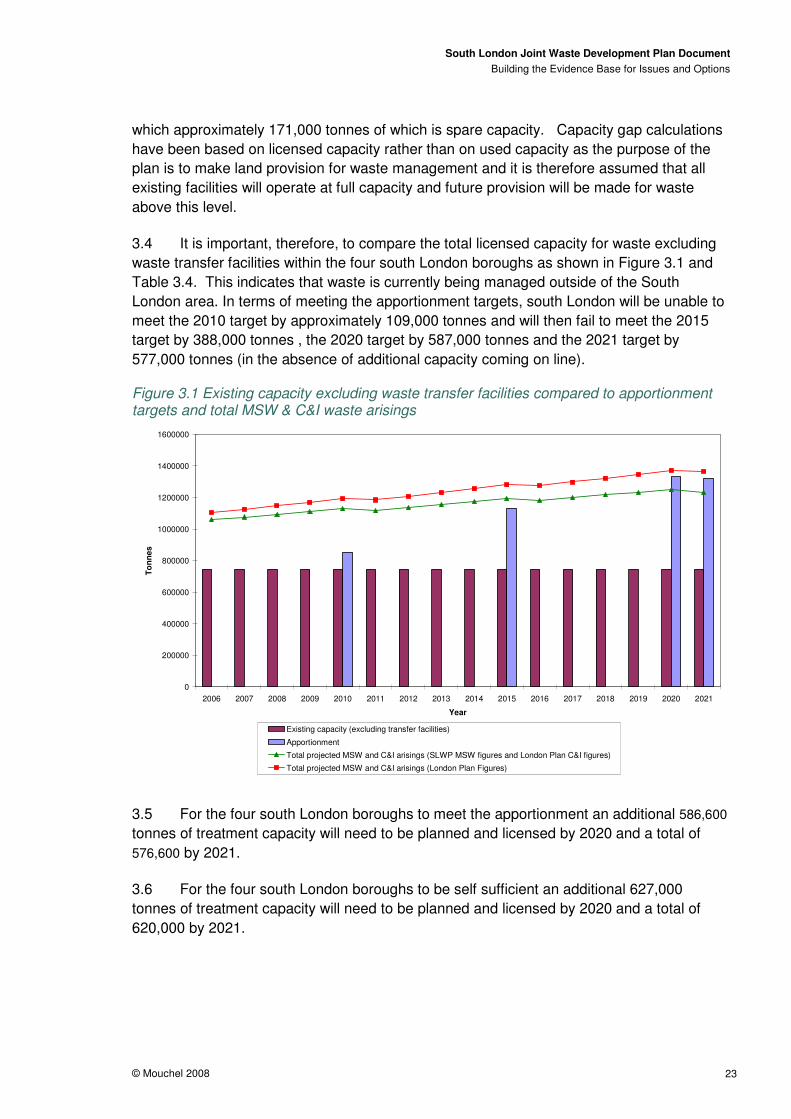
3.4 It is important, therefore, to compare the total licensed capacity for waste excluding waste transfer facilities within the four south London boroughs as shown in Figure 3.1 and Table 3.4. This indicates that waste is currently being managed outside of the South London area. In terms of meeting the apportionment targets, south London will be unable to meet the 2010 target by approximately 109,000 tonnes and will then fail to meet the 2015 target by 388,000 tonnes , the 2020 target by 587,000 tonnes and the 2021 target by 577,000 tonnes (in the absence of additional capacity coming on line).
Figure 3.1 Existing capacity excluding waste transfer facilities compared to apportionment targets and total MSW & C&I waste arisings
0
200000
400000
600000
800000
1000000
1200000
1400000
1600000
2006 2007 2008 2009 2010 2011 2012 2013 2014 2015 2016 2017 2018 2019 2020 2021
Year
Tonn
es
Existing capacity (excluding transfer facilities)
Apportionment
Total projected MSW and C&I arisings (SLWP MSW figures and London Plan C&I figures)
Total projected MSW and C&I arisings (London Plan Figures)
3.5 For the four south London boroughs to meet the apportionment an additional 586,600 tonnes of treatment capacity will need to be planned and licensed by 2020 and a total of 576,600 by 2021.
3.6 For the four south London boroughs to be self sufficient an additional 627,000 tonnes of treatment capacity will need to be planned and licensed by 2020 and a total of 620,000 by 2021.

South London Joint Waste Development Plan Document Building the Evidence Base for Issues and Options
© Mouchel 2008 24
Table 3.4 South London Arisings capacity requirements for target years
2010 2015 2020 2021
Total MSW and C&I arisings (London Plan figures) 1,192,000 1,280,000 1,372,000 1,366,000
Total Apportionment 854,000 1,133,000 1,332,000 1,322,000 Total existing capacity 745,400 745,400 745,400 745,400 Additional capacity required to meet the apportionment targets 108,600 387,600 586,600 576,600
Additional capacity required to become self-sufficient 446,600 534,600 626,600 620,600
All figures rounded to nearest thousand tonnes
3.7 Using Table 3.5 (taken from the London Plan) together with the London Plan’s projections for types of technologies anticipated to treat municipal and C&I waste in 2020 (Table 3.5), it is possible to calculate an indicative number and type of facilities that would be required to meet South London waste infrastructure requirements for meeting the apportionment.
Table 3.5 Landtake required per facility
Facility type
Through
put per
facility
(tonnes per
year)
Landtake per facility (ha)
Number of additional facilities
required to meet
apportionment in 2020
Number of additional facilities
required to meet
apportionment in 2021
MRF 42000 0.9 9 9 Composting 19000 1.25 2 2 MBT 125000 1.75 1 1 Anaerobic digestion 15000 1 1 1
Gasification/pyrolysis 114000 2.25 1 1
3.8 The above facilities would require 15.60 ha of land to be allocated across the four south London boroughs to meet the apportionment targets for 2020 and 2021 as shown in Table 3.5. To become self sufficient in the management of waste in 2021 one more composting facility would be required and therefore 16.85 ha of land would need to be allocated across the south London area. Potentially the existing transfer stations could be re-allocated to be used for treatment capacity which would place a lesser burden on the authorities to supply new sites.

South London Joint Waste Development Plan Document Building the Evidence Base for Issues and Options
© Mouchel 2008 25
4 Locational Opportunities and Constraints
4.1 To identify possible areas of opportunity for waste management facilities it is necessary to consider the location of the existing licensed waste management facilities, exempt waste management sites and Pollution Prevention Control (PPC) permitted facilities as Policy 4A.22 of The London Plan states that DPDs should, where appropriate, safeguard all existing waste management sites.
4.2 Map 4.1 shows the location of the existing waste management facilities, exempt waste management sites, and PPC permitted facilities (refer to tables 3.1, 3.2 & 3.3 for more information on facilities). It can be seen that Kingston has only one existing waste management facility whereas Croydon has 11 existing waste management facilities - the most out of the four boroughs. There are 3 PPC permitted facilities in the south London area – 1 in Kingston and 2 in Sutton. Kingston has the lowest number of exempt waste management facilities with two, whereas Sutton and Croydon have the most with eight exempt sites each.
4.3 Map 4.2 shows the broad locations of opportunity for waste management facilities that are within the four London Boroughs. These are:
• Preferred Industrial Locations – from The London Plan • Industrial Business Parks – from The London Plan
• Existing waste management facilities – from The Environment Agency
• Employment Areas – from Croydon’s Unitary Development Plan • Industrial/Warehouse/ Business Zone – from Kingston’s Unitary Development
Plan • Industrial Land – from Merton’s Unitary Development Plan • Strategic Industrial Locations – from Sutton’s Unitary Development Plan • Established Industrial Areas – from Sutton’s Unitary Development Plan
4.4 Map 4.2 amalgamates the three types of waste management licence shown in Map 1, into one category, for ease of reference. Map 4.2 shows a strong correlation between the location of existing waste management facilities and the areas of opportunity identified within the planning documents listed above.
Together, these form the category, ‘Local Employment Areas’ on Maps 5.2-5.4
Together, these form the category, Strategic Industrial Locations on Maps 5.2-5.4

South London Joint Waste Development Plan Document Building the Evidence Base for Issues and Options
© Mouchel 2008 26
Map 4.1 Existing Licensed Waste Management Facilities

South London Joint Waste Development Plan Document Building the Evidence Base for Issues and Options
© Mouchel 2008 27
Map 4.2 Broad locations for Future Waste Management Facilities

South London Joint Waste Development Plan Document Building the Evidence Base for Issues and Options
© Mouchel 2008 28
4.5 Map 4.3 is taken from the Strategic Flood Risk Assessment (SFRA) carried out by the four Boroughs in 2007 to identify locations within each authority that are at risk of flooding. The risk zones shown in the map are:
1. Medium Risk Zone (2) 2. High Risk Zone (3a) 3. Functional Floodplain Zone (3b)
4.6 It is clear that some of the broad locations of opportunity are in medium flood risk zones; fortunately there aren’t any waste treatment facilities in the Functional Floodplain as they are not permitted to be developed. This may be due to industrial zones being situated near rivers or on lesser value areas of land e.g. next to water treatment plants. Examples include the water treatment plant off Villiers Road, Kingston and the water treatment works off Beddington Lane, Sutton.
4.7 The area of high risk flooding and the floodplain are situated along the River Thames by Surbiton and Kingston.
4.8 In Map 4.4 the broad locations of opportunity are plotted against the strategic network within the four Boroughs. The constraints used are those areas with statutory protection and have been designated at a regional level e.g. Metropolitan Open Land designated by Greater London Authority, or at an international level e.g. Special Areas of Conservation. The constraints criteria mapped are those used the waste apportionment study9, a background document to The London Plan and are shown in Table 4.1
Table 4.1 Types of Constraint Used
Designation of Constraint
Special Areas of Conservation
Metropolitan Open Land
Metropolitan Green Belt
Sites of Special Scientific Interest
9 Jacobs Babtie, December 2006, ‘London Waste Apportionment Study.’ Available from http://www.london.gov.uk/mayor/strategies/sds/further-alts/docs/waste-apportionment-jb-all.pdf
South London Joint Waste Development Plan Document Building the Evidence Base for Issues and Options
© Mouchel 2008 29
4.9 There are a number of constraints identified in PPS10 and The London Plan that are not present in the south London boroughs and have therefore been omitted from the constraints mapping assessment. These are as follows:
• RAMSAR Sites • Special Protection Areas • Areas of Outstanding Natural Beauty • Heritage Coasts • World Heritage Sites. • National Nature Reserves
4.10 As shown in Map 4.4 the Metropolitan Green Belt is situated to the edges of the south London region that marks the boundary of Greater London. There are large areas of Metropolitan Open Land at Beddington Lane (Sutton), Wimbledon Common (Merton) and the south of the railway in Tolworth (Kingston). There are also several Sites of Special Scientific Interest but these are situated within larger designated areas e.g. Metropolitan Green Belt.

South London Joint Waste Development Plan Document Building the Evidence Base for Issues and Options
© Mouchel 2008 30
Map 4.3 Broad Locations set against the Strategic Flood Risk Assessment

South London Joint Waste Development Plan Document Building the Evidence Base for Issues and Options
© Mouchel 2008 31
Map 4.4 Broad locations set against the Strategic Network
South London Joint Waste Development Plan Document Building the Evidence Base for Issues and Options
© Mouchel 2008 32
5 Identifying Issues and Options
Introduction 5.0 The term ‘issues and options’ can potentially be misleading. It somehow suggests a
sense of mutually exclusive options emerging from consideration of certain issues. It tends to support the framing of issues that can be described with some sense of ‘polarity’, for example do you support option a or option b? It is not at all clear that in a more discursively framed document where particular configurations of sites have yet to be identified and evaluated that this will be the case. Therefore a key question to be asked and answered is the kind of document the Issues and Options consultation document is, what its purpose is, who is it for and what do we want from them?
Aims of Issues and Options document 5.1 If the document is seen as the early basis for engagement and consultation then the document’s purpose is:
• To communicate the policy context and drivers of the plan and why the waste issue, and planning for waste is important;
• To communicate and clarify the scope of the plan, delineate it from other processes (such as the work of the SLWP and the individual boroughs waste operations);
• To communicate the process for the preparation and adoption of the plan and how people will be engaged (lay out the high level consultation and engagement programme, SA/SEA etc.)
• To define and understand the component waste streams now and in the future and what types and amounts need to be managed in the future.
• To define existing capacity for management of waste and the resulting gap;
• To explore the waste management and land use implications of this gap and how it needs to be ‘filled’;
• To begin to set out the key issues that need to be considered from a policy and site selection/evaluation point of view and the questions and/or choices that emerge from their consideration.

South London Joint Waste Development Plan Document Building the Evidence Base for Issues and Options
© Mouchel 2008 33
Initial Issues and questions 5.2 Table 5.1 frames some initial key issues that the four boroughs may wish to consider and discuss in developing their issues and options document. Each of the key issues identified has emerged from our work in building the evidence base for the South London JWDPD and through our discussions with officers and members and representatives from the GLA.
Table 5.1 Emerging Issues and Options for consideration by the four South London boroughs Issue Questions/Choices
1) Vision, Aims and objectives of the plan
Spell out draft vision aims and objectives and seek people’s views on these and their completeness, ambition and clarity.
2) Capacity planning What level and types of capacity should be planned for, apportionment, self-sufficiency and the issue of building in contingency in terms of land allocations
3) Waste management targets MSW recycling targets. London Plan or higher (Environment Select Committee). This needs to be considered in the context of what the SLWP and constituent partners are planning for through the current procurement.
4) Technologies and site specificity
How can the plan support more innovative waste technologies? The balance between offering certainty and flexibility around technology and sites. Potential for defining a more generic range of technology suitable for each particular site (facility envelope).
5) Supporting a resource management approach
How could/should the plan support a more embracing approach to waste and resource management? For example, should the plan have policies in support of re-processing and remanufacturing? How can the plan support and enable waste minimisation and behavioural change? The boroughs will need to consider how this is enabled and joined up across the JWDPD and other planning documents and strategies within the boroughs.

South London Joint Waste Development Plan Document Building the Evidence Base for Issues and Options
© Mouchel 2008 34
Issue Questions/Choices
6) Waste’s contribution to decentralised and renewable energy
Should and if so how can the plan support decentralised renewable energy? Link in to the London plan hierarchy for on site energy (e.g. preference for plugging in to existing heat/power network, then to supporting private wire network etc). In particular will need to consider how the JWDPD fits in with other planning documents within the boroughs.
7) Site locational criteria Consideration of locational criteria contained principally in PPS10 and London Plan. Key question is the extent to which these are complete. Should more locally specific issues and concerns (to south London) be included? How should relative importance to be attached to them?
8) Overall site strategy The need to consider the extent to which South London’s needs could best be met through centralising capacity as much as is practicable or through a more localised scenario for proximity. The latter could be seen as supporting the decentralised energy agenda although if facilities are too small they may not economically match heat and energy loads of surrounding developments. In addition will need to explore the opportunities larger more sub regional sites afford for integrated waste uses (e.g. MBT and gasification/pyrolysis of residues, bulking for recyclables etc)
9) Transport
Although there are clearly strong relationships with technology, locational criteria and overall site strategy, the transport issue is worth separate consideration. In particular as an opportunity to explore how alternative modes can be considered/supported by the plan. There may be a more limited opportunity for this in South London with few navigable (Thames) waterways and wharves. Key questions can be around opportunities for sites that support alternative modes (e.g. railheads) and what kinds of facilities make sense for such sites (e.g. transport of bulked recyclables).
South London Joint Waste Development Plan Document Building the Evidence Base for Issues and Options
© Mouchel 2008 35
Issue Questions/Choices
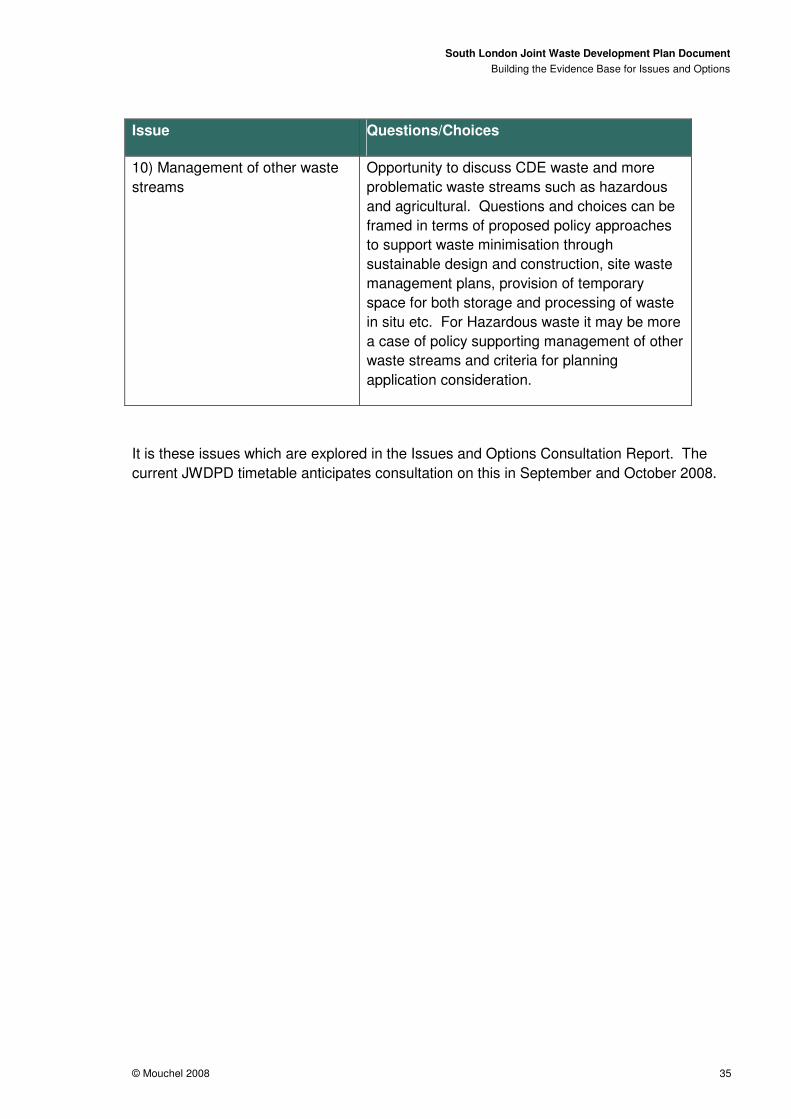
10) Management of other waste streams
Opportunity to discuss CDE waste and more problematic waste streams such as hazardous and agricultural. Questions and choices can be framed in terms of proposed policy approaches to support waste minimisation through sustainable design and construction, site waste management plans, provision of temporary space for both storage and processing of waste in situ etc. For Hazardous waste it may be more a case of policy supporting management of other waste streams and criteria for planning application consideration.
It is these issues which are explored in the Issues and Options Consultation Report. The current JWDPD timetable anticipates consultation on this in September and October 2008.

South London Joint Waste Development Plan Document Building the Evidence Base for Issues and Options
© Mouchel 2008 36
6 Appendices
Appendix A
Table 6.1 Waste Capacity in the South London Area by Licensed Waste Site
Licence number
Facility Type
Annual Licensed Capacity (tonnes)
Annual Estimated
Throughput (tonnes)
Annual Estimated Available Capacity (tonnes)
Annual Current
% Capacity
Used
Borough
83161 Metal recycling facility (vehicle
dismantler) 572 240 332 41%
Croydon
83163
Household, commercial and industrial waste transfer station
200,000 150,000 50,000 75%
Croydon
83164
Civic amenity site
15,125 11,343 3782 75% Croydon
83167
Household, commercial and industrial waste transfer station
10,920 9,595 1325 87%
Croydon
83169
Civic amenity site
12,535 9,401 3134 75% Croydon
83170
Metal recycling facility (vehicle
dismantler) 520 123 397 23%
Croydon
83171
Household, commercial and industrial waste transfer station
37,500 28,125 9375 75%
Croydon
83303 Composting
facility 24,800 2,000 22800 8 %
Croydon

South London Joint Waste Development Plan Document Building the Evidence Base for Issues and Options
© Mouchel 2008 37
Licence number
Facility Type
Annual Licensed Capacity (tonnes)
Annual Estimated
Throughput (tonnes)
Annual Estimated Available Capacity (tonnes)
Annual Current
% Capacity
Used
Borough
83306
Household, commercial and industrial waste transfer station
24,700 18,525 6175 75%
Croydon
83477
Metal recycling facility (vehicle
dismantler) 5,000 3,750 1250 75%
Croydon
83651
Special waste transfer station
50,000 37,500 12500 75% Croydon
83181
Household, commercial and industrial waste transfer station
45,000 33,750 11250 75%
Kingston upon
Thames
83183
Household, commercial and industrial waste transfer station
24,960 18,720
6240 75%
Merton
83184
Household, commercial and industrial waste transfer station
286,000 214,500 71500 75%
Merton
83185
Household, commercial and industrial waste transfer station
22,281 16,710 5571 75%
Merton
83187
Household, commercial and industrial waste transfer station
141,778 106,333 35445 75%
Merton
83326
Physical Treatment
Facility 54,320 54,320 0 100%
Merton

South London Joint Waste Development Plan Document Building the Evidence Base for Issues and Options
© Mouchel 2008 38
Licence number
Facility Type
Annual Licensed Capacity (tonnes)
Annual Estimated
Throughput (tonnes)
Annual Estimated Available Capacity (tonnes)
Annual Current
% Capacity
Used
Borough
83456
Transfer station taking non-
biodegradable waste
22,550 16,875 5675 75% Merton
83458
Household, commercial and industrial waste transfer station
200 150 50 75% Merton
83476
End of life vehicle facility
73,000 54,750 18250 75% Merton
83488 End of life
vehicle facility 2,500 1,875 625 75% Merton
83568
Household, commercial and industrial waste transfer station
25,000 18,750 6250 75% Merton
83589
Civic amenity site
36,764 27,573 9191 75% Merton
83646
Clinical waste transfer station
5,000 3,750 1250 75% Merton
83214
Household, commercial and industrial waste transfer station
4,999 3,749 1250 75% Sutton
83218
Transfer station taking non-
biodegradable waste
43,800 32,850 10950 75% Sutton

South London Joint Waste Development Plan Document Building the Evidence Base for Issues and Options
© Mouchel 2008 39
Licence number
Facility Type
Annual Licensed Capacity (tonnes)
Annual Estimated
Throughput (tonnes)
Annual Estimated Available Capacity (tonnes)
Annual Current
% Capacity
Used
Borough
83314
Metal recycling site (mixed
MRS’s) 74,999 74,999 0 100% Sutton
83335
Transfer station taking non-
biodegradable waste
62,400 46,800 15600 75% Sutton
83441
Materials recycling facility
70,000 52,500 17500 75% Sutton
83473
Materials recycling facility
372,600 279,450 93150 75% Sutton
83492
End of life vehicle facility
2,500 1,875 625 75% Sutton
83617
Household, commercial and industrial waste transfer station
24,999 18,749 6250 75% Sutton
Totals 1,777,322 1,349,630 442,287

South London Joint Waste Development Plan Document Building the Evidence Base for Issues and Options
© Mouchel 2008 40
Appendix B
The Policy Context to the JWDPD
Key European Policy
The Waste Framework Directive 2006/12/EC
The key principles of planning for waste management facilities are detailed within this Directive. These are managing waste as closely to the top of the waste hierarchy as possible and that wastes should be disposed of as close to the source of waste as possible. The Directive requires Member States to ensure that the plans are drawn up to identify suitable sites for the treatment of waste.
Figure 1. The Waste Hierarchy
The Landfill Directive 1999/31/EC
This significant piece of legislation focuses on diverting biodegradable municipal waste (BMW) from landfill. It harmonises landfill practices across Member states, defining waste categories and setting specific controls on the disposal of all wastes types to landfill. The requirements of the Directive were transposed into UK law through the Landfill (England and Wales) 2002 Regulations.
To secure the required reductions in BMW to landfill, the Waste and Emissions Trading Act sets diversion targets for each local authority in the UK.
Landfill Directive targets to divert biodegradable municipal waste (BMW) from landfill:
• By 2010: Reduce the amount of BMW landfilled to 75% of that produced in 1995

South London Joint Waste Development Plan Document Building the Evidence Base for Issues and Options
© Mouchel 2008 41
• By 2013: Reduce the amount of BMW landfilled to 50% of that produced in 1995
• By 2020: Reduce the amount of BMW landfilled to 35% of that produced in 1995
Packaging and Packaging Waste Directive 1994/62/EC
The Directive seeks to reduce the impact of packaging and packaging waste on the environment by introducing recovery and recycling targets for packaging waste, and by encouraging minimisation and reuse of packaging.
Packaging waste target for Great Britain:
By end of 2008: At least 60% of packaging and packaging waste to be recovered.
The UK regulations enforcing this Directive set higher over-arching recovery and recycling targets for packaging and packaging waste, as well as specific targets for each material stream.
The Producer Responsibility Obligations (Packaging Waste) Regulations (Amendment) 2008 has set overall recovery targets at:
• By end of 2008: 72% of packaging and packaging waste to be recovered.
• By end of 2009: 73% of packaging and packaging waste to be recovered.
• By end of 2010: 74% of packaging and packaging waste to be recovered.
Key National Policy
The Waste and Emissions and Trading Act 2003
This Act provides the legal framework for the Landfill Allowance Trading Scheme (LATS) and for the allocation of tradable landfill allowances to each waste disposal authority in England. Since April 2005, each authority in England has been given an annual (decreasing) ‘landfill allowance’ for biodegradable waste. Under this scheme, each authority will be able to determine how to use its allowance in the most effective way. It is able to trade allowances with other authorities (buy or sell), save them for future years (bank) or use some of its future allowances in advance (borrow). The penalty incurred on a local authority for not complying with its LATS allowances is £150 per additional tonne of biodegradable waste land filled.

South London Joint Waste Development Plan Document Building the Evidence Base for Issues and Options
© Mouchel 2008 42
The combined LATS targets for the boroughs of the South London Waste Plan are detailed below.
LATS targets for boroughs of the South London Waste Plan:
• By 2010: Maximum allowance of BMW permitted to landfill is 181,725 tonnes
• By 2015: Maximum allowance of BMW permitted to landfill is 110,658 tonnes
• By 2020: Maximum allowance of BMW permitted to landfill is 84,697 tonnes
• PPS10: Planning for Sustainable Waste Management, July 2005
This document transposes into policy the requirements of the Waste Framework Directive, in that communities are required to take more responsibility for the management of their own waste and that waste should be disposed of in one of the nearest appropriate installations (proximity). The Policy requires all Regional Spatial Strategies (RSS) to identify the tonnages of municipal and commercial & industrial wastes requiring management within the RSS area and for these to be apportioned by waste planning authority area. PPS10 requires local planning authorities to identify, through development plan documents, sites and areas suitable for new or enhanced waste management facilities for the waste management needs of their areas, to support the apportionment provided by the RSS. PPS10 sets out guidance on locational criteria and broad areas suitable for the siting of new waste management facilities.
Securing the Future, the UK Strategy for Sustainable Development, March 2005
The Strategy sets out the Government’s key commitments to enabling sustainable development. The Strategy is based on the five principles of:
• Living within environmental limits
• Ensuring a strong, healthy and just society
• Achieving a sustainable economy
• Promoting good governance
• Using sound science responsibly
The Strategy favours policies to advance markets to close the resource loop by enabling the development of product re-use, re-manufacturing and recycling industries.
The Planning and Compulsory Purchase Act, July 2004
This Act requires all local planning authorities to produce a Local Development Framework (LDF). The LDF is a portfolio of Local Development Plan Documents (LDDs) which collectively deliver the spatial planning strategy for local planning authorities. The Waste

South London Joint Waste Development Plan Document Building the Evidence Base for Issues and Options
© Mouchel 2008 43
Development Plan Document will form part of Croydon, Kingston, Merton and Sutton’s LDFs.
Waste Strategy for England, 2007
One of the Strategy’s key aims is to break the link between economic growth and waste growth. It identifies the role of government, producers and consumers in minimising waste production and focuses on driving treatment up the waste hierarchy, be encouraging the development of new infrastructure to enable greater levels of composting, recycling and energy recovery.
Recycling and composting targets:
• By 2010: Recycle or compost at least 40% of household waste
• By 2015: Recycle or compost at least 45% of household waste
• By 2020: Recycle or compost at least 50% of household waste
Targets to reduce the amount of residual waste:
• By 2010: Reduce the amount of residual waste by 29%
• By 2015: Reduce the amount of residual waste by 35% from 2000 levels
• By 2020: Reduce the amount of residual waste by 45%
The Strategy also identifies an increase in the landfill tax escalator, announced previously in the March 2007 budget, which sets the standard tax increase rate at £8 per year from 2008 until at least 2010/2011. This gives greater financial incentives to businesses and local authorities to reduce re-use and recycle waste, since landfill becomes an increasing expensive and therefore unattractive waste management solution.
Key Regional Policy
The London Plan: Spatial Development Strategy for Greater London, Consolidated with Alterations since 2004, February 2008
The London Plan’s policies emphasise the need to drive waste up the waste management hierarchy, the proximity principle of managing waste close to where it arises and developing facilities to enable London to become increasingly self-sufficient in managing its own waste.
The Plan sets targets for recycling municipal, construction and demolition and commercial and industrial wastes in London and encourages the development of new facilities to enable London to become more self-sufficient in managing its waste.
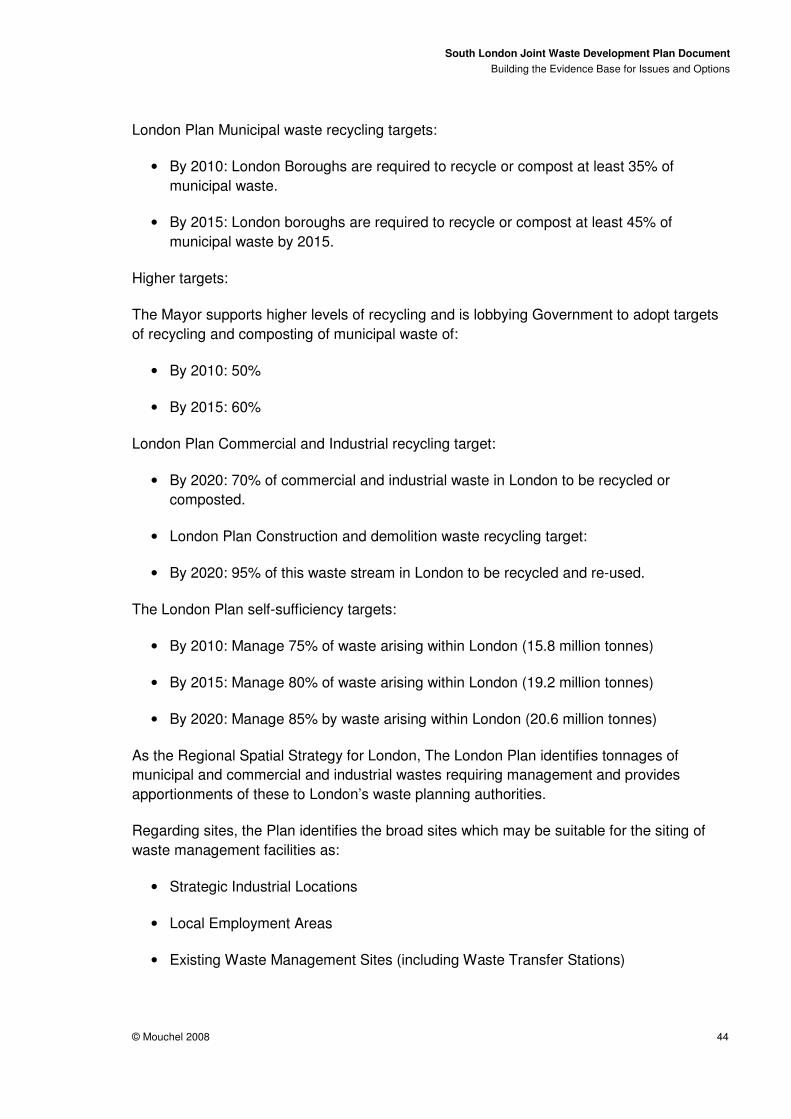
South London Joint Waste Development Plan Document Building the Evidence Base for Issues and Options
© Mouchel 2008 44
London Plan Municipal waste recycling targets:
• By 2010: London Boroughs are required to recycle or compost at least 35% of municipal waste.
• By 2015: London boroughs are required to recycle or compost at least 45% of municipal waste by 2015.
Higher targets:
The Mayor supports higher levels of recycling and is lobbying Government to adopt targets of recycling and composting of municipal waste of:
• By 2010: 50%
• By 2015: 60%
London Plan Commercial and Industrial recycling target:
• By 2020: 70% of commercial and industrial waste in London to be recycled or composted.
• London Plan Construction and demolition waste recycling target:
• By 2020: 95% of this waste stream in London to be recycled and re-used.
The London Plan self-sufficiency targets:
• By 2010: Manage 75% of waste arising within London (15.8 million tonnes)
• By 2015: Manage 80% of waste arising within London (19.2 million tonnes)
• By 2020: Manage 85% by waste arising within London (20.6 million tonnes)
As the Regional Spatial Strategy for London, The London Plan identifies tonnages of municipal and commercial and industrial wastes requiring management and provides apportionments of these to London’s waste planning authorities.
Regarding sites, the Plan identifies the broad sites which may be suitable for the siting of waste management facilities as:
• Strategic Industrial Locations
• Local Employment Areas
• Existing Waste Management Sites (including Waste Transfer Stations)

South London Joint Waste Development Plan Document Building the Evidence Base for Issues and Options
© Mouchel 2008 45
Regarding technology, the Plan seeks to drive the management of waste up the waste hierarchy through its policies which favour recycling and composting technologies and new hydrogen-producing technologies and the supply of combined heat and power, over traditional energy recovery waste plants.
The Mayor’s Energy Strategy: Green Light to Clean Power, February 2004
The Strategy sets out London’s commitment to take a lead in the development and application of renewable energy technologies (including technologies utilising waste as a fuel source), particularly favouring those technologies which produce hydrogen. The Strategy confirms the establishment of a London Hydrogen Partnership, led by the Mayor, which aims to deliver a hydrogen economy, to take London into the 21st century.
The Mayor’s Municipal Waste Management Strategy for London: Rethinking Rubbish in London, September 2003
The Mayor of London is responsible for the strategic management of London's waste. The Strategy sets out an overarching framework of policy to 2020, focusing on minimising the negative impacts of waste on our environment, health, economy and communities, by focusing policies on reducing, re-using and recycling waste.
Key Local Policy
The South London Waste Partnership
All Councils within the South London Waste Plan area have committed to the formation of the South London Waste Partnership. This Partnership is responsible for procuring waste disposal contracts, to enable the Partnership to:
• Maximise diversion of Biodegradable Municipal Waste from landfill
• Achieve diversion targets of the Landfill Allowance Trading Scheme
• Achieve statutory targets for recycling and composting
• Establish shared infrastructure within the region
All boroughs are both waste collection and disposal authorities. Each has a waste management strategy (MWMS) which guides the development of their services and identifies targets for recycling and composting. A Joint Municipal Waste Management Strategy is in development. The boroughs’ MWMSs also identify activities to encourage waste minimisation. Waste Minimisation is at the top of the waste management hierarchy and although the Joint Waste Development Plan Document is limited in its ability to influence waste minimisation, it is important that the evidence base of the Plan considers the efforts being made to reduce waste within the Plans’ area. Waste minimisation activities will influence the predicted growth rates of municipal and commercial waste arisings within the boroughs and monitoring of the success of these activities will be an important aspect of the Joint Waste DPD’s monitoring regime.
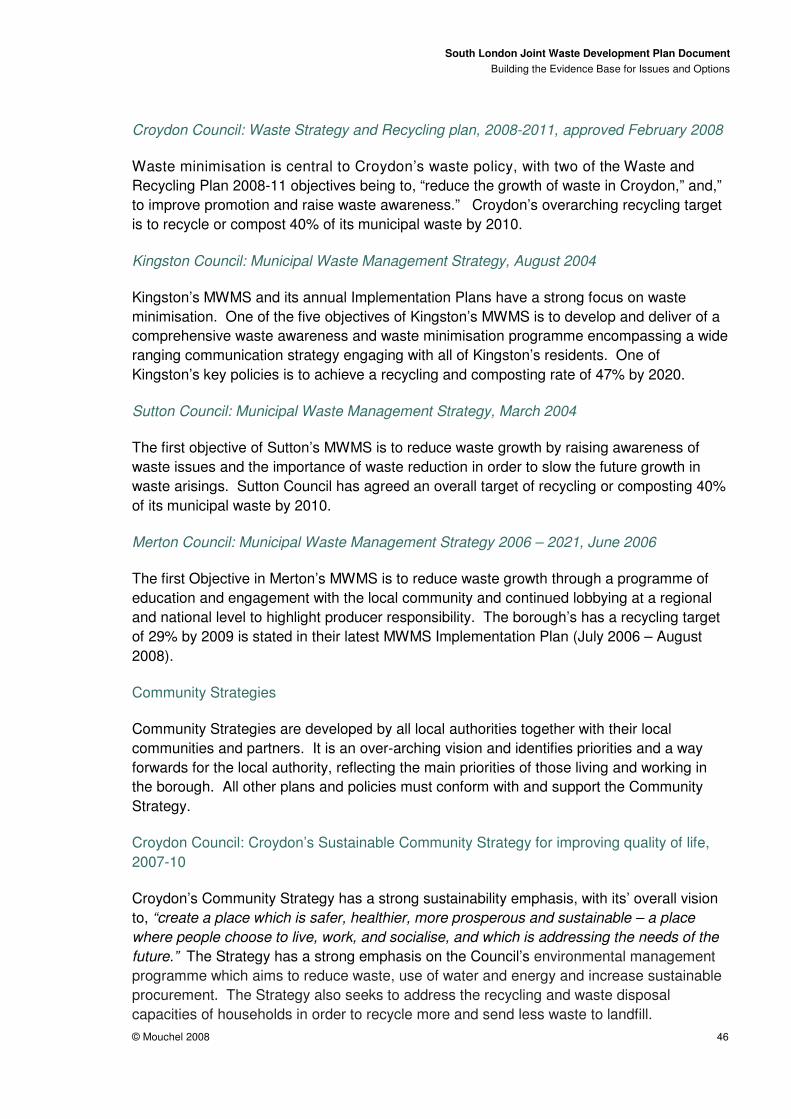
South London Joint Waste Development Plan Document Building the Evidence Base for Issues and Options
© Mouchel 2008 46
Croydon Council: Waste Strategy and Recycling plan, 2008-2011, approved February 2008
Waste minimisation is central to Croydon’s waste policy, with two of the Waste and Recycling Plan 2008-11 objectives being to, “reduce the growth of waste in Croydon,” and,” to improve promotion and raise waste awareness.” Croydon’s overarching recycling target is to recycle or compost 40% of its municipal waste by 2010.
Kingston Council: Municipal Waste Management Strategy, August 2004
Kingston’s MWMS and its annual Implementation Plans have a strong focus on waste minimisation. One of the five objectives of Kingston’s MWMS is to develop and deliver of a comprehensive waste awareness and waste minimisation programme encompassing a wide ranging communication strategy engaging with all of Kingston’s residents. One of Kingston’s key policies is to achieve a recycling and composting rate of 47% by 2020.
Sutton Council: Municipal Waste Management Strategy, March 2004
The first objective of Sutton’s MWMS is to reduce waste growth by raising awareness of waste issues and the importance of waste reduction in order to slow the future growth in waste arisings. Sutton Council has agreed an overall target of recycling or composting 40% of its municipal waste by 2010.
Merton Council: Municipal Waste Management Strategy 2006 – 2021, June 2006
The first Objective in Merton’s MWMS is to reduce waste growth through a programme of education and engagement with the local community and continued lobbying at a regional and national level to highlight producer responsibility. The borough’s has a recycling target of 29% by 2009 is stated in their latest MWMS Implementation Plan (July 2006 – August 2008).
Community Strategies
Community Strategies are developed by all local authorities together with their local communities and partners. It is an over-arching vision and identifies priorities and a way forwards for the local authority, reflecting the main priorities of those living and working in the borough. All other plans and policies must conform with and support the Community Strategy.
Croydon Council: Croydon’s Sustainable Community Strategy for improving quality of life, 2007-10
Croydon’s Community Strategy has a strong sustainability emphasis, with its’ overall vision to, “create a place which is safer, healthier, more prosperous and sustainable – a place where people choose to live, work, and socialise, and which is addressing the needs of the future.” The Strategy has a strong emphasis on the Council’s environmental management programme which aims to reduce waste, use of water and energy and increase sustainable procurement. The Strategy also seeks to address the recycling and waste disposal capacities of households in order to recycle more and send less waste to landfill.

South London Joint Waste Development Plan Document Building the Evidence Base for Issues and Options
© Mouchel 2008 47
Croydon’s Community Strategy states that the Council will seek to identify suitable local sites for recycling and waste treatment plants. It also states that the Council seeks to establish private wire and district heating networks in Croydon to supply energy in a sustainable way at low cost to local customers on new large development sites, including New Addington, Croydon Metropolitan Centre and Purley and to install mini-Combined Heat and Power (CHP) plants in community scale developments in new buildings and when boilers are replaced.
Kingston Council: A Community Plan for the Royal Borough of Kingston Upon Thames, 2004-2009
Kingston’s Plan has a strong emphasis on delivering a sustainable Kingston. In order to achieve this, a set of 6 ‘vision themes’ have been developed which underpin the Plan’s six priority areas. The first of these vision statements is to create, “an environmentally conscious community and a sustainable borough,“ underpinned by the overall objective of “living safe, healthy, rewarding lives, with access to an undiminished natural environment, while protecting the future well-being of others.”
The Community Plan recognises the importance in encouraging Kingston residents and businesses to reduce, reuse and recycle and highlights the borough’s MWMS as the key vehicle for achieving this. Kingston’s Community Plan also recognises the need to work with partners to promote renewable energy.
Merton Council: Community Plan 2006-2015, Merton Partnership
Sustainability is a key theme running throughout Merton’s Community Plan and towards Merton’s attitude towards waste and energy. The Plan sets specific targets for reducing CO2 emissions by 15% from 2006/7 levels and to generate at least 10% of Merton’s energy use from renewable sources by 2015 through planning encouraging policies and infrastructure development. The Community Plan also sets local targets that will require combined recycling and composting rates of 30% by 2010 and 33% by 2013.
The Community Plan states that Merton Council will ensure that appropriate waste treatment and disposal technologies will be procured to ensure compliance with the Landfill Allowance Trading Scheme and furthermore that the Council will seek to maximise diversion from landfill and to recover value from biodegradable municipal waste.
Sutton Council: The Sutton Plan, 2007-2010.
The development of Sutton as a sustainable suburb lies at the heart of the borough’s vision to, “build a community in which we can all take part and all can take pride.” Developing a cleaner and greener environment is one of nine priorities identified in the Plan and specifically highlights the importance of developing the waste and recycling service, improving recycling performance and minimising waste production. The Plan specifies the Council’s ambition to increase recycling/composting levels to 45% by 2010 through the additional use of treatment facilities and minimise waste growth.

South London Joint Waste Development Plan Document Building the Evidence Base for Issues and Options
© Mouchel 2008 48
Unitary Development Plans, emerging Local Development Frameworks and local regeneration initiatives
All local authorities are required to replace Unitary Development Plans (UDPs) with Local Development Frameworks (LDFs).
Croydon Council: The Croydon Plan, July 2006
Croydon’s core UDP policy, from which all other policies in the Plan directly flow, is that development in Croydon is expected to be sustainable (Policy SP1). This is demonstrated in Environmental Protection Policy SP13, which seeks to minimise the energy requirements of new development and will expect the use of renewable energy technologies and sustainable materials. It is further demonstrated in Environmental Protection Policy SP11 in which the Council will use development opportunities to secure the objectives of the waste hierarchy and the proximity/regional self sufficiency principle.
In order to meet future needs of the Borough Policy EP8 of the Croydon Plan provides scope for the development of waste management facilities in a range of locations across the Borough, including Strategic Employment Locations, Employment Areas, existing industrial and warehousing sites and existing waste management facilities, provided that the proposal meets a number of criteria, including sustainable transport opportunities to and from the site. The Policy also particularly encourages waste management facilities that minimise the quantity of waste requiring disposal by landfill and maximise waste recovery within the Borough.
In addition, Policy EP9 protects appropriately located existing waste management facilities, to guard against the loss of this resource.
Croydon’s Local Development Framework
Croydon has not yet started consulting on the development of its Core Strategy. Instead, Croydon’s first LDF document in development is the Croydon Metropolitan Centre Area Action Plan, which is open for Issues and Options stage consultation until the end of March 2008. This Plan identifies the Centre as an “opportunity area” for providing more employment and also several thousand new homes. The Centre is also the preferred location for new retail development and other facilities and services aimed at serving a wide area of South London.
Kingston Council: Unitary Development Plan, August 2005
Provides policies to govern waste management development in the borough.
Overarching strategic policy STR10 encourages sustainable methods of minerals transportation, waste disposal and transportation, energy generation and use. This policy echoes national and regional policy which requires waste treatment development to drive waste up the hierarchy. To this end, the Council’s UDP encourages the appropriate
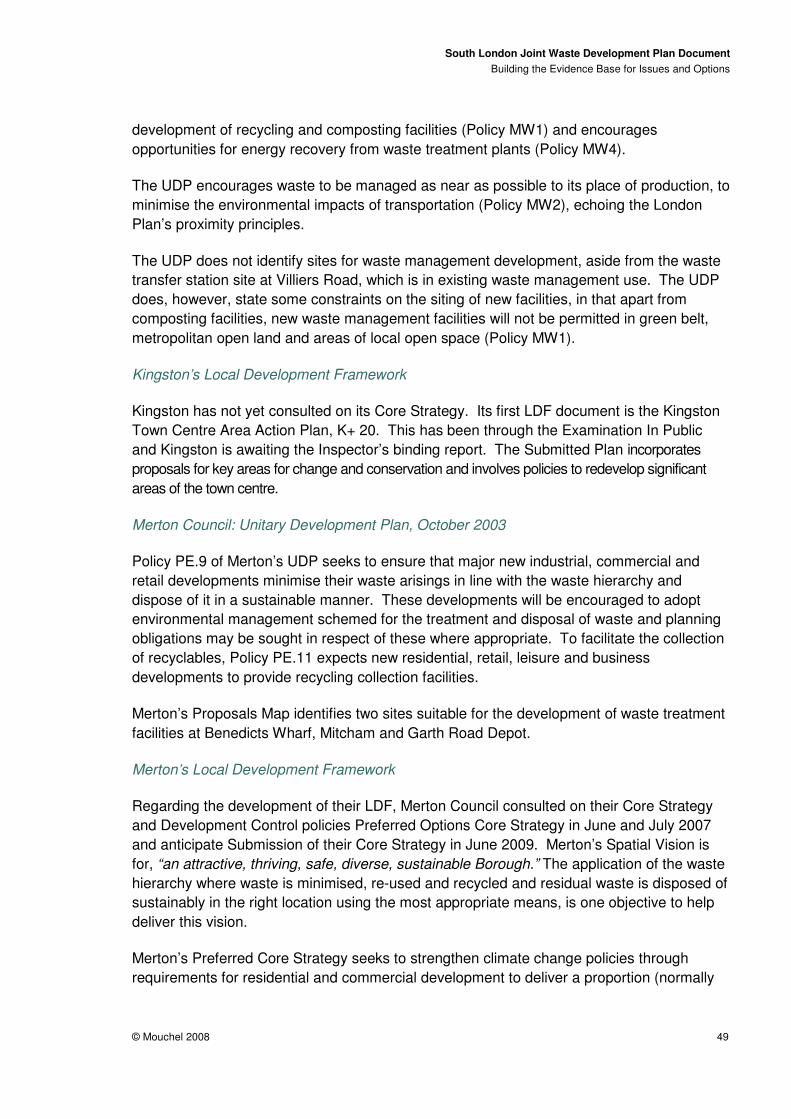
South London Joint Waste Development Plan Document Building the Evidence Base for Issues and Options
© Mouchel 2008 49
development of recycling and composting facilities (Policy MW1) and encourages opportunities for energy recovery from waste treatment plants (Policy MW4).
The UDP encourages waste to be managed as near as possible to its place of production, to minimise the environmental impacts of transportation (Policy MW2), echoing the London Plan’s proximity principles.
The UDP does not identify sites for waste management development, aside from the waste transfer station site at Villiers Road, which is in existing waste management use. The UDP does, however, state some constraints on the siting of new facilities, in that apart from composting facilities, new waste management facilities will not be permitted in green belt, metropolitan open land and areas of local open space (Policy MW1).
Kingston’s Local Development Framework
Kingston has not yet consulted on its Core Strategy. Its first LDF document is the Kingston Town Centre Area Action Plan, K+ 20. This has been through the Examination In Public and Kingston is awaiting the Inspector’s binding report. The Submitted Plan incorporates proposals for key areas for change and conservation and involves policies to redevelop significant areas of the town centre.
Merton Council: Unitary Development Plan, October 2003
Policy PE.9 of Merton’s UDP seeks to ensure that major new industrial, commercial and retail developments minimise their waste arisings in line with the waste hierarchy and dispose of it in a sustainable manner. These developments will be encouraged to adopt environmental management schemed for the treatment and disposal of waste and planning obligations may be sought in respect of these where appropriate. To facilitate the collection of recyclables, Policy PE.11 expects new residential, retail, leisure and business developments to provide recycling collection facilities.
Merton’s Proposals Map identifies two sites suitable for the development of waste treatment facilities at Benedicts Wharf, Mitcham and Garth Road Depot.
Merton’s Local Development Framework
Regarding the development of their LDF, Merton Council consulted on their Core Strategy and Development Control policies Preferred Options Core Strategy in June and July 2007 and anticipate Submission of their Core Strategy in June 2009. Merton’s Spatial Vision is for, “an attractive, thriving, safe, diverse, sustainable Borough.” The application of the waste hierarchy where waste is minimised, re-used and recycled and residual waste is disposed of sustainably in the right location using the most appropriate means, is one objective to help deliver this vision.
Merton’s Preferred Core Strategy seeks to strengthen climate change policies through requirements for residential and commercial development to deliver a proportion (normally

South London Joint Waste Development Plan Document Building the Evidence Base for Issues and Options
© Mouchel 2008 50
10%) of their energy from on-site renewable sources. Extracting energy from waste using environmentally friendly technologies is well supported in the Preferred Core Strategy.
With specific regard to waste, the Preferred Core Strategy states that Merton is working with the adjoining boroughs of Croydon, Sutton and Kingston to prepare a joint waste plan. Policy 12 (Manage Waste), states that Merton will meet the tonnages required by the London Plan, thereby progressing self-sufficiency whilst promoting sustainable waste management that encourages facilities that deal with waste as a resource. It further states that adequate sites (not only in Merton) will be identified to deal with the municipal waste stream and commercial and industrial waste streams in collaboration with the neighbouring boroughs of Croydon, Kingston upon Thames and Sutton.
The Strategy has identified that the alternative option would be for Merton to prepare its own waste plan, but further states that Merton Council has rejected this option as it would mean losing the advantages of collaboration such as shared costs in producing the plan, shared costs in operating sites and facilities and would restrict the number of sites that could be considered for waste usage.
With regard to sites, the Preferred Core Strategy acknowledges that recycling, waste processing and transfer and construction and demolition businesses will increase their demand for employment land within the borough. The consultation document further states that due to their potential environmental impacts on their immediate neighbours – noise, smells, transport movements, night-time operations, these industries cannot locate in or near town centres or residential areas and will be encouraged towards the designated Employment Areas, Industrial areas. Sites currently in waste use will be protected.
Policy 14 of the Preferred Core Strategy (Business Excellence in Merton), seeks to promote a robust and diverse local economy by increasing the square metres of employment floorspace available, including capacity for waste transfer and processing. The Preferred Options also state that there is a potential requirement of up to 10ha of commercial floorspace required specifically for waste processing and transfer that may be required between the boroughs of Croydon, Kingston Sutton and Merton, which will be considered through a Joint Waste DPD.
Regarding development which may impact on construction and demolition waste arisings, the Preferred Core Strategy identifies significant redevelopment for the town centres of Mitcham and Morden. Policies will support high quality development, improved public open spaces, transport routes and developing opportunities to install more efficient energy supplies.

South London Joint Waste Development Plan Document Building the Evidence Base for Issues and Options
© Mouchel 2008 51
Sutton Council: Sutton Unitary Development Plan, April 2003
Regarding the siting of waste-related development, Sutton’s UDP encourages these to be located within contaminated or previously developed derelict sites, or on sites which already have planning permission for a complementary waste facility (Policy PNR20). This policy also gives preference to sites which have good access to the strategic rail network and encourage sites to have good access to the strategic road network.
Regarding treatment technologies, Sutton’s UDP opposes proposals for a waste to energy plant at their Beddington Tip site, which is currently in waste management use.
Sutton’s Local Development Framework
Sutton has consulted on the preferred options for their Core Strategy and anticipates submission of their Core Strategy in September 2008. Reducing waste, promoting sustainable waste management and recycling are identified as actions by which Sutton will achieve environmental sustainability, promoted under Preferred Core Policy CP7 (One Planet Living).
The Preferred Core Strategy states that the Council has set an ambitious target of 85% self-sufficiency by 2020 and that detailed policies about how to achieve this will be set out in a Joint Waste DPD to be prepared by Sutton and its partner South West London authorities.
Preferred Core Policy CP8 (Waste Reduction and Management) states that the Council will manage its waste in a sustainable manner and will identify the necessary capacity and develop facilities in collaboration with London Boroughs of Kingston-Upon-Thames, Croydon and Merton, to meet the Mayor’s target of 85% self sufficiency across all waste streams, the Mayor’s waste apportionment figures and to meet the Mayor’s minimum targets for recycling, recovery and re-use.
Policy CP8 states that the Joint Waste Development Plan Document will safeguard existing waste management sites, unless compensatory provision is made, and allocate additional land within the strategic industrial locations in the Borough for future waste management facilities to meet the joint needs of the Joint Waste Development Plan Document area.
The Preferred Core Strategy highlights that the only realistic alternative option to developing a Joint waste Plan Core Policy would be for the Council to manage its waste independently of the three other South West London Boroughs. However, the Strategy identifies that collaboration provides much opportunity to manage the Borough’s waste in a sustainable manner.
In terms of sites, the Preferred Core Strategy identifies Beddington (108ha) and Kimpton (21ha) strategic industrial locations as appropriate locations for waste management uses. The Strategy also identifies a need for more land designated for employment uses and proposes the extension of employment land at the Beddington Strategic Industrial Location on 10ha of land currently identified as Metropolitan Open Land, in Preferred Core Strategy CP 15. This is adjacent to a site currently in waste management use. The Policy notes that

South London Joint Waste Development Plan Document Building the Evidence Base for Issues and Options
© Mouchel 2008 52
proposals for employment uses will be expected to contribute towards improving the strategic employment role of the area. The policy context also notes that this area of additional land could enable the development of additional waste management facilities in appropriate locations where there already is an existing concentration of such facilities, and will help achieve the Borough’s self-sufficiency target in waste management.