south loup watershed management plan -...
TRANSCRIPT
1
South Loup Watershed Management Plan
Open House – April 5, 2016
2
Welcome
• Introductions
– Name
– Affiliation/Role
– What is your primary concern in the South Loup Watershed?
• Make sure you have signed in

3
Today’s Objectives• Share the results of watershed study
• Allow for 1-on-1 conversations with each agency
• Provide opportunity for public questions and input
Please……
• Provide Input
• Ask Questions
• Fill out a Comment Card
4
Project Partners
5
Consultants Assisting
• Central hub for various local, state and federal datasets
• Non-biased opinion• Engineering and Scientific Resources• Experienced in writing watershed plans• JEO Project Manager: Adam Rupe

6
South Loup Land Use

7
E. Coli Impairment
8
Overall Project Goals
• Identify the causes of the problems
• Recommend solutions that are based on accepted and tested agricultural Best Management Practices (BMPs) or Conservation Practices
• Get input from local residents
• Compile everything into a plan

9
Project Components
• Stakeholder and Public Involvement
• Hydrology Analysis
• Identified Conjunctive Management Opportunities
• Stream Assessment
• Pollutant Source Identification
• Recommendations
Surface Water Quantity
Surface Water Quality
Groundwater Quantity
GroundwaterQuality
Holistic Approach

10
Stakeholders & Public Involvement
• Public Survey
• Stakeholder Meetings
• Community Presentations
• News Articles
• Website Information
• Public Open House
Land Owners | General Public | NRCS | NRDs | DNR| NDEQ| Nebraska Game & Parks

11
Watershed Survey
• May 5, 2015 – Kickoff Meeting
• June 3 – 496 Postcards mailed out
• June 11 - Survey Press Release
• Total of 51 Responses (10%) Received
0
5
10
15
20
25
30
Responses Volume
*Collected via Internet (hardcopy optional)

12
Survey Objectives
1. Identity Best Management Practices (BMPs) that are currently being utilized in the watershed
2. Identify what additional BMPs would landowners/residents be most willing to implement
3. Identify additional steps that may be necessary to increase implementation of BMPs

13
Survey Results Summary
• Over 50% aware of groundwater and stream level declines
• Approximately 25% aware of water quality problems in river
• Some conservation practices already implemented in watershed
• Respondents are willing to implement additional BMPs – costs are biggest hurdle
14
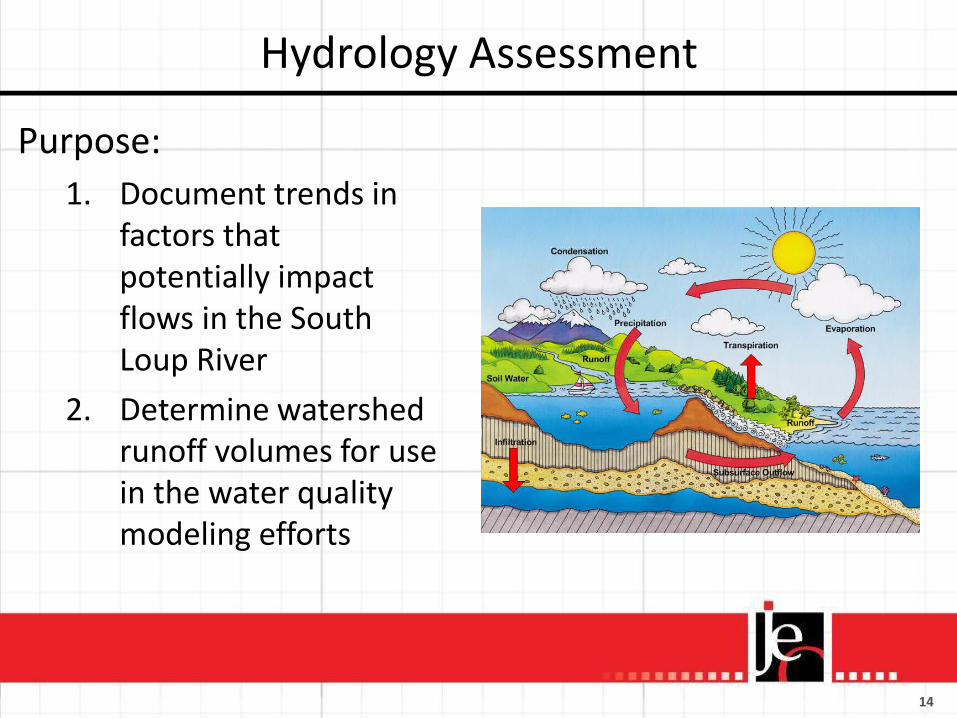
Hydrology Assessment
Purpose:
1. Document trends in factors that potentially impact flows in the South Loup River
2. Determine watershed runoff volumes for use in the water quality modeling efforts

15
Trends in Annual Precipitation
• Precipitation data available at Ravenna, Broken Bow, and Arnold
• Conclusions:– Mixed trends in precipitation
gages– Departure from long-term
averages trending to be more greater

16
Trends in Measured Streamflow• Incomplete gage records at Ravenna as well as
limited dataset (5-yrs of data) at Arnold• Analysis considered South Loup at St. Michael,
Mud Creek, and South Loup above confluence with Mud Creek.
• Conclusion: Declining trend in gaged streamflow – trend is less severe during 1986-2011 period
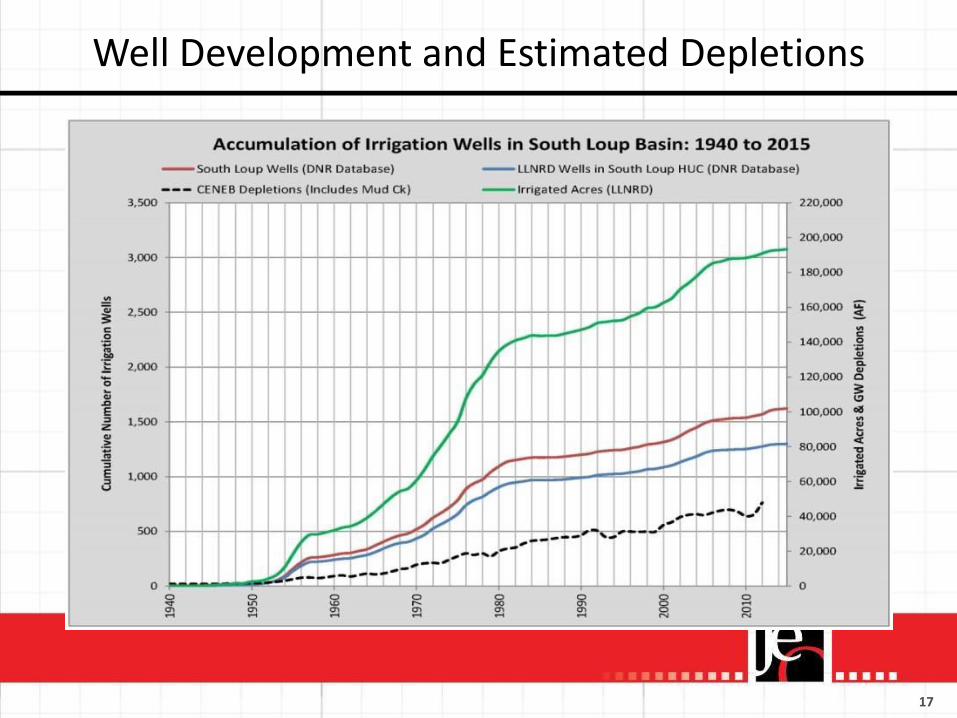
17
Well Development and Estimated Depletions

18
Hydrology Assessment Summary
• Declining trend in gaged streamflow – trend is less severe during 1986-2011 period
• Little or no trend in watershed runoff for 1986-2011 period• Mixed trends in precipitation gages; departure from long-
term averages trending to be more severe• Plateau in the groundwater depletions curve is
correlated to the limitations on new well development.
• Only 21 wells installed post-2008 under LB483;corresponding to 1,455 new irrigated acres in the South Loup watershed.
• Still seeing lag effect from depletions

19
Conjunctive Management (CM)
• Coordinated and combined use of surface water and groundwater to accomplish the following, for example:
– Increase the availability and reliability of that supply.
– Reduce groundwater declines
– Protect water quality
• Fundamental recognition of hydrologic interconnection of SW and GW – management decisions must consider both
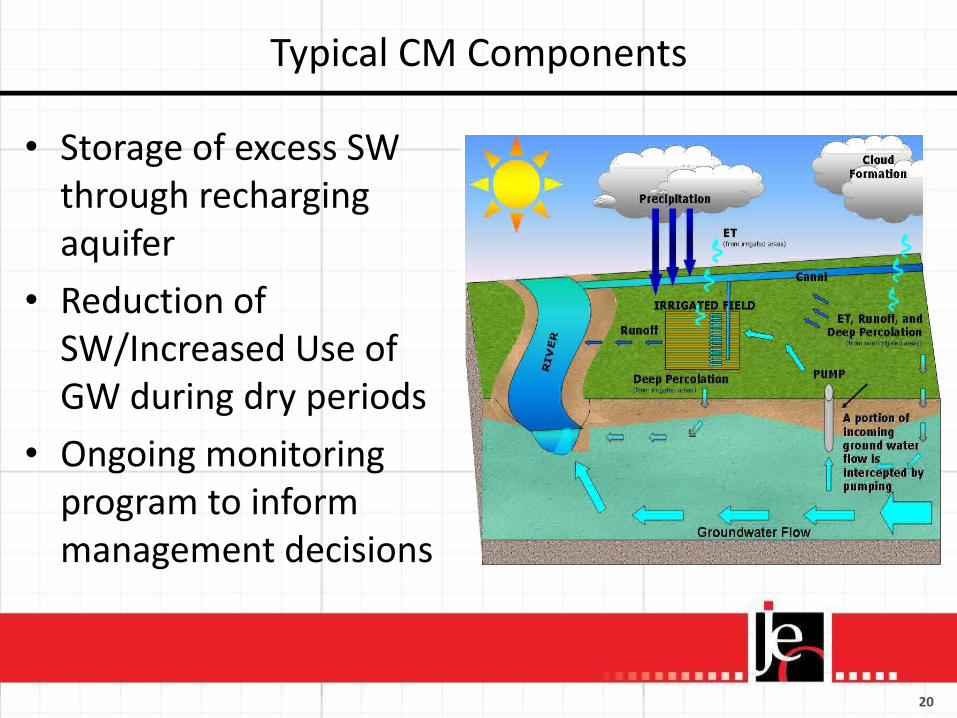
20
Typical CM Components
• Storage of excess SW through recharging aquifer
• Reduction of SW/Increased Use of GW during dry periods
• Ongoing monitoring program to inform management decisions
21
Potential CM Project Locations and Criteria
• Areas completely contained within 10/50 area (hydrologically connected)
• Areas of groundwater declines
• Areas with highest bacteria loads
• Areas in the upper half of the South Loup watershed

22
Other Siting Criteria
• Excess Flow is defined as those streamflows that are in excess of the existing surface water rights that are in priority
• CENEB shows that on average:– 88% of precipitation in the South Loup basin is lost to
evapotranspiration
– 8% is lost to deep percolation (groundwater recharge).
– On average only 4% of rainfall is available for capture as runoff.• Comparable to approximate 3% basin yield, based on runoff trend analysis
• Detention along the main stem of the South Loup River or one of its perennial tributaries would likely be more viable than runoff alone
23
On-Stream CM Opportunities
• Capture Runoff + Baseflow during non-recreation season
• Functions:– Biological/Natural treatment of bacteria
– Active storage managed to augment flows during low flow periods (quantity and quality benefits)
– Flood storage to detain/treat watershed runoff
24
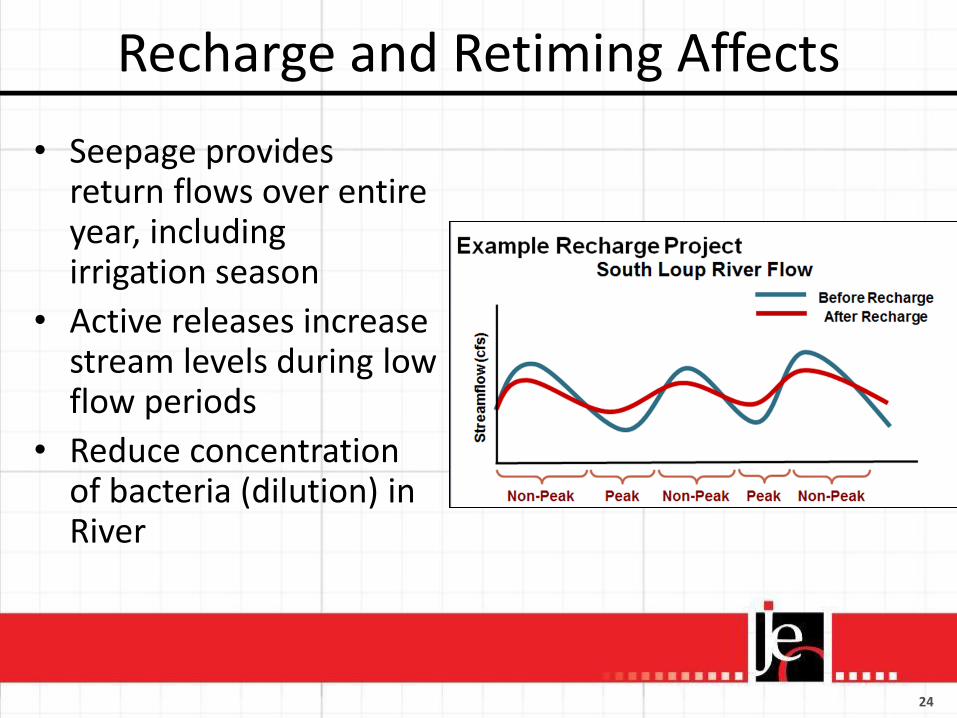
Recharge and Retiming Affects
• Seepage provides return flows over entire year, including irrigation season
• Active releases increase stream levels during low flow periods
• Reduce concentration of bacteria (dilution) in River
25
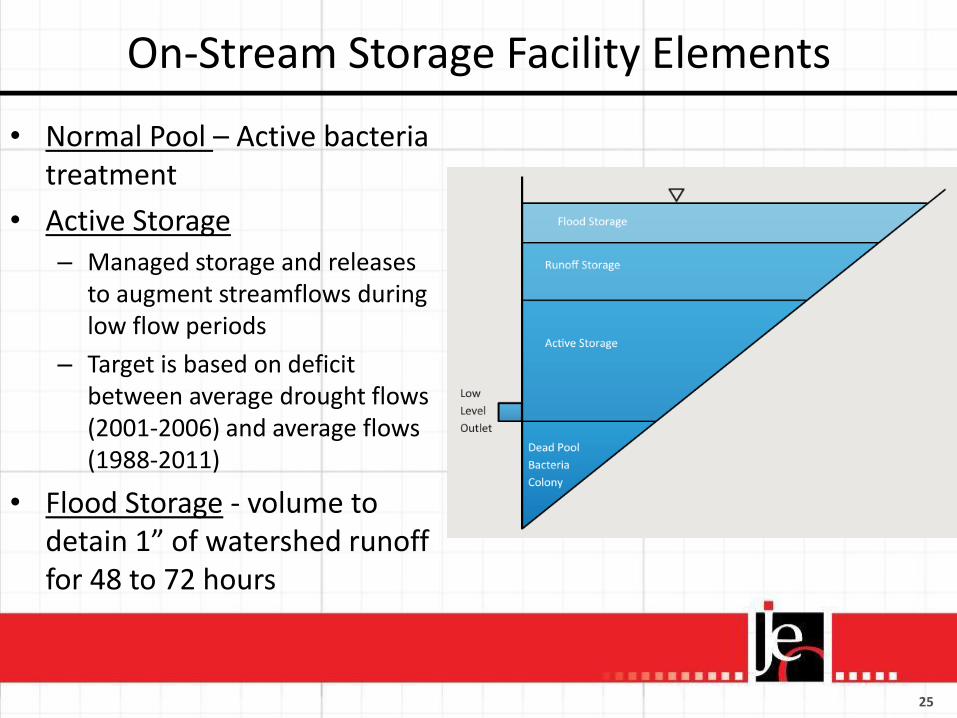
On-Stream Storage Facility Elements
• Normal Pool – Active bacteria treatment
• Active Storage – Managed storage and releases
to augment streamflows during low flow periods
– Target is based on deficit between average drought flows (2001-2006) and average flows (1988-2011)
• Flood Storage - volume to detain 1” of watershed runoff for 48 to 72 hours
26
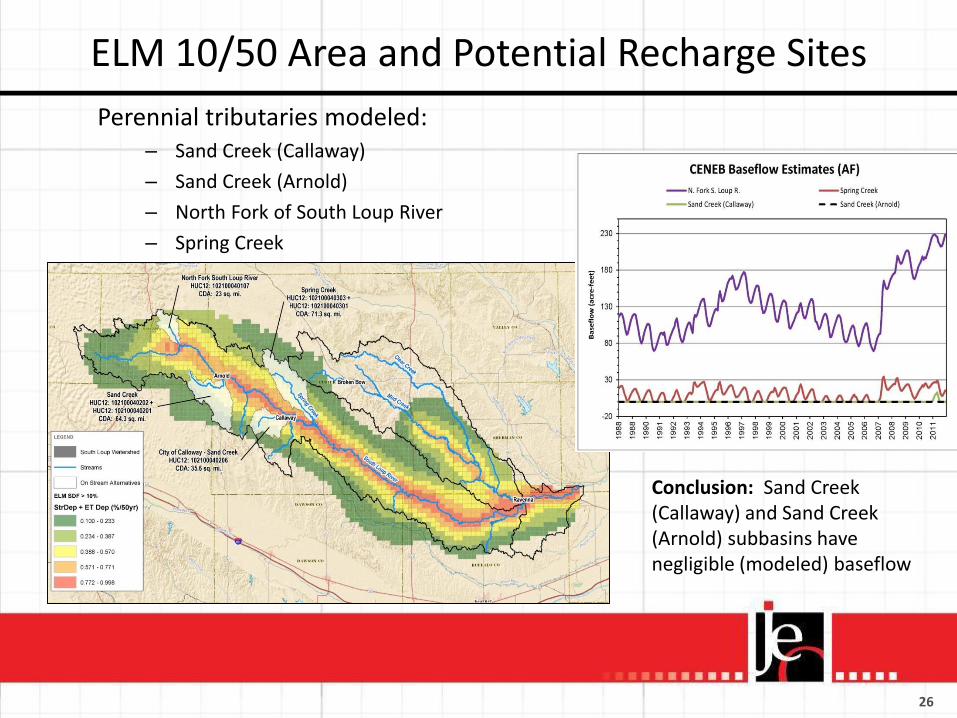
ELM 10/50 Area and Potential Recharge Sites
Perennial tributaries modeled:– Sand Creek (Callaway)
– Sand Creek (Arnold)
– North Fork of South Loup River
– Spring Creek
Conclusion: Sand Creek (Callaway) and Sand Creek (Arnold) subbasins have negligible (modeled) baseflow

27
Areas with Highest Bacteria Load

28
North Fork of South Loup River Example
• Runoff Storage: – Capture first 0.5 inches of rainfall
– Drainage Area: 23 sq. mi.
– 23 sq. mi. x 640 ac/mi x 0.5 inches x (1 ft/12 inch) = approx. 620 AF flood storage req.
• Active Storage – Deficit in average July/August/September flows
during drought is approximately 215 AF
• Normal Pool – Active bacteria colony (assume 10AF)
• Functional Storage Volume= 620 AF + 215 AF + 10 AF = 845 AF
• Flood Storage= 845 AF x 20% = 170 AF
Total storage = 1,015 AFApprox. Project Area = 80 acres*
*Area estimate based on 15-ft average depth, and increased 20% for squaring land area

29
North Fork of South Loup River Example
Conclusion• Based on modeled baseflow
estimates, the North Fork of South Loup River monthly baseflow exceeds the normal storage requirement.
• This means that the baseflow captured should make up the streamflow deficit during an average drought.
• This streamflow deficit is located at the confluence with the tributary and the South Loup River.

30
Summary• Sites on perennial streams were conceptually
developed to provide:– active storage for flow augmentation– detention storage for water quality benefits (dead pool for
bacteria treatment)
• A flow monitoring program of mainstem and tributary streamflows in the upper part of the South Loup Watershed should be initiated in order to prioritize potential project locations and feasibility.
• Data from monitoring efforts can:– confirm supply estimates – refine augmentation goals

31
Summary• Specific site locations on tributaries were not identified as
part of this conceptual effort. Considerations for future efforts in siting projects on tributaries should include:– Maximizing available water for capture– Water quality ‘hotspots’, where treatment provides most
benefit– Potential environmental impacts of project infrastructure– Connectivity of aquifer to streamflow at site location– Potential impacts to existing infrastructure– Adjacent landowner impacts – both structure/pool impacts as
well as elevated groundwater level impacts– Opportunities for additional augmentation (above benchmarks
considered in this analysis) or storage opportunities above storage requirements discussed (e.g. recreation pool)

32
Pollutants of Concern
Pollutant Common Sources Impacts
Bacteria (E. coli)• Livestock manure• Septic systems• Wildlife
• Human health risks
Nutrients
• Fertilizers• Livestock manure
Soil erosion• Septic systems
• Human health, (blue baby syndrome)
• Water treatment costs• Excess algae growth• Aquatic life impacts
Sediment• Soil Erosion• Stream Erosion
• Fills reservoirs• Aquatic habitat• Pollutant attached• Increases turbidity
33
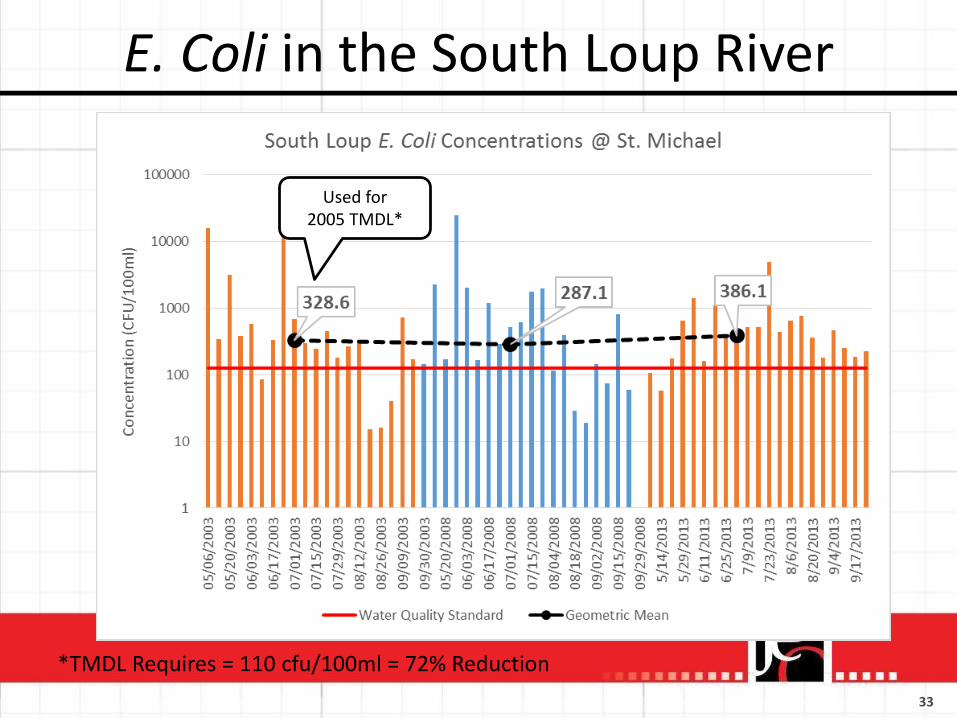
E. Coli in the South Loup River
Used for 2005 TMDL*
*TMDL Requires = 110 cfu/100ml = 72% Reduction

34
E. Coli Sources
Land Use Loading Rate Concentration
Developed 0.67 billion CFU/acre 480 CFU/100mL
Farmland 0.58 billion CFU/acre 240 CFU/100mL
Grazing/Natural Land 0.30 billion CFU/acre 960 CFU/100mL
Manure Application Sites 7.82 billion CFU/acre 1250 CFU/100mL
Exempt Livestock 17.25 billion CFU/AU 17.25 billion CFU/AU
Water Quality Model was developed

35
Stream Assessment
• Document severely degraded reaches of the South Loup River
• Bed and Bank Erosion can be a major source of sediment (and nutrients)
• Can threaten bridges and other infrastructure
• Aquatic/Riparian habitat changes
• Conducted a Visual Assessment
Streams are dynamic in nature and must be looked at as a system that is balancing:• Water transport• Sediment transport

36
South Loup Examples
Overall the Incision Discovered in the South Loup River was MinorWorst Examples were in Smaller Intermittent Tributaries (which is expected)
37
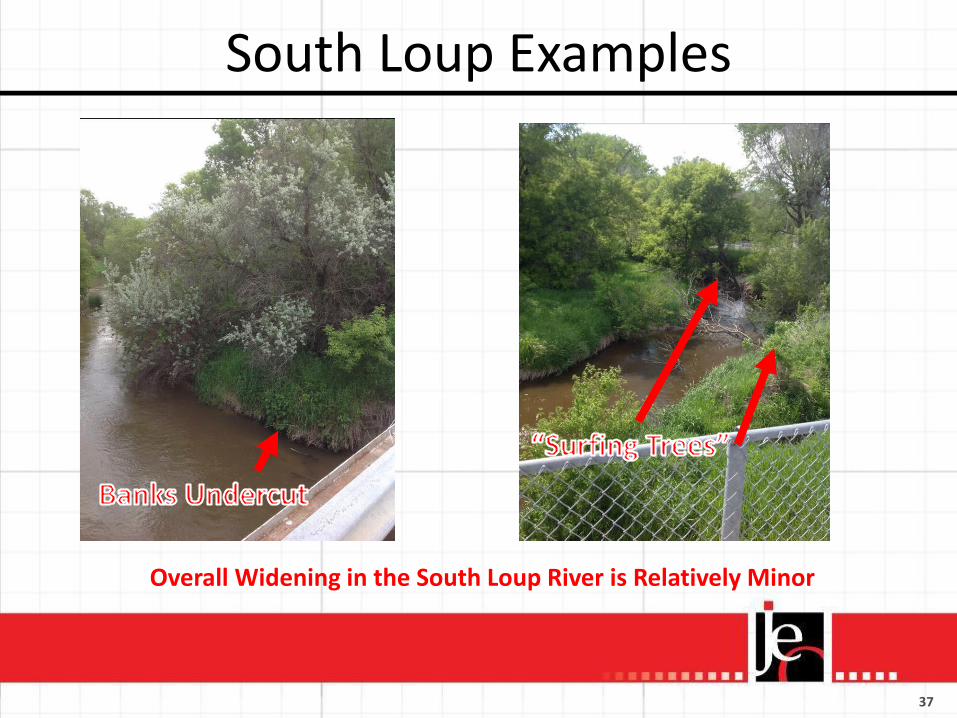
South Loup Examples
Overall Widening in the South Loup River is Relatively Minor

38
Stream Assessment ResultsSTAGE
LENGTH (Miles)
PERCENTAGE
I - Pre-Disturbance 67.7 26%
II - Disturbance 9.5 4%
III - Incision 43.2 16%
IV - Widening 78.7 30%
V - Deposition 54.6 21%
VI - Recovery 10.0 4%
TOTAL 263.6 100%
• 46% of the South Loup River is Incising or Widening.
• The Severity of this is mild, except in small intermittent tributaries
• Streams are dynamic in nature, so much of these findings are not concerning A Lot of the River Looks Healthy!
39
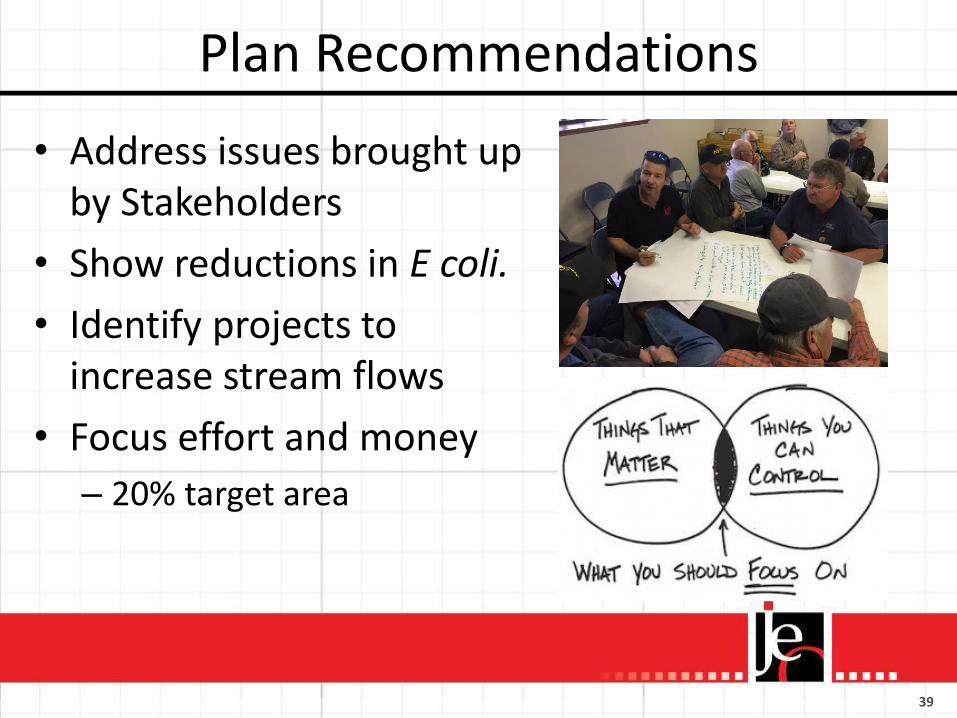
Plan Recommendations
• Address issues brought up by Stakeholders
• Show reductions in E coli.
• Identify projects to increase stream flows
• Focus effort and money
– 20% target area

40
Pollutant Source Targeting

41
Pollutant Source Targeting
42
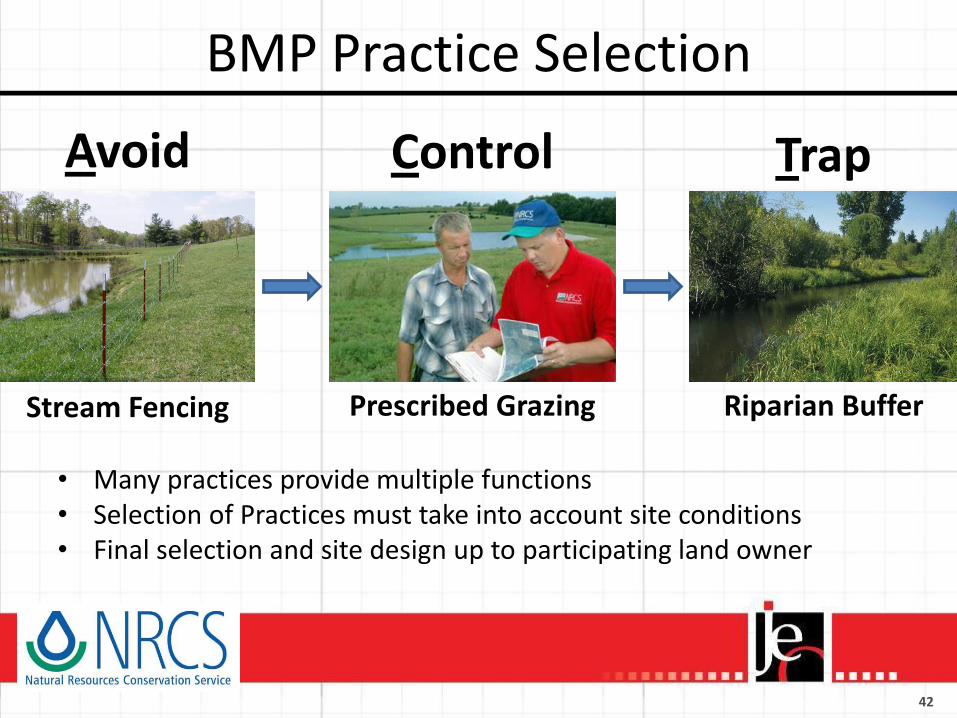
BMP Practice Selection
• Many practices provide multiple functions• Selection of Practices must take into account site conditions• Final selection and site design up to participating land owner
TrapAvoid Control
Stream Fencing Prescribed Grazing Riparian Buffer

43
BMP Practice SelectionBMP Avoid Control Trap
Education & Outreach X
On-site Wastewater System Upgrade X
Pet Waste Ordinance X
Nutrient Management X X
Exempt AFO Facility Management X
Grazing Management (Prescribed) X X
Cover Crops X X
Irrigation Water Management X X
Stream Buffers X X X
No Till X X
Filter Strips X X
Alternative Livestock Water Sources & Livestock/Stream Fencing X
Wet Retention Ponds/ Constructed Wetlands X X
Stream Restoration X
• Selected based on survey results and known effectiveness• Others will be eligible – these were used for modeling purposes

44
Costs Estimates
28 – Year Implementation
Timeframe*Assume approx$1 million/year*
Excluding CM
Management Practice Unit Cost/UnitNumber
of UnitsTotal
Ongoing Information and Education year $10,000 28 $280,000
OSWT Inspections and Retrofits each $5,500 115 $632,500
Pet Waste Ordinance Development each $10,000 6 $60,000
Nutrient Management acre $28 29,451 $824,628
Exempt AFO Facility Management each $20,000 295 $5,900,000
Prescribed Grazing Management acre $10 80,016 $800,160
Cover Crops acre $80 20,356 $1,628,480
Irrigation Water Management acre $14 34,648 $485,072
Stream Buffer mile $1,300 6 $7,800
No-Till Farming acre $10 6,930 $69,300
Filter Strips acre $455 1,260 $573,300
Alternative Livestock Watering Sources each $1,000 406 $406,000
Riparian Fencing mile $10,560 62 $654,720
Wet Retention Ponds/ Constructed Wetlands each $100,000 12 $1,200,000
Stream Restoration mile $125,000 110 $13,750,000
Conjunctive Management Projects each $4,000,000 2 $8,000,000
Updates to the Watershed Plan each $75,000 5 $375,000
Additional Monitoring year $10,000 30 $300,000
$35,946,960Total
45
Funding Sources
Potential Funding Sources
• NRCS Programs (EQIP, CRP, RCCP etc)
• NDEQ/EPA 319 Program
• NE Environmental Trust (NET)
• Existing Funding from NRDs
• Water Sustainability Funds
• Towns and/or Counties
• Landowners (cost share)

46
Landowner Outreach
• Other needs besides cost-share
• 63% of survey respondents indicated they would be interested in education or technical assistance
• Focused outreach to target areas and target audiences
• Ongoing outreach will be important to success

47
Measuring Success
• Additional stream monitoring recommendations
• Plan review every 5 years
• Review BMPs implemented vs Goals and Milestones
• Adaptive Management

48
Next Steps
• Input from Public – please fill out a comment card and talk to someone tonight
• Finalize Plan
• Send to NDEQ/EPA for Approval in June
• Begin working with landowners on Implementing BMPs

49
Vision for South Loup Watershed
The South Loup River Watershed will be locallymanaged to restore or maintain the quality,diverse uses, and ecosystem services of thestreams, lakes, wetlands, groundwater, andother water resources within the Watershed forcurrent and future generations using voluntary,economical, and environmentally friendlymethods.

50
Questions?
Thank you!