south placer municipal utility district 5...
TRANSCRIPT
Herb Niederberger
General Manager
May 2017
SOUTH PLACER MUNICIPAL UTILITY DISTRICT 5-YEAR FINANCIAL PLAN AND COST OF SERVICE STUDY
FISCAL YEARS 2017/18 – 2021/22

i
This Page Intentionally Blank

1
SOUTH PLACER MUNICIPAL UTILITY DISTRICT 5-YEAR FINANCIAL PLAN AND COST OF SERVICE STUDY
FISCAL YEARS 2017/18 – 2021/22
Table of Contents Section 1 –Introduction and Purpose .............................................................................................. 3
A. Introduction .......................................................................................................................... 3 B. Purpose of Study .................................................................................................................. 3 C. Basis of Charge/Cost of Service .......................................................................................... 5 D. Growth ................................................................................................................................. 5
Figure 1.1 - SPMUD Annual EDUs Added FY 1982/83 through FY2015/16 ....................... 6 Table 1.1 - Historical EDU Count ........................................................................................... 6 Figure 1.2 - Historical and Projected EDU Count ................................................................... 7
Section 2: Funding Goals ........................................................................................................... 8 A. CalPERS .............................................................................................................................. 8
Table 2.1 - CalPERS Normal Cost and Required Unfunded Accrued Liability (UAL) Payments .................................................................................................................................. 9 Table 2.2 - CalPERS Actuarial Valuation Amortization Summary ...................................... 10
B. OPEB ................................................................................................................................. 10 Table 2.3 - Assessment of OPEB Accrued Liabilities .......................................................... 11
C. Reserve Balances ............................................................................................................... 12 Table 2.4 - General Fund Reserve Requirements .................................................................. 12
D. Debt Coverage Ratio .......................................................................................................... 13 E. Capital Improvement Plan ................................................................................................. 13
Table 2.5 - Capital Outlay Summary ..................................................................................... 14 Section 3 - Revenue ...................................................................................................................... 15
A. General Fund (Operating) Revenues ................................................................................. 15 B. Capital Fund (Non-Operating) Revenues .......................................................................... 15
Table 3.1 - SPMUD Historical Revenue ............................................................................... 15 Table 3.2 - Historical SPMUD Monthly Service Charge (Rates) and Fees .......................... 15 Figure 3.1 - SPMUD Historical and Projected Revues @ $28/EDU/Month ........................ 16
Section 4 – Expenses .................................................................................................................... 17 A. Salary and Benefits ............................................................................................................ 17
Figure 4.1 - Salary and Benefits Breakout, FY 2016/17 Budget of $3.488 Million ............. 17 Figure 4.2 - Historical and Projected SPMUD Salary and Benefits ...................................... 18
B. Local SPMUD Operating and Maintenance Expenses ...................................................... 18 Figure 4.3 - SPMUD Historical and Projected O&M Expenses ........................................... 19
C. Regional Wastewater Treatment Plant (RWWTP) Expenses ............................................ 20 Table 4.1 - SPWA Costs ........................................................................................................ 20 Figure 4.4 - SPWA Historical and Projected Costs ............................................................... 21 Table 4.2 - SPWA 5-Year Regional Facilities Rehab Plan ................................................... 21
D. Depreciation Expense ........................................................................................................ 21 Table 4.3 - Depreciation ........................................................................................................ 22
2
Figure 4.5 - Historical and Projected Depreciation Costs ..................................................... 22 E. Expenses summary............................................................................................................. 22
Figure 4-6 - SPMUD Annual Expenses FY 2016/17 ............................................................ 23 Figure 4.7 Historical and Projected General Fund Expenditures 20 Section 5 - Fund Balances............................................................................................................. 24
A. Fund Balance Breakdowns ................................................................................................ 24 Table 5.1 - Fund Balance Breakdowns .................................................................................. 25
Section 6: Conclusions and Recommendations ....................................................................... 26 A. Conclusions ........................................................................................................................ 26
Figure 6.1 - SPMUD General Fund Revenue Vs Expenses, FY 09/10 - FY21/22 @ Current Rates ...................................................................................................................................... 26
B. Recommendations .............................................................................................................. 26 Table 6.1 - SPMUD Implementation Schedule of Monthly Service Charges ....................... 27 Figure 6.2 - Monthly Sewer Rates (Collection and Treatment) Among Placer County Sewer Service Providers ................................................................................................................... 28 Figure 6.3 - Monthly Sewer Rates (Collection and Treatment) In Sacramento Metropolitan
Area ....................................................................................................................................... 28
APPENDICES
Appendix A - Equivalent Dwelling Unit Determination by Land Use and Customer Type .... i
Appendix B - CalPERS Actuarial Valuation and Amortization Schedules ........................... iii
Appendix C – SPMUD Revenue and Expense Model FY 2017/18 – 2021/22 ...................... vi
Appendix D - Capital Investment Plan FY 2017/18 through FY 2021/22 ........................... viii
Appendix E -Nessie Depreciation Curves…………………………………………………ix
3
SOUTH PLACER MUNICIPAL UTILITY DISTRICT 5-YEAR FINANCIAL PLAN AND COST OF SERVICE STUDY
FISCAL YEARS 2017/18 – 2021/22 Section 1 –Introduction and Purpose A. Introduction The Rocklin-Loomis Municipal Utility District was created under the Municipal Utility District Act of the State of California (the “MUD Act”), in 1956 to provide sanitary sewer service to the City of Rocklin and Town of Loomis. In the 1980’s, the name was changed to the South Placer Municipal Utility District (“SPMUD or District”) to reflect its larger service area which includes unincorporated portions of Placer County. The District is divided into five wards and governed by an elected five member Board of Directors. The Board establishes policy and oversees the General Manager, who manages the day-to-day operations of the District. Over the years, the District has grown from 7 to 31 square miles as the City of Rocklin and Town of Loomis expanded their boundaries, and by annexing several unincorporated areas (Penryn and Newcastle to the north, and Rogersdale in the Granite Bay area). Rocklin makes up 88% of the District’s customers, Loomis has 9%, and 3% reside in unincorporated Placer County. The District provides service to 21,658 customers (80% residential and 20% commercial); this equates to 31,834 Equivalent Dwelling Units (EDU) or an equivalent population of about 75,000 people. District customers discharge an average sewer flow of about five million gallons per day. The District collects the sewage and transports this via 266.9 miles of District- owned and operated sewer mains (from 4” to 42” in diameter). Other assets include our Headquarters, Maintenance and Corporation Yard facilities, 6083 manholes, 13 lift stations, 12 metering sites, and related buildings, facilities and equipment. SPMUD’s customer base has tripled since 1990. In the 1970s’s the District decommissioned its sewage treatment facilities and began using the City of Roseville (“City”) Dry Creek Wastewater Treatment Plant (“DCWWTP”). In 2000, the District, the City of Roseville and Placer County (“PC”) created the South Placer Wastewater Authority (“SPWA”) to finance the construction of the Pleasant Grove Wastewater Treatment Plant (“PG WWTP”). The District is organized into three departments, Field Services, Technical Services and Administrative Services. In general, all operation and maintenance functions are performed by Field Services staff; all engineering, development improvements, construction activity and inspections are overseen by Technical Services staff; and, all office, billing, accounting, customer service, financial and administrative functions are performed by Administrative Service staff. District Audit and Legal Services are performed under contract. At the time of this writing, the District maintains 32 total positions with plans to add two more during the next year. B. Purpose of Study The top priority of the District is to provide a level of service that meets state and federal
4
regulatory requirements, and the demands and expectations of its customers. The long-term goal of the 5-year Financial Plan is to develop a utility system that is stable, requiring limited increases in the cost of services, minimizing those increases that are required, and provide sufficient revenues to cover necessary operations and maintenance programs, capital investment and reserves to meet the utility’s stated needs. Because the District’s customers bear the ultimate cost of service, there exists a need to have a financial plan that will permit the utility to meet its priorities at an affordable and stable cost for the long-term. To this end, the District operates under the Municipal Utility District Act and is set up as an enterprise fund to operate very much like a business. Sewer customers are not subsidized by the General Fund taxpayers of any local government and must be individually self-sustaining. As an enterprise, the utility must derive its own revenues and use those revenues to fund operations, capital, debt and reserves to meet customer and regulatory demands as well as the need for capital funding to pay for new infrastructure, system expansions, renewal and replacement of existing facilities, as well as to meet increasingly stringent environmental regulations and compliance requirements. The District last raised its rates in 2012. Since that time, the District has implemented two major changes to its financial systems. In 2014, the District converted to the Tyler Financial Management Software consisting of a financial/utility billing database program. In 2015, the District segregated its capital fund accounting into separate capital funds for General Fund Capital projects, Capital Improvement and Enlargement projects and Capital Replacement and Rehabilitation projects. It has been determined that the current monthly service charge no longer provides sufficient revenues to cover necessary operations and maintenance programs, capital investment and reserves to meet the utility’s stated needs. The substantive requirements of Article XIII of the California State Constitution (Prop 218) require the District to comply with the following conditions:
1) Revenues derived from the fee or charge shall not exceed the funds required to provide the property related service. 2) Revenues derived from the fee or charge shall not be used for any purpose other than that for which the fee or charge was imposed. 3) The amount of a fee or charge imposed upon any parcel or person as an incident of property ownership shall not exceed the proportional cost of the service attributable to the parcel. 4) No fee or charge may be imposed for a service unless that service is actually used by, or immediately available to, the owner of the property in question. 5) No fee or charge may be imposed for general governmental services, such as police or fire services, where the service is available to the public at large in substantially the same manner as it is to property owners.
The rates proposed in the study meet the requirements of Prop 218 and were developed in a manner consistent with industry standards.
5
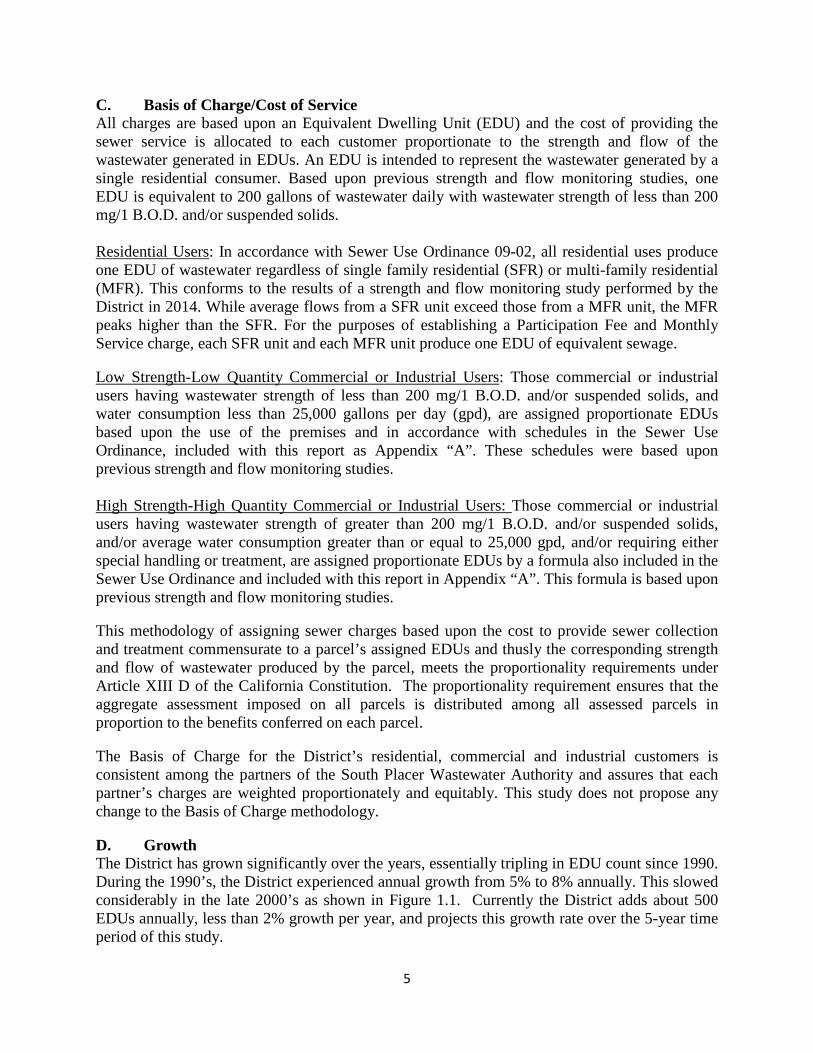
C. Basis of Charge/Cost of Service All charges are based upon an Equivalent Dwelling Unit (EDU) and the cost of providing the sewer service is allocated to each customer proportionate to the strength and flow of the wastewater generated in EDUs. An EDU is intended to represent the wastewater generated by a single residential consumer. Based upon previous strength and flow monitoring studies, one EDU is equivalent to 200 gallons of wastewater daily with wastewater strength of less than 200 mg/1 B.O.D. and/or suspended solids. Residential Users: In accordance with Sewer Use Ordinance 09-02, all residential uses produce one EDU of wastewater regardless of single family residential (SFR) or multi-family residential (MFR). This conforms to the results of a strength and flow monitoring study performed by the District in 2014. While average flows from a SFR unit exceed those from a MFR unit, the MFR peaks higher than the SFR. For the purposes of establishing a Participation Fee and Monthly Service charge, each SFR unit and each MFR unit produce one EDU of equivalent sewage. Low Strength-Low Quantity Commercial or Industrial Users: Those commercial or industrial users having wastewater strength of less than 200 mg/1 B.O.D. and/or suspended solids, and water consumption less than 25,000 gallons per day (gpd), are assigned proportionate EDUs based upon the use of the premises and in accordance with schedules in the Sewer Use Ordinance, included with this report as Appendix “A”. These schedules were based upon previous strength and flow monitoring studies. High Strength-High Quantity Commercial or Industrial Users: Those commercial or industrial users having wastewater strength of greater than 200 mg/1 B.O.D. and/or suspended solids, and/or average water consumption greater than or equal to 25,000 gpd, and/or requiring either special handling or treatment, are assigned proportionate EDUs by a formula also included in the Sewer Use Ordinance and included with this report in Appendix “A”. This formula is based upon previous strength and flow monitoring studies. This methodology of assigning sewer charges based upon the cost to provide sewer collection and treatment commensurate to a parcel’s assigned EDUs and thusly the corresponding strength and flow of wastewater produced by the parcel, meets the proportionality requirements under Article XIII D of the California Constitution. The proportionality requirement ensures that the aggregate assessment imposed on all parcels is distributed among all assessed parcels in proportion to the benefits conferred on each parcel. The Basis of Charge for the District’s residential, commercial and industrial customers is consistent among the partners of the South Placer Wastewater Authority and assures that each partner’s charges are weighted proportionately and equitably. This study does not propose any change to the Basis of Charge methodology. D. Growth The District has grown significantly over the years, essentially tripling in EDU count since 1990. During the 1990’s, the District experienced annual growth from 5% to 8% annually. This slowed considerably in the late 2000’s as shown in Figure 1.1. Currently the District adds about 500 EDUs annually, less than 2% growth per year, and projects this growth rate over the 5-year time period of this study.
6
Figure 1.1 - SPMUD Annual EDUs Added FY 1982/83 through FY2015/16
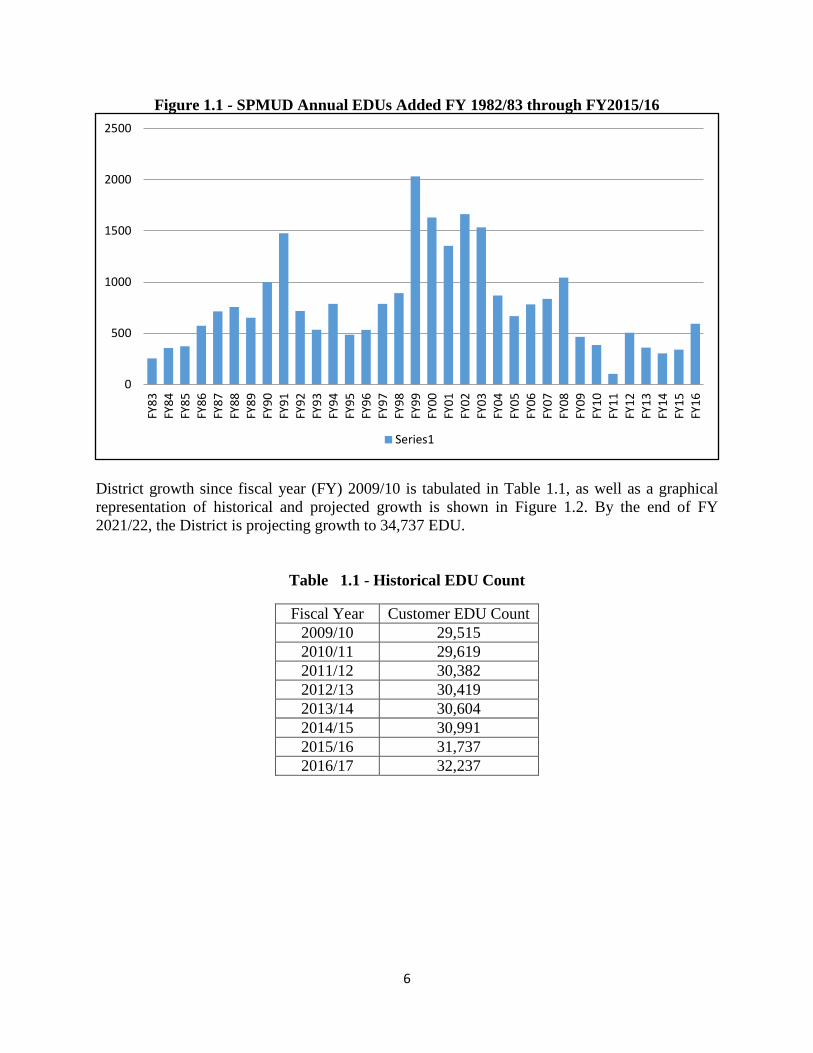
District growth since fiscal year (FY) 2009/10 is tabulated in Table 1.1, as well as a graphical representation of historical and projected growth is shown in Figure 1.2. By the end of FY 2021/22, the District is projecting growth to 34,737 EDU.
Table 1.1 - Historical EDU Count
0
500
1000
1500
2000
2500
FY83
FY84
FY85
FY86
FY87
FY88
FY89
FY90
FY91
FY92
FY93
FY94
FY95
FY96
FY97
FY98
FY99
FY00
FY01
FY02
FY03
FY04
FY05
FY06
FY07
FY08
FY09
FY10
FY11
FY12
FY13
FY14
FY15
FY16
Series1
Fiscal Year Customer EDU Count 2009/10 29,515 2010/11 29,619 2011/12 30,382 2012/13 30,419 2013/14 30,604 2014/15 30,991 2015/16 31,737 2016/17 32,237

7
Figure 1.2 - Historical and Projected EDU Count

8
Section 2: Funding Goals The long-term goal of the 5-year Financial Plan is to develop a utility system that is stable, requiring limited increases in the cost of services, minimizing those increases that are required, and provide sufficient revenues to cover necessary operations and maintenance programs, as well as capital investment and reserves to meet the utility’s stated needs. In addition to these general needs, the District has determined five specific funding goals to be accomplished during the 5-year Financial Plan. These include:
A. Fully funding the District’s obligations to CalPERS B. Fully funding the District’s annual required contribution (ARC) for Other Post-
Employment Benefits (OPEB) C. Maintaining minimum reserve fund balances D. Meeting the Debt Coverage Ratio mandated by the South Placer Wastewater Authority
(SPWA) debt indenture E. Providing adequate funding for Capital Investments
A. CalPERS The District's defined benefit pension plan, the California Public Employees' Retirement System, provides retirement and disability benefits, annual cost of living adjustments, and death benefits to plan members and beneficiaries. The California Public Employees' Retirement System is an agency in California managing pension and health benefits for more than 1.6 million California public, employees, retirees and their families. , CalPERS acts as a common investment and administrative agent for participating public employers within the state of California menu of benefit provisions as well as other requirements are established by State statutes within the Public Employees’ Retirement Law. The District selects optional benefit provisions from the benefit menu by contract with CalPERS and adopts those benefits through local ordinance (other local methods). The District Board of Directors desires to fully fund its obligations to CalPERS. These obligations are calculated in accordance with a historical discount rate experienced by CalPERS over previous years. This discount rate was used to determine not only current payouts for CalPERS but also future pension plan payouts. However, the downturn in the economy has resulted in huge losses and an underfunded liability within the CalPERS portfolio. The discount rate used to measure the total pension liability was 7.50 percent. To determine whether the municipal bond rate should be used in the calculation of a discount rate for each plan, CalPERS stress tested plans that would most likely result in a discount rate that would be different from the actuarially assumed discount rate. Based on the testing, none of the tested plans run out of assets. Therefore, the current 7.50 percent discount rate is adequate and the use of the municipal bond rate calculation is not necessary. The long term expected discount rate of 7.50 percent is applied to all plans in the Public Employees Retirement Fund. The stress test results are presented in a detailed report called “GASB Crossover Testing Report” that can be obtained at CalPERS’ website under the GASB 68 section.
9
CalPERS has released plans that will reduce the discount rate for local agencies from 7.5 percent to 7.375 percent in fiscal year 2018-19, 7.25 percent in 2019-20, and down to 7.0 percent in 2020-21. The long term plan calls for CalPERS to continually lower the discount rate to 6.5% over the next 20 years. The benefits of reducing the discount rate include:
• Strengthening long-term sustainability of the fund • Reducing negative cash flows; additional contributions will help to offset the cost to
pay pensions • Reducing the long-term probability of funded ratios falling below undesirable levels • Improving the likelihood of CalPERS investments earning the assumed rate of return • Reducing the risk of contribution increases in the future from volatile investment
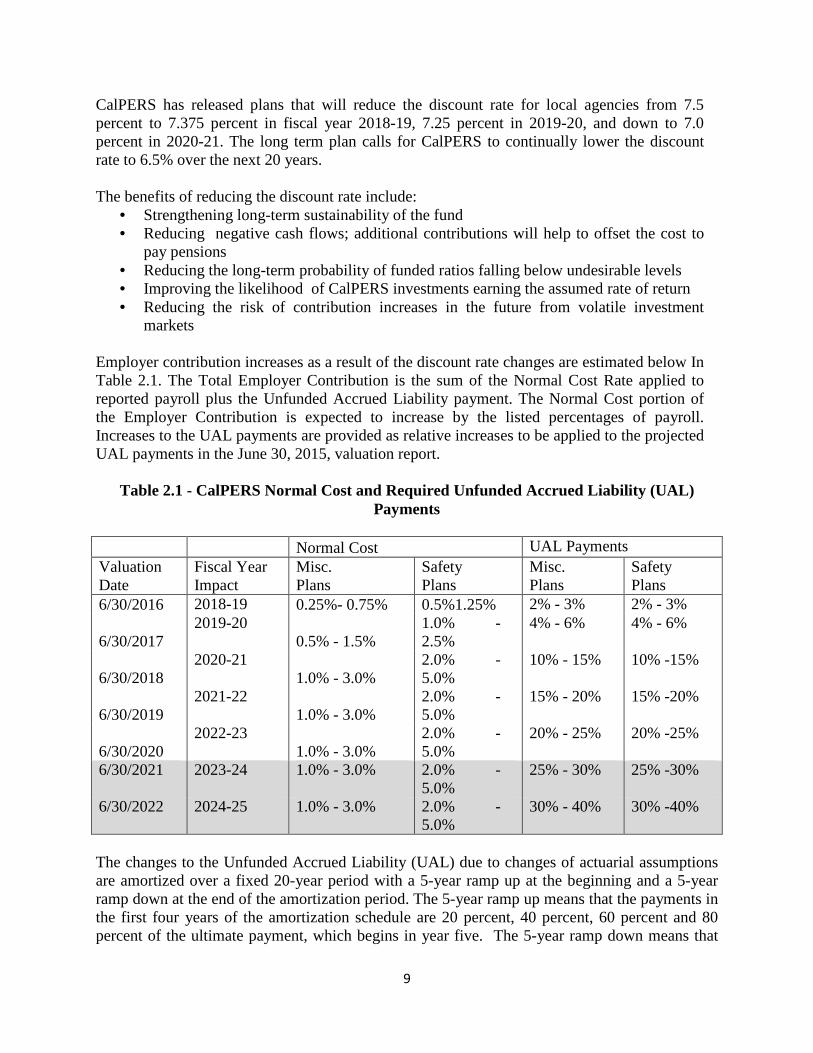
markets Employer contribution increases as a result of the discount rate changes are estimated below In Table 2.1. The Total Employer Contribution is the sum of the Normal Cost Rate applied to reported payroll plus the Unfunded Accrued Liability payment. The Normal Cost portion of the Employer Contribution is expected to increase by the listed percentages of payroll. Increases to the UAL payments are provided as relative increases to be applied to the projected UAL payments in the June 30, 2015, valuation report.
Table 2.1 - CalPERS Normal Cost and Required Unfunded Accrued Liability (UAL) Payments
Normal Cost UAL Payments Valuation Date
Fiscal Year Impact
Misc. Plans
Safety Plans
Misc. Plans
Safety Plans
6/30/2016 2018-19 0.25%- 0.75% 0.5%1.25% 2% - 3% 2% - 3%
6/30/2017 2019-20
0.5% - 1.5% 1.0% - 2.5%
4% - 6% 4% - 6%
6/30/2018 2020-21
1.0% - 3.0% 2.0% - 5.0%
10% - 15% 10% -15%
6/30/2019 2021-22
1.0% - 3.0% 2.0% - 5.0%
15% - 20% 15% -20%
6/30/2020 2022-23
1.0% - 3.0% 2.0% - 5.0%
20% - 25% 20% -25%
6/30/2021 2023-24 1.0% - 3.0% 2.0% - 5.0%
25% - 30% 25% -30%
6/30/2022 2024-25 1.0% - 3.0% 2.0% - 5.0%
30% - 40% 30% -40%
The changes to the Unfunded Accrued Liability (UAL) due to changes of actuarial assumptions are amortized over a fixed 20-year period with a 5-year ramp up at the beginning and a 5-year ramp down at the end of the amortization period. The 5-year ramp up means that the payments in the first four years of the amortization schedule are 20 percent, 40 percent, 60 percent and 80 percent of the ultimate payment, which begins in year five. The 5-year ramp down means that

10
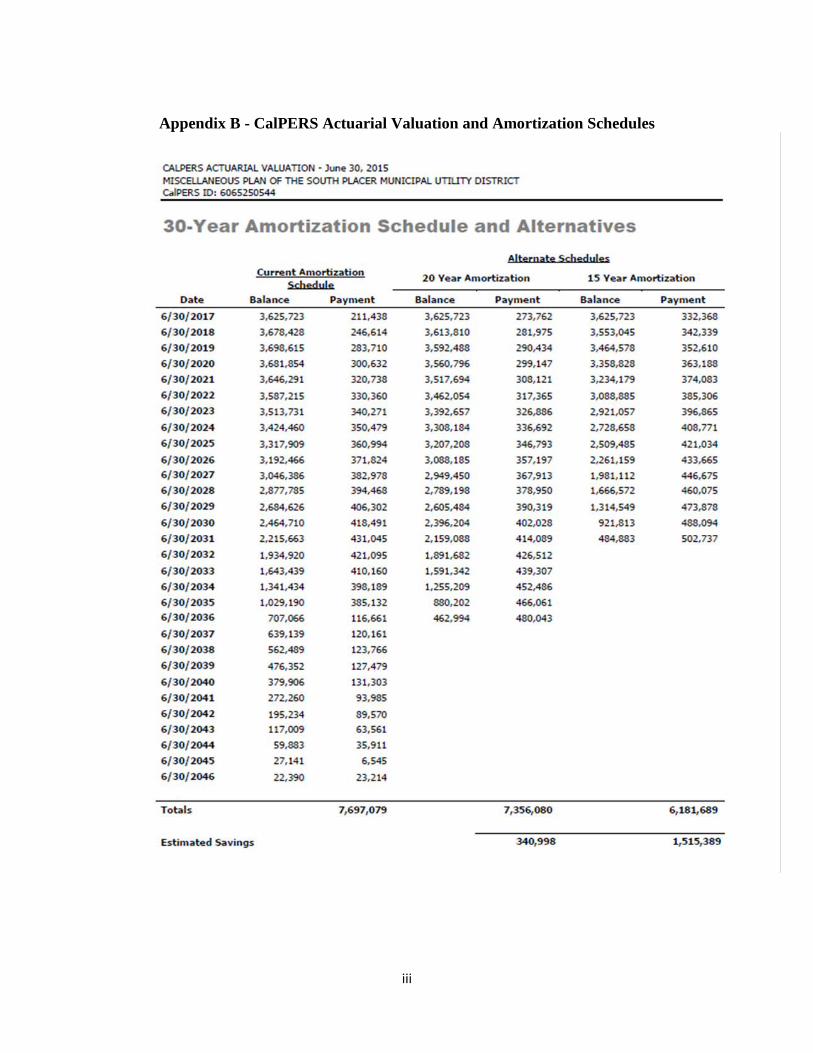
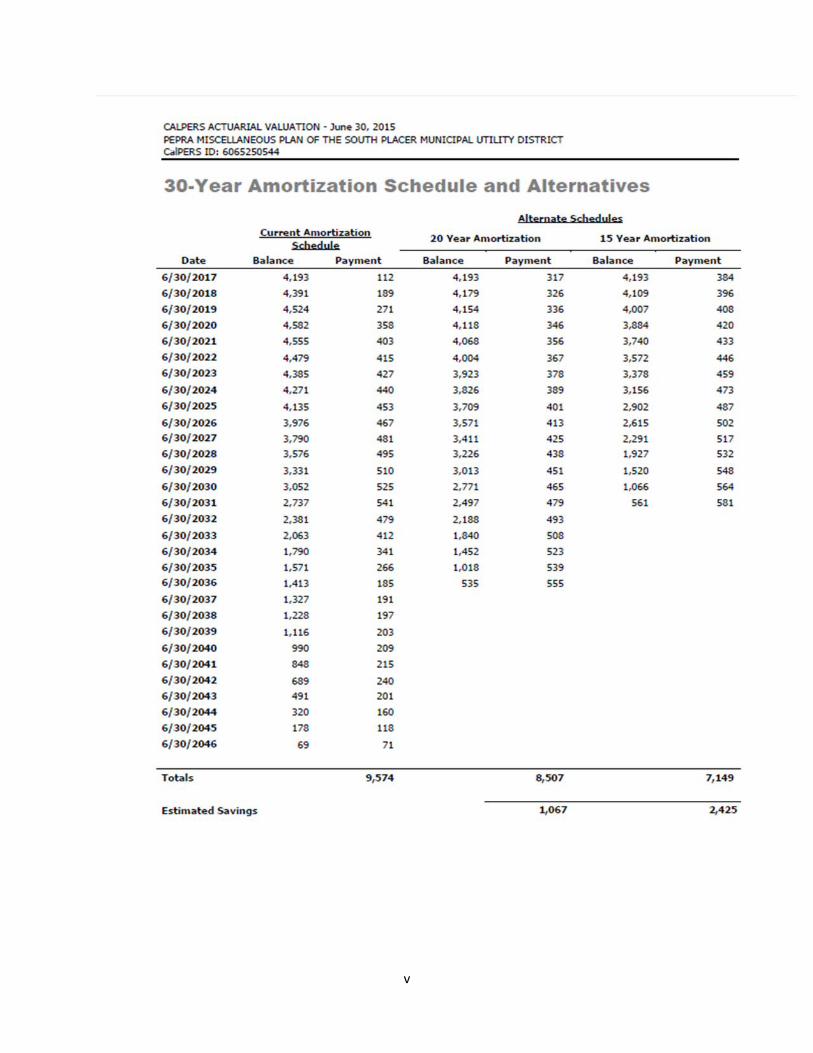
the reverse is true and the payments in the final four years are ramped down by the above percentages. A new ramp is established with each change to the discount rate. There will be three ramps established in the first three years. As a result of the 5-year ramp up and effective date of the increase, it will be seven years until the full impact of the discount rate change is completely realized. The CalPERS amortization schedules to repay the UAL are included as Appendix “B” and summarized below in Table 2.2. The Board of Directors has elected to pay the UAL over 20 years.
Table 2.2 - CalPERS Actuarial Valuation Amortization Summary Year 30 -Year
Tier 1 Tier 2 Tier 3 Total 2016/17 $ 211,438 $ 107 $ 112 $ 211,657 2017/18 $ 246,614 $ 189 $ 246,803 2018/19 $ 283,710 $ 271 $ 283,981 2019/20 $ 300,632 $ 358 $ 300,990 2020/21 $ 320,738 $ 403 $ 321,141 2021/22 $ 330,360 $ 415 $ 330,775
Total $ 1,693,492 $ 107 $ 1,748 $ 1,695,347 Year 20-Year
Tier 1 Tier 2 Tier 3 Total 2016/17 $ 273,762 $ 314 $ 274,076 2017/18 $ 281,975 $ 326 $ 282,301 2018/19 $ 290,434 $ 336 $ 290,770 2019/20 $ 299,147 $ 346 $ 299,493 2020/21 $ 308,121 $ 356 $ 308,477 2021/22 $ 317,365 $ 367 $ 317,732
Total $ 1,770,804 $ - $ 2,045 $ 1,772,849 Year 15-Year
Tier 1 Tier 2 Tier 3 Total 2016/17 $ 332,368 $ 384 $ 332,752 2017/18 $ 342,339 $ 396 $ 342,735 2018/19 $ 352,610 $ 408 $ 353,018 2019/20 $ 363,188 $ 420 $ 363,608 2020/21 $ 374,038 $ 433 $ 374,471 2021/22 $ 385,306 $ 446 $ 385,752
Total $ 2,149,849 $ - $ 2,487 $ 2,152,336
It may be prudent to immediately pay the UAL for Tier 2 and 3 employees and to accelerate payment of the UAL for Tier 1 employees. Immediate payment of the UAL for Tier 1 could result in a savings of $3.7M over the 20-year repayment. B. OPEB Other Post-Employment Benefits (OPEB): South Placer Municipal Utility District's Post-Retirement Healthcare Plan is a single employer defined benefit healthcare plan administered by

11
CalPERS. CalPERS provide medical insurance benefits and life insurance benefits to eligible retirees and their eligible dependents. The District approved post-retirement health insurance benefits for all of its employees effective July 1, 2007 under the Public Employees' Medical and Hospital Care Act (PEMHCA). Retirement eligibility is determined based on a minimum of reaching age 50 with at least 5 years of employment with the District. For an employee retiring with 5 or more years of service with SPMUD, the District will contribute the health benefit cost for the retiree and family members up to 100% of the greater of the CalPERS family rate for Kaiser. A retiree with less than 5 complete years of service with the District receives no benefit, unless they have previous employment qualifying them for CalPERS retirement, in which case they are eligible to receive the CalPERS minimum at the time of retirement. The CalPERS minimum is set by law. The retiree is on the same medical plan as the District's active employees, however monthly rates for coverage of covered active and retired employees are computed separately. The contribution requirement of the District to contribute to the plan is established and may be amended by the Board. Currently, employees are not required to contribute to the plan. The District's contributions are calculated on a pre funding basis using entry age normal cost, with investment gains and losses amortized over the remaining 24 year period with payments determined on a level percent of pay basis. The District has prefunded the actuarial accrued liability (AAL) based on a calculation of the annual required contribution certified by an actuarial valuation service. The District chose the California Employers Retiree Benefit Trust (CERBT) as the trustee for the plan. The District made the net contribution for fiscal year end June 30, 2016 by paying health insurance providers or reimbursing retiree paid premiums e. These reimbursements were not funded by CERBT. Annual OPEB Cost and Net OPEB Obligation. The District's OPEB cost (expense) is calculated based upon the annual required contribution of the employer (ARC), an amount actuarially determined in accordance with the parameters of GASB Statement 45. The ARC represents a level of funding that, if paid on an ongoing basis, is projected to cover normal cost each year and amortize any unfunded actuarial liabilities (or funding excess) over a period not to exceed thirty years. The following Table 2.3, represents the schedule of funding progress and shows multi-year trend information about whether the actuarial value of plan assets is increasing or decreasing over time relative to the actuarial accrued liabilities for benefits available.
Table 2.3 - Assessment of OPEB Accrued Liabilities Valuation Date
Actuarial Accrued Liabilities
Actuarial Accrued Assets
Unfunded Actuarial Liability
Funded Ratio
Annual Covered Payroll
UAL as a % of Payroll
July 1, 2011 $ 3,062,219 $ 2,729,321 $ 332,898 89.1% $ 1,387,068 24.0% July 1, 2013 $ 3,496,648 $ 3,181,069 $ 315,579 91.1% $ 1,425,554 22.1% July 1, 2015 $ 5,596,626 $ 3,825,896 $ 1,770,730 68.0% $ 1,671,388 105.9%
12
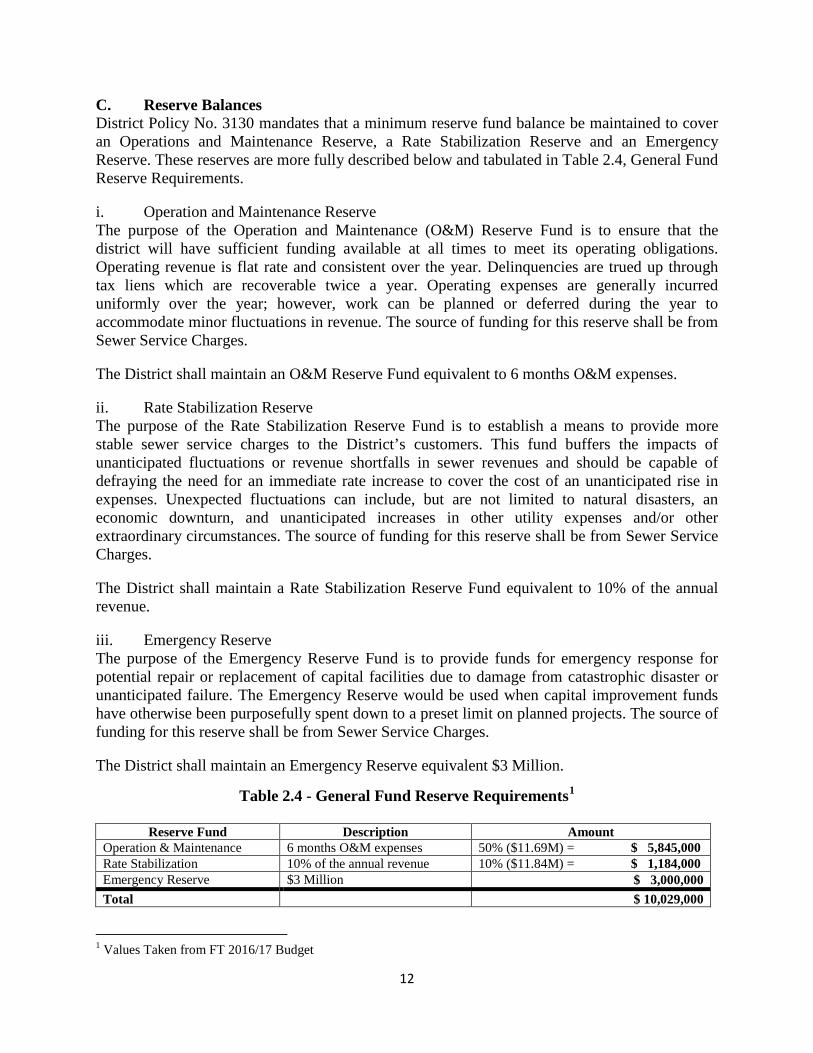
C. Reserve Balances District Policy No. 3130 mandates that a minimum reserve fund balance be maintained to cover an Operations and Maintenance Reserve, a Rate Stabilization Reserve and an Emergency Reserve. These reserves are more fully described below and tabulated in Table 2.4, General Fund Reserve Requirements. i. Operation and Maintenance Reserve The purpose of the Operation and Maintenance (O&M) Reserve Fund is to ensure that the district will have sufficient funding available at all times to meet its operating obligations. Operating revenue is flat rate and consistent over the year. Delinquencies are trued up through tax liens which are recoverable twice a year. Operating expenses are generally incurred uniformly over the year; however, work can be planned or deferred during the year to accommodate minor fluctuations in revenue. The source of funding for this reserve shall be from Sewer Service Charges. The District shall maintain an O&M Reserve Fund equivalent to 6 months O&M expenses. ii. Rate Stabilization Reserve The purpose of the Rate Stabilization Reserve Fund is to establish a means to provide more stable sewer service charges to the District’s customers. This fund buffers the impacts of unanticipated fluctuations or revenue shortfalls in sewer revenues and should be capable of defraying the need for an immediate rate increase to cover the cost of an unanticipated rise in expenses. Unexpected fluctuations can include, but are not limited to natural disasters, an economic downturn, and unanticipated increases in other utility expenses and/or other extraordinary circumstances. The source of funding for this reserve shall be from Sewer Service Charges. The District shall maintain a Rate Stabilization Reserve Fund equivalent to 10% of the annual revenue. iii. Emergency Reserve The purpose of the Emergency Reserve Fund is to provide funds for emergency response for potential repair or replacement of capital facilities due to damage from catastrophic disaster or unanticipated failure. The Emergency Reserve would be used when capital improvement funds have otherwise been purposefully spent down to a preset limit on planned projects. The source of funding for this reserve shall be from Sewer Service Charges. The District shall maintain an Emergency Reserve equivalent $3 Million.
Table 2.4 - General Fund Reserve Requirements1
Reserve Fund Description Amount Operation & Maintenance 6 months O&M expenses 50% ($11.69M) = $ 5,845,000 Rate Stabilization 10% of the annual revenue 10% ($11.84M) = $ 1,184,000 Emergency Reserve $3 Million $ 3,000,000 Total $ 10,029,000
1 Values Taken from FT 2016/17 Budget
13
One of the tests required of the 5-Year Financial Plan will be assuring that these reserve fund balances are maintained. This test is included on Line 64 of the Revenue/Expenses Worksheet included in Appendix “C”. D. Debt Coverage Ratio Regional Wastewater Treatment Plants (RWWTP) & Rate Stabilization Reserve Fund (RSF). The District, the City of Roseville and Placer County (PC) are participants in the South Placer Wastewater Authority (SPWA) with the intended purpose to finance the construction of the Pleasant Grove Wastewater Treatment Plant (PG WWTP) through bonds, low-interest loans or other types of debt. The District collects and transports about 1.5 billion gallons of raw sewage annually to either of two RWWTP in Roseville for treatment (Dry Creek and Pleasant Grove). Together the two RWWTP and infrastructure used by all three partners make up the regional facilities. SPMUD pays its share of annual O&M and replacement costs for the RWWTP’s based on our proportional flows to the other partners and is approximately 25% of total flows into the RWWTP. The SPWA Funding Agreement established a Rate Stabilization Account to be used for the payment of debt service on the Bonds and other costs of the Authority. Monthly contributions of regional connection fees are deposited into the Rate Stabilization Account, and SPWA pays the debt service and other costs from the Account on behalf of each member of SPWA, based on each member’s proportionate share. As of April 30, 2016, the District maintained a balance of $43,730,927 in the Rate Stabilization Account on deposit with the Authority. Per the last approved financial statement accepted by the SPWA, the annual SPWA Debt assigned to SPMUD was $2,075,623. Without any changes, the District currently has approximately 21 years’ worth of debt service on account with SPWA. SPWA is proposing $80M in Capital Improvements and Treatment Upgrades at the PG WWTP to prepare for regional growth, incorporate energy related improvements and to maximize solids digestion. SPWA is proposing to finance this construction through a blend of bond financing, State Revolving Fund loans and cash payments. District staff is estimating that this will increase the debt payment assigned to the District from $2.075M to $3.204M over the 5-year Financial Plan. In accordance with the SPWA debt indenture, SPMUD has covenanted to prescribe and collect rates and charges sufficient to yield net revenues at least equivalent to 110% of its share of debt service. The source of funding for this reserve can be accounted for from all SPMUD revenues and are expected to provide Debt Coverage Ratio (DCR) of 110% over the lives of the Bonds.
DCR = [All revenues – All O&M (before dep)]/SPWA Debt > 1.1.
The calculation of the DCR is included in the Revenue/Expenses Worksheet included in Appendix “C” on Line 56. E. Capital Improvement Plan Capital Outlays are categorized to their respective fund centers. Those projects designated as Capital Replacement & Rehabilitation (R&R) projects would be funded by accumulated depreciation; those projects designated as Capital Improvement Projects (CIP) and Expansion projects are funded through the accumulation of the Sewer Participation fee; the remainder of the

14
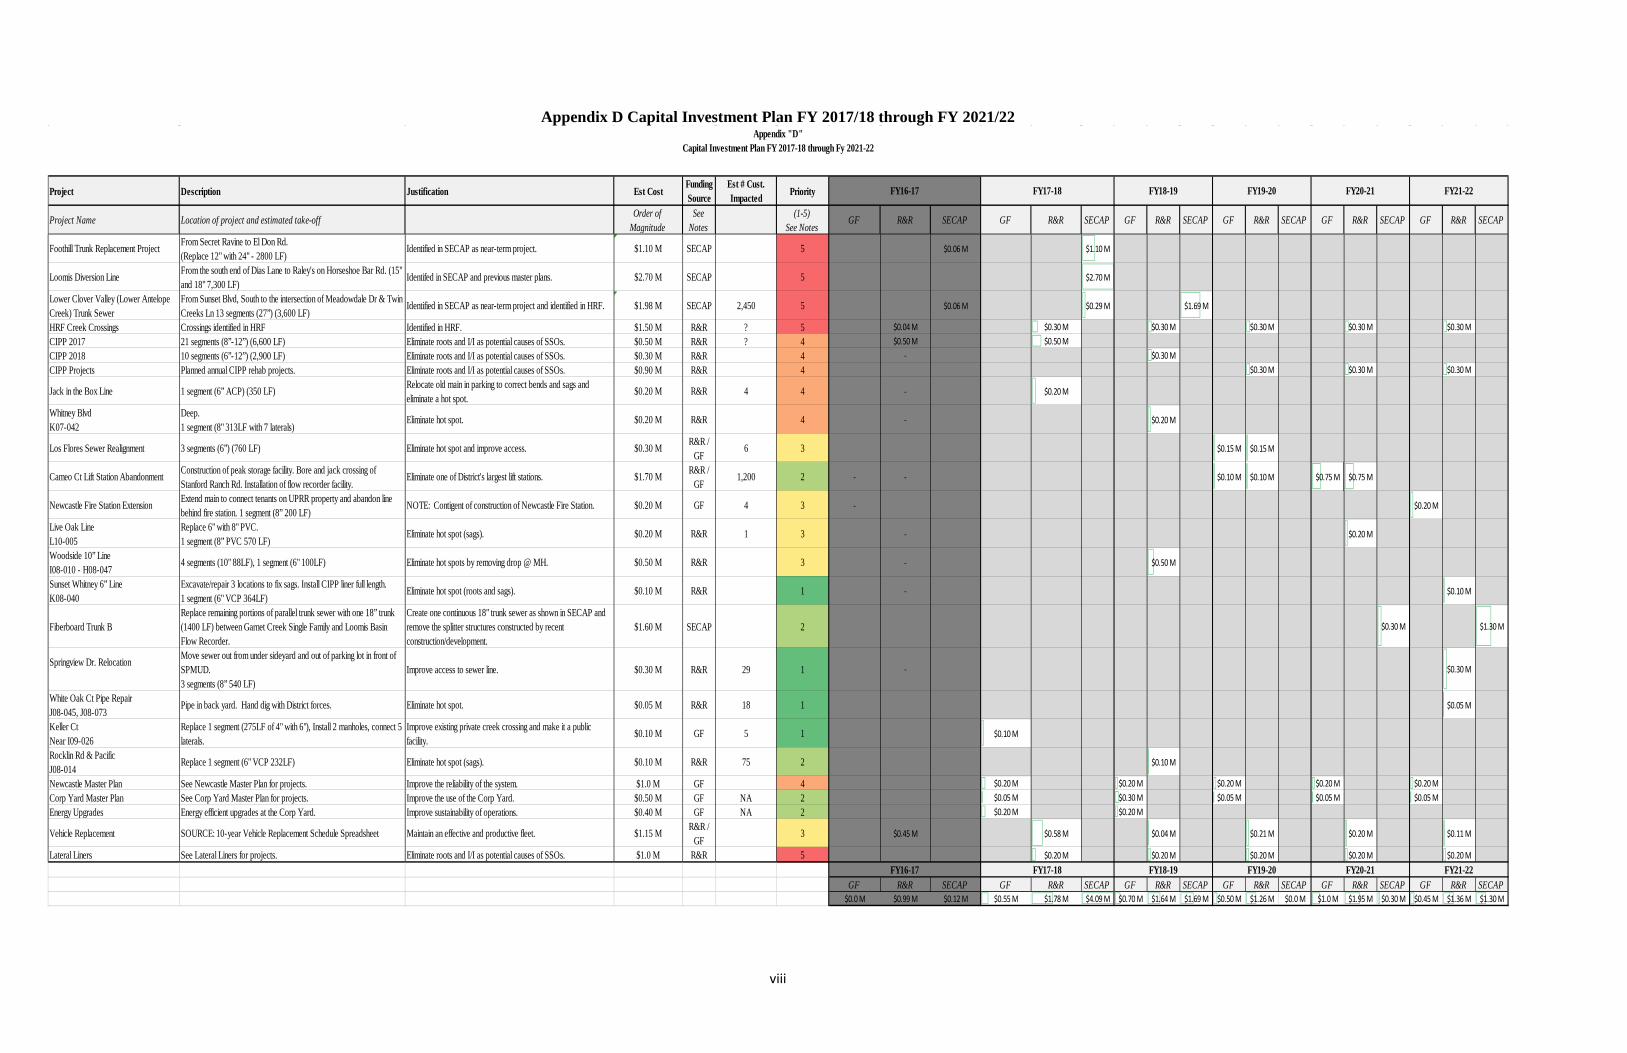
District’s projects would be pay-as-you-go through the General Fund. It is only those projects covered by the General Fund that are directly funded as pay-as-you-go by customers through the monthly service charge2. Table 2.5 and Figure , represents the capital outlay by fund center over the 5-year planning period. Project details for the 5-year Capital Plan are included in Appendix ‘D”.
Table 2.5 - Capital Outlay Summary
FY 16-17 FY 17-18 FY18-19 FY 19-20 FY 20-21 FY21-22 GF $ - $ 550,000 $ 700,000 $ 500,000 $1,000,000 $ 450,000 R&R $ 990,000 $1,783,000 $ 1,635,000 $1,262,000 $1,947,000 $1,364,000 CIP & Expansion $ 120,000 $4,085,000 $ 1,690,000 $ - $ 300,000 $1,300,000 Total $1,110,000 6,418,000 $ 4,025,000 $1,762,000 $3,247,000 $3,114,000
Figure 2.1 – Capital Improvements by Fund FY 2016/17 – 2021/22
2 The depreciation assigned as an annual expense is collected as part of the costs of service and is included in the monthly service charge. These funds are accumulated in Fund 400 to have money available for future R&R Capital projects.
$-
$500,000
$1,000,000
$1,500,000
$2,000,000
$2,500,000
$3,000,000
$3,500,000
$4,000,000
$4,500,000
FY16-17 FY17-18 FY18-19 FY19-20 FY20-21 FY21-22
GF
R&R
CIP & Exp
15
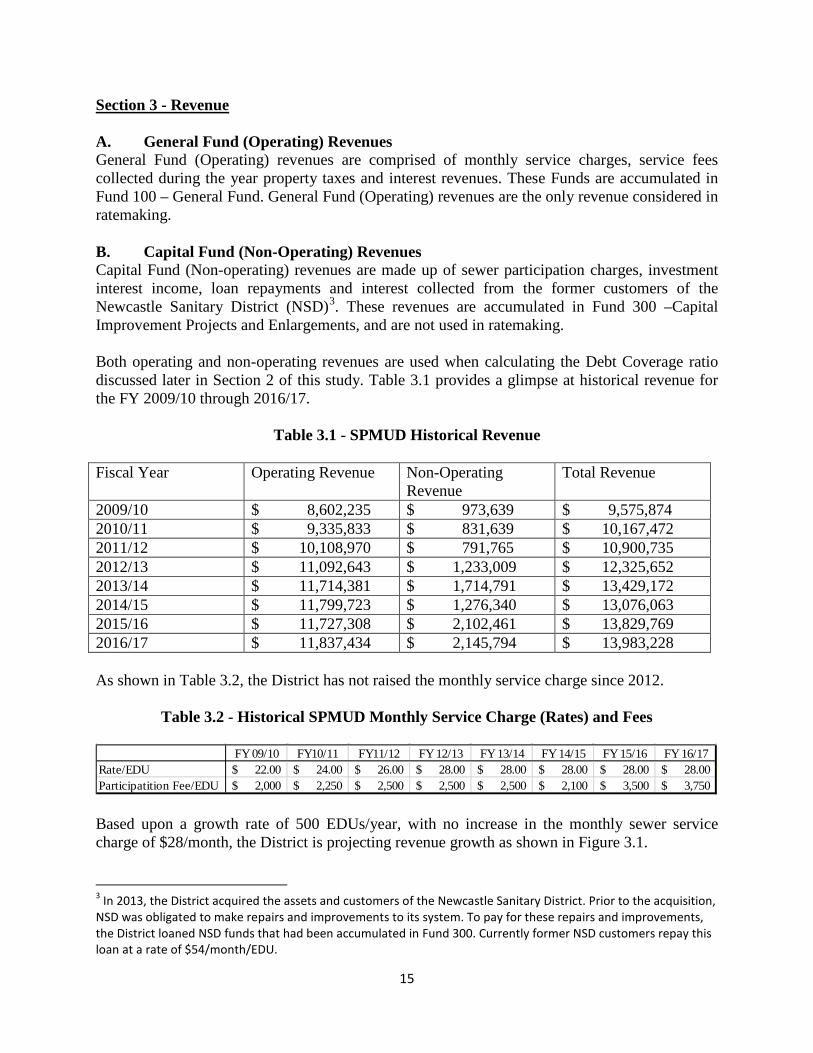
Section 3 - Revenue A. General Fund (Operating) Revenues General Fund (Operating) revenues are comprised of monthly service charges, service fees collected during the year property taxes and interest revenues. These Funds are accumulated in Fund 100 – General Fund. General Fund (Operating) revenues are the only revenue considered in ratemaking. B. Capital Fund (Non-Operating) Revenues Capital Fund (Non-operating) revenues are made up of sewer participation charges, investment interest income, loan repayments and interest collected from the former customers of the Newcastle Sanitary District (NSD)3. These revenues are accumulated in Fund 300 –Capital Improvement Projects and Enlargements, and are not used in ratemaking. Both operating and non-operating revenues are used when calculating the Debt Coverage ratio discussed later in Section 2 of this study. Table 3.1 provides a glimpse at historical revenue for the FY 2009/10 through 2016/17.
Table 3.1 - SPMUD Historical Revenue Fiscal Year Operating Revenue Non-Operating
Revenue Total Revenue
2009/10 $ 8,602,235 $ 973,639 $ 9,575,874 2010/11 $ 9,335,833 $ 831,639 $ 10,167,472 2011/12 $ 10,108,970 $ 791,765 $ 10,900,735 2012/13 $ 11,092,643 $ 1,233,009 $ 12,325,652 2013/14 $ 11,714,381 $ 1,714,791 $ 13,429,172 2014/15 $ 11,799,723 $ 1,276,340 $ 13,076,063 2015/16 $ 11,727,308 $ 2,102,461 $ 13,829,769 2016/17 $ 11,837,434 $ 2,145,794 $ 13,983,228 As shown in Table 3.2, the District has not raised the monthly service charge since 2012.
Table 3.2 - Historical SPMUD Monthly Service Charge (Rates) and Fees
Based upon a growth rate of 500 EDUs/year, with no increase in the monthly sewer service charge of $28/month, the District is projecting revenue growth as shown in Figure 3.1. 3 In 2013, the District acquired the assets and customers of the Newcastle Sanitary District. Prior to the acquisition, NSD was obligated to make repairs and improvements to its system. To pay for these repairs and improvements, the District loaned NSD funds that had been accumulated in Fund 300. Currently former NSD customers repay this loan at a rate of $54/month/EDU.
FY 09/10 FY10/11 FY11/12 FY 12/13 FY 13/14 FY 14/15 FY 15/16 FY 16/17Rate/EDU 22.00$ 24.00$ 26.00$ 28.00$ 28.00$ 28.00$ 28.00$ 28.00$ Participatition Fee/EDU 2,000$ 2,250$ 2,500$ 2,500$ 2,500$ 2,100$ 3,500$ 3,750$

16
Figure 3.1 - SPMUD Historical and Projected Revenues @ $28/EDU/Month
As discussed in Section 2 of this study, in addition to aforementioned general needs, the District has determined four specific funding goals to be accomplished during the 5-year Financial Plan. These include:
• Fully funding the District’s obligations to CalPERS • Fully funding the District’s annual required contribution (ARC) for Other Post-
Employment Benefits (OPEB) • Maintain minimum reserve fund balances • Met the Debt Coverage Ratio mandated by the South Placer wastewater Authority
(SPWA) debt indenture • Provide adequate funding for the Capital Investments
Current revenues generated by the current monthly service charge of $28/month/EDU are insufficient to meet the funding goals of the District. Proposed rate increases to generate sufficient revenue are indicated in Recommendation No. 2 in Section 6, and shown in Appendix “C”.
$0
$2,000,000
$4,000,000
$6,000,000
$8,000,000
$10,000,000
$12,000,000
$14,000,000
$16,000,000
$18,000,000
Total General Fund Revenue Total Capital Fund Revenue
17
Section 4 – Expenses The operating expenses are those District wide costs for goods and services and are comprised of employee, administrative, operational costs and capital projects less than $5,000. The major expense categories consist of:
A. Salary and Benefits; B. Local SPMUD Operating and Maintenance Expenses; C. Regional Wastewater Treatment Plant (RWWTP) Expenses; and D. Annual Depreciation expense.
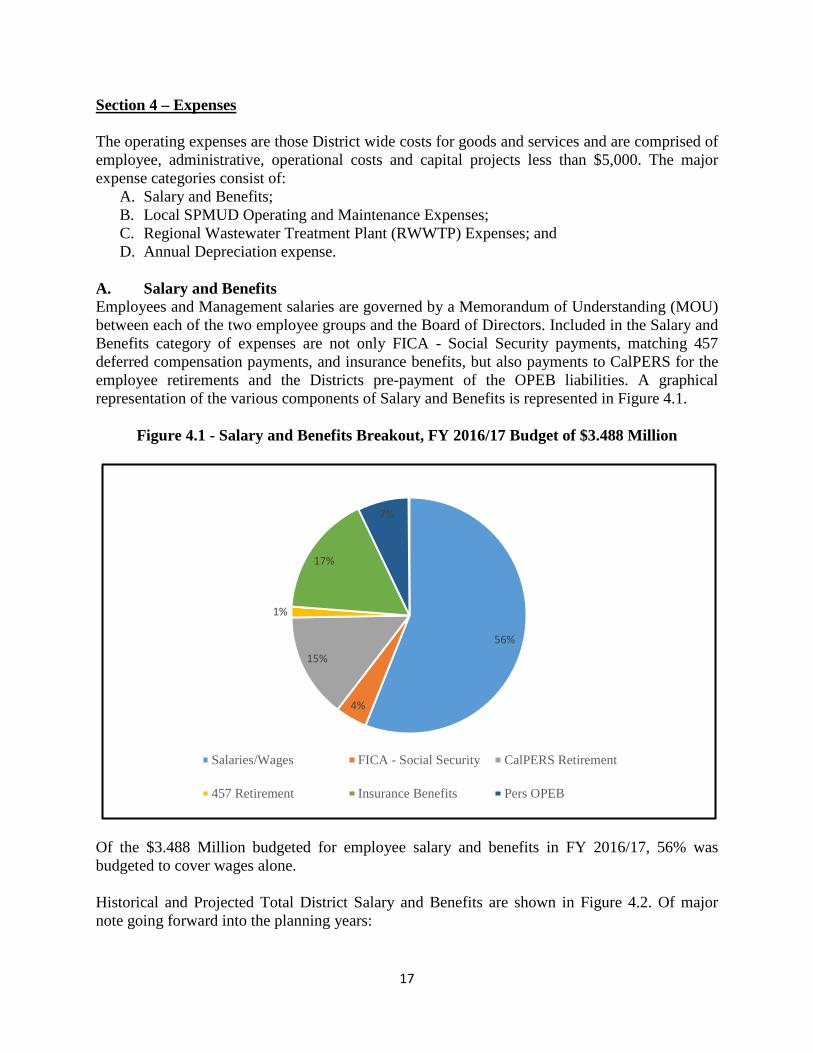
A. Salary and Benefits Employees and Management salaries are governed by a Memorandum of Understanding (MOU) between each of the two employee groups and the Board of Directors. Included in the Salary and Benefits category of expenses are not only FICA - Social Security payments, matching 457 deferred compensation payments, and insurance benefits, but also payments to CalPERS for the employee retirements and the Districts pre-payment of the OPEB liabilities. A graphical representation of the various components of Salary and Benefits is represented in Figure 4.1.
Figure 4.1 - Salary and Benefits Breakout, FY 2016/17 Budget of $3.488 Million
Of the $3.488 Million budgeted for employee salary and benefits in FY 2016/17, 56% was budgeted to cover wages alone. Historical and Projected Total District Salary and Benefits are shown in Figure 4.2. Of major note going forward into the planning years:
56%
4%
15%
1%
17%
7%
Salaries/Wages FICA - Social Security CalPERS Retirement
457 Retirement Insurance Benefits Pers OPEB

18
1. Compensation negotiated under the current MOU; approximately $70K/year for the first three years.
2. The addition of two new employees needed to perform lower lateral maintenance required by Ordinance 17-01 and discussed in more detail in Section 4.B; approximately $200K/year in salary and benefits over the next 5 years
3. District shifting of the responsibility for payment of the employee’s PERS contribution, estimated to increase from $240K/year to $270K/year over the next 5 years
4. District funding of CalPERS pension and OPEB liability discussed in more detail in Sections 2.A and 2.B; estimated to increase from $280K/year to $317K/year over the next 5 years.
Figure 4.2 - Historical and Projected SPMUD Salary and Benefits
B. Local SPMUD Operating and Maintenance Expenses This broad category of expense includes, but is not limited to: • Property & Liability Insurance • General Operating Supplies & Maintenance • Professional Services • Utilities • Vehicle Repair and Maintenance • Repair/Maintenance Agreements • Professional Development • Regulatory Compliance/Government Fees • Legal Services • Lift Station & Flow Recorder Programs • Utility Billing/Banking Expense • Building & Grounds Maintenance • Other Operating Expense • Asphalt Paving • Gas & Oil Expenses
$0
$500,000
$1,000,000
$1,500,000
$2,000,000
$2,500,000
$3,000,000
$3,500,000
$4,000,000
$4,500,000
$5,000,000
Major Changes: 1. MOU 2. Add 2 new employees 3. Employee Paying PERS Contibution 4. SPMUD Prefunding Pension Liability
_______ Actual .............. Projected
19
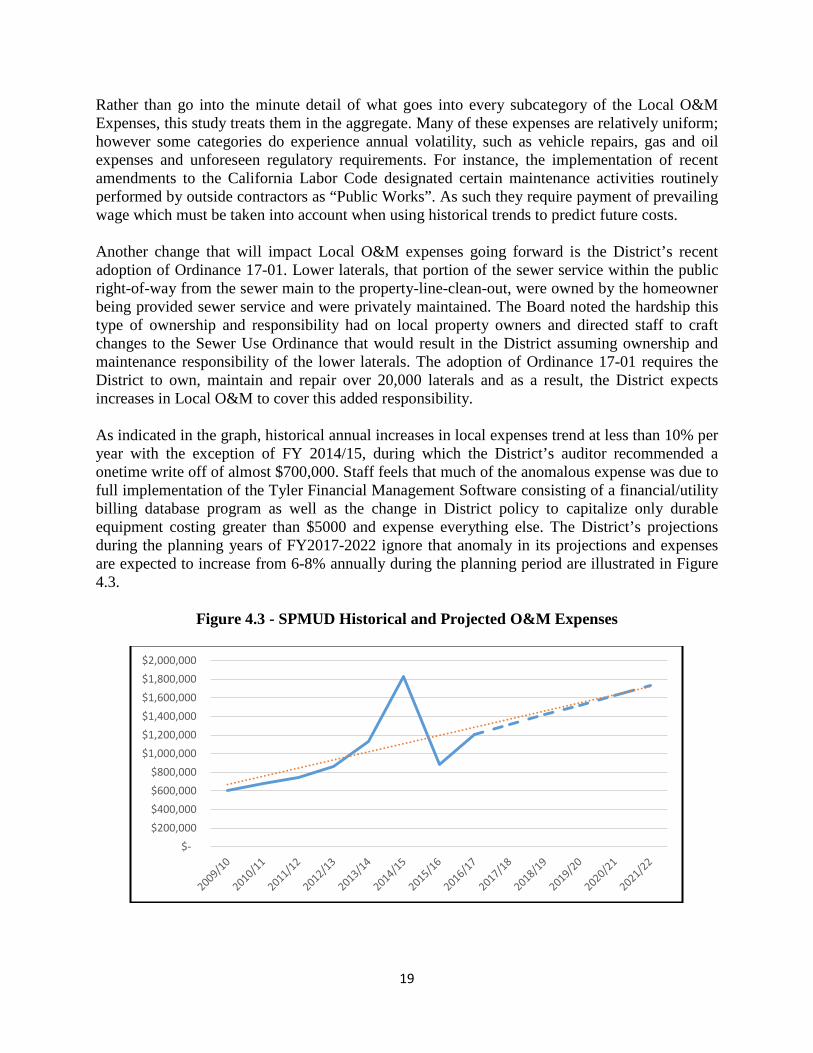
Rather than go into the minute detail of what goes into every subcategory of the Local O&M Expenses, this study treats them in the aggregate. Many of these expenses are relatively uniform; however some categories do experience annual volatility, such as vehicle repairs, gas and oil expenses and unforeseen regulatory requirements. For instance, the implementation of recent amendments to the California Labor Code designated certain maintenance activities routinely performed by outside contractors as “Public Works”. As such they require payment of prevailing wage which must be taken into account when using historical trends to predict future costs. Another change that will impact Local O&M expenses going forward is the District’s recent adoption of Ordinance 17-01. Lower laterals, that portion of the sewer service within the public right-of-way from the sewer main to the property-line-clean-out, were owned by the homeowner being provided sewer service and were privately maintained. The Board noted the hardship this type of ownership and responsibility had on local property owners and directed staff to craft changes to the Sewer Use Ordinance that would result in the District assuming ownership and maintenance responsibility of the lower laterals. The adoption of Ordinance 17-01 requires the District to own, maintain and repair over 20,000 laterals and as a result, the District expects increases in Local O&M to cover this added responsibility. As indicated in the graph, historical annual increases in local expenses trend at less than 10% per year with the exception of FY 2014/15, during which the District’s auditor recommended a onetime write off of almost $700,000. Staff feels that much of the anomalous expense was due to full implementation of the Tyler Financial Management Software consisting of a financial/utility billing database program as well as the change in District policy to capitalize only durable equipment costing greater than $5000 and expense everything else. The District’s projections during the planning years of FY2017-2022 ignore that anomaly in its projections and expenses are expected to increase from 6-8% annually during the planning period are illustrated in Figure 4.3.
Figure 4.3 - SPMUD Historical and Projected O&M Expenses
$- $200,000 $400,000 $600,000 $800,000
$1,000,000 $1,200,000 $1,400,000 $1,600,000 $1,800,000 $2,000,000
20
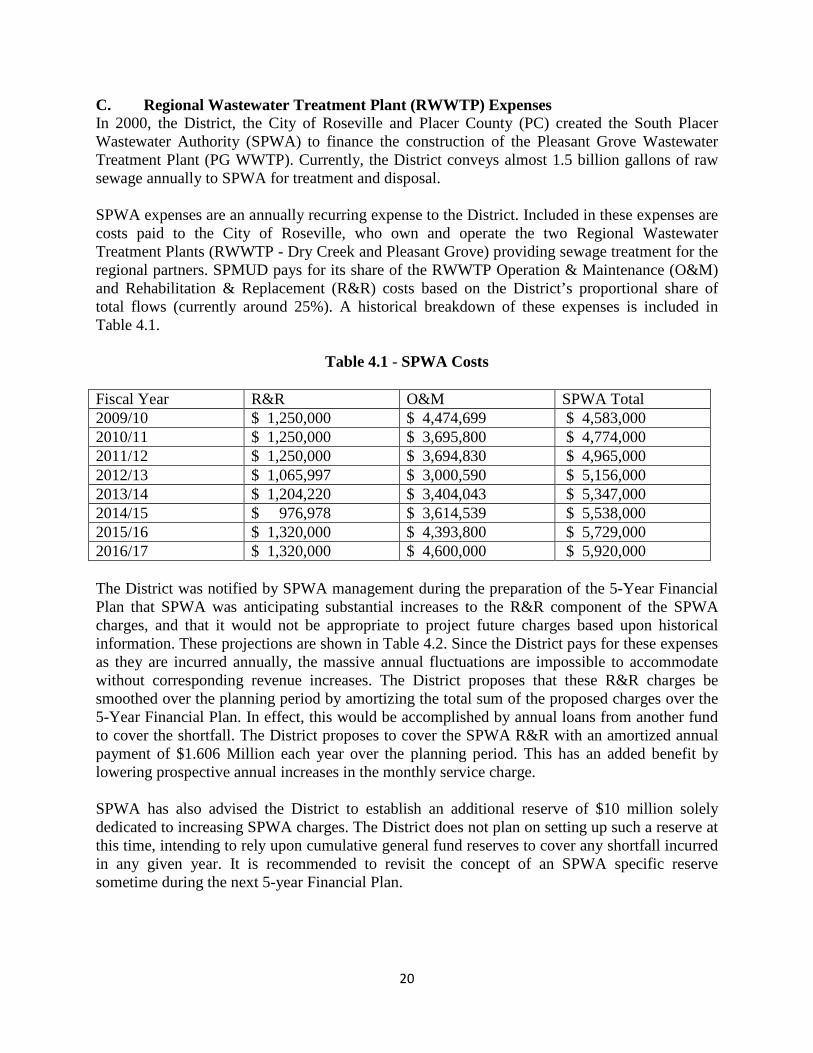
C. Regional Wastewater Treatment Plant (RWWTP) Expenses In 2000, the District, the City of Roseville and Placer County (PC) created the South Placer Wastewater Authority (SPWA) to finance the construction of the Pleasant Grove Wastewater Treatment Plant (PG WWTP). Currently, the District conveys almost 1.5 billion gallons of raw sewage annually to SPWA for treatment and disposal. SPWA expenses are an annually recurring expense to the District. Included in these expenses are costs paid to the City of Roseville, who own and operate the two Regional Wastewater Treatment Plants (RWWTP - Dry Creek and Pleasant Grove) providing sewage treatment for the regional partners. SPMUD pays for its share of the RWWTP Operation & Maintenance (O&M) and Rehabilitation & Replacement (R&R) costs based on the District’s proportional share of total flows (currently around 25%). A historical breakdown of these expenses is included in Table 4.1.
Table 4.1 - SPWA Costs
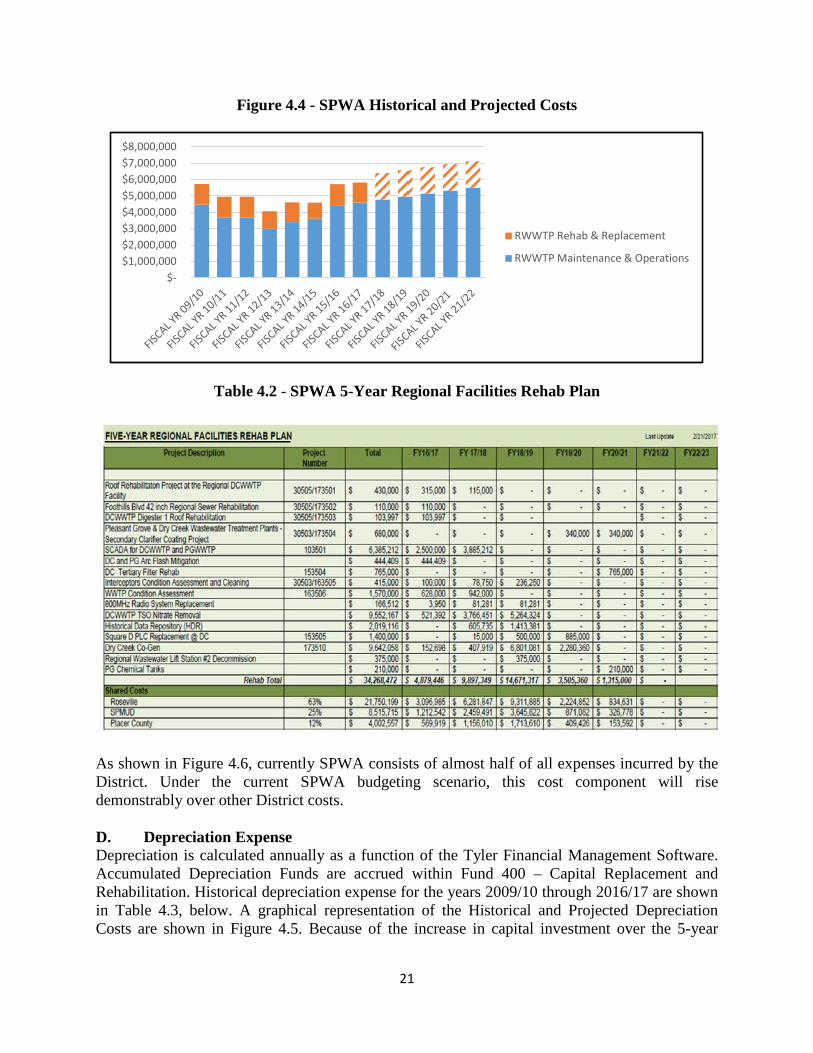
Fiscal Year R&R O&M SPWA Total 2009/10 $ 1,250,000 $ 4,474,699 $ 4,583,000 2010/11 $ 1,250,000 $ 3,695,800 $ 4,774,000 2011/12 $ 1,250,000 $ 3,694,830 $ 4,965,000 2012/13 $ 1,065,997 $ 3,000,590 $ 5,156,000 2013/14 $ 1,204,220 $ 3,404,043 $ 5,347,000 2014/15 $ 976,978 $ 3,614,539 $ 5,538,000 2015/16 $ 1,320,000 $ 4,393,800 $ 5,729,000 2016/17 $ 1,320,000 $ 4,600,000 $ 5,920,000 The District was notified by SPWA management during the preparation of the 5-Year Financial Plan that SPWA was anticipating substantial increases to the R&R component of the SPWA charges, and that it would not be appropriate to project future charges based upon historical information. These projections are shown in Table 4.2. Since the District pays for these expenses as they are incurred annually, the massive annual fluctuations are impossible to accommodate without corresponding revenue increases. The District proposes that these R&R charges be smoothed over the planning period by amortizing the total sum of the proposed charges over the 5-Year Financial Plan. In effect, this would be accomplished by annual loans from another fund to cover the shortfall. The District proposes to cover the SPWA R&R with an amortized annual payment of $1.606 Million each year over the planning period. This has an added benefit by lowering prospective annual increases in the monthly service charge. SPWA has also advised the District to establish an additional reserve of $10 million solely dedicated to increasing SPWA charges. The District does not plan on setting up such a reserve at this time, intending to rely upon cumulative general fund reserves to cover any shortfall incurred in any given year. It is recommended to revisit the concept of an SPWA specific reserve sometime during the next 5-year Financial Plan.
21
Figure 4.4 - SPWA Historical and Projected Costs
Table 4.2 - SPWA 5-Year Regional Facilities Rehab Plan
As shown in Figure 4.6, currently SPWA consists of almost half of all expenses incurred by the District. Under the current SPWA budgeting scenario, this cost component will rise demonstrably over other District costs. D. Depreciation Expense Depreciation is calculated annually as a function of the Tyler Financial Management Software. Accumulated Depreciation Funds are accrued within Fund 400 – Capital Replacement and Rehabilitation. Historical depreciation expense for the years 2009/10 through 2016/17 are shown in Table 4.3, below. A graphical representation of the Historical and Projected Depreciation Costs are shown in Figure 4.5. Because of the increase in capital investment over the 5-year
$- $1,000,000 $2,000,000 $3,000,000 $4,000,000 $5,000,000 $6,000,000 $7,000,000 $8,000,000
RWWTP Rehab & Replacement
RWWTP Maintenance & Operations

22
Financial Plan, the annual depreciation costs are estimate to rise to over $1.6 Million during the planning period.
Table 4.3 - Depreciation
Fiscal Year O&M 2009/10 $ 1,088,844 2010/11 $ 1,088,844 2011/12 $ 1,088,844 2012/13 $ 1,088,844 2013/14 $ 1,088,844 2014/15 $ 1,163,361 2015/16 $ 1,350,600 2016/17 $ 1,350,600
Depreciation is recorded as an annual expense and accumulated in Fund 400. The balance of Fund 400 is used exclusively for the replacement of assets as they are retired or become unusable. The scheduling of Replacements and Rehabilitation projects are not reflected in the General Fund project expenditures.
Figure 4.5 - Historical and Projected Depreciation Costs
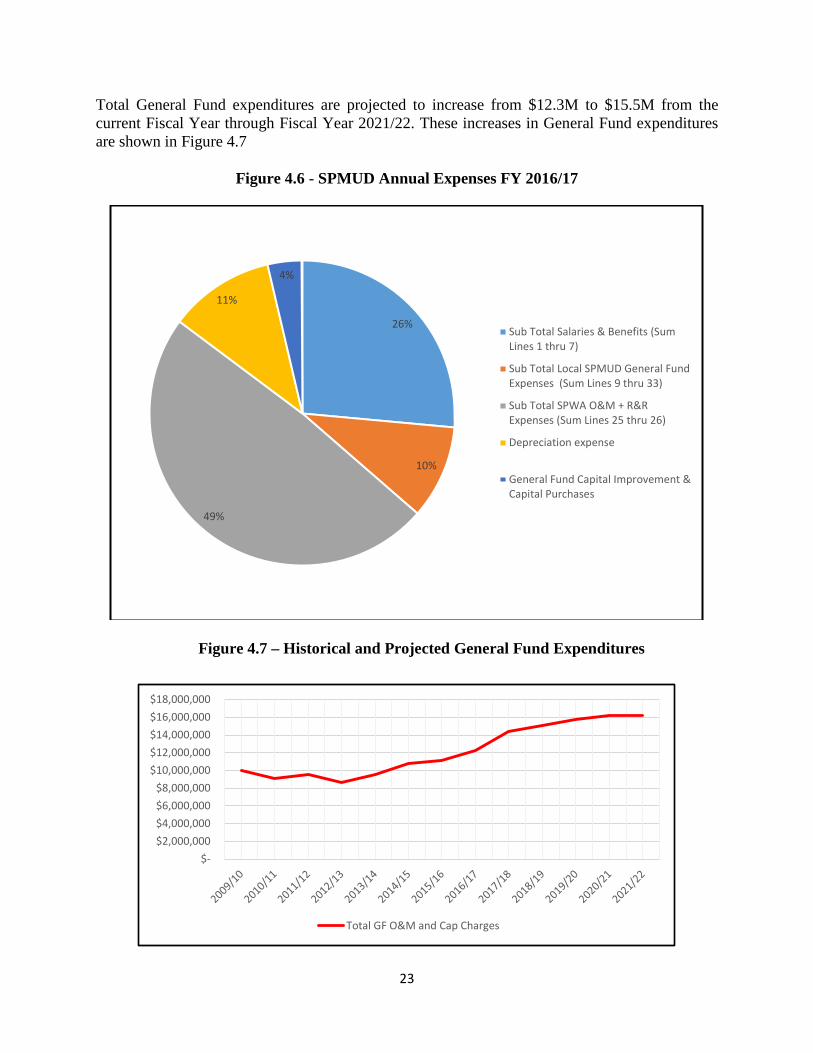
E. Expenses summary As shown in Figure 4.6, in Fiscal Year 2016/17, total SPWA O&M and R&R charges comprised 49% of the annual expenses incurred by the District, followed by salary and benefits at 26%, Depreciation expense at 11% and Local District O&M at 10%. General Fund Capital Improvements and Capital Purchases comprised about 4% of the total District expenses.
$-
$200,000
$400,000
$600,000
$800,000
$1,000,000
$1,200,000
$1,400,000
$1,600,000
$1,800,000
23
Total General Fund expenditures are projected to increase from $12.3M to $15.5M from the current Fiscal Year through Fiscal Year 2021/22. These increases in General Fund expenditures are shown in Figure 4.7
Figure 4.6 - SPMUD Annual Expenses FY 2016/17
Figure 4.7 – Historical and Projected General Fund Expenditures
26%
10%
49%
11%
4%
Sub Total Salaries & Benefits (SumLines 1 thru 7)
Sub Total Local SPMUD General FundExpenses (Sum Lines 9 thru 33)
Sub Total SPWA O&M + R&RExpenses (Sum Lines 25 thru 26)
Depreciation expense
General Fund Capital Improvement &Capital Purchases
$- $2,000,000 $4,000,000 $6,000,000 $8,000,000
$10,000,000 $12,000,000 $14,000,000 $16,000,000 $18,000,000
Total GF O&M and Cap Charges
24
Section 5 - Fund Balances A. Fund Balance Breakdowns
i. Fund 100 – General
The source of these funds comes from customer monthly sewer service charges. This fund is used to cover for annual general operating and maintenance expenses, including but not limited to salary, wages, benefits, materials, equipment, vehicles, chemicals, power and other annually recurring expenses and capital investments the utility. Also, this fund is used to make payments to SPWA for regional WWTP expenses and rehabilitation and replacement charges. The current balance requirement in Fund 100, as discussed in Section 2.C and as shown in Table 2.4, is $10.02M. The District projects expenses drawing down this fund by $467K in the current fiscal year and $402K in the next fiscal year.
ii. Fund 300 –Capital Improvement Projects and Enlargements These funds are sourced from payments of the local participation fee. The purpose of the fee is to exclusively fund the trunk sewer upgrades and expansion attributable to the impact from new development. Trunk sewer upgrades and expansion facilities have been identified by the District as necessary to serve certain new development within the District’s service area boundaries. These improvements and will be needed as new residential and non-residential development generate additional sewage and increase the demand placed on existing facilities. The District has identified the projects contained in the System Evaluation and Capacity Assurance Plan (SECAP), as those that are necessary to serve certain future development within the District’s service area boundaries. Fund 300 solely pays for the trunk sewer upgrades and expansion attributable to the impact from new development, as identified in the SECAP. The SECAP indicates projects totaling $87.5M for near term buildout. Table 2.5 indicates CIP and Enlargement projects totaling $7.45M over the next 5 years. iii. Fund 400 – Capital Replacement and Rehabilitation
The source of funding for this reserve shall be in the form of an annual operating expense (transfer) to the Capital Replacement and Rehabilitation Fund. The District incurs an annual expense equivalent to the annual depreciation and accumulate this balance in this fund. These funds are accumulated and used exclusively to replace capital infrastructure as it ages or to rehabilitate infrastructure to extend its useful life. The purpose of this fund is to accumulate the probable replacement cost of equipment each year over the life of the asset, so it can be replaced readily when it becomes obsolete, totally depreciated or is scheduled for replacement. Annual depreciation is calculated as a function of the depreciation schedule maintained within the District’s Financial Management Software. The District has developed Nessie Curves, included in Appendix E, analyzing the required funding for just in time replacements as part of the District’s tactical asset management. The

25
results of this analysis indicate a Fund 400 balance requirement between $40M to $50M by the year 2030, and a need for up to $43M to $60M by the year 2055.
The District has enhanced its investment policy to optimize the rates of return on its investments. Policy 3120, provides direction to the Board of Directors, General Manager and Secretary of the District for the prudent and beneficial use of all funds and monies of the District without regard to source or restrictions. The investment policy of the District is a conservative policy guided by three principles of public fund management:
(a) Safety of Principal - Investments shall be undertaken in a manner which first seeks to preserve portfolio principal. (b) Liquidity - Investments shall be made with maturity dates that are compatible with cash flow requirements and which will permit easy and rapid conversion into cash, at all times, without a substantial loss of value. (c) Return on Investment (ROI) - Investments shall be undertaken to produce an acceptable rate of return after first consideration for principal and liquidity.
Furthermore, the District adopted Resolution 16-04 which approved an Investment Strategy, coincident with Policy 3120, that allows for investments in Placer County Treasury, the Local Agency Investment Fund (LAIF) CalTrust as well as other fixed income securities as shown in Table 5.1.
Table 5.1 - Fund Balance Breakdowns
Source: FY 2016/17 Budget Report The District appears prudent in the accumulation of fund balances intended for future needs.
26
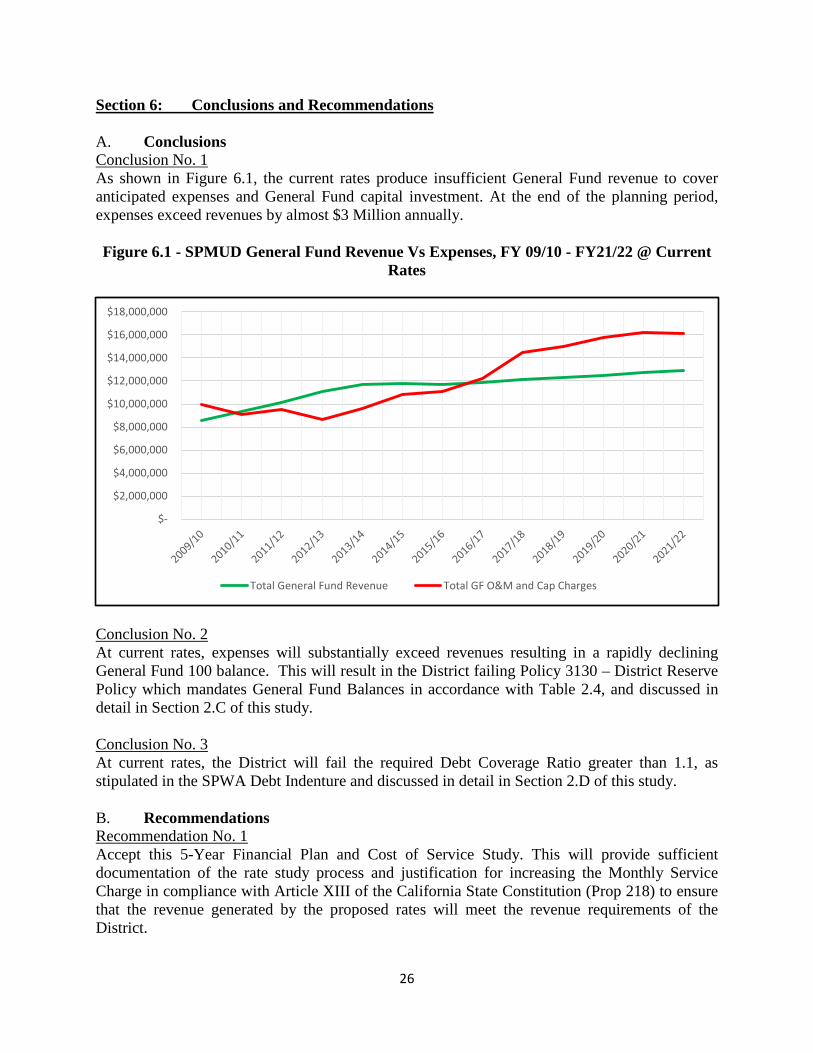
Section 6: Conclusions and Recommendations A. Conclusions Conclusion No. 1 As shown in Figure 6.1, the current rates produce insufficient General Fund revenue to cover anticipated expenses and General Fund capital investment. At the end of the planning period, expenses exceed revenues by almost $3 Million annually. Figure 6.1 - SPMUD General Fund Revenue Vs Expenses, FY 09/10 - FY21/22 @ Current
Rates
Conclusion No. 2 At current rates, expenses will substantially exceed revenues resulting in a rapidly declining General Fund 100 balance. This will result in the District failing Policy 3130 – District Reserve Policy which mandates General Fund Balances in accordance with Table 2.4, and discussed in detail in Section 2.C of this study. Conclusion No. 3 At current rates, the District will fail the required Debt Coverage Ratio greater than 1.1, as stipulated in the SPWA Debt Indenture and discussed in detail in Section 2.D of this study. B. Recommendations Recommendation No. 1 Accept this 5-Year Financial Plan and Cost of Service Study. This will provide sufficient documentation of the rate study process and justification for increasing the Monthly Service Charge in compliance with Article XIII of the California State Constitution (Prop 218) to ensure that the revenue generated by the proposed rates will meet the revenue requirements of the District.
$-
$2,000,000
$4,000,000
$6,000,000
$8,000,000
$10,000,000
$12,000,000
$14,000,000
$16,000,000
$18,000,000
Total General Fund Revenue Total GF O&M and Cap Charges

27
Recommendation No. 2 Prepare a Public Notification in compliance with Article XIII of the California State Constitution (Prop 218) for 3 consecutive annual increases in the Monthly Service Charge corresponding to Table 6.1. The first increase should become effective as soon as possible after the statutory timelines (approximately Sep 1, 2017) and the remaining increases should take effect on July 1, of each succeeding year.
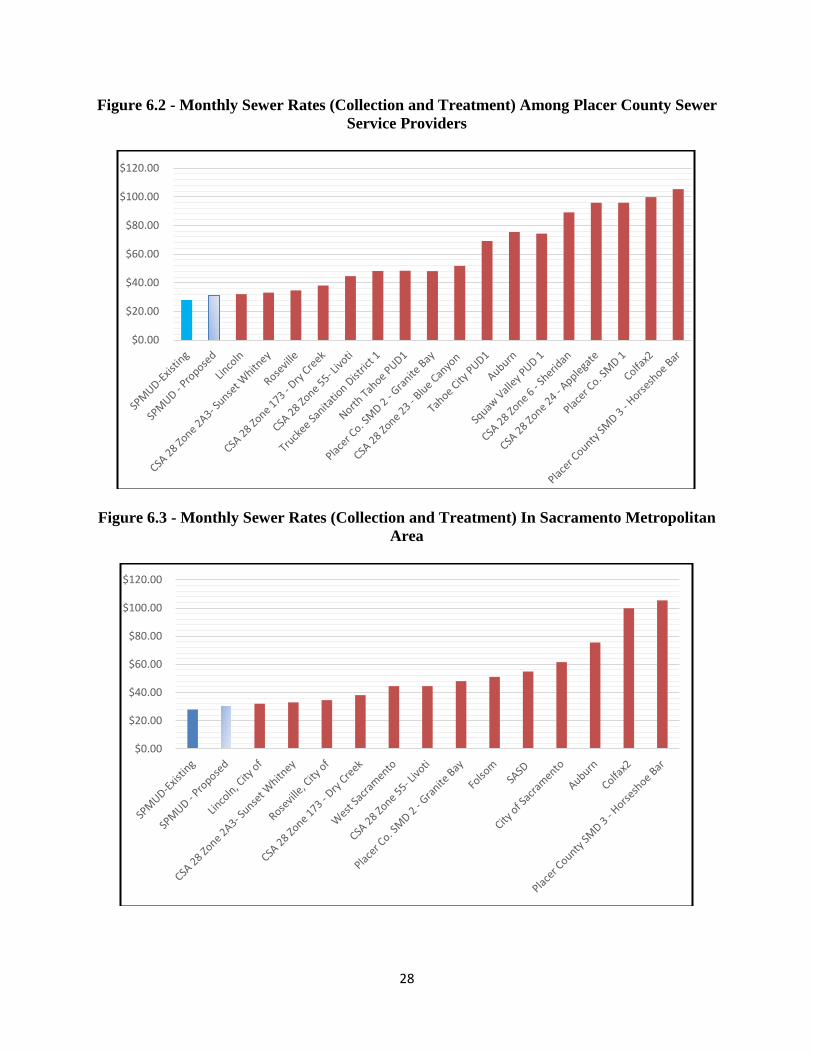
Table 6.1 - SPMUD Implementation Schedule of Monthly Service Charges Implementation Date September 1, 2017 July 1, 2018 July 1, 2019 Monthly Service Charge ($/EDU) $31.00 $34.00 $36.00 These increases will generate sufficient revenue to meet the funding goals of the District as discussed in detail in Section 2 of the Study while still retaining the lowest rates in not only Placer County, but also the major Sacramento Metropolitan Area, as indicated in Figures 6.2 and 6.3. Recommendation No.3 Following the state requirements for a majority protest vote and public hearings, adopt an Ordinance implementing the rate prescribed in the Public Notice. Recommendation No. 4 Implement a Lifeline Low-Income Rate Assistance Program whereby owner occupied residences that qualify for the PG&E CARE program, also receive assistance towards the Monthly Service Charge in an amount not to exceed $5.00/month. The revenue used to cover such a program cannot come from rates. A suggested source of funds could be revenue generated by the recently adopted delinquency payment policy. Recommendation No. 5 Annually review the financial performance of the District using the SPMUD Revenue and Expense Model included in this study as Appendix C to ensure that all financial goals are being met and that the revenue generated by these proposed rates meets the revenue requirements of the District.
28
Figure 6.2 - Monthly Sewer Rates (Collection and Treatment) Among Placer County Sewer Service Providers
Figure 6.3 - Monthly Sewer Rates (Collection and Treatment) In Sacramento Metropolitan Area
$0.00
$20.00
$40.00
$60.00
$80.00
$100.00
$120.00
$0.00
$20.00
$40.00
$60.00
$80.00
$100.00
$120.00
i
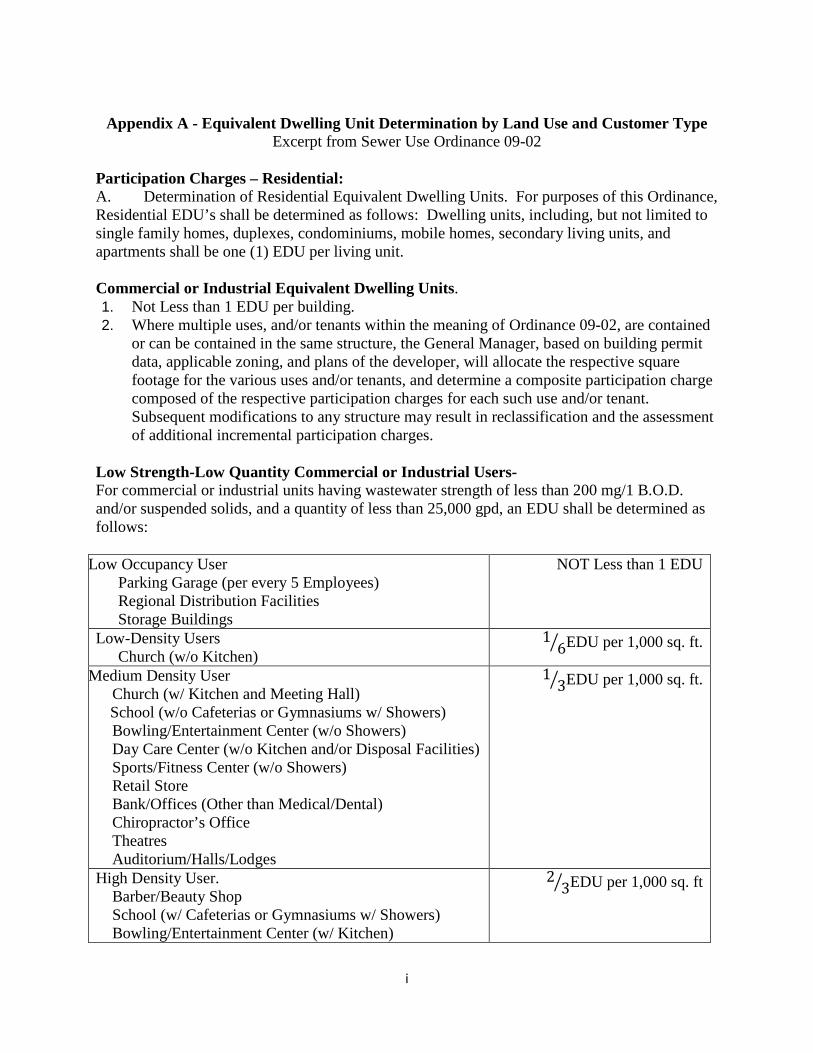
Appendix A - Equivalent Dwelling Unit Determination by Land Use and Customer Type
Excerpt from Sewer Use Ordinance 09-02
Participation Charges – Residential: A. Determination of Residential Equivalent Dwelling Units. For purposes of this Ordinance, Residential EDU’s shall be determined as follows: Dwelling units, including, but not limited to single family homes, duplexes, condominiums, mobile homes, secondary living units, and apartments shall be one (1) EDU per living unit. Commercial or Industrial Equivalent Dwelling Units. 1. Not Less than 1 EDU per building. 2. Where multiple uses, and/or tenants within the meaning of Ordinance 09-02, are contained
or can be contained in the same structure, the General Manager, based on building permit data, applicable zoning, and plans of the developer, will allocate the respective square footage for the various uses and/or tenants, and determine a composite participation charge composed of the respective participation charges for each such use and/or tenant. Subsequent modifications to any structure may result in reclassification and the assessment of additional incremental participation charges.
Low Strength-Low Quantity Commercial or Industrial Users- For commercial or industrial units having wastewater strength of less than 200 mg/1 B.O.D. and/or suspended solids, and a quantity of less than 25,000 gpd, an EDU shall be determined as follows:
Low Occupancy User Parking Garage (per every 5 Employees) Regional Distribution Facilities Storage Buildings
NOT Less than 1 EDU
Low-Density Users Church (w/o Kitchen)
16� EDU per 1,000 sq. ft.
Medium Density User Church (w/ Kitchen and Meeting Hall) School (w/o Cafeterias or Gymnasiums w/ Showers) Bowling/Entertainment Center (w/o Showers) Day Care Center (w/o Kitchen and/or Disposal Facilities) Sports/Fitness Center (w/o Showers) Retail Store Bank/Offices (Other than Medical/Dental) Chiropractor’s Office Theatres Auditorium/Halls/Lodges
13� EDU per 1,000 sq. ft.
High Density User. Barber/Beauty Shop School (w/ Cafeterias or Gymnasiums w/ Showers) Bowling/Entertainment Center (w/ Kitchen)
23� EDU per 1,000 sq. ft
ii
Day Care Center (w/ Kitchen and/or Disposal Facilities) Sports/Fitness Center (w/ Showers) Medical/Dental Office Service Station Pet Grooming Center Veterinary Clinic Bars
Special Commercial User Car Wash (per Automatic Wash Stall) Car Wash (per Self-service Wash Stall) Laundromat Market/Mini-market (w/o Disposal) Market/Mini-market (w/ Disposal) FSE (FOG producing establishment) FSE (Non FOG Producing Establishment, w/ limited
food preparation) FSE Outside/Overflow Dining Area w/ Covered Area
w/o Covered Area, but fenced Mortuaries Hospital Rest Home/Convalescent Hospital Camping/Recreational Vehicle Site Recreational Vehicle Dump Site Hotel/Motel Unit (w/ Kitchen) Hotel/Motel Unit (w/o Kitchen)
8 EDU per Unit 2 EDU per Unit
2⁄3 EDU per Washer 2⁄3 EDU per 1,000 sq. ft.
2 EDU per 1,000 sq. ft. 2 EDU per 1,000 sq. ft. 1 EDU per 1,000 sq. ft
2 EDU per 1,000 sq. ft. 1 EDU per 1,000 sq. ft. 2 EDU per 1,000 sq. ft.
1⁄2 EDU per Licensed Bed 1⁄3 EDU per Licensed Bed
1⁄2 EDU per Site 1 EDU per Site 1 EDU per Unit
1⁄2 EDU per Unit Other Commercial/Industrial Users not listed **Based on a Study done by the
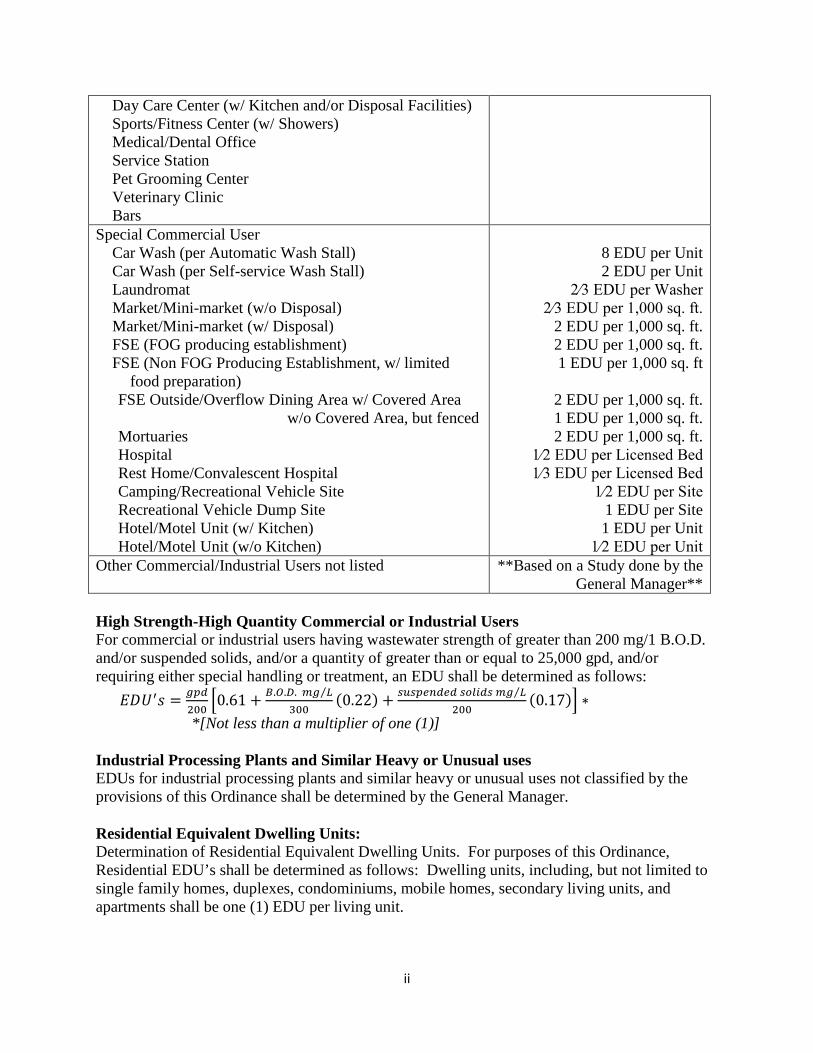
General Manager** High Strength-High Quantity Commercial or Industrial Users For commercial or industrial users having wastewater strength of greater than 200 mg/1 B.O.D. and/or suspended solids, and/or a quantity of greater than or equal to 25,000 gpd, and/or requiring either special handling or treatment, an EDU shall be determined as follows:
𝐸𝐸𝐸𝐸𝑈𝑈′𝑠𝑠 = 𝑔𝑔𝑔𝑔𝑔𝑔200
�0.61 + 𝐵𝐵.𝑂𝑂.𝐷𝐷. 𝑚𝑚𝑔𝑔 𝐿𝐿⁄300
(0.22) + 𝑠𝑠𝑠𝑠𝑠𝑠𝑔𝑔𝑠𝑠𝑠𝑠𝑔𝑔𝑠𝑠𝑔𝑔 𝑠𝑠𝑠𝑠𝑠𝑠𝑠𝑠𝑔𝑔𝑠𝑠 𝑚𝑚𝑔𝑔 𝐿𝐿⁄200
(0.17)� ∗ *[Not less than a multiplier of one (1)]
Industrial Processing Plants and Similar Heavy or Unusual uses EDUs for industrial processing plants and similar heavy or unusual uses not classified by the provisions of this Ordinance shall be determined by the General Manager. Residential Equivalent Dwelling Units: Determination of Residential Equivalent Dwelling Units. For purposes of this Ordinance, Residential EDU’s shall be determined as follows: Dwelling units, including, but not limited to single family homes, duplexes, condominiums, mobile homes, secondary living units, and apartments shall be one (1) EDU per living unit.
iii
Appendix B - CalPERS Actuarial Valuation and Amortization Schedules

iv
v
vi
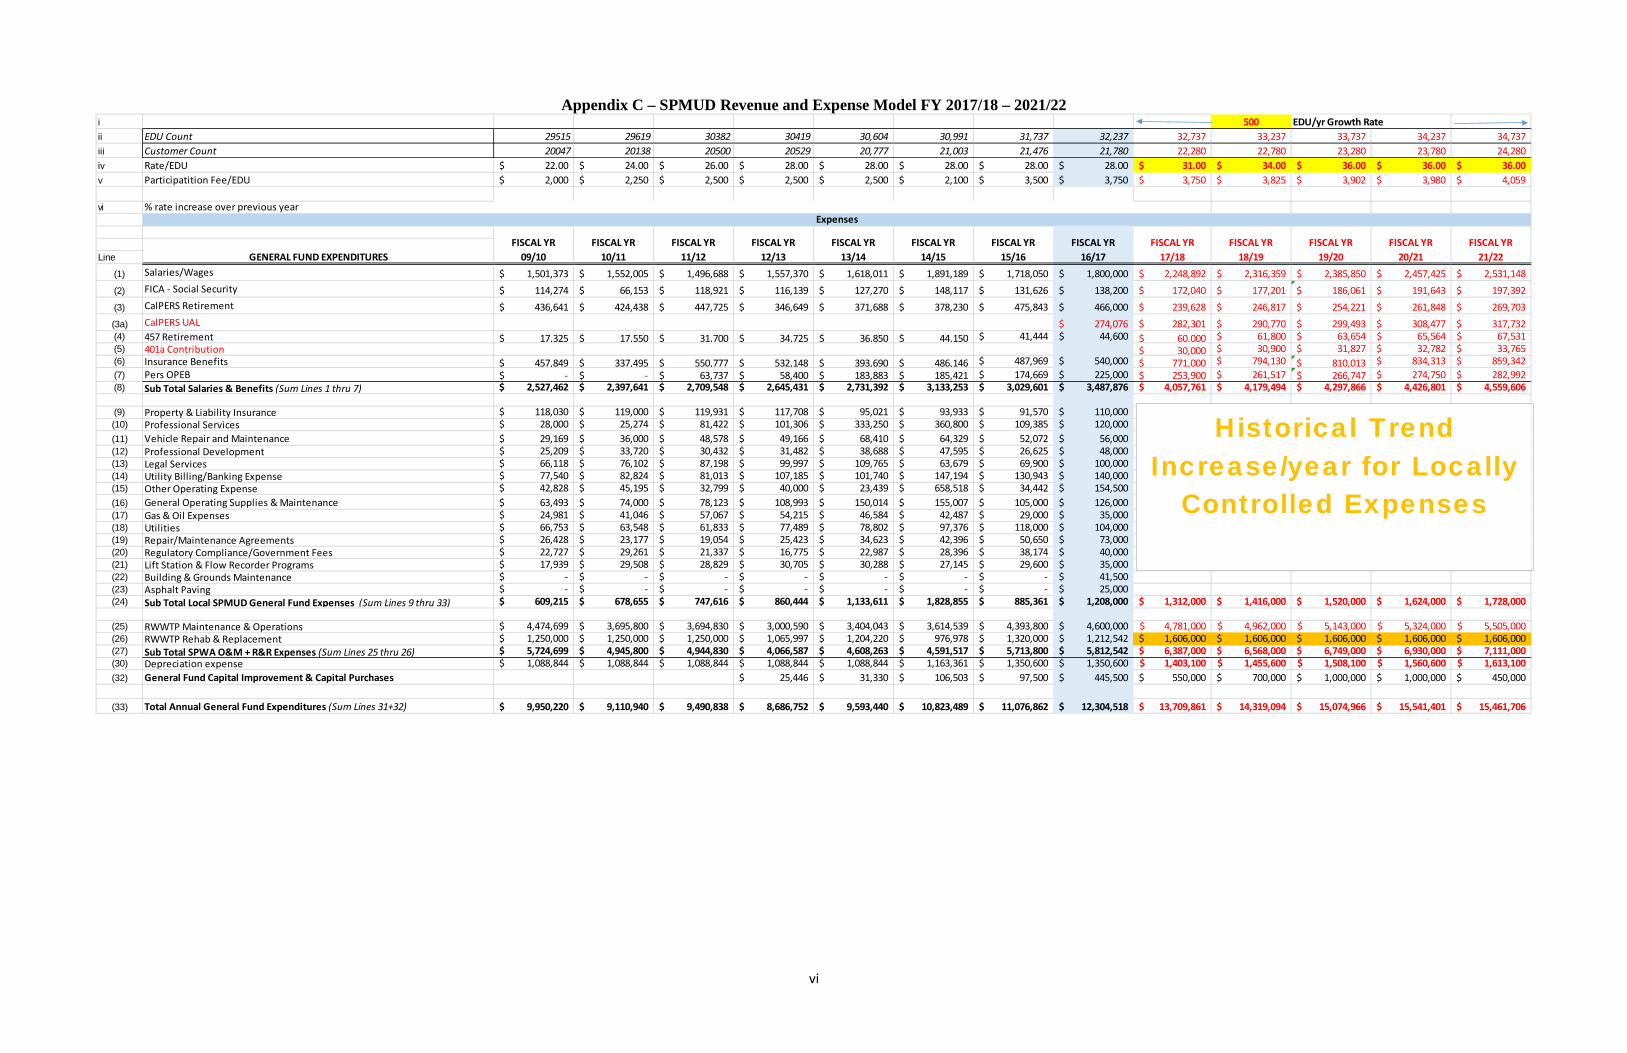
Appendix C – SPMUD Revenue and Expense Model FY 2017/18 – 2021/22
i 500 EDU/yr Growth Rateii EDU Count 29515 29619 30382 30419 30,604 30,991 31,737 32,237 32,737 33,237 33,737 34,237 34,737 iii Customer Count 20047 20138 20500 20529 20,777 21,003 21,476 21,780 22,280 22,780 23,280 23,780 24,280 iv Rate/EDU 22.00$ 24.00$ 26.00$ 28.00$ 28.00$ 28.00$ 28.00$ 28.00$ 31.00$ 34.00$ 36.00$ 36.00$ 36.00$ v Participatition Fee/EDU 2,000$ 2,250$ 2,500$ 2,500$ 2,500$ 2,100$ 3,500$ 3,750$ 3,750$ 3,825$ 3,902$ 3,980$ 4,059$
vi % rate increase over previous year
Line
(1) Salaries/Wages 1,501,373$ 1,552,005$ 1,496,688$ 1,557,370$ 1,618,011$ 1,891,189$ 1,718,050$ 1,800,000$ 2,248,892$ 2,316,359$ 2,385,850$ 2,457,425$ 2,531,148$ (2) FICA - Social Security 114,274$ 66,153$ 118,921$ 116,139$ 127,270$ 148,117$ 131,626$ 138,200$ 172,040$ 177,201$ 186,061$ 191,643$ 197,392$ (3) CalPERS Retirement 436,641$ 424,438$ 447,725$ 346,649$ 371,688$ 378,230$ 475,843$ 466,000$ 239,628$ 246,817$ 254,221$ 261,848$ 269,703$ (3a) CalPERS UAL 274,076$ 282,301$ 290,770$ 299,493$ 308,477$ 317,732$ (4) 457 Retirement 17,325$ 17,550$ 31,700$ 34,725$ 36,850$ 44,150$ 41,444$ 44,600$ 60,000$ 61,800$ 63,654$ 65,564$ 67,531$ (5) 401a Contribution 30,000$ 30,900$ 31,827$ 32,782$ 33,765$ (6) Insurance Benefits 457,849$ 337,495$ 550,777$ 532,148$ 393,690$ 486,146$ 487,969$ 540,000$ 771,000$ 794,130$ 810,013$ 834,313$ 859,342$ (7) Pers OPEB -$ -$ 63,737$ 58,400$ 183,883$ 185,421$ 174,669$ 225,000$ 253,900$ 261,517$ 266,747$ 274,750$ 282,992$ (8) Sub Total Salaries & Benefits (Sum Lines 1 thru 7) 2,527,462$ 2,397,641$ 2,709,548$ 2,645,431$ 2,731,392$ 3,133,253$ 3,029,601$ 3,487,876$ 4,057,761$ 4,179,494$ 4,297,866$ 4,426,801$ 4,559,606$
(9) Property & Liability Insurance 118,030$ 119,000$ 119,931$ 117,708$ 95,021$ 93,933$ 91,570$ 110,000$ (10) Professional Services 28,000$ 25,274$ 81,422$ 101,306$ 333,250$ 360,800$ 109,385$ 120,000$ (11) Vehicle Repair and Maintenance 29,169$ 36,000$ 48,578$ 49,166$ 68,410$ 64,329$ 52,072$ 56,000$ (12) Professional Development 25,209$ 33,720$ 30,432$ 31,482$ 38,688$ 47,595$ 26,625$ 48,000$ (13) Legal Services 66,118$ 76,102$ 87,198$ 99,997$ 109,765$ 63,679$ 69,900$ 100,000$ (14) Utility Billing/Banking Expense 77,540$ 82,824$ 81,013$ 107,185$ 101,740$ 147,194$ 130,943$ 140,000$ (15) Other Operating Expense 42,828$ 45,195$ 32,799$ 40,000$ 23,439$ 658,518$ 34,442$ 154,500$ (16) General Operating Supplies & Maintenance 63,493$ 74,000$ 78,123$ 108,993$ 150,014$ 155,007$ 105,000$ 126,000$ (17) Gas & Oil Expenses 24,981$ 41,046$ 57,067$ 54,215$ 46,584$ 42,487$ 29,000$ 35,000$ (18) Utilities 66,753$ 63,548$ 61,833$ 77,489$ 78,802$ 97,376$ 118,000$ 104,000$ (19) Repair/Maintenance Agreements 26,428$ 23,177$ 19,054$ 25,423$ 34,623$ 42,396$ 50,650$ 73,000$ (20) Regulatory Compliance/Government Fees 22,727$ 29,261$ 21,337$ 16,775$ 22,987$ 28,396$ 38,174$ 40,000$ (21) Lift Station & Flow Recorder Programs 17,939$ 29,508$ 28,829$ 30,705$ 30,288$ 27,145$ 29,600$ 35,000$ (22) Building & Grounds Maintenance -$ -$ -$ -$ -$ -$ -$ 41,500$ (23) Asphalt Paving -$ -$ -$ -$ -$ -$ -$ 25,000$ (24) Sub Total Local SPMUD General Fund Expenses (Sum Lines 9 thru 33) 609,215$ 678,655$ 747,616$ 860,444$ 1,133,611$ 1,828,855$ 885,361$ 1,208,000$ 1,312,000$ 1,416,000$ 1,520,000$ 1,624,000$ 1,728,000$
(25) RWWTP Maintenance & Operations 4,474,699$ 3,695,800$ 3,694,830$ 3,000,590$ 3,404,043$ 3,614,539$ 4,393,800$ 4,600,000$ 4,781,000$ 4,962,000$ 5,143,000$ 5,324,000$ 5,505,000$ (26) RWWTP Rehab & Replacement 1,250,000$ 1,250,000$ 1,250,000$ 1,065,997$ 1,204,220$ 976,978$ 1,320,000$ 1,212,542$ 1,606,000$ 1,606,000$ 1,606,000$ 1,606,000$ 1,606,000$ (27) Sub Total SPWA O&M + R&R Expenses (Sum Lines 25 thru 26) 5,724,699$ 4,945,800$ 4,944,830$ 4,066,587$ 4,608,263$ 4,591,517$ 5,713,800$ 5,812,542$ 6,387,000$ 6,568,000$ 6,749,000$ 6,930,000$ 7,111,000$ (30) Depreciation expense 1,088,844$ 1,088,844$ 1,088,844$ 1,088,844$ 1,088,844$ 1,163,361$ 1,350,600$ 1,350,600$ 1,403,100$ 1,455,600$ 1,508,100$ 1,560,600$ 1,613,100$ (32) General Fund Capital Improvement & Capital Purchases 25,446$ 31,330$ 106,503$ 97,500$ 445,500$ 550,000$ 700,000$ 1,000,000$ 1,000,000$ 450,000$
(33) Total Annual General Fund Expenditures (Sum Lines 31+32) 9,950,220$ 9,110,940$ 9,490,838$ 8,686,752$ 9,593,440$ 10,823,489$ 11,076,862$ 12,304,518$ 13,709,861$ 14,319,094$ 15,074,966$ 15,541,401$ 15,461,706$
Expenses
FISCAL YR 15/16
FISCAL YR 16/17GENERAL FUND EXPENDITURES
FISCAL YR 13/14
FISCAL YR 14/15
FISCAL YR 10/11
FISCAL YR 11/12
FISCAL YR 12/13
FISCAL YR 09/10
FISCAL YR 17/18
FISCAL YR 18/19
FISCAL YR 19/20
FISCAL YR 20/21
FISCAL YR 21/22
Historical Trend Increase/year for Locally
Controlled Expenses
vii
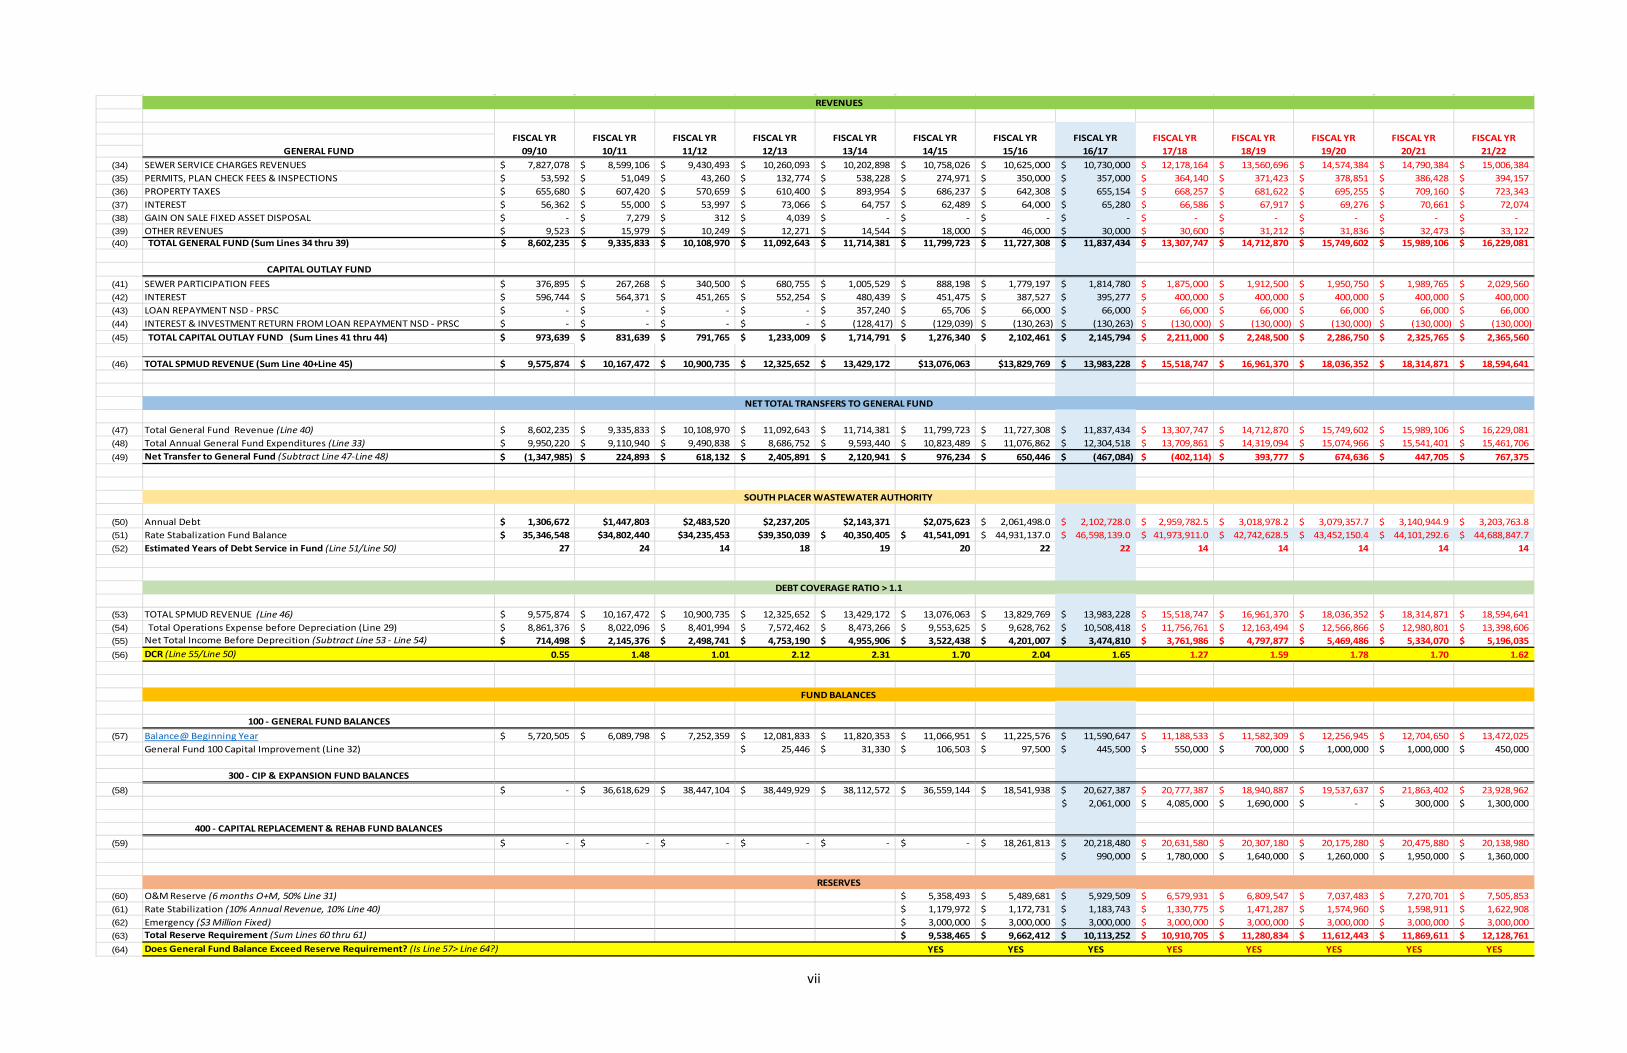
(34) SEWER SERVICE CHARGES REVENUES 7,827,078$ 8,599,106$ 9,430,493$ 10,260,093$ 10,202,898$ 10,758,026$ 10,625,000$ 10,730,000$ 12,178,164$ 13,560,696$ 14,574,384$ 14,790,384$ 15,006,384$ (35) PERMITS, PLAN CHECK FEES & INSPECTIONS 53,592$ 51,049$ 43,260$ 132,774$ 538,228$ 274,971$ 350,000$ 357,000$ 364,140$ 371,423$ 378,851$ 386,428$ 394,157$ (36) PROPERTY TAXES 655,680$ 607,420$ 570,659$ 610,400$ 893,954$ 686,237$ 642,308$ 655,154$ 668,257$ 681,622$ 695,255$ 709,160$ 723,343$ (37) INTEREST 56,362$ 55,000$ 53,997$ 73,066$ 64,757$ 62,489$ 64,000$ 65,280$ 66,586$ 67,917$ 69,276$ 70,661$ 72,074$ (38) GAIN ON SALE FIXED ASSET DISPOSAL -$ 7,279$ 312$ 4,039$ -$ -$ -$ -$ -$ -$ -$ -$ -$ (39) OTHER REVENUES 9,523$ 15,979$ 10,249$ 12,271$ 14,544$ 18,000$ 46,000$ 30,000$ 30,600$ 31,212$ 31,836$ 32,473$ 33,122$ (40) TOTAL GENERAL FUND (Sum Lines 34 thru 39) 8,602,235$ 9,335,833$ 10,108,970$ 11,092,643$ 11,714,381$ 11,799,723$ 11,727,308$ 11,837,434$ 13,307,747$ 14,712,870$ 15,749,602$ 15,989,106$ 16,229,081$
CAPITAL OUTLAY FUND(41) SEWER PARTICIPATION FEES 376,895$ 267,268$ 340,500$ 680,755$ 1,005,529$ 888,198$ 1,779,197$ 1,814,780$ 1,875,000$ 1,912,500$ 1,950,750$ 1,989,765$ 2,029,560$ (42) INTEREST 596,744$ 564,371$ 451,265$ 552,254$ 480,439$ 451,475$ 387,527$ 395,277$ 400,000$ 400,000$ 400,000$ 400,000$ 400,000$ (43) LOAN REPAYMENT NSD - PRSC -$ -$ -$ -$ 357,240$ 65,706$ 66,000$ 66,000$ 66,000$ 66,000$ 66,000$ 66,000$ 66,000$ (44) INTEREST & INVESTMENT RETURN FROM LOAN REPAYMENT NSD - PRSC -$ -$ -$ -$ (128,417)$ (129,039)$ (130,263)$ (130,263)$ (130,000)$ (130,000)$ (130,000)$ (130,000)$ (130,000)$ (45) TOTAL CAPITAL OUTLAY FUND (Sum Lines 41 thru 44) 973,639$ 831,639$ 791,765$ 1,233,009$ 1,714,791$ 1,276,340$ 2,102,461$ 2,145,794$ 2,211,000$ 2,248,500$ 2,286,750$ 2,325,765$ 2,365,560$
(46) TOTAL SPMUD REVENUE (Sum Line 40+Line 45) 9,575,874$ 10,167,472$ 10,900,735$ 12,325,652$ 13,429,172$ $13,076,063 $13,829,769 13,983,228$ 15,518,747$ 16,961,370$ 18,036,352$ 18,314,871$ 18,594,641$
(47) Total General Fund Revenue (Line 40) 8,602,235$ 9,335,833$ 10,108,970$ 11,092,643$ 11,714,381$ 11,799,723$ 11,727,308$ 11,837,434$ 13,307,747$ 14,712,870$ 15,749,602$ 15,989,106$ 16,229,081$ (48) Total Annual General Fund Expenditures (Line 33) 9,950,220$ 9,110,940$ 9,490,838$ 8,686,752$ 9,593,440$ 10,823,489$ 11,076,862$ 12,304,518$ 13,709,861$ 14,319,094$ 15,074,966$ 15,541,401$ 15,461,706$ (49) Net Transfer to General Fund (Subtract Line 47-Line 48) (1,347,985)$ 224,893$ 618,132$ 2,405,891$ 2,120,941$ 976,234$ 650,446$ (467,084)$ (402,114)$ 393,777$ 674,636$ 447,705$ 767,375$
(50) Annual Debt 1,306,672$ $1,447,803 $2,483,520 $2,237,205 $2,143,371 $2,075,623 2,061,498.0$ 2,102,728.0$ 2,959,782.5$ 3,018,978.2$ 3,079,357.7$ 3,140,944.9$ 3,203,763.8$ (51) Rate Stabalization Fund Balance 35,346,548$ $34,802,440 $34,235,453 $39,350,039 40,350,405$ 41,541,091$ 44,931,137.0$ 46,598,139.0$ 41,973,911.0$ 42,742,628.5$ 43,452,150.4$ 44,101,292.6$ 44,688,847.7$ (52) Estimated Years of Debt Service in Fund (Line 51/Line 50) 27 24 14 18 19 20 22 22 14 14 14 14 14
(53) TOTAL SPMUD REVENUE (Line 46) 9,575,874$ 10,167,472$ 10,900,735$ 12,325,652$ 13,429,172$ 13,076,063$ 13,829,769$ 13,983,228$ 15,518,747$ 16,961,370$ 18,036,352$ 18,314,871$ 18,594,641$ (54) Total Operations Expense before Depreciation (Line 29) 8,861,376$ 8,022,096$ 8,401,994$ 7,572,462$ 8,473,266$ 9,553,625$ 9,628,762$ 10,508,418$ 11,756,761$ 12,163,494$ 12,566,866$ 12,980,801$ 13,398,606$ (55) Net Total Income Before Deprecition (Subtract Line 53 - Line 54) 714,498$ 2,145,376$ 2,498,741$ 4,753,190$ 4,955,906$ 3,522,438$ 4,201,007$ 3,474,810$ 3,761,986$ 4,797,877$ 5,469,486$ 5,334,070$ 5,196,035$ (56) DCR (Line 55/Line 50) 0.55 1.48 1.01 2.12 2.31 1.70 2.04 1.65 1.27 1.59 1.78 1.70 1.62
100 - GENERAL FUND BALANCES(57) Balance@ Beginning Year 5,720,505$ 6,089,798$ 7,252,359$ 12,081,833$ 11,820,353$ 11,066,951$ 11,225,576$ 11,590,647$ 11,188,533$ 11,582,309$ 12,256,945$ 12,704,650$ 13,472,025$
General Fund 100 Capital Improvement (Line 32) 25,446$ 31,330$ 106,503$ 97,500$ 445,500$ 550,000$ 700,000$ 1,000,000$ 1,000,000$ 450,000$
300 - CIP & EXPANSION FUND BALANCES(58) -$ 36,618,629$ 38,447,104$ 38,449,929$ 38,112,572$ 36,559,144$ 18,541,938$ 20,627,387$ 20,777,387$ 18,940,887$ 19,537,637$ 21,863,402$ 23,928,962$
2,061,000$ 4,085,000$ 1,690,000$ -$ 300,000$ 1,300,000$
400 - CAPITAL REPLACEMENT & REHAB FUND BALANCES(59) -$ -$ -$ -$ -$ -$ 18,261,813$ 20,218,480$ 20,631,580$ 20,307,180$ 20,175,280$ 20,475,880$ 20,138,980$
990,000$ 1,780,000$ 1,640,000$ 1,260,000$ 1,950,000$ 1,360,000$
(60) O&M Reserve (6 months O+M, 50% Line 31) 5,358,493$ 5,489,681$ 5,929,509$ 6,579,931$ 6,809,547$ 7,037,483$ 7,270,701$ 7,505,853$ (61) Rate Stabilization (10% Annual Revenue, 10% Line 40) 1,179,972$ 1,172,731$ 1,183,743$ 1,330,775$ 1,471,287$ 1,574,960$ 1,598,911$ 1,622,908$ (62) Emergency ($3 Million Fixed) 3,000,000$ 3,000,000$ 3,000,000$ 3,000,000$ 3,000,000$ 3,000,000$ 3,000,000$ 3,000,000$ (63) Total Reserve Requirement (Sum Lines 60 thru 61) 9,538,465$ 9,662,412$ 10,113,252$ 10,910,705$ 11,280,834$ 11,612,443$ 11,869,611$ 12,128,761$ (64) Does General Fund Balance Exceed Reserve Requirement? (Is Line 57> Line 64?) YES YES YES YES YES YES YES YES
FISCAL YR 18/19
FISCAL YR 19/20
FISCAL YR 20/21
FISCAL YR 21/22
RESERVES
REVENUES
GENERAL FUNDFISCAL YR
09/10FISCAL YR
10/11FISCAL YR
11/12FISCAL YR
12/13FISCAL YR
13/14FISCAL YR
14/15 FISCAL YR
15/16 FISCAL YR
16/17
NET TOTAL TRANSFERS TO GENERAL FUND
SOUTH PLACER WASTEWATER AUTHORITY
DEBT COVERAGE RATIO > 1.1
FUND BALANCES
FISCAL YR 17/18
viii
Appendix D Capital Investment Plan FY 2017/18 through FY 2021/22
Project Description Justification Est CostFunding Source
Est # Cust. Impacted Priority
Project Name Location of project and estimated take-off Order of Magnitude
See Notes
(1-5) See Notes
GF R&R SECAP GF R&R SECAP GF R&R SECAP GF R&R SECAP GF R&R SECAP GF R&R SECAP
Foothill Trunk Replacement Project From Secret Ravine to El Don Rd.(Replace 12" with 24" - 2800 LF)
Identified in SECAP as near-term project. $1.10 M SECAP 5 $0.06 M $1.10 M
Loomis Diversion Line From the south end of Dias Lane to Raley's on Horseshoe Bar Rd. (15" and 18" 7,300 LF)
Identifed in SECAP and previous master plans. $2.70 M SECAP 5 $2.70 M
Lower Clover Valley (Lower Antelope Creek) Trunk Sewer
From Sunset Blvd, South to the intersection of Meadowdale Dr & Twin Creeks Ln 13 segments (27”) (3,600 LF)
Identified in SECAP as near-term project and identified in HRF. $1.98 M SECAP 2,450 5 $0.06 M $0.29 M $1.69 M
HRF Creek Crossings Crossings identified in HRF Identified in HRF. $1.50 M R&R ? 5 $0.04 M $0.30 M $0.30 M $0.30 M $0.30 M $0.30 MCIPP 2017 21 segments (8”-12”) (6,600 LF) Eliminate roots and I/I as potential causes of SSOs. $0.50 M R&R ? 4 $0.50 M $0.50 MCIPP 2018 10 segments (6”-12”) (2,900 LF) Eliminate roots and I/I as potential causes of SSOs. $0.30 M R&R 4 - $0.30 MCIPP Projects Planned annual CIPP rehab projects. Eliminate roots and I/I as potential causes of SSOs. $0.90 M R&R 4 $0.30 M $0.30 M $0.30 M
Jack in the Box Line 1 segment (6” ACP) (350 LF) Relocate old main in parking to correct bends and sags and eliminate a hot spot.
$0.20 M R&R 4 4 - $0.20 M
Whitney BlvdK07-042
Deep.1 segment (8" 313LF with 7 laterals)
Eliminate hot spot. $0.20 M R&R 4 - $0.20 M
Los Flores Sewer Realignment 3 segments (6”) (760 LF) Eliminate hot spot and improve access. $0.30 M R&R / GF
6 3 $0.15 M $0.15 M
Cameo Ct Lift Station Abandonment Construction of peak storage facility. Bore and jack crossing of Stanford Ranch Rd. Installation of flow recorder facility.
Eliminate one of District's largest lift stations. $1.70 M R&R / GF
1,200 2 - - $0.10 M $0.10 M $0.75 M $0.75 M
Newcastle Fire Station Extension Extend main to connect tenants on UPRR property and abandon line behind fire station. 1 segment (8” 200 LF)
NOTE: Contigent of construction of Newcastle Fire Station. $0.20 M GF 4 3 - $0.20 M
Live Oak LineL10-005
Replace 6" with 8" PVC.1 segment (8” PVC 570 LF)
Eliminate hot spot (sags). $0.20 M R&R 1 3 - $0.20 M
Woodside 10” LineI08-010 - H08-047
4 segments (10" 88LF), 1 segment (6" 100LF) Eliminate hot spots by removing drop @ MH. $0.50 M R&R 3 - $0.50 M
Sunset Whitney 6” LineK08-040
Excavate/repair 3 locations to fix sags. Install CIPP liner full length.1 segment (6" VCP 364LF)
Eliminate hot spot (roots and sags). $0.10 M R&R 1 - $0.10 M
Fiberboard Trunk BReplace remaining portions of parallel trunk sewer with one 18” trunk (1400 LF) between Garnet Creek Single Family and Loomis Basin Flow Recorder.
Create one continuous 18" trunk sewer as shown in SECAP and remove the splitter structures constructed by recent construction/development.
$1.60 M SECAP 2 $0.30 M $1.30 M
Springview Dr. Relocation Move sewer out from under sideyard and out of parking lot in front of SPMUD.3 segments (8” 540 LF)
Improve access to sewer line. $0.30 M R&R 29 1 - $0.30 M
White Oak Ct Pipe RepairJ08-045, J08-073
Pipe in back yard. Hand dig with District forces. Eliminate hot spot. $0.05 M R&R 18 1 $0.05 M
Keller CtNear I09-026
Replace 1 segment (275LF of 4" with 6"), Install 2 manholes, connect 5 laterals.
Improve existing private creek crossing and make it a public facility.
$0.10 M GF 5 1 $0.10 M
Rocklin Rd & PacificJ08-014
Replace 1 segment (6" VCP 232LF) Eliminate hot spot (sags). $0.10 M R&R 75 2 $0.10 M
Newcastle Master Plan See Newcastle Master Plan for projects. Improve the reliability of the system. $1.0 M GF 4 $0.20 M $0.20 M $0.20 M $0.20 M $0.20 MCorp Yard Master Plan See Corp Yard Master Plan for projects. Improve the use of the Corp Yard. $0.50 M GF NA 2 $0.05 M $0.30 M $0.05 M $0.05 M $0.05 MEnergy Upgrades Energy efficient upgrades at the Corp Yard. Improve sustainability of operations. $0.40 M GF NA 2 $0.20 M $0.20 M
Vehicle Replacement SOURCE: 10-year Vehicle Replacement Schedule Spreadsheet Maintain an effective and productive fleet. $1.15 M R&R / GF
3 $0.45 M $0.58 M $0.04 M $0.21 M $0.20 M $0.11 M
Lateral Liners See Lateral Liners for projects. Eliminate roots and I/I as potential causes of SSOs. $1.0 M R&R 5 $0.20 M $0.20 M $0.20 M $0.20 M $0.20 M
GF R&R SECAP GF R&R SECAP GF R&R SECAP GF R&R SECAP GF R&R SECAP GF R&R SECAP$0.0 M $0.99 M $0.12 M $0.55 M $1.78 M $4.09 M $0.70 M $1.64 M $1.69 M $0.50 M $1.26 M $0.0 M $1.0 M $1.95 M $0.30 M $0.45 M $1.36 M $1.30 M
FY21-22
FY16-17 FY17-18 FY18-19 FY19-20 FY20-21 FY21-22
FY16-17 FY17-18 FY18-19 FY19-20 FY20-21
Appendix "D"Capital Investment Plan FY 2017-18 through Fy 2021-22
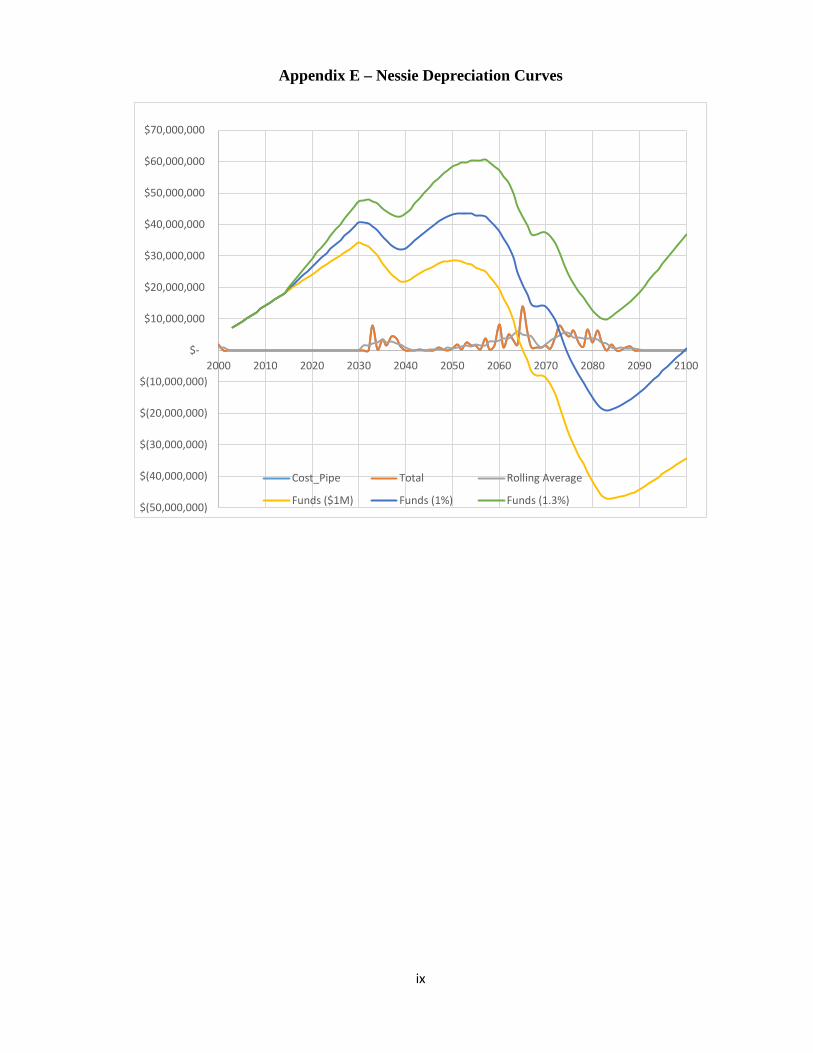
ix
Appendix E – Nessie Depreciation Curves
$(50,000,000)
$(40,000,000)
$(30,000,000)
$(20,000,000)
$(10,000,000)
$-
$10,000,000
$20,000,000
$30,000,000
$40,000,000
$50,000,000
$60,000,000
$70,000,000
2000 2010 2020 2030 2040 2050 2060 2070 2080 2090 2100
Cost_Pipe Total Rolling Average
Funds ($1M) Funds (1%) Funds (1.3%)