south-south strategies of agro-timber companies in ... cirad malaysia.pdfsime darby is significantly...
TRANSCRIPT
Ecole Supérieure du Bois
Centre de Coopération Internationale en Recherche Agronomique
pour le Développement
South-south strategies of Agro-timber companies in
Malaysia and Indonesia (within Indian and Chinese
industrial networks)
Third year internship report
Rafael PALHIARIM TOBIAS Promotion 77
Rafael PALHIARIM TOBIAS Promotion 77
2
ABSTRACT
Timber and palm oil sectors have a large economic relevance in Malaysia and Indonesia,
however they are frequently related on environmental and social issues. Despite the efforts
of many organizations and governments to assuage the situation, the impacts of these
sectors are still in alarming levels. The companies operating in Southeast Asia have a
different ownership structure from those known in western countries. This study aim to
understand the role played by foreign and domestic investments by assessing companies in
the palm oil and timber sectors working in Malaysia and Indonesia determining the links
between the companies’ behavior and their structure. The social network of four key groups
on the Palm Oil / timber sector were analyzed, taking into account the ownership as a link
between the main actors of the network and performing analysis of variance (ANOVA) in
order to verify if factors such as the strategy, ethnicity and nationality of these companies
influence their behavior. Average Shortest path length, control shareholding betweenness,
eccentricity, shareholder degree and clustering coefficient were identified as useful
parameters to discriminate the 4 groups. Sime Darby is significantly different from the 3
others. The study shows that companies as WTK, Ta Ann and Olam are flexibly in terms of
adaptation and that there is no significant difference between Indian and Chinese, but that
these two are significantly different from the “non ethnic”corporation. It is remarkable that
the type of ownership and the investment strategy because family owned groups use to
have a related investment strategy and government owned groups have a portfolio
investment strategy. The study has a new approach to assess the companies in the oil plam/
timber sector and should be applied for other groups. It is essential to add sustainability
factors such certification to understand what drives companies to adopt such procedure.
The methods adopted in this study are an important tool and should be applied for other
groups in countries covered by CRP6, adding an important range of useful information for
the component 5.
Key words: Social Network analysis, company strategies, palm oil.
Rafael PALHIARIM TOBIAS Promotion 77
3
RÉSUMÉ
Les secteurs de l'huile de palme et de bois ont une grande importance économique en
Malaisie et en Indonésie, mais ils sont souvent liés aux questions environnementales et
sociales. Malgré les efforts de nombreuses organisations et gouvernements à améliorer
cette situation, les impacts de ces secteurs sont encore à des niveaux alarmants. Les
entreprises opérant dans les secteurs ont des structures de propriété différentes de celles
connus dans les pays occidentaux. Cette étude vise à comprendre le rôle joué par les
investissements étrangers et nationaux en évaluant les entreprises des secteurs du palme à
huile et bois qui travaillent en Malaisie et en Indonésie déterminant les liens entre le
comportement des entreprises et de leur structure. Le réseau social de quatre groupes clés
sur le secteur de l'huile de palme et bois ont été analysés en tenant compte de la propriété
comme un lien entre les principaux acteurs du réseau. L’exécution l'analyse de variance
(Anova) afin de vérifier si des facteurs tels que la stratégie, l'appartenance ethnique et la
nationalité de ces entreprises influencent leur comportement. Le Moyen plus court trajet,
l’intermédiarité de contrôle par actionnariat, excentricité, en-degré et le coefficient de
regroupement ont été identifiés comme utile pour discriminer les 4 groupes. Sime Darby est
significativement différente des autres trois groupes. L'étude montre que les entreprises
comme WTK, Ta Ann et Olam sont flexible en termes d'adaptation. Il est remarquable que le
type de propriété et de la stratégie: les groupes familiaux adoptent une stratégie
d’investissement connexe et le group appartenant à l'État a une stratégie d'investissement
de portefeuille. Il n'y a pas de différence significative entre les groupes indiens et chinois,
mais que ces deux sont significativement différente de la société "non ethnique". L'étude
présente une nouvelle approche pour évaluer les entreprises dans le secteur d’huile de
palme et bois et devrait être appliquée à d'autres groupes. Il est essentiel d'ajouter des
facteurs de durabilité telle que la certification pour comprendre ce qui pousse les
entreprises à adopter une telle procédure. Les méthodes adoptées dans cette étude sont un
outil important et devraient être appliqués à d'autres groupes dans les pays couverts par le
projet CRP6, ce qui ajoute une gamme importante d'informations utiles pour la composante
5.
Mots clés: analyse de réseaux sociaux, stratégie d’entreprise, huile de palme.
Rafael PALHIARIM TOBIAS Promotion 77
4
ACKNOWLEDGMENTS
It gives me great pleasure to express my sincere thanks and gratitude to my supervisor Dr. Jean Marc Roda, who not only accepted me as a trainee in CIRAD, but also greatly helped me to adapt myself for a new country and to continuously helping me in my work. I am indebted to CIRAD and UPM, for extending all the facilities to carry out the research work without which it would not have been possible to carry out this work. My sincere acknowledgements to Campus France and École Supérieure du Bois for giving me the opportunity to make this exchange program. I record my appreciation and sincere thanks to all the employees of INTROP – UPM. Similarly, my thanks are also for many of my friends of France and Malaysia, particularly to Paul Corbineau and Laura Le Gal.
Rafael PALHIARIM TOBIAS Promotion 77
5
EXECUTIVE SUMARY
1. INTRODUCTION
Timber and palm oil sectors have an increasing demand and a large economic relevance in
Malaysia and Indonesia, however they are frequently related as the main responsible for the
degradation and destruction of primary forests and the pressure on the indigenous people
areas. Despite the efforts of many organizations and governments to assuage the situation,
the impacts of these sectors are still in alarming levels. The companies operating in the
sectors have different ownership structures from those known in western countries. In this
context is imperative a comprehension about the structure of these companies operating in
the sectors. This study aim to understand the role played by foreign and domestic
investments by assessing companies in the palm oil and timber sectors working in Malaysia
and Indonesia determining the links between the companies’ behavior and their structure,
this study is proposes to investigate the strategies these companies in the palm oil and
timber sectors through the analyses of their ownership structure. Improving and providing
information integrating the CRP6 project.
2. METHODS
For this study exploratory and inferential study, we assume that the structure of the
companies have effects on their behavior. Four groups of companies were analyzed WTK
Holding Berhad, Ta Ann Berhad, Sime Darby and Olam International Limited, they are key
groups on the Palm Oil / timber sector running economic activities in Malaysia and
Indonesia. Initially through the analysis of their social networks taking into account the
ownership as link between the main actors of the network. In a second phase the study
performs analysis of varience (ANOVA) in order to verify if factors such as the strategy,
ethnicity and nationality of these companies influence their behavior.
3. RESULTS
In the first stage of data analysis is observed a large concentration of capital, three
companies owned by families: WTK, Ta Ann and Olam, and one company owned by the
government of Malaysia family members on Ta Ann Holding Berhad. In the second stage
metric analysis were checked which metrics discriminate the 4 groups, and which don’t. It
was found that Average Shortest path length, Control shareholding betweenness, Eccentric,
Indegree and Clustering coefficient can be used to discriminate the 4 groups. Sime Darby is
significantly different from the 3 others for the first four parameters while olam are
Rafael PALHIARIM TOBIAS Promotion 77
6
significantly different from the others in clustering coefficients. A last stage was discriminate
between the ethnicity of companies, and how they eventually relate to the Ethnicity,
Strategy, Nationality and Corporation factors.
4. DISCUSSIONS
WTK, Ta Ann and Olam can be flexibly in terms of adaptation, because the flow of
information is faster, it means that the companies have an ability to adapt in case of
economic changes. There is a significant difference between ethnicities for the average
ownership tier (Anova). A close look tells us that There is no significant difference between
Indian and Chinese, but that these two are significantly different from the “non
ethnic”corporation. Ownership and strategy influence the behavior of more companies
should be assed in other countries to understand the effects of nationality. What is
remarkable is the type of ownership and the strategy, family owned groups use to have a
related investment strategy and government owned groups have a portfolio investment
strategy.
5. CONCLUSIONS AND FUTURE PROPECTS
The four companies have concentrated capital meanwhile they present different structures,
the three groups controlled by families have different structures when compared with
government-controlled group. The study also concludes another important fact, ethnicity it
not factor that affects the company structure, the difference lies mainly in the ownership
structure (family/ government). It is essential to add sustainability factors such certification
to understand what drives companies to adopt such procedure. The study has a new
approach to assess the companies in the oil plam/ timber sector and should be applied for
other groups. The methods adopted in this study are an important tool and should be
applied for other groups in countries covered by CRP6, adding an important range of useful
information for the component 5.
Rafael PALHIARIM TOBIAS Promotion 77
7
CONTENTS ABSTRACT ................................................................................................................................................ 2
RÉSUMÉ ................................................................................................................................................... 3
ACKNOWLEDGMENTS ............................................................................................................................. 4
EXECUTIVE SUMARY ................................................................................................................................ 5
1. INTRODUCTION ............................................................................................................................... 8
1.1 Foreword ............................................................................................................................. 8
1.2 Study contex ........................................................................................................................ 9
1.3 Research question ............................................................................................................. 10
1.4 Objective ............................................................................................................................ 11
2. METHODS ...................................................................................................................................... 11
2.1 Business groups ................................................................................................................. 12
2.2 Corporate structure ........................................................................................................... 12
2.3 Social network analysis ...................................................................................................... 14
2.4 Modeling a network .......................................................................................................... 15
3. RESULTS ......................................................................................................................................... 16
3.1 Network visualization ........................................................................................................ 17
3.2 Analysis of metrics ............................................................................................................. 20
3.3 Metrics and attributes ....................................................................................................... 30
4. DISCUSSIONS ................................................................................................................................. 34
5. CONCLUSIONS AND FUTURE PROPECTS ........................................................................................ 35
GLOSSARY OF PARAMETERS .................................................................................................................. 36
REFERENCES .......................................................................................................................................... 38
Rafael PALHIARIM TOBIAS Promotion 77
8
1. INTRODUCTION
1.1 Foreword
The work is a part of the Consultative Group on International Agricultural Research (CGIAR) Research Program No. 6: Forests, Trees and Agroforestry: Livelihoods, Landscapes and Governance (CRP6), and was conducted with the support and supervision of the Centre for International Cooperation in Agronomic Research for Development (CIRAD).
Under the authority of the French government, Cirad is a center specialized in
agricultural research in tropical areas [1], it has as organization structure the division in three scientific departments which bring together all of its research units: Biological systems (BIOS), performance of production systems and tropical transformation (Persyst), Environments and Societies (ES) [2].
Within the Persyst scientific department, the unit Biomass, Wood, Energy and
Bioproducts develops research works in Malaysia, where it has a partnership with the University Putra Malaysia (UPM) since 2011 and an expatriate researcher specialized in forest products and timber economics, Dr. Jean Marc Roda, who supervise this study.
CIRAD also develops activities with other research centers in an international scope. In
the context of this study, CIRAD engages with the Center for International Forestry Research (CIFOR) for the CRP6 [3]. CRP6: Forests, Trees and Agroforestry is a global research program conducted by four international research centers (CIFOR, ICRAF, CIAT and Bioversity International), officially implemented in 2011. It is a global partnership to launch new collaborations, to share scientific knowledge and technical skills. The aim is to improve the management of forests and agroforestry systems for the sustainable provision of goods and services, such as timber, non-timber products and food and environmental services in the context of pressure on the land and climate change for the benefit of the poorest and natural resources dependents, demonstrating the important role of natural forests as "carbon sinks" that can help slow the pace of climate change and the need to conserve biodiversity will focus on areas where forests and agroforestry systems that play an important role in local livelihoods and carbon sequestration [4].
The CRP6 project is led by CIFOR (one of the 15 specialized research centers of CGIAR)
which has its headquarters in Bogor, Indonesia. CIFOR was founded in 1992 as a result of the
UN Conference on Environment and Development (UNCED) [5].
It is important to notice that the CRP6 is not a standalone project, but a large number
of projects and studies carried out by the institutions already mentioned and other partners,
due to the complexity of this research program, research centers partners, divide the tasks,
focusing efforts on different topic basis, which generically called components, CRP6 has 5
Rafael PALHIARIM TOBIAS Promotion 77
9
components: 1) Smallholder production systems and markets; 2) Management and
conservation of forest and tree resources; 3) Landscape management of forested areas for
environmental services, 4) Climate change adaptation and mitigation; 5) Impacts of trade
and investment on forests and people [6].
This present work belongs the theme 1 of the component 5: Understanding the
processes and impacts of forest-related trade and investment, with a geographic focus on
Malaysia, Indonesia and Singapore.
1.2 Study contex
The region we know as Malaysia, Indonesia and Singapore, have been an important
area of commerce and trade since the 7th century, this region was the territory of two
talassocratic empires: the Srivijayas [7] and afterwards the Majapahit [8] until the beginning
of the 14th century. The region traded with India and China which in turn had great cultural
influence in it, then with the arrival of Europeans in the 16th century, further intensified the
trade and the industrial development. All this common historical background shapes the
cultural and political aspects of these countries as we know them today [9].
The region had in recent decades a strong economic growth, Malaysia, for example,
has shown annual growth rates of GDP above 5% according to the World Bank [10] and also
have strong domestic consumer market and large populations as is the case of Indonesia
being the fourth most populous in the world, 241 million inhabitants [11]. The region is in
the same bioclimatic zone: rainforest, and features lots of natural resources in areas such as
agriculture, forestry and minerals.
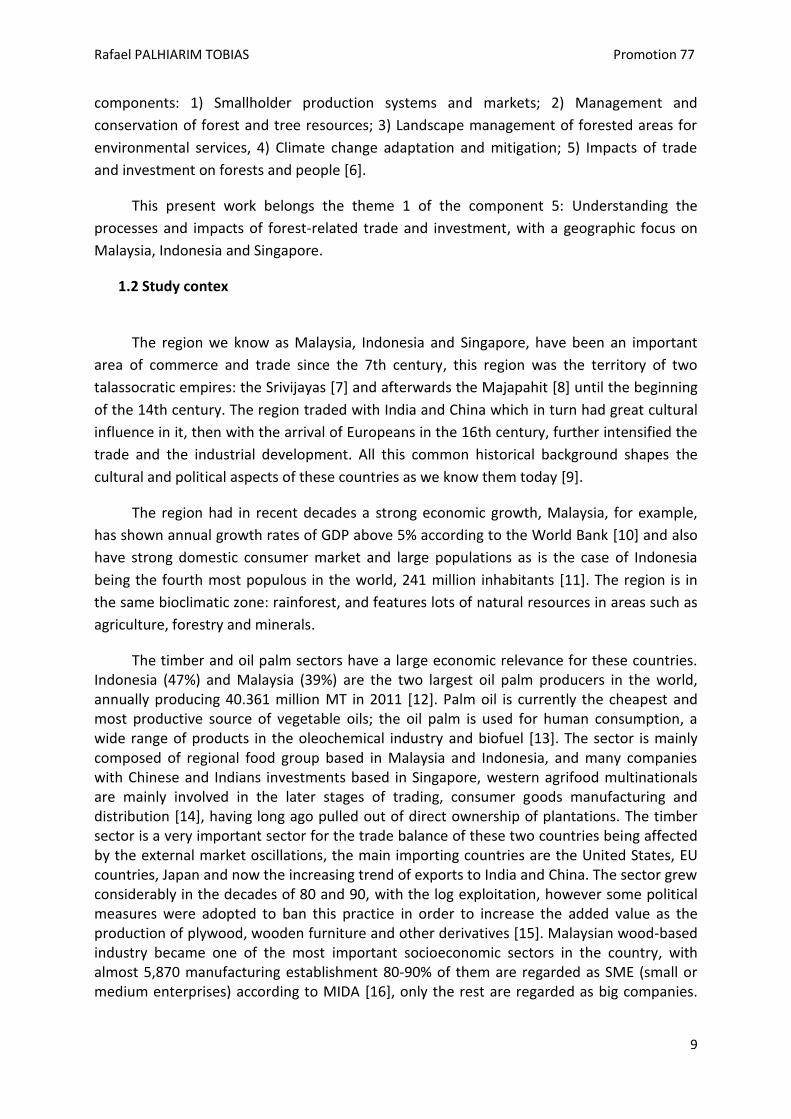
The timber and oil palm sectors have a large economic relevance for these countries. Indonesia (47%) and Malaysia (39%) are the two largest oil palm producers in the world, annually producing 40.361 million MT in 2011 [12]. Palm oil is currently the cheapest and most productive source of vegetable oils; the oil palm is used for human consumption, a wide range of products in the oleochemical industry and biofuel [13]. The sector is mainly composed of regional food group based in Malaysia and Indonesia, and many companies with Chinese and Indians investments based in Singapore, western agrifood multinationals are mainly involved in the later stages of trading, consumer goods manufacturing and distribution [14], having long ago pulled out of direct ownership of plantations. The timber sector is a very important sector for the trade balance of these two countries being affected by the external market oscillations, the main importing countries are the United States, EU countries, Japan and now the increasing trend of exports to India and China. The sector grew considerably in the decades of 80 and 90, with the log exploitation, however some political measures were adopted to ban this practice in order to increase the added value as the production of plywood, wooden furniture and other derivatives [15]. Malaysian wood-based industry became one of the most important socioeconomic sectors in the country, with almost 5,870 manufacturing establishment 80-90% of them are regarded as SME (small or medium enterprises) according to MIDA [16], only the rest are regarded as big companies.
Rafael PALHIARIM TOBIAS Promotion 77
10
The situation in Indonesia differs because the country is further directed towards pulp and paper sector, which contributes to around 1.8 % of GDP of the country [17]. It is important to focus on the fact that both sectors, palm oil and timber, are interconnected by the fact that many companies are working in both sectors, as is the case for Sinar Mas in Indonesia, with subsidiaries in the two sectors.
The two sectors are frequently related as the main responsible for the degradation and
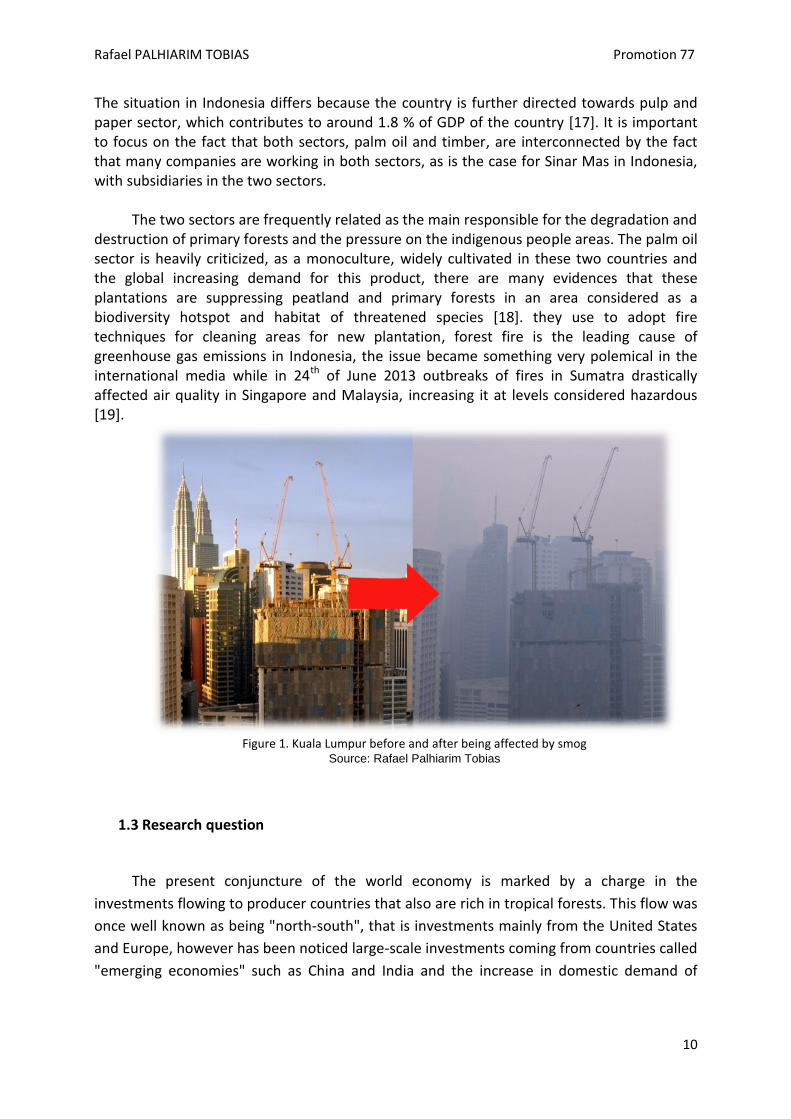
destruction of primary forests and the pressure on the indigenous people areas. The palm oil sector is heavily criticized, as a monoculture, widely cultivated in these two countries and the global increasing demand for this product, there are many evidences that these plantations are suppressing peatland and primary forests in an area considered as a biodiversity hotspot and habitat of threatened species [18]. they use to adopt fire techniques for cleaning areas for new plantation, forest fire is the leading cause of greenhouse gas emissions in Indonesia, the issue became something very polemical in the international media while in 24th of June 2013 outbreaks of fires in Sumatra drastically affected air quality in Singapore and Malaysia, increasing it at levels considered hazardous [19].
Figure 1. Kuala Lumpur before and after being affected by smog
Source: Rafael Palhiarim Tobias
1.3 Research question
The present conjuncture of the world economy is marked by a charge in the
investments flowing to producer countries that also are rich in tropical forests. This flow was
once well known as being "north-south", that is investments mainly from the United States
and Europe, however has been noticed large-scale investments coming from countries called
"emerging economies" such as China and India and the increase in domestic demand of
Rafael PALHIARIM TOBIAS Promotion 77
11
others countries located in tropical zones for goods, all this factors are contributing to the
pressure on tropical forests.
The companies operating in Asia have different ownership structures from those
known in Europe and the United States, as already mentioned by La Porta (1999) [20]. In
order to understand the strategies of these companies, it is important to determine what are
the links between the companies’ behavior and their structure, this study proposes to
investigate the strategies of these companies in the palm oil and timber sectors through the
analyses of their ownership structure.
1.4 Objective
This component has the aim to understand the role played by foreign and domestic
investments by assessing companies in the palm oil and timber sectors working in Malaysia
and Indonesia, said as “Emerging transnational corporations”, corporations such as Ta Ann,
WTK, Sime Darby and OLAM. Analyzing their ownership structure, investment strategies in
timber and palm oil sectors, produces a typology of these analyzes answering specific
objectives:
To provide understanding of the strategies of the main actors of change and
business companies related to forestry in developing countries to adapt to a
paradigm of green economy;
To improve knowledge of the role of public and private investors in defining
strategies of land use and energy, with implications for GHG emissions in the context
of changing strategies among emerging economies and supply countries;
To evaluate the transitions changing landscape as a result of foreign
investment and national public and private arrangements and their likely implications
for forests thus proportioned the set-on of the contribution of CIRAD - UPM in the
context of the CGIAR project: " Emerging countries in transition to a green economy:
Will it make a difference for forests and people?"
2. METHODS
Rafael PALHIARIM TOBIAS Promotion 77
12
For this study, which we can qualify as exploratory and inferential, we assume that the
structure of the companies have some influence on their behaviors. Four groups of
companies were analyzed; they are key groups on the Palm Oil / timber sector running
economic activities in Malaysia, Singapore and Indonesia. Initially, through the analysis of
their social networks taking into account the ownership as a link between the main actors of
the network. In a second stage, the study performs variance analysis in order to verify if
attributes such as strategy, ethnicity and nationality of these companies influence their
behavior.
2.1 Business groups
The four groups assessed in this study are officially named as WTK Holding Berhad, Ta Ann Holding Berhad, Sime Darby Berhad and Olam International Limited. These groups are business groups, according to Zahang et al (2008) [21] a business group is a set of companies that are bound together by shareholding as well as by various means of coordination mechanisms.
The business groups assessed have companies operating in Malaysia and Indonesia as
well as investments in other countries mainly in Africa and South America, working in different sectors: from insurance, motors and tapes to food sector. The groups concerned are listed on stock exchanges in Kuala Lumpur and Singapore which allows us to obtain a certain level of information about their investments and their ownership structure. WTK Holding Berhad, Ta Ann Holding Berhad and Sime Darby Berhad are listed on the Kuala Lumpur Stock Exchange (KLSE), while OLAM International Limited is listed on the Singapore Stock Exchange.
These groups were selected due to the fact that they are relevant in terms of
production on the sectors concerned; they are also target of criticism for their activities in these two sectors being present on reports and papers of NGOs and other international organizations. They claim that their corporate structure is opaque, lacking in transparency about their investments and operations.
2.2 Corporate structure
To understand their structure, the four business groups were assessed by evaluating
some attributes such as ownership, strategy, nationality and ethnicity, it is due to the
importance of checking whether one of these factors lead to a significant influence on
corporate behavior.
2.2.1 Ownership
The ownership is taken as connection attribute between groups and their subsidiaries and managers, this attribute is important given the effect it has on the way that companies
Rafael PALHIARIM TOBIAS Promotion 77
13
operate and organize themselves, which is important to clarify about ownership are the two formal rights that it gives: the right to control the company and the right on profits[22].
Regarding the company's control, decision taking and voting rights varies widely
among regions of the globe. This phenomenon is explained by the concentration of capital, on which is smaller in Anglo-Saxons countries as United States and England, which companies usually have many shareholders, or are companies “widely held”, however in Southeast Asian countries we can observe a higher concentration of capital and having ultimate owners as companies run by families. The study is concerned to investigate the companies with ultimate owners, if they are possessed by families or government [20].
Claessens et al. (1999) found that ultimate controlling shareholders are common for
corporations in East Asia. Where two-thirds of the corporations as being controlled by a
single ultimate shareholder (one who controls over half of the votes), the controlling owners
are in a position to influence managers in determining corporate strategies. Corporate
ownership in East Asian countries, including Malaysia, is concentrated in the hands of large
owners or controlling owners being in the part of time companies owned by families [23]. for
companies owned and controlled by families in Southeast Asia, some of them are described
by Weidenbaum (1988) in which the author shows that a central member of the family takes
the decisions, while other family members or trustworthy persons responsible for the
management of different companies, reducing the communication cost and making these
groups extremely flexible [24].
2.2.2 Companies strategies
The groups assessed have the similarity of being business groups, in the literature we
can find two forms of classification for such corporations: portfolio groups and Industrial
groups. Portfolio groups are characterized by the fact that the companies forming them have
no economic synergies and respond to strategies of conglomerate diversification. They
include mainly the largest firms in a country, which seek to diversify their portfolio offerings,
and benefit from a re-allocation of the financial resources of the companies in the group
(internal capital market). Most of the work on business groups refers to this type of group.
The main research question in this literature is whether the allocation of capital within a
group is more or less efficient than its allocation by capital markets [25].
Portfolio groups have attracted the most attention from both empirical and theoretical research. The literature stresses the interpretation of this type of group as a financial device. However, the majority of groups are industrial groups. The characteristic feature of an industrial group is the presence of economic synergies among the companies in the group, which this study characterizes as a strategy of related investments. Companies within a group normally belong to the same industry or production filiere. They may cover different segments of the same market or different phases in the production chain [25].
Rafael PALHIARIM TOBIAS Promotion 77
14
2.2.3 Ethnicity and Nationalities
The study regards ethnicity as factor because it is usually discussed in several reports
from NGOs and also some international organizations, which claim that many Chinese and
Indian companies present opaque structures. This work also takes into consideration the
factor nationality due to the fact that in countries like Malaysia, for example, where there
are many Malaysians nationality investors but said as Chinese or Indian ethnicity.
2.3 Social network analysis
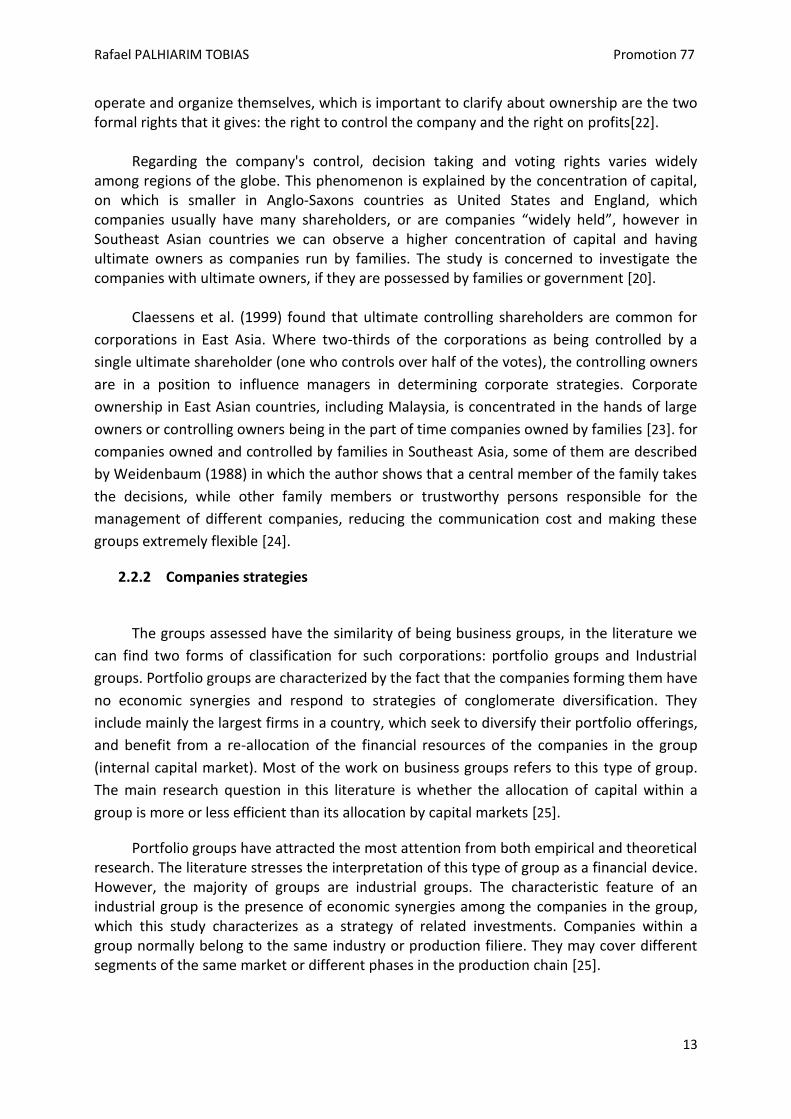
According to Cross (2004) through the analysis of social networks we can obtain
important information about the real structure of the companies, find out who makes
decisions on a group it is not always easy, as we can see below SNA show up the information
that formal structure doesn’t shows [27].
Figure 3. Aparent power versus real power
The analysis of social networks is a sociological version derived from the network theory. Every type of social aggregation can be represented in terms of units comprising this aggregation and the relationships between these units. This kind of representation of a social structure is called "Social Network". In a social network, each unit, usually called "social actor" (a person, a group, an organization, a nation, among others), is represented as a node. A relationship is represented as an edge or flow between these units. These relationships can be analyzed for structural patterns that emerge between these actors. According to Pinheiro (2011) the relationship among the individuals and the institutions with which they are associated are more important than the attributes of the individuals [26].
Rafael PALHIARIM TOBIAS Promotion 77
15
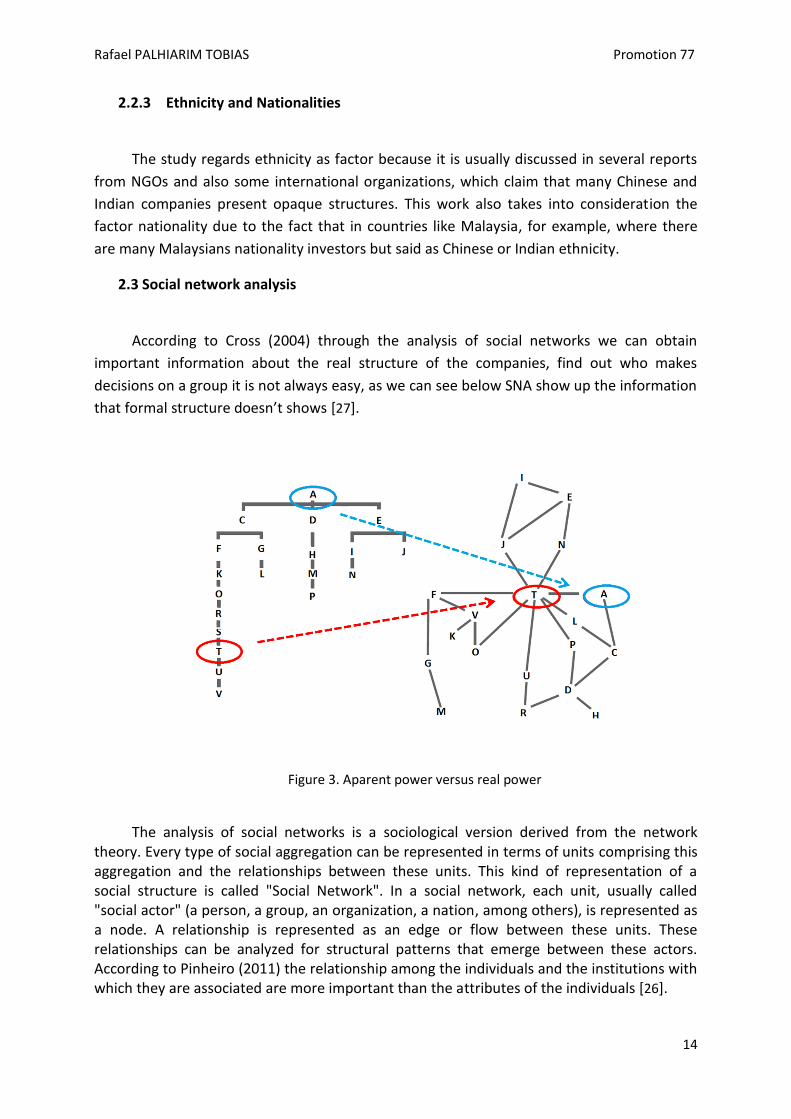
Figure 2. Example of a social network
In the context of this study companies and shareholders are the nodes, and the link
between them is based on the ownership, it is analyzed to understand the concentration of
power and decision-making within the business group.
2.4 Modeling a network
2.4.1 Data and software
It is noteworthy that the four groups assessed are listed on stock exchanges, in this way making possible a range of information about your investments and subsidiaries, it was examined different types of sources, including official sources as annual reports, stock exchange announcements, statement to shareholders, related articles about those groups. 920 nodes were identified, the network are mainly composed by subsidiary companies and a small proportion of managers.
The data (csv as input format) were processed with the aid of Cytoscape, it is an open
source platform for complex network data integration, analysis, and visualization. Originally Cytoscape was developed for bioinformatics research and now it is a domain independent platform. Many plugins are available for users and developers can expand its functionality [28]. For a part of the outputs (the nodes’ analysis) we also did use the software R, which allow us to analyze the difference between groups through the analysis of variance (ANOVA).
2.4.2 Metrics
Rafael PALHIARIM TOBIAS Promotion 77
16
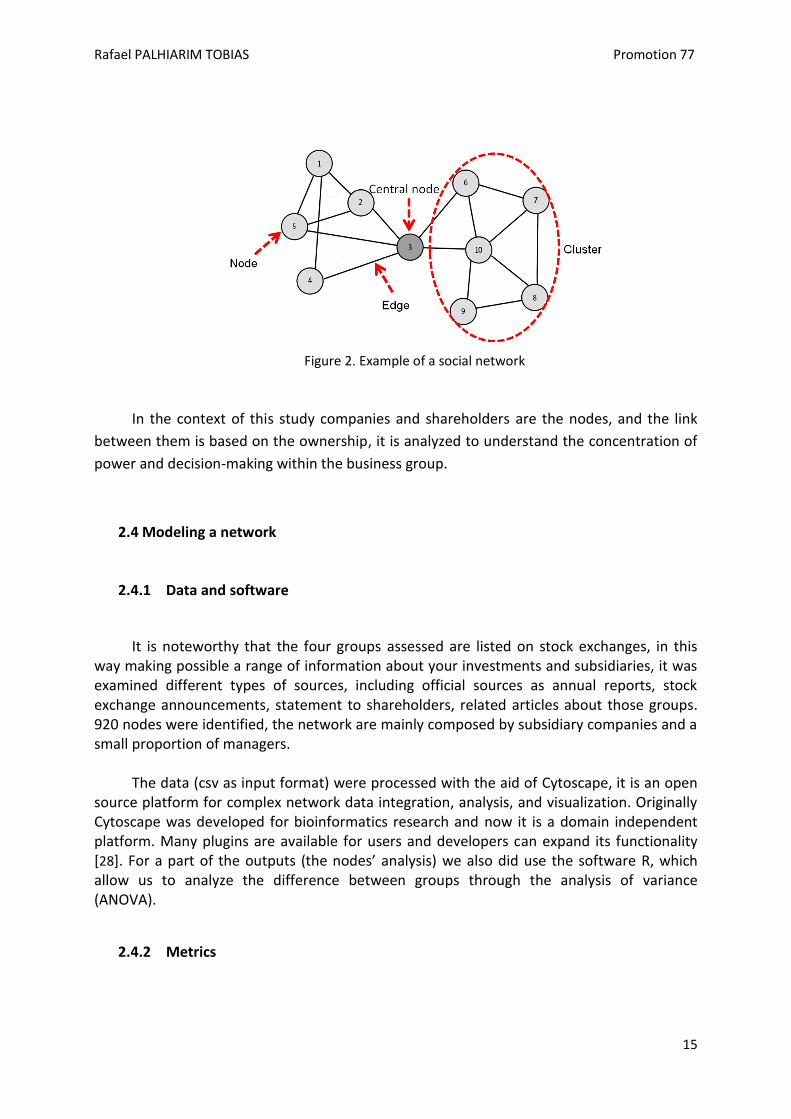
Image 4. Example of a directed network (a) and an undirected network (b)
Network Analyzer (a package of Cytoscape) can perform topological analysis on
directed networks (containing only directed edges) as well as In Cytoscape, a network may contain only directed edge. Moreover, one network may contain both directed and undirected edges if the network is compiled by combining data from different sources. As in the situations “a” described above, we have a direct edges interpretation for further processing of the network.
Cytoscape performs network analysis resulting into two classes of parameters: simple
network parameters and complex network parameters. In simple network parameters we have a first quantitative approach, as number of nodes, shortest paths, characteristic path length, average number of neighbors, network diameter and clustering coefficient. For complex network parameters we have mainly parameters that take in account the node distribution such as Avg. Clustering coefficients distribution, shortest path length distribution, in-degree and out-degree distribution. We have parameters for centrality as well; this measure gives a rough indication of the social power of a node based on how well they "connect" the network: betweenness, closeness, and degree are all measures of centrality.
With R we analyzed which parameters have influence on groups and which factor
presents significant difference within the groups.
3. RESULTS
In the first stage of data analysis is observed a large concentration of capital, and three
groups owned by families: Ta Ann Holding Berhad, WTK Holding Berhad and Olam
Rafael PALHIARIM TOBIAS Promotion 77
17
International Limited, while Sime Darby Berhad is mainly owned by the Government of
Malaysia; regarding the group size, Sime Darby Berhad is the group that has the highest
number of subsidiaries with 579 companies, then Olam International Limited relying on 163
companies, Ta Ann Berhad has 82 subsidiaries and finally 70 WTK Berhad has 70 subsidiaries,
in the table below we have information about the group size in terms of share capital.
Group Share capital (US$) Family Governement Others
WTK 66,385,781.25 47.86% 1.69% 49.55%
TAANN 93,658,862.61 50.25% 9.36% 40.39%
SD 1,820,798,749.16 0% 67.86% 32.14%
OLAM 1,679,851,945.37 22% 14.4% 63.6% Table 1. Share capital and ownership
3.1 Network visualization and real controlling actors
The network visualization allow us to observe the social network to the four groups,
the groups are owned by other companies, managers or other shareholders in general, They
also own directly and indirectly subsidiaries, all these elements are the network actors
represented by nodes as we can see on the figures below. They vary widely in size but have
basically the same shape, but it is worth noting that for this last concept Sime Darby
presents a visible difference.
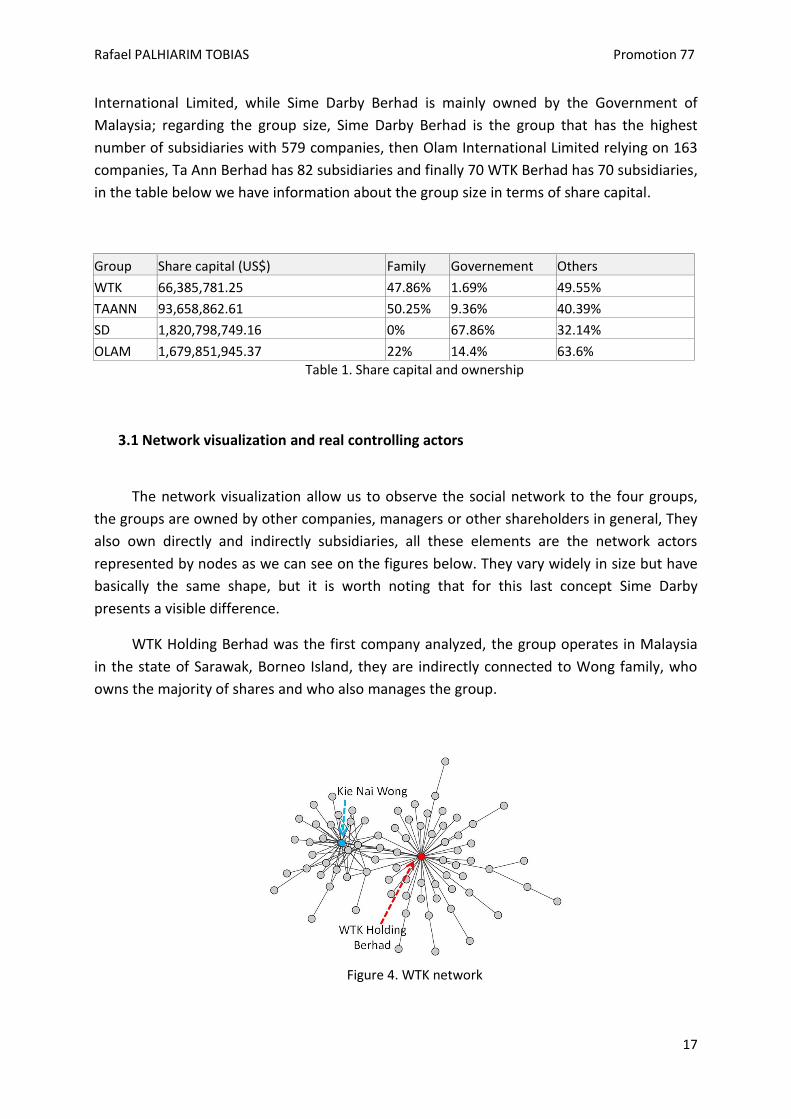
WTK Holding Berhad was the first company analyzed, the group operates in Malaysia
in the state of Sarawak, Borneo Island, they are indirectly connected to Wong family, who
owns the majority of shares and who also manages the group.
Figure 4. WTK network
Rafael PALHIARIM TOBIAS Promotion 77
18
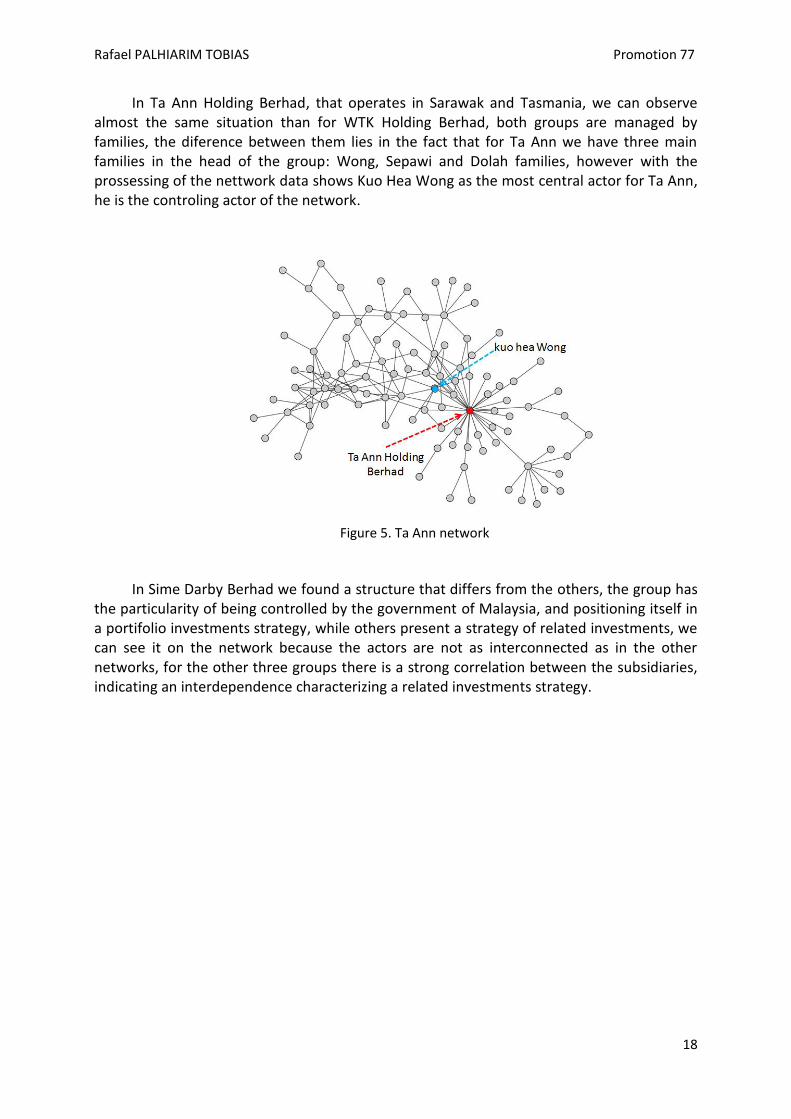
In Ta Ann Holding Berhad, that operates in Sarawak and Tasmania, we can observe almost the same situation than for WTK Holding Berhad, both groups are managed by families, the diference between them lies in the fact that for Ta Ann we have three main families in the head of the group: Wong, Sepawi and Dolah families, however with the prossessing of the nettwork data shows Kuo Hea Wong as the most central actor for Ta Ann, he is the controling actor of the network.
Figure 5. Ta Ann network
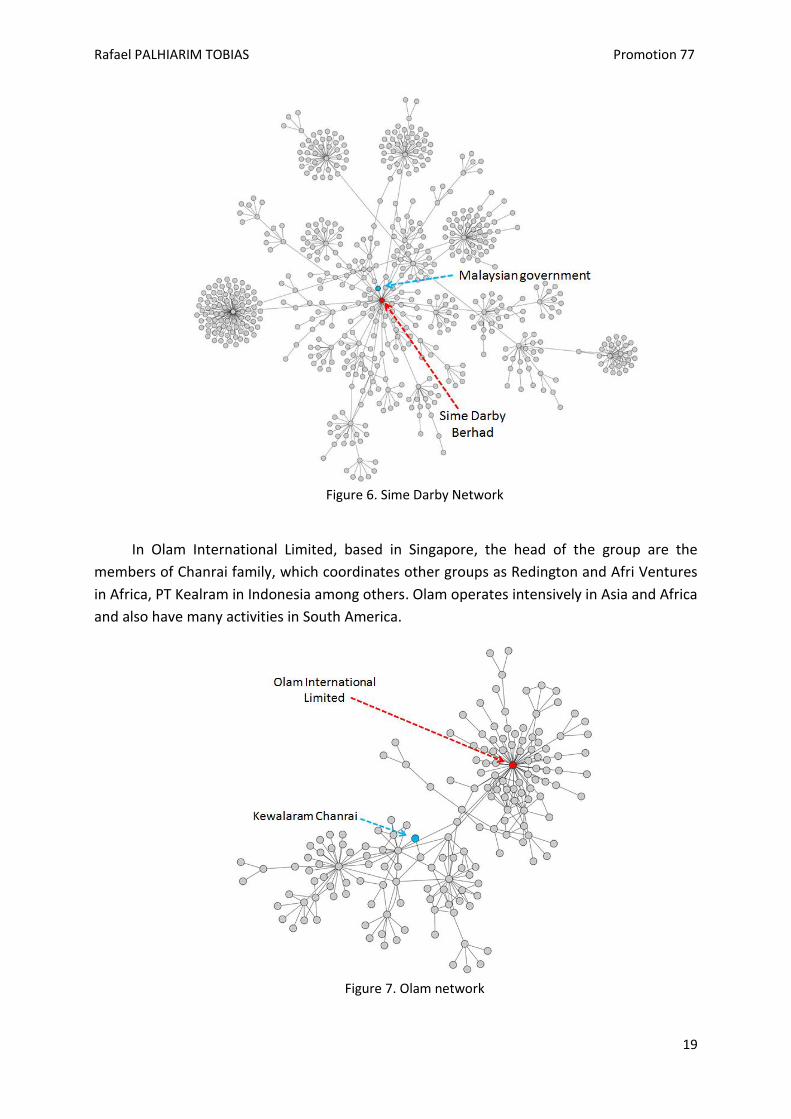
In Sime Darby Berhad we found a structure that differs from the others, the group has
the particularity of being controlled by the government of Malaysia, and positioning itself in a portifolio investments strategy, while others present a strategy of related investments, we can see it on the network because the actors are not as interconnected as in the other networks, for the other three groups there is a strong correlation between the subsidiaries, indicating an interdependence characterizing a related investments strategy.
Rafael PALHIARIM TOBIAS Promotion 77
19
Figure 6. Sime Darby Network
In Olam International Limited, based in Singapore, the head of the group are the
members of Chanrai family, which coordinates other groups as Redington and Afri Ventures
in Africa, PT Kealram in Indonesia among others. Olam operates intensively in Asia and Africa
and also have many activities in South America.
Figure 7. Olam network
Rafael PALHIARIM TOBIAS Promotion 77
20
By observing the position of the main company of the group (in red) and the controlling actor (in blue), we can note that except for some Sime Darby, who the controlling actor is very close to the main company of the group, all the others show the controlling actor is not close to the main company of the group. This fact explains why the Asian network seems “opaque” or “obscure” to the NGO and external observes. While technically, they are not opaque at all. All the information is clearly disclosed on financial reports. But the structure being complex and somehow different from the traditional western structure, this might be an explanation of a wrong perception of “opacity”.
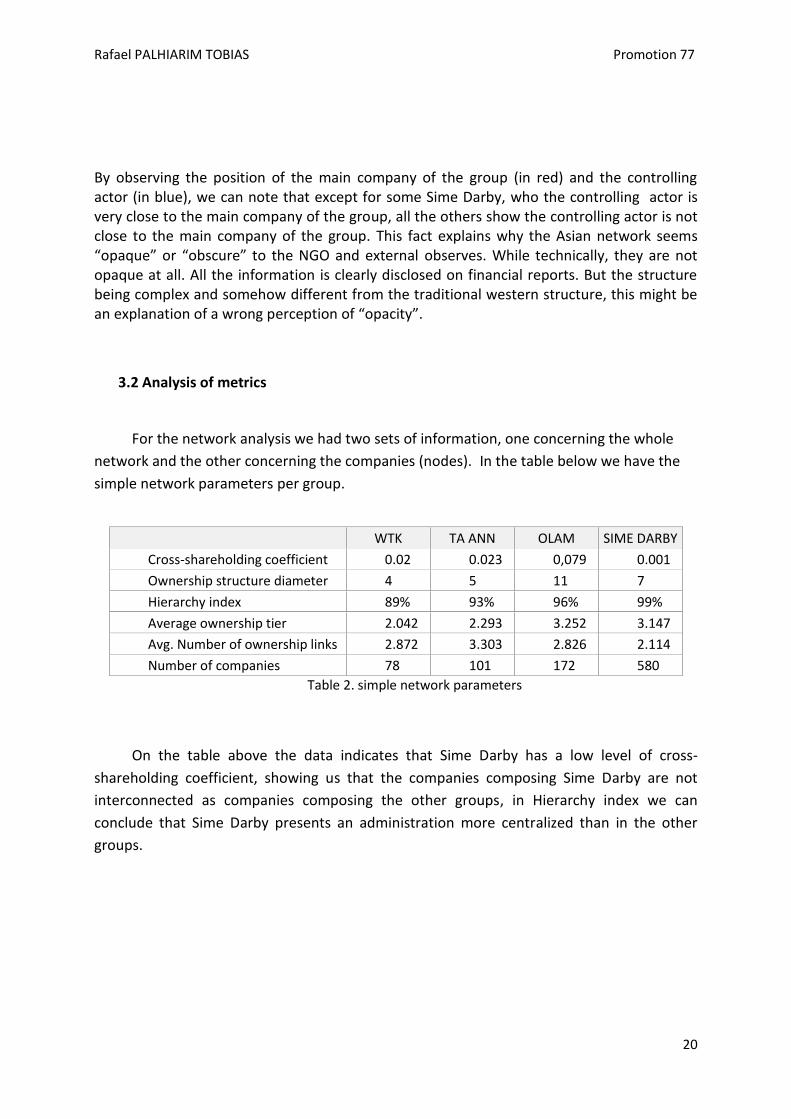
3.2 Analysis of metrics
For the network analysis we had two sets of information, one concerning the whole
network and the other concerning the companies (nodes). In the table below we have the
simple network parameters per group.
WTK TA ANN OLAM SIME DARBY
Cross-shareholding coefficient 0.02 0.023 0,079 0.001
Ownership structure diameter 4 5 11 7
Hierarchy index 89% 93% 96% 99%
Average ownership tier 2.042 2.293 3.252 3.147
Avg. Number of ownership links 2.872 3.303 2.826 2.114
Number of companies 78 101 172 580
Table 2. simple network parameters
On the table above the data indicates that Sime Darby has a low level of cross-
shareholding coefficient, showing us that the companies composing Sime Darby are not
interconnected as companies composing the other groups, in Hierarchy index we can
conclude that Sime Darby presents an administration more centralized than in the other
groups.
Rafael PALHIARIM TOBIAS Promotion 77
21
3.2.1 Potential metrics
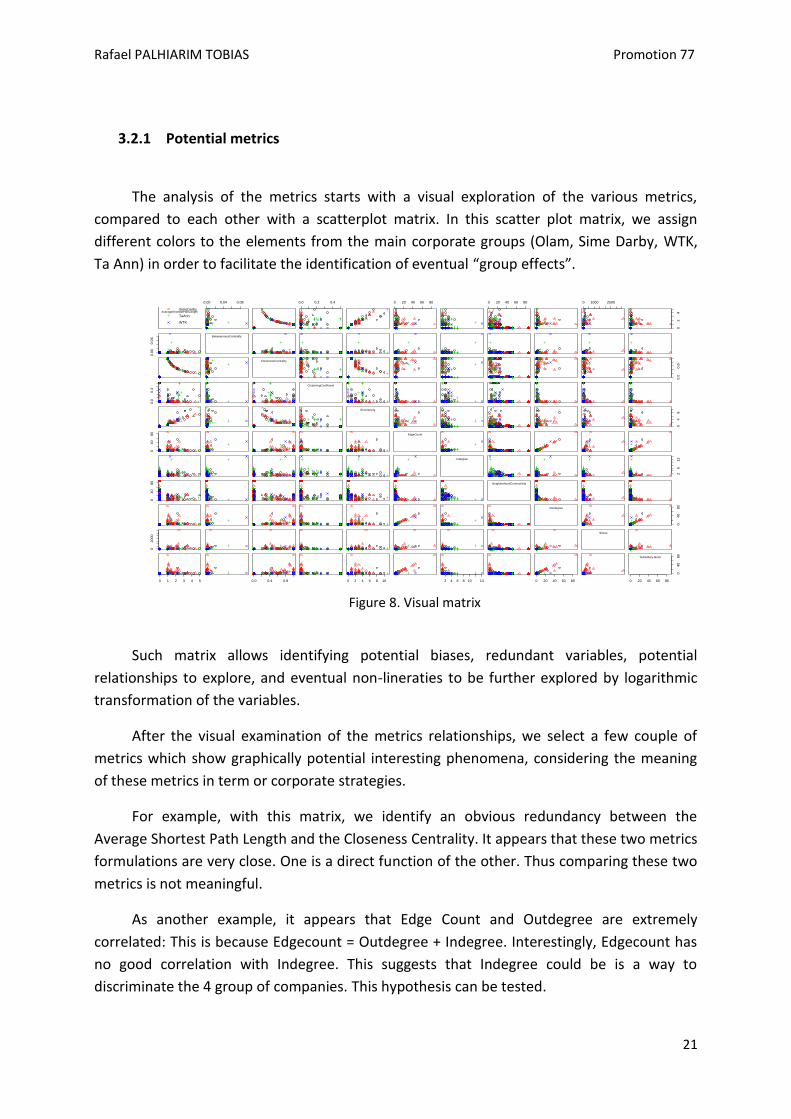
The analysis of the metrics starts with a visual exploration of the various metrics,
compared to each other with a scatterplot matrix. In this scatter plot matrix, we assign
different colors to the elements from the main corporate groups (Olam, Sime Darby, WTK,
Ta Ann) in order to facilitate the identification of eventual “group effects”.
Figure 8. Visual matrix
Such matrix allows identifying potential biases, redundant variables, potential
relationships to explore, and eventual non-lineraties to be further explored by logarithmic
transformation of the variables.
After the visual examination of the metrics relationships, we select a few couple of
metrics which show graphically potential interesting phenomena, considering the meaning
of these metrics in term or corporate strategies.
For example, with this matrix, we identify an obvious redundancy between the
Average Shortest Path Length and the Closeness Centrality. It appears that these two metrics
formulations are very close. One is a direct function of the other. Thus comparing these two
metrics is not meaningful.
As another example, it appears that Edge Count and Outdegree are extremely
correlated: This is because Edgecount = Outdegree + Indegree. Interestingly, Edgecount has
no good correlation with Indegree. This suggests that Indegree could be is a way to
discriminate the 4 group of companies. This hypothesis can be tested.
Olam
SimeDarby
TaAnn
WTK
AverageShortestPathLength
0.00 0.04 0.08 0.0 0.2 0.4 0 20 40 60 80 0 20 40 60 80 0 1000 2500
02
4
0.0
00
.06
BetweennessCentrality
ClosenessCentrality
0.0
0.6
0.0
0.3
ClusteringCoefficient
Eccentricity
04
8
040
80
EdgeCount
Indegree
26
12
04
080
NeighborhoodConnectivity
Outdegree
040
80
020
00
Stress
0 1 2 3 4 5 0.0 0.4 0.8 0 2 4 6 8 10 2 4 6 8 10 14 0 20 40 60 80 0 20 40 60 80
04
080
Subsidiary.factor
Rafael PALHIARIM TOBIAS Promotion 77
22
3.2.2 Network Metrics
We examine how the various network metrics discriminate between the 4 groups of
companies, and how they eventually relate to the Ethnicity, Strategy, Nationality and
Corporation factors.
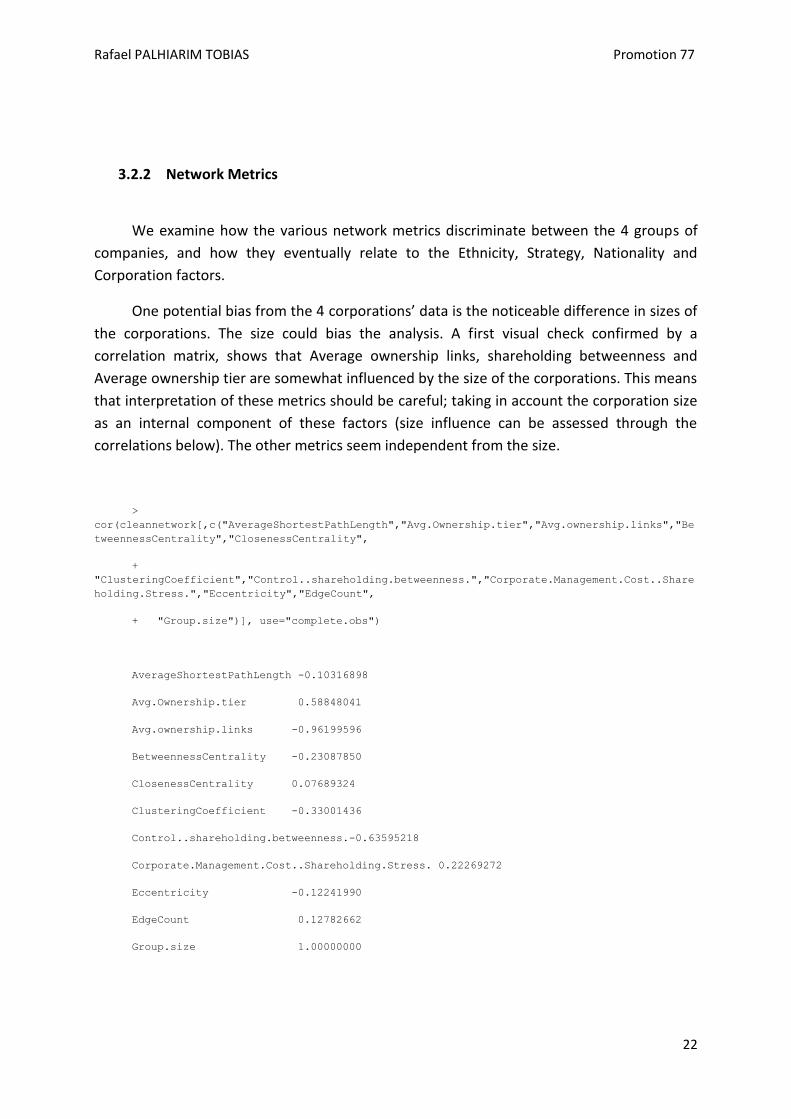
One potential bias from the 4 corporations’ data is the noticeable difference in sizes of
the corporations. The size could bias the analysis. A first visual check confirmed by a
correlation matrix, shows that Average ownership links, shareholding betweenness and
Average ownership tier are somewhat influenced by the size of the corporations. This means
that interpretation of these metrics should be careful; taking in account the corporation size
as an internal component of these factors (size influence can be assessed through the
correlations below). The other metrics seem independent from the size.
>
cor(cleannetwork[,c("AverageShortestPathLength","Avg.Ownership.tier","Avg.ownership.links","Be
tweennessCentrality","ClosenessCentrality",
+
"ClusteringCoefficient","Control..shareholding.betweenness.","Corporate.Management.Cost..Share
holding.Stress.","Eccentricity","EdgeCount",
+ "Group.size")], use="complete.obs")
AverageShortestPathLength -0.10316898
Avg.Ownership.tier 0.58848041
Avg.ownership.links -0.96199596
BetweennessCentrality -0.23087850
ClosenessCentrality 0.07689324
ClusteringCoefficient -0.33001436
Control..shareholding.betweenness.-0.63595218
Corporate.Management.Cost..Shareholding.Stress. 0.22269272
Eccentricity -0.12241990
EdgeCount 0.12782662
Group.size 1.00000000
Rafael PALHIARIM TOBIAS Promotion 77
23
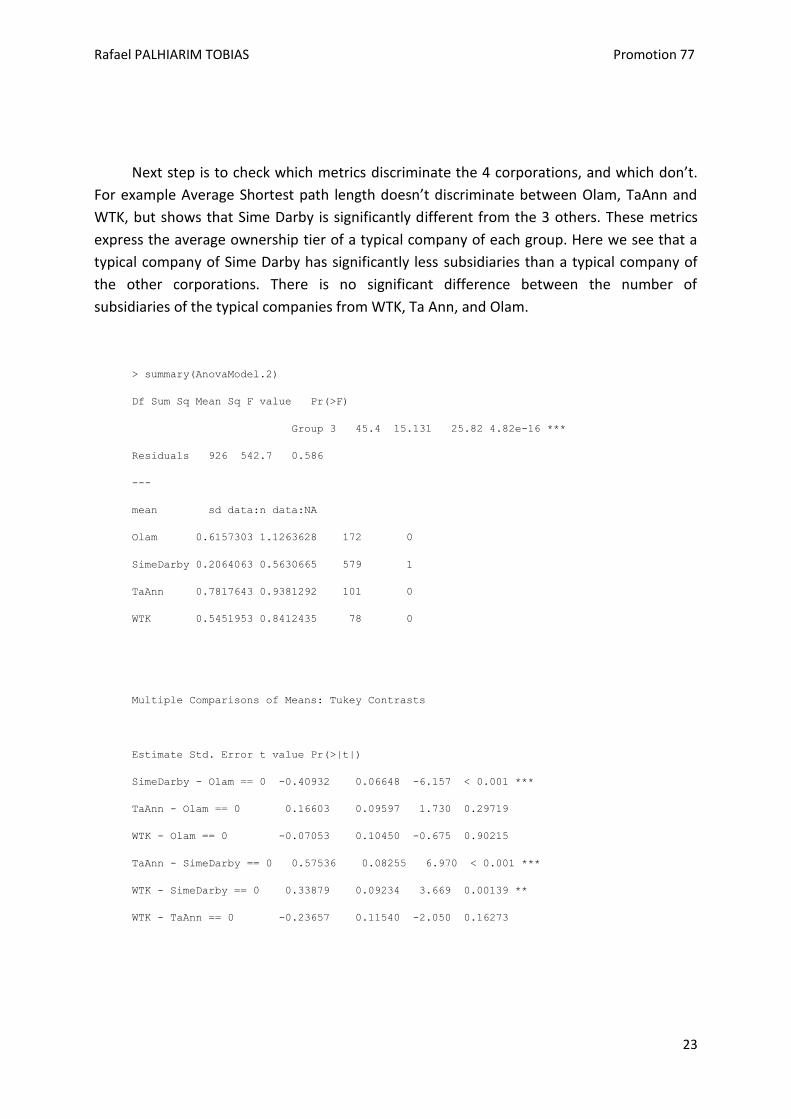
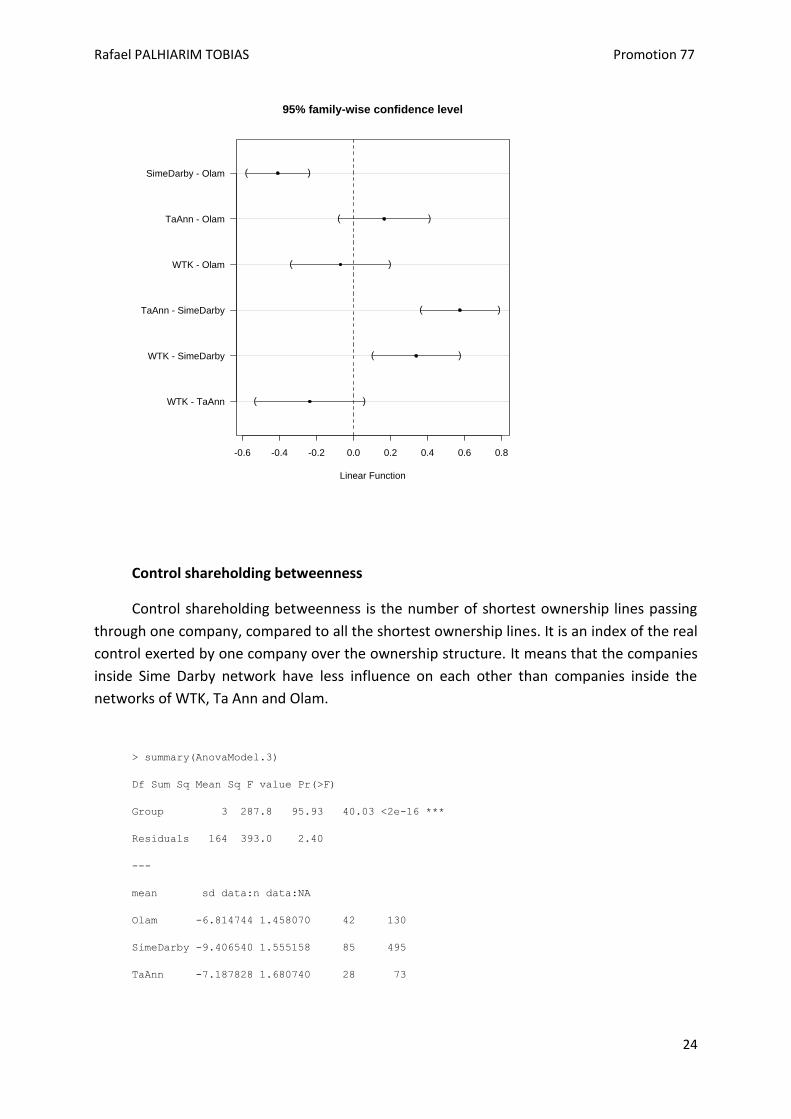
Next step is to check which metrics discriminate the 4 corporations, and which don’t.
For example Average Shortest path length doesn’t discriminate between Olam, TaAnn and
WTK, but shows that Sime Darby is significantly different from the 3 others. These metrics
express the average ownership tier of a typical company of each group. Here we see that a
typical company of Sime Darby has significantly less subsidiaries than a typical company of
the other corporations. There is no significant difference between the number of
subsidiaries of the typical companies from WTK, Ta Ann, and Olam.
> summary(AnovaModel.2)
Df Sum Sq Mean Sq F value Pr(>F)
Group 3 45.4 15.131 25.82 4.82e-16 ***
Residuals 926 542.7 0.586
---
mean sd data:n data:NA
Olam 0.6157303 1.1263628 172 0
SimeDarby 0.2064063 0.5630665 579 1
TaAnn 0.7817643 0.9381292 101 0
WTK 0.5451953 0.8412435 78 0
Multiple Comparisons of Means: Tukey Contrasts
Estimate Std. Error t value Pr(>|t|)
SimeDarby - Olam == 0 -0.40932 0.06648 -6.157 < 0.001 ***
TaAnn - Olam == 0 0.16603 0.09597 1.730 0.29719
WTK - Olam == 0 -0.07053 0.10450 -0.675 0.90215
TaAnn - SimeDarby == 0 0.57536 0.08255 6.970 < 0.001 ***
WTK - SimeDarby == 0 0.33879 0.09234 3.669 0.00139 **
WTK - TaAnn == 0 -0.23657 0.11540 -2.050 0.16273
Rafael PALHIARIM TOBIAS Promotion 77
24
Control shareholding betweenness
Control shareholding betweenness is the number of shortest ownership lines passing
through one company, compared to all the shortest ownership lines. It is an index of the real
control exerted by one company over the ownership structure. It means that the companies
inside Sime Darby network have less influence on each other than companies inside the
networks of WTK, Ta Ann and Olam.
> summary(AnovaModel.3)
Df Sum Sq Mean Sq F value Pr(>F)
Group 3 287.8 95.93 40.03 <2e-16 ***
Residuals 164 393.0 2.40
---
mean sd data:n data:NA
Olam -6.814744 1.458070 42 130
SimeDarby -9.406540 1.555158 85 495
TaAnn -7.187828 1.680740 28 73
-0.6 -0.4 -0.2 0.0 0.2 0.4 0.6 0.8
WTK - TaAnn
WTK - SimeDarby
TaAnn - SimeDarby
WTK - Olam
TaAnn - Olam
SimeDarby - Olam (
(
(
(
(
(
)
)
)
)
)
)
95% family-wise confidence level
Linear Function
Rafael PALHIARIM TOBIAS Promotion 77
25
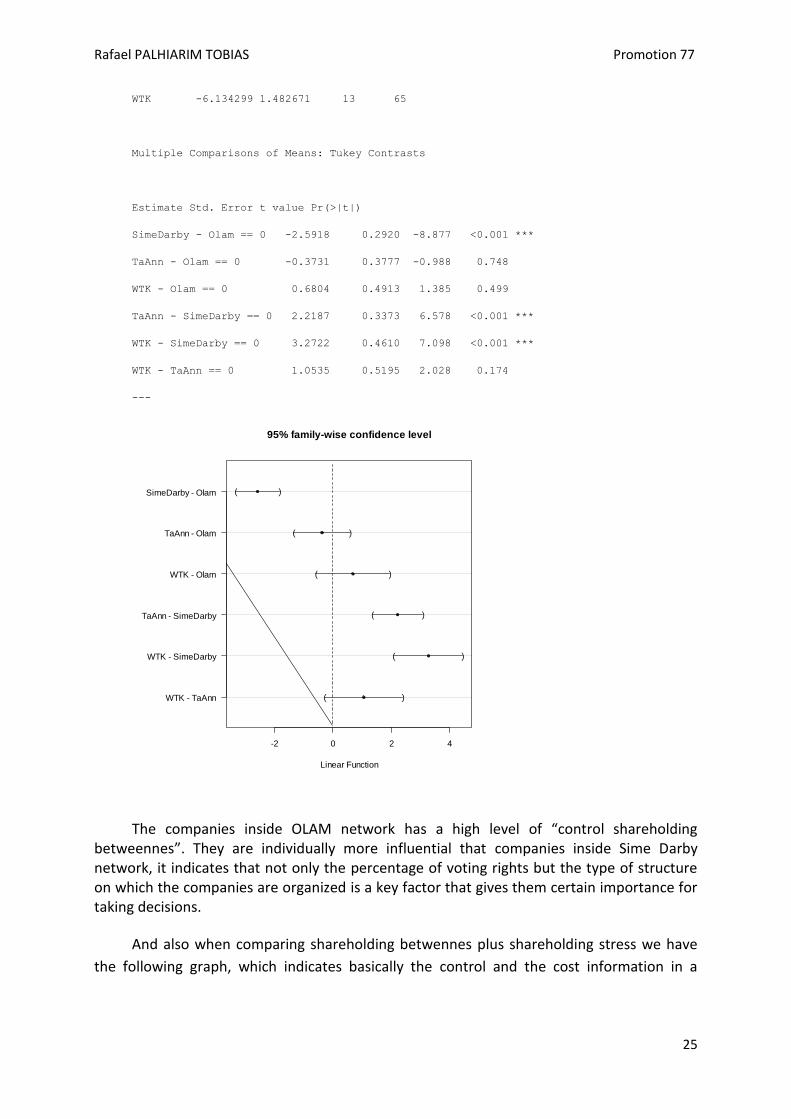
WTK -6.134299 1.482671 13 65
Multiple Comparisons of Means: Tukey Contrasts
Estimate Std. Error t value Pr(>|t|)
SimeDarby - Olam == 0 -2.5918 0.2920 -8.877 <0.001 ***
TaAnn - Olam == 0 -0.3731 0.3777 -0.988 0.748
WTK - Olam == 0 0.6804 0.4913 1.385 0.499
TaAnn - SimeDarby == 0 2.2187 0.3373 6.578 <0.001 ***
WTK - SimeDarby == 0 3.2722 0.4610 7.098 <0.001 ***
WTK - TaAnn == 0 1.0535 0.5195 2.028 0.174
---
The companies inside OLAM network has a high level of “control shareholding betweennes”. They are individually more influential that companies inside Sime Darby network, it indicates that not only the percentage of voting rights but the type of structure on which the companies are organized is a key factor that gives them certain importance for taking decisions.
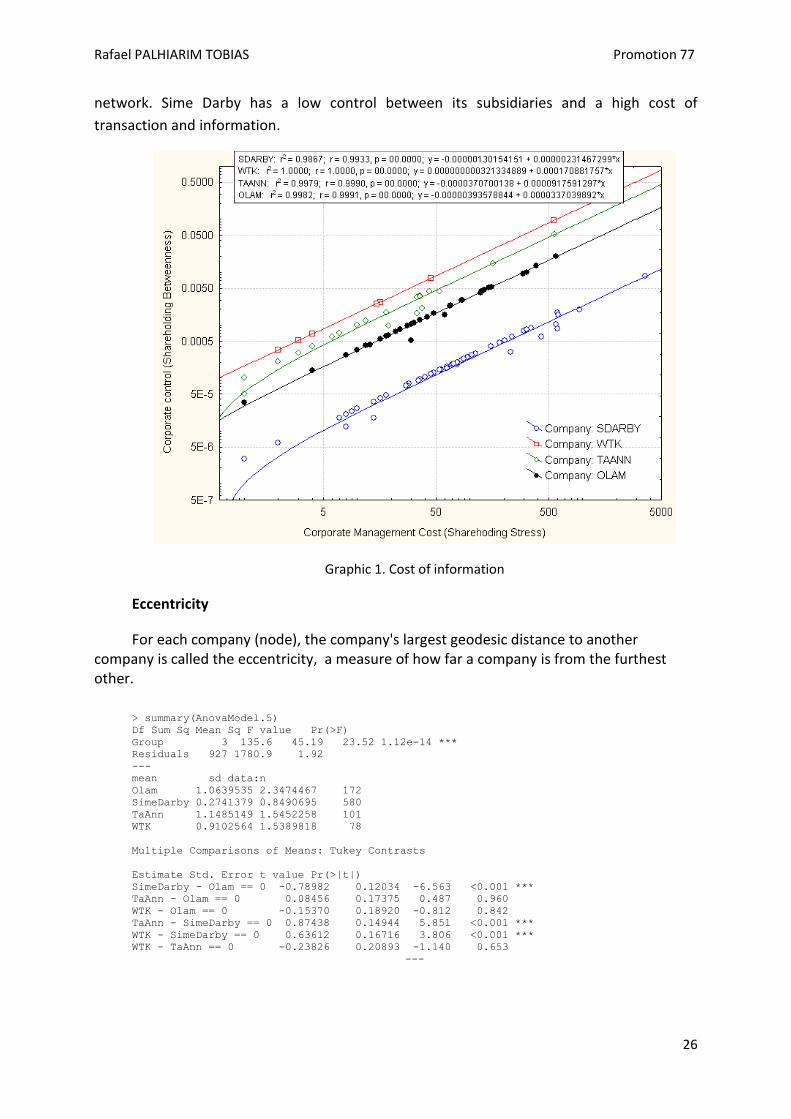
And also when comparing shareholding betwennes plus shareholding stress we have
the following graph, which indicates basically the control and the cost information in a
-2 0 2 4
WTK - TaAnn
WTK - SimeDarby
TaAnn - SimeDarby
WTK - Olam
TaAnn - Olam
SimeDarby - Olam (
(
(
(
(
(
)
)
)
)
)
)
95% family-wise confidence level
Linear Function
Rafael PALHIARIM TOBIAS Promotion 77
26
network. Sime Darby has a low control between its subsidiaries and a high cost of
transaction and information.
Graphic 1. Cost of information
Eccentricity
For each company (node), the company's largest geodesic distance to another company is called the eccentricity, a measure of how far a company is from the furthest other.
> summary(AnovaModel.5)
Df Sum Sq Mean Sq F value Pr(>F)
Group 3 135.6 45.19 23.52 1.12e-14 ***
Residuals 927 1780.9 1.92
---
mean sd data:n
Olam 1.0639535 2.3474467 172
SimeDarby 0.2741379 0.8490695 580
TaAnn 1.1485149 1.5452258 101
WTK 0.9102564 1.5389818 78
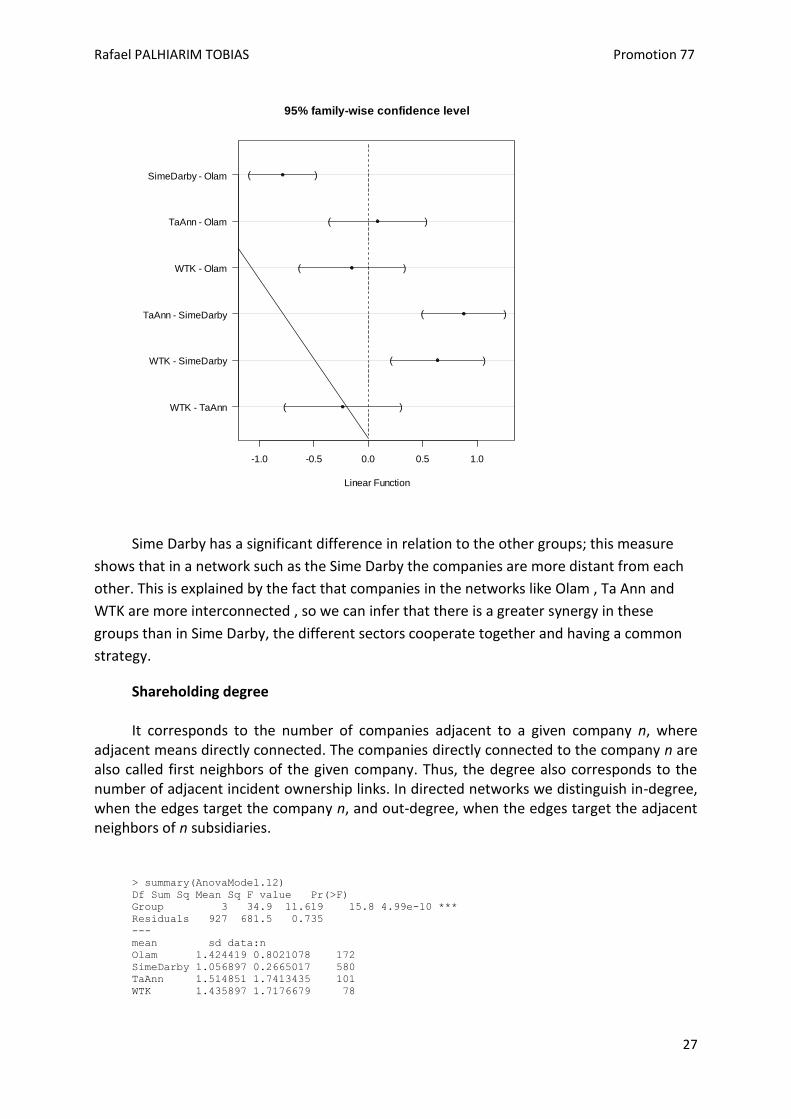
Multiple Comparisons of Means: Tukey Contrasts
Estimate Std. Error t value Pr(>|t|)
SimeDarby - Olam == 0 -0.78982 0.12034 -6.563 <0.001 ***
TaAnn - Olam == 0 0.08456 0.17375 0.487 0.960
WTK - Olam == 0 -0.15370 0.18920 -0.812 0.842
TaAnn - SimeDarby == 0 0.87438 0.14944 5.851 <0.001 ***
WTK - SimeDarby == 0 0.63612 0.16716 3.806 <0.001 ***
WTK - TaAnn == 0 -0.23826 0.20893 -1.140 0.653
---
Rafael PALHIARIM TOBIAS Promotion 77
27
Sime Darby has a significant difference in relation to the other groups; this measure
shows that in a network such as the Sime Darby the companies are more distant from each
other. This is explained by the fact that companies in the networks like Olam , Ta Ann and
WTK are more interconnected , so we can infer that there is a greater synergy in these
groups than in Sime Darby, the different sectors cooperate together and having a common
strategy.
Shareholding degree It corresponds to the number of companies adjacent to a given company n, where
adjacent means directly connected. The companies directly connected to the company n are also called first neighbors of the given company. Thus, the degree also corresponds to the number of adjacent incident ownership links. In directed networks we distinguish in-degree, when the edges target the company n, and out-degree, when the edges target the adjacent neighbors of n subsidiaries.
> summary(AnovaModel.12)
Df Sum Sq Mean Sq F value Pr(>F)
Group 3 34.9 11.619 15.8 4.99e-10 ***
Residuals 927 681.5 0.735
---
mean sd data:n
Olam 1.424419 0.8021078 172
SimeDarby 1.056897 0.2665017 580
TaAnn 1.514851 1.7413435 101
WTK 1.435897 1.7176679 78
-1.0 -0.5 0.0 0.5 1.0
WTK - TaAnn
WTK - SimeDarby
TaAnn - SimeDarby
WTK - Olam
TaAnn - Olam
SimeDarby - Olam (
(
(
(
(
(
)
)
)
)
)
)
95% family-wise confidence level
Linear Function
Rafael PALHIARIM TOBIAS Promotion 77
28
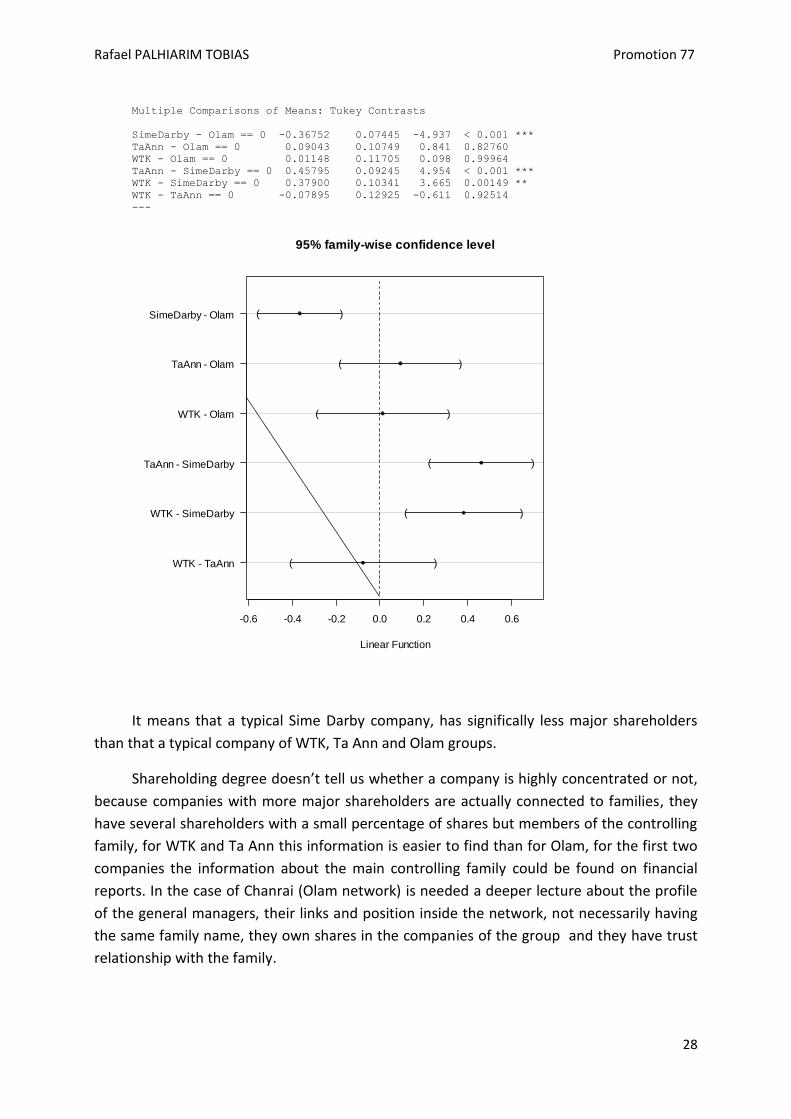
Multiple Comparisons of Means: Tukey Contrasts
SimeDarby - Olam == 0 -0.36752 0.07445 -4.937 < 0.001 ***
TaAnn - Olam == 0 0.09043 0.10749 0.841 0.82760
WTK - Olam == 0 0.01148 0.11705 0.098 0.99964
TaAnn - SimeDarby == 0 0.45795 0.09245 4.954 < 0.001 ***
WTK - SimeDarby == 0 0.37900 0.10341 3.665 0.00149 **
WTK - TaAnn == 0 -0.07895 0.12925 -0.611 0.92514
---
It means that a typical Sime Darby company, has significally less major shareholders
than that a typical company of WTK, Ta Ann and Olam groups.
Shareholding degree doesn’t tell us whether a company is highly concentrated or not,
because companies with more major shareholders are actually connected to families, they
have several shareholders with a small percentage of shares but members of the controlling
family, for WTK and Ta Ann this information is easier to find than for Olam, for the first two
companies the information about the main controlling family could be found on financial
reports. In the case of Chanrai (Olam network) is needed a deeper lecture about the profile
of the general managers, their links and position inside the network, not necessarily having
the same family name, they own shares in the companies of the group and they have trust
relationship with the family.
-0.6 -0.4 -0.2 0.0 0.2 0.4 0.6
WTK - TaAnn
WTK - SimeDarby
TaAnn - SimeDarby
WTK - Olam
TaAnn - Olam
SimeDarby - Olam (
(
(
(
(
(
)
)
)
)
)
)
95% family-wise confidence level
Linear Function
Rafael PALHIARIM TOBIAS Promotion 77
29
Em Olam temos que ter um terceiro nivel de leitura, pois é muito dificil de identificar que a
empresa é fortemente detenida. Pois
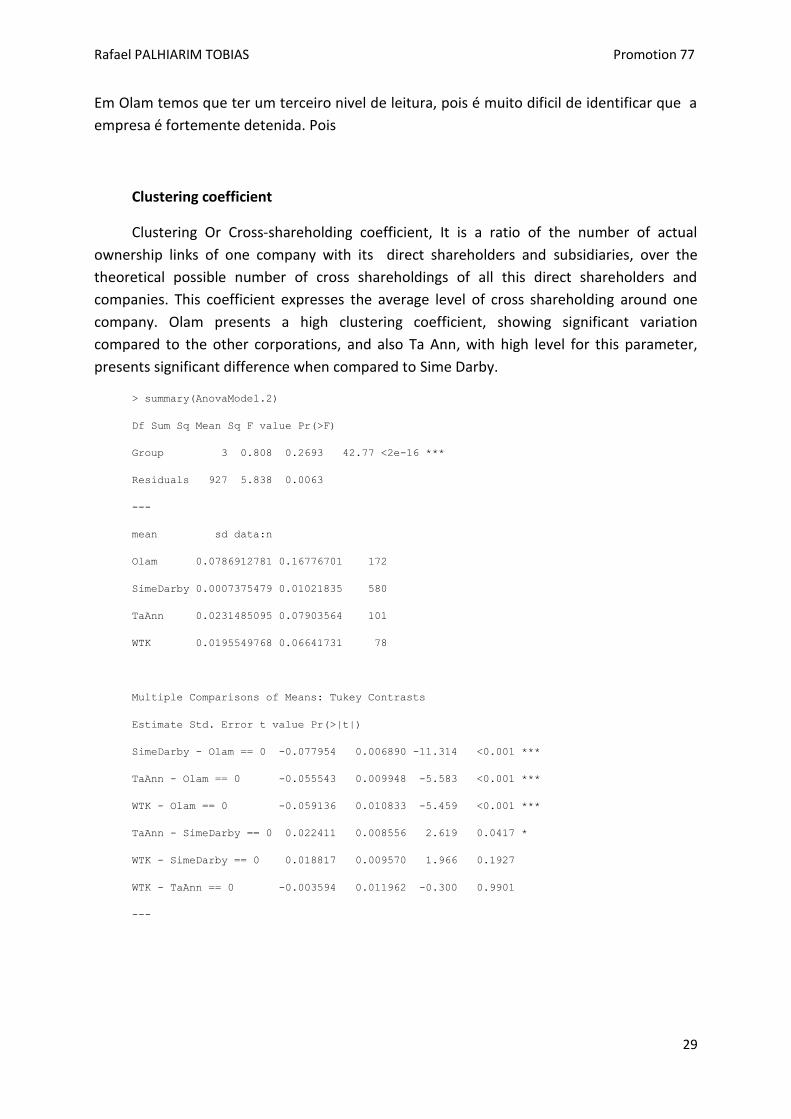
Clustering coefficient
Clustering Or Cross-shareholding coefficient, It is a ratio of the number of actual
ownership links of one company with its direct shareholders and subsidiaries, over the
theoretical possible number of cross shareholdings of all this direct shareholders and
companies. This coefficient expresses the average level of cross shareholding around one
company. Olam presents a high clustering coefficient, showing significant variation
compared to the other corporations, and also Ta Ann, with high level for this parameter,
presents significant difference when compared to Sime Darby.
> summary(AnovaModel.2)
Df Sum Sq Mean Sq F value Pr(>F)
Group 3 0.808 0.2693 42.77 <2e-16 ***
Residuals 927 5.838 0.0063
---
mean sd data:n
Olam 0.0786912781 0.16776701 172
SimeDarby 0.0007375479 0.01021835 580
TaAnn 0.0231485095 0.07903564 101
WTK 0.0195549768 0.06641731 78
Multiple Comparisons of Means: Tukey Contrasts
Estimate Std. Error t value Pr(>|t|)
SimeDarby - Olam == 0 -0.077954 0.006890 -11.314 <0.001 ***
TaAnn - Olam == 0 -0.055543 0.009948 -5.583 <0.001 ***
WTK - Olam == 0 -0.059136 0.010833 -5.459 <0.001 ***
TaAnn - SimeDarby == 0 0.022411 0.008556 2.619 0.0417 *
WTK - SimeDarby == 0 0.018817 0.009570 1.966 0.1927
WTK - TaAnn == 0 -0.003594 0.011962 -0.300 0.9901
---
Rafael PALHIARIM TOBIAS Promotion 77
30
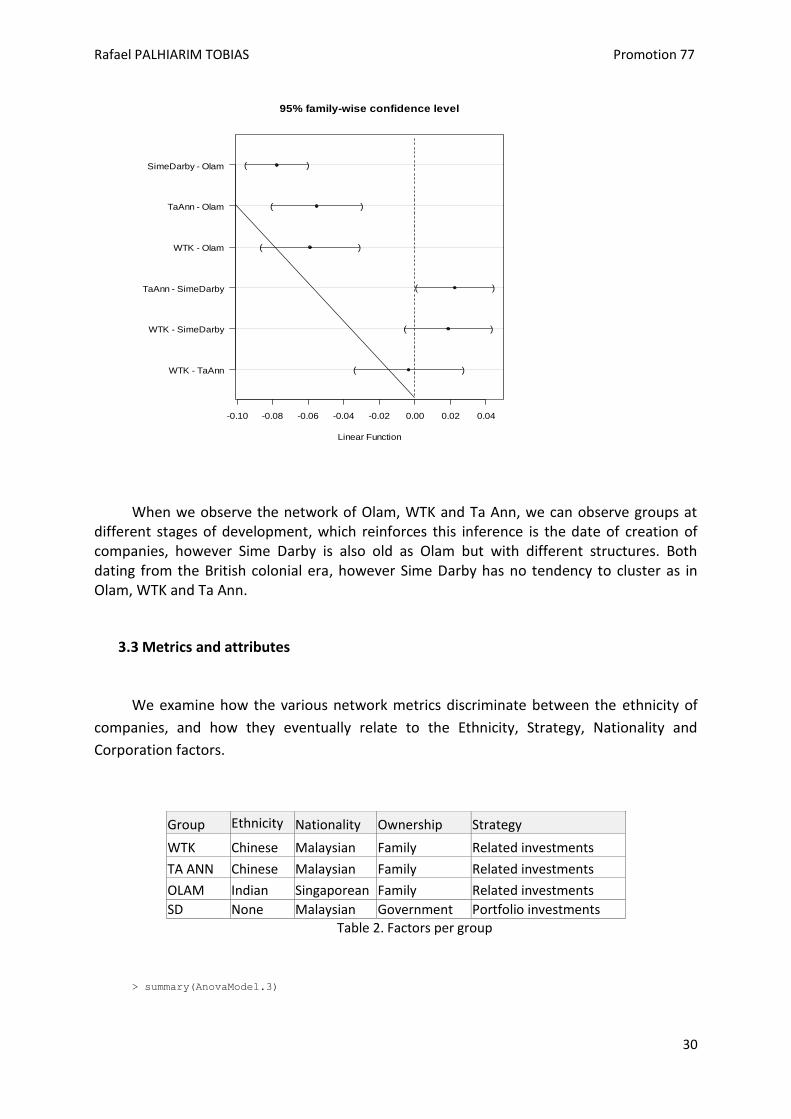
When we observe the network of Olam, WTK and Ta Ann, we can observe groups at different stages of development, which reinforces this inference is the date of creation of companies, however Sime Darby is also old as Olam but with different structures. Both dating from the British colonial era, however Sime Darby has no tendency to cluster as in Olam, WTK and Ta Ann.
3.3 Metrics and attributes
We examine how the various network metrics discriminate between the ethnicity of
companies, and how they eventually relate to the Ethnicity, Strategy, Nationality and
Corporation factors.
Group Ethnicity Nationality Ownership Strategy
WTK Chinese Malaysian Family Related investments
TA ANN Chinese Malaysian Family Related investments
OLAM Indian Singaporean Family Related investments
SD None Malaysian Government Portfolio investments Table 2. Factors per group
> summary(AnovaModel.3)
-0.10 -0.08 -0.06 -0.04 -0.02 0.00 0.02 0.04
WTK - TaAnn
WTK - SimeDarby
TaAnn - SimeDarby
WTK - Olam
TaAnn - Olam
SimeDarby - Olam (
(
(
(
(
(
)
)
)
)
)
)
95% family-wise confidence level
Linear Function
Rafael PALHIARIM TOBIAS Promotion 77
31
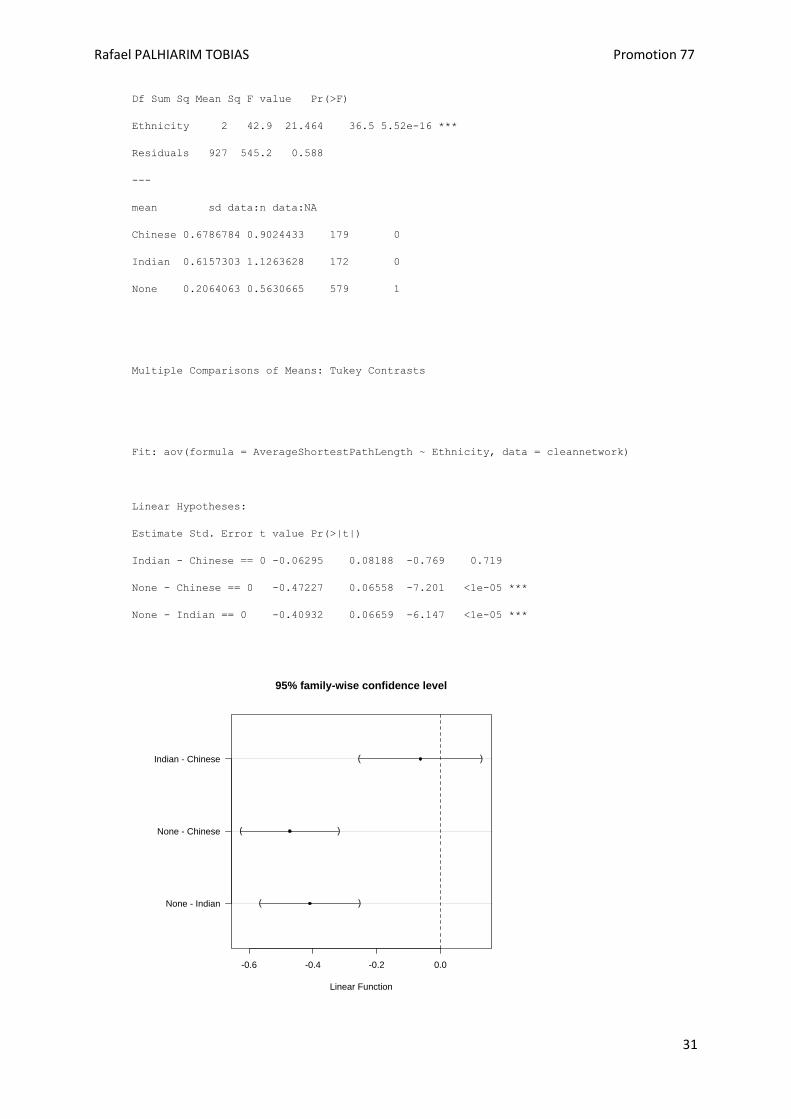
Df Sum Sq Mean Sq F value Pr(>F)
Ethnicity 2 42.9 21.464 36.5 5.52e-16 ***
Residuals 927 545.2 0.588
---
mean sd data:n data:NA
Chinese 0.6786784 0.9024433 179 0
Indian 0.6157303 1.1263628 172 0
None 0.2064063 0.5630665 579 1
Multiple Comparisons of Means: Tukey Contrasts
Fit: aov(formula = AverageShortestPathLength ~ Ethnicity, data = cleannetwork)
Linear Hypotheses:
Estimate Std. Error t value Pr(>|t|)
Indian - Chinese == 0 -0.06295 0.08188 -0.769 0.719
None - Chinese == 0 -0.47227 0.06558 -7.201 <1e-05 ***
None - Indian == 0 -0.40932 0.06659 -6.147 <1e-05 ***
-0.6 -0.4 -0.2 0.0
None - Indian
None - Chinese
Indian - Chinese (
(
(
)
)
)
95% family-wise confidence level
Linear Function
Rafael PALHIARIM TOBIAS Promotion 77
32
We can see that there is a significant difference between ethnicities for the average
ownership tier (Anova). A close look tells us that There is no significant difference between
Indian and Chinese, but that these two are significantly different from the “non ethnic”
corporation. For the other factors: nationality, type of ownership, and strategy we have
significant difference among their attributes.
Nationality
Df Sum Sq Mean Sq F value Pr(>F)
nationality 1 12.4 12.43 20.04 8.52e-06 ***
Residuals 928 575.7 0.62
mean sd data:n data:NA
Malaysian 0.3179323 0.6883744 758 1
singaporean 0.6157303 1.1263628 172 0
---
Ownership type
Df Sum Sq Mean Sq F value Pr(>F)
Ownership 1 42.6 42.58 72.44 <2e-16 ***
Residuals 928 545.5 0.59
---
mean sd data:n data:NA
Family 0.6478320 1.0173607 351 0
Government 0.2064063 0.5630665 579 1
Investment strategy
Df Sum Sq Mean Sq F value Pr(>F)
Strategy 1 42.6 42.58 72.44 <2e-16 ***
Residuals 928 545.5 0.59
---
mean sd data:n data:NA
Portfolio investments 0.2064063 0.5630665 579 1
Related investments 0.6478320 1.0173607 351 0
Rafael PALHIARIM TOBIAS Promotion 77
33
There is a difference between all the ethnicities together and the non ethnic
corporation, but no difference between the ethnicities themselves, this seems to point
towards hidden factors behind the ethnicity, the fact that nationality, ownership, investment
strategy are extremely significant, confirms that.
Rafael PALHIARIM TOBIAS Promotion 77
34
4. DISCUSSIONS
It was found that Average Shortest path length, Control shareholding betweenness,
Eccentric, Indegree and Clustering coefficient can be used to discriminate the 4 groups. The
first four metrics mentioned above doesn’t discriminate between Olam, TaAnn and WTK, but
shows that Sime Darby is significantly different from the 3 others. Sime darby presents a low
level of cross shareholding which is a sign of a portfolio investments strategy. For the other
groups, in which the metrics indicate that companies are more interconnected, we observe a
related investments strategy, it indicates a synergy between the companies.
WTK, Ta Ann and Olam can be flexibly in terms of adaptation, because the flow of
information is faster, it means that the companies have an ability to adapt in case of
economic changes.
Here we found that there is a significant difference between ethnicities for the average
ownership tier (Anova). A close look tells us that There is no significant difference between
Indian and Chinese, but that these two are significantly different from the “non
ethnic”corporation.
Such a result is counter-intuitive. Common sense would suggest that Chinese and
Indian businesses are very different, which is not the case here. Then we can wonder what
makes the Indian and the Chinese businesses common? Is it that they both are Asian? But
again, here the non-ethnic corporation is also completely Asian. So this kind of “ethnic” or
cultural factor doesn’t explain the differences or similarities we observe. We can try to find
other explanation factors: Nationality, ownership, and strategy
Ownership and strategy influence the behavior of more companies should be assed in
other countries to understand the effects of nationality. What is remarkable is the type of
ownership and the strategy, family owned groups use to have a related investment strategy
and government owned groups have a portfolio investment strategy.
Rafael PALHIARIM TOBIAS Promotion 77
35
5. CONCLUSIONS AND FUTURE PROPECTS
In the cases studied were shown a link between companies controlled by families and
related investments strategy. The four companies have concentrated capital meanwhile they
present different structures, the three groups controlled by families have different
structures when compared with government-controlled group. WTK, Ta Ann and Sime Darby
have different sizes but a structure with the same pattern as in an allometry law.
The study also concludes another important fact, ethnicity it not factor that affects the
company structure, the difference lies mainly in the ownership structure (family/
government).
In the next stages of the study will be essential to add sustainability factors such
certification to understand what drives companies to adopt such procedure.
The study has a new approach to assess the companies in the oil plam/ timber sector
and should be applied for other groups. The methods adopted in this study are an important
tool and should be applied for other groups in countries covered by CRP6, adding an
important range of useful information for the component 5.
Rafael PALHIARIM TOBIAS Promotion 77
36
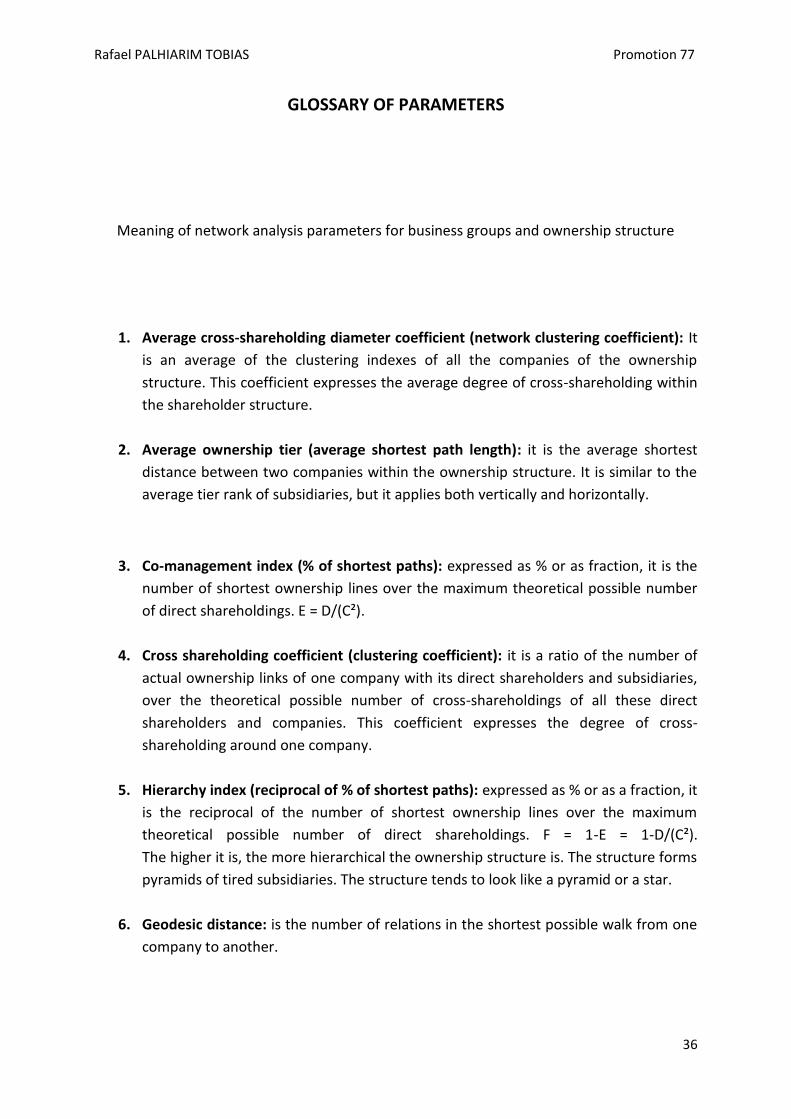
GLOSSARY OF PARAMETERS
Meaning of network analysis parameters for business groups and ownership structure
1. Average cross-shareholding diameter coefficient (network clustering coefficient): It
is an average of the clustering indexes of all the companies of the ownership
structure. This coefficient expresses the average degree of cross-shareholding within
the shareholder structure.
2. Average ownership tier (average shortest path length): it is the average shortest
distance between two companies within the ownership structure. It is similar to the
average tier rank of subsidiaries, but it applies both vertically and horizontally.
3. Co-management index (% of shortest paths): expressed as % or as fraction, it is the
number of shortest ownership lines over the maximum theoretical possible number
of direct shareholdings. E = D/(C²).
4. Cross shareholding coefficient (clustering coefficient): it is a ratio of the number of
actual ownership links of one company with its direct shareholders and subsidiaries,
over the theoretical possible number of cross-shareholdings of all these direct
shareholders and companies. This coefficient expresses the degree of cross-
shareholding around one company.
5. Hierarchy index (reciprocal of % of shortest paths): expressed as % or as a fraction, it
is the reciprocal of the number of shortest ownership lines over the maximum
theoretical possible number of direct shareholdings. F = 1-E = 1-D/(C²).
The higher it is, the more hierarchical the ownership structure is. The structure forms
pyramids of tired subsidiaries. The structure tends to look like a pyramid or a star.
6. Geodesic distance: is the number of relations in the shortest possible walk from one
company to another.
Rafael PALHIARIM TOBIAS Promotion 77
37
7. Number of companies (number of nodes): It is the number of companies and
ownership entities (shareholders or subsidiaries) within the ownership structure.
The maximum theoretical possible number of direct shareholdings is (number of
companies)²(C²).
8. Number of shortest ownership lines (number of shortest paths): shortest
ownership lines are the smallest ownership distance (horizontally or vertically)
between two given companies within the ownership structure. There a limited
number of these shortest ownership lines, which is always a fraction of the maximum
theoretical possible number of direct ownership pairs. The less the number of
ownership lines, the more hierarchical the ownership structure is.
9. Ownership structure diameter (network diameter): it is the largest distance
between two companies within the ownership structure. It is similar to the largest
tier rank of subsidiaries, but it applies both vertically and horizontally.
10. Shareholding betweenness (betweenness centrality): It is the number of shortest
ownership lines passing through one company, compared to all the shortest
ownership lines. It is an index of the real control exerted by one company over the
ownership structure.
11. Shareholding closeness (closeness centrality): it is the reciprocal of the average
shortest distance between two companies within the ownership structure (reciprocal
of B = average ownership tier). This index expresses how fast board’s decisions or
strategic adaptations can be transmitted or propagated within the ownership
structures.
12. Shareholding stress (stress centrality): it is the absolute number of shortest lines
passing through one company. It is a measure of the effective shareholding
specialization of one company.
Rafael PALHIARIM TOBIAS Promotion 77
38
REFERENCES
[1] CIRAD. Le Cirad en 2012. Montpellier 2013.
[2] AERES. Rapport d'évaluation du Cirad. Paris 2011.
[3] CIRAD. Communiqué de presse. Le programme de recherche: FORESTRY. Paris 2013.
[4] CIFOR. Annual Report 2011 CGIAR Research Program on Forests, Trees and Agroforestry. Bagor 2012. [5] CIFOR. Annual Report 2011: a year for forests. Bogor, 2011.
[6] CIFO. CGIAR Research Program 6 Forests, Trees and Agroforestry: Livelihoods, Landscapes and Governance. Bogor, 2011. [7] FERRAND, Gabriel. L’impire sumatranais de Çrivijaya. Lirarie Orientaliste. Paris 1922.
[8] STUART FOX, Martin. A Short History of China and Southeast Asia: tribute, trade and
influence. Sidney 2003.
[9] LIU H. James. Social representation of history in Malaysia and Singapore: on the
relationship between national and ethnic identity. Asian journal of social psychology 5, 3-
20. Wellington 2001.
[10] The World Bank. GDP growth (annual %). (From: http://data.worldbank.org/indicator/NY.GDP.MKTP.KD.ZG). (Accessed on 20/04/2013).
[11] Population Reference Bureau. 2012 World Population Data Sheet. Washington 2012. [12] FAO. FAOSTAT Food and Agricultural commodities production. (From: http://data.worldbank.org/indicator/NY.GDP.MKTP.KD.ZG). (Accessed on 15/05/2013).
[13] UNEP. Oil palm plantations: threats and opportunities for tropical ecosystems. Nairobi 2011. [14] Agence Belge De Développement. Palm oil in world trade: a strategic and controversial
issue. Brussels 2011.
[15] TACHIBANA, Satoshi. Forest-related industries and timber exports of malaysia: policy and structure. Tokyo.
Rafael PALHIARIM TOBIAS Promotion 77
39
[16] MIDA. Malaysia Investment Performance 2011. Kuala Lumpur 2012.
[17] ITS Global, The Economic Contribution of Indonesia’s Forest-Based Industries. Melbourne 2011. [18] FAO, Peatlands - guidance for climate change mitigation through conservation, rehabilitation and sustainable use [19] The Guardian. Indonesia's forest fire smoke blows deeper into Malaysia. (From: http://www.theguardian.com/environment/2013/jun/24/indonesia-forest-fire-malaysia-singapore). (Accessed on 24/06/2013). [20] LA PORTA, Rafael. Corporate Ownership Around the World. The Journal of Finance Vol.
Liv No. 2. 1999.
[21] ZHANG, Lihua. The economic rationale for business groups: a comparative study of China, Japan and Sweden. Shanghai 2008. [22] WALLEVIK, Kristin. Corporate Governance in Family Firms. Copenhagen 2009.
[23] CLAESSENS, Stijn. The separation of ownership and control in East Asian Corporations. Washington, 1999. [24] WEIDENBAUM, Murray. The Bamboo Network: Asia's Family-run Conglomerates. St Louis 1998. [25] CAINELLI, Giulio. Business groups and the boundaries of the firm. Milan 2011.
[26] PINHEIRO, Carlos Andre Reis. Social Network Analysis in telecommunication. 2011 New
Jersey.
[27] CROSS, Rob. The Hidden Power of Social Networks. New York 2012.
[28] Social Network Analysis theory and Applications. (From:
http://www.redesymediossociales.es/descarga.php?file=SocNet_TheoryApp.pdf). (Accessed
on 26/06/2013).