southeast asia tech investment - cento ventures our inaugural southeast asia tech investment report,...
TRANSCRIPT
Southeast Asia tech investment
H1 2017

ABOUT CENTO VENTURES
2
Cento Ventures is a venture capital firm focused on technology startups
building products and services emerging from the digital transformation of
Southeast Asia.
We are based in Singapore and backed by a team well experienced in
internet business. We operate three funds that invest across industries
through a disciplined, well researched approach to locate talent and teams
concentrating on new opportunities sweeping through the ASEAN region.
Our investments are guided by these three principles:
Sectors ready for digital transformation
We believe that there is a great opportunity for technology to solve some of
the inefficiencies present in emerging markets. However, technology alone
does not digitise industries. Most of our investments apply innovative
business models to industries that are set in their ways, using technology as
an enabler.
Early stage, but with proof points
Cento Ventures aims to be the first institutional investor in most of our deals.
We believe this helps us establish a solid relationship with the founder, and
influence the strategic direction of the company. Our investments are most
frequently at Series A and we usually lead the round. We maintain a realistic
approach to investment and exit valuations, one that is driven by data we
gather on venture capital deals in Southeast Asia.
Expansion to multiple countries
Cento Ventures seeks to help our founders build large digital companies that
are leaders in their industry or category. In a fragmented region like
Southeast Asia, operating across multiple countries is almost inevitable. We
look for founding teams that share this ambition and focus our support on
making their expansion easier. We have a suspicion that great companies
born in one emerging market have an opportunity to replicate their success
across many others.
Cento Ventures is convinced that the opportunity exists for Southeast Asian
entrepreneurs to build transformational digital companies. Learn more about
us at digitalmedia.vc or our Facebook or Linkedin pages.

Introduction

INTRODUCTION
4
Cento Ventures has been tracking data on digital investment activity in Southeast Asia for a
number of years. In our inaugural Southeast Asia tech investment report, covering the first
half of 2017, we have decided to share some of the highlights of our data.
We hope this helps establish a clearer picture of how Southeast Asia’s tech ecosystem is
maturing, where investment is going, and where gaps still remain. We plan to update the
report on a regular basis to show how the landscape is changing over time. In future, it would
be interesting to extend the research to cover a variety of more qualitative matters, such as
the availability of talent, and we look forward to working with partners who can help us
achieve this.
The headline story of Southeast Asia is the continued growth in technology investment. A
record amount of $2.3B was invested during the first half 2017 over more than 140 deals,
compared to $2B in H2 2016 and $1.4B in H1 2017. This suggests a healthy, and growing,
interest in the potential for Southeast Asia’s tech startups. We estimate that this amount may
more than double for the second half, based on a number of large deals that were announced
in July.
A closer look at the data reveals key features, some of which have been present for a while,
that underlie the headline numbers:
- Concentration of capital in a few companies
2017 sees a continuation of ‘mega-deals’ as later stage companies capture ever larger
investments. Fully 81% of funding in H1 2017 was captured by just 3 investments (Go-Jek,
Garena and iFlix). This trend is expected to continue for the second half of 2017.
Interestingly, the earlier stages of capital raising look more stable. The number of deals in
earlier stage deals seems consistent with 2016. The amount invested at each stage is also
relative stable compared to the last couple of years.
Pre-Series A deals average out at US$0.5M per deal, Series A at slightly more than US$2M
per deal, and Series B at US$9M per deal.
- Diversification of capital by country
Excluding the mega-deals (since they skew the data), Indonesia and Singapore-based
startups account for about half of the capital invested in Southeast Asia. This is a decline
from earlier years when startups in these countries accounted for up to three quarters of
investment.
The same split is reflected in the number of deals done: 50% to Indonesia and Singapore
companies, 50% to the rest of the region. Of the rest, Vietnam and Malaysia appear to be
experiencing stable or growing interest, while investment has cooled off in Thailand and the
Philippines. However, a single half year period does not make a trend, so we will look again
once the rest of 2017 has played out.
- Diversification of capital by sector
A few familiar sectors continue attract the most capital – of course these are the sectors in
which the mega-deals are occurring. These are online retail (e-commerce and C2C) and
local services (various on-demand services and urban transportation), along with ‘multi-
vertical’ companies (often a mix of the other two).
Other sectors in which multiple deals are happening and significant amounts of capital
flowing into include financial services, entertainment and travel. We see growing investor
interest in a range of industries such as real estate, healthcare, and enterprise software, as
startups emerge to address issues in many traditional, and still largely offline, parts of
Southeast Asia’s economy. We expect more attention to go toward B2B models as
entrepreneurs explore opportunities to apply technology throughout various industry value
chains.

INTRODUCTION
5
- Funding gaps and fund specialisation
The existence of gaps in the funding available for early stage startups has been observed by
others. It does seem to be the case that Southeast Asian startups raise Series B funding at a
lower rate than those based in the US or Europe. However, we are talking about a less
mature funding environment, and time will tell whether this ‘corrects’ itself over time. Certainly
we are seeing VC funds being raised that target this stage, and the availability of capital for
Series B rounds will likely improve.
We also see the emergence of sector specific funds, including our own new fund, called STV,
which invests exclusively in startups within the online fashion/apparel sector. The fund will
seek out ambitious founders who are using disruptive technology to build winners in this
exciting segment. To help realise this, we have partnered with Start Today, the US$10B
company behind Japan’s leading online branded fashion retailer Zozotown.
- Exits are by M&A
The majority of liquidity events for startups and early stage investors continue to come from
sale of shares either to later stage investors and/or to strategic acquirers, while liquidity
through IPOs remains a rarity. Despite a relatively small sample set (we don’t always know
the details of exit price or percentages liquidated), it seems that a ‘very good’ exit in the
region is priced somewhere in the region of US$200M.
Based on 2017 so far, that may well increase by the time we have a full year’s worth of data
to look at.
Acquirers generally fall into one of two buckets – either they are corporates (e.g. REA, Seek,
Telenor) or larger tech companies (e.g. Alibaba, Grab, Go-jek). In both cases their motivation
for buying Southeast Asia’s startups appear to include geographic extension (e.g. Alibaba) or
acquisition of complementary technology or teams (e.g. Go-jek).
Buyers are typically from within the wider APAC region, although there are isolated cases
from all parts of the world. The largest number of deals are made by Singapore-based
acquirers, while Chinese buyers have spent the most.
Overall it’s been an encouraging first half to 2017, and the outlook for the full year is very
healthy. Various challenges still remain: ensuring sufficient capital is available to high-quality
startups based in the less invested parts of Southeast Asia, and possibly also to startups
based beyond the region’s capital cities (we don’t have a breakdown of the data yet); bridging
funding gaps that still remain; building more successful exit stories that help inspire more
founders to start companies and attract more investors to the ASEAN region. And that’s only
on the financial side of things: better connectedness within the region and to other tech hubs;
more availability of talent; and more equality of opportunity are all topics that merit attention,
perhaps in future editions.
The aim of this report is to show how far Southeast Asia tech has developed during the time
that Cento Ventures has been investing, and perhaps to highlight some of the continuing
challenges. We hope it helps anyone, whether they are startup founders, investors, or
policymakers, achieve a better understanding of the landscape that we all operate within.
Thanks
Mark Suckling Laphat Thantiphipop
Investment landscape

RECORD INVESTMENT IN H1 2017. $7B FORECAST FOR FY 2017
7
Capital invested, US$M and deals done, #
2017 has seen record amounts of internet
technology related investment in Southeast
Asia. Investment activity measured by the
number of deals has declined since its peak in
2015.
We assume the amounts deployed in the
second half of the year will be significantly
higher due to already known large funding
rounds disclosed during July 2017. e.g Grab’s
US$2B, Tokopedia’s US$1.1B, and Traveloka
$500M round.
Notes:
The numbers include various events that while
count as investment in technology company,
are considered non-VC, e.g TenX ICO, Grab-
Honda project financing, Lippo Group funding
of Matahari Mall.
Some early stage incubator funded
companies are not yet included in 2017 H1
data
Source: Cento research
$251 $212 $218 $1,079 $1,172 $929 $1,418 $2,030 $2,267 $4,900
42
54
95
113
214
197192
140 143
160
2013 H1 2013 H2 2014 H1 2014 H2 2015 H1 2015 H2 2016 H1 2016 H2 2017 H1 2017 H2e
Capital invested # of deals

LARGEST DEALS GROW, SMALLEST DEALS COOLING OFF
8
US$0.5M or smaller deals** US$0.5M+ to $2M deals US$2M+ to $5M deals
US$5M+ to $10M deals US$10M+ to $50M deals US$50M+ deals
Source: Cento research
*Data only includes deals which are considered a VC investment
**Various incubator funded early stage companies are yet to be
included in 2017 H1 data
Capital invested, US$M
Deal #
$9 $25 $44 $30 $15
38
104
202
135
78
0
50
100
150
200
250
0.0
10.0
20.0
30.0
40.0
50.0
2013 2014 2015 2016 2017F
$31 $56 $143 $120 $109
29
51
112
9590
0
20
40
60
80
100
120
-
20.00
40.00
60.00
80.00
100.00
120.00
140.00
160.00
2013 2014 2015 2016 2017F
$41 $64 $130 $117 $166
12
17
40
33
46
0
10
20
30
40
50
-
20.00
40.00
60.00
80.00
100.00
120.00
140.00
160.00
180.00
2013 2014 2015 2016 2017F
$44 $109 $134 $204 $191
7
15
19
28 28
0
5
10
15
20
25
30
-
50.00
100.00
150.00
200.00
250.00
2013 2014 2015 2016 2017F
$87 $102 $443 $470 $238
4 4
1921
10
0
5
10
15
20
25
-
100.00
200.00
300.00
400.00
500.00
2013 2014 2015 2016 2017F
$415 $682$2,317 $5,440
3
4
6 6
0
1
2
3
4
5
6
7
-
1,000
2,000
3,000
4,000
5,000
6,000
2013 2014 2015 2016 2017F

AVERAGE INVESTMENT AT PRE-A IS $0.5M, A IS $2M, B IS $9M
9
Deals done by series, # Average deal size by series, $M
57
116
244
174
51
22
51
108
89
66 5
13
27
24
10
4
9
14
25
7
2013 2014 2015 2016 2017 H1
Pre-A A B C+
$0.7$0.5 $0.5 $0.7 $0.5
$2.7
$2.0
$2.8$2.3 $2.1
$4.2
$6.0
$11.5
$8.9 $8.8
2013 2014 2015 2016 2017
Pre-A A B
2017 H1
Source: Cento research

DEALS ARE SPREAD ACROSS THE REGION. 50% TO ID AND SG
10
Source: Cento research
Country of origin is defined as where the company was founded and where it is
believed to generate its core revenues
In 2017, companies based in Indonesia and
Singapore captured about half of investment
activity in Southeast Asia, both in terms of
proceeds and number of deals. The
remainder is split relatively evenly across the
rest of the region, with a slight skew towards
Malaysia.
On deals done, this is fairly consistent with
the last few years data. On capital invested,
the distribution is becoming less skewed to
Indonesia and Singapore-based companies.
The data excludes Garena (Sea), Go-jek,
Grab and Lazada investments since it heavily
skews the proceeds distribution. In the cases
of Garena, Grab and Lazada it is also rather
misleading to allocate their funding to a
particular country, since they are truly
regional.
Share of capital invested by country
Share of deals done by country
20%
39%
30%
50%
29%
54%
34%
35%
25%
29%
9%
8%
12%
10%
30%
2%
8%
14%
8%
4%
10%
8%
4%
4%
6%
5%
3%
5%
3%
3%
2013
2014
2015
2016
2017H1
23%
24%
23%
27%
24%
35%
41%
29%
31%
31%
14%
9%
20%
13%
14%
9%
10%
10%
12%
10%
10%
7%
10%
8%
14%
9%
8%
8%
9%
6%
2013
2014
2015
2016
2017H1
Indonesia Singapore Malaysia Thailand Vietnam Philippines

DEALS IN MY & VN ARE SOLID. TH & PH COOLED OFF
11
Capital invested and deals done in Malaysia
Capital invested and deals done in Vietnam
Capital invested and deals done in Thailand
Capital invested and deals done in Philippines
$18 $31 $110 $118 $253
1216
75
3936
$-
$50
$100
$150
$200
$250
$300
2013 2014 2015 2016 2017F
0
10
20
30
40
50
60
70
80
$4 $28 $125 $90 $34
8
18
37 36
26
$-
$50
$100
$150
$200
$250
$300
2013 2014 2015 2016 2017F
0
10
20
30
40
50
60
70
80
$20 $31 $39 $54 $34
913
39
25
36
$-
$50
$100
$150
$200
$250
$300
2013 2014 2015 2016 2017F
0
10
20
30
40
50
60
70
80
$10 $10 $45 $37 $21
8
15
3227
16
$-
$50
$100
$150
$200
$250
$300
2013 2014 2015 2016 2017F
0
10
20
30
40
50
60
70
80
Source: Cento research

THERE IS DIVERSIFICATION ACROSS INDUSTRY SECTORS
12
Deals done by sector, US$M
While online retail (e-commerce and
C2C) and local services (on-demand
services and urban transportation),
along with ‘multi-vertical’ companies
(often a mix of the two), remain most
heavily funded categories. other
categories are attracting more attention.
Financial services, entertainment and
travel sectors have for some time, and
are continuing to attract investment.
There is also emerging interest in other
categories like real estate, healthcare,
and enterprise software.
2013 2014 2015 2016 2017H1
Multi-vertical $53 $270 $770 $1,750
Local services $1 $328 $372 $776 $9
Retail $71 $175 $219 $814 $75
Travel $34 $12 $78 $238 $13
Financial Services $37 $7 $127 $67 $37
Payments and Remittances $19 $26 $86 $114 $18
Entertainment / Non-Gaming $1 $4 $52 $83 $95
Food $8 $32 $69 $48 $6
Retail backend & infrastructure $0 $6 $27 $38 $67
Comms & communities $4 $23 $16 $80 $0
Healthcare $0 $12 $24 $43 $36
Demand management $2 $6 $85 $12 $3
Logistics $1 $13 $33 $53 $6
Enterprise software & services $6 $13 $28 $29 $19
Advertising $6 $15 $26 $17 $3
Real estate $4 $2 $9 $15 $26
Education $0 $7 $12 $7 $10
Employment $3 $4 $11 $10 $4
Entertainment / Gaming $4 $8 $11 $7 $0
Others $0 $1 $0 $0
Source: Cento research

% of companies raising seed round that raised follow-on rounds
13
Source: Cento research
https://www.cbinsights.com/research/venture-capital-funnel-2/
http://www.atomico.com/news/the-state-of-european-tech-2016
IS THERE A SERIES B GAP?
We tracked Southeast Asian startups
that announced seed funding between
2013-2015 and compare the rate of
follow-on fundraising with data from the
US and Europe. It appears that startups
in Southeast Asia have been able to
attract Series A funding at a broadly
similar rate to more mature
ecosystems.
A funding ‘gap’ seems to remain at
Series B however, where follow-on
rates are lower. However our cohort
data on Southeast Asia is more recent,
and therefore there is potential for rates
of follow-on funding to increase.0%
10%
20%
30%
40%
50%
60%
70%
80%
90%
100%
Seed Follow-on round 1 Follow-on round 2 Follow-on round 3
SE Asia 2013 SE Asia 2014 SE Asia 2015 US 2008-2010 Europe 2010

FUND FORMATION APPEARS TO SLOW IN 2016
14
Southeast Asia focused funds formed and AUM*, US$M
Source: Cento research
*in cases using best estimates
$561 $814 $1,752 $588
25
35
52
34
0
10
20
30
40
50
60
0
200
400
600
800
1000
1200
1400
1600
1800
2000
2013 2014 2015 2016
AUM Number of funds formed

$357
$210
$30 $28$20 $18 $12 $10 $10 $5
Formation Group Vertex Ventures Beacon Ventures (K-Bank)
East Ventures VSV Fund SeedPlus (JungleVentures)
STV (Cento) Intudo Ventures Shiftventure Innovatube
15
SOME NEW (AND FAMILIAR) NAMES WITH NEW FUNDS IN 2017
Southeast Asia focused funds launched during 2017 by AUM, US$M
Source: Cento research
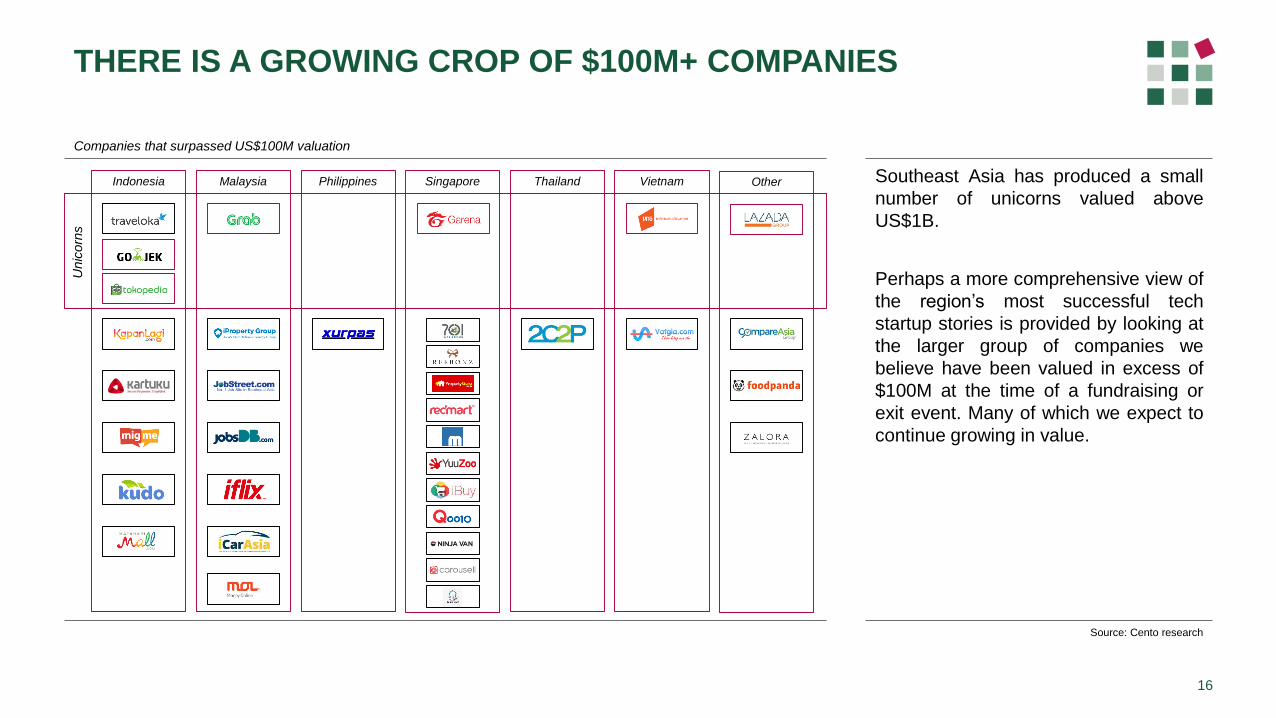
THERE IS A GROWING CROP OF $100M+ COMPANIES
16
Companies that surpassed US$100M valuation
Source: Cento research
Southeast Asia has produced a small
number of unicorns valued above
US$1B.
Perhaps a more comprehensive view of
the region’s most successful tech
startup stories is provided by looking at
the larger group of companies we
believe have been valued in excess of
$100M at the time of a fundraising or
exit event. Many of which we expect to
continue growing in value.
Unic
orn
s
Indonesia Malaysia Philippines Singapore Thailand Vietnam Other
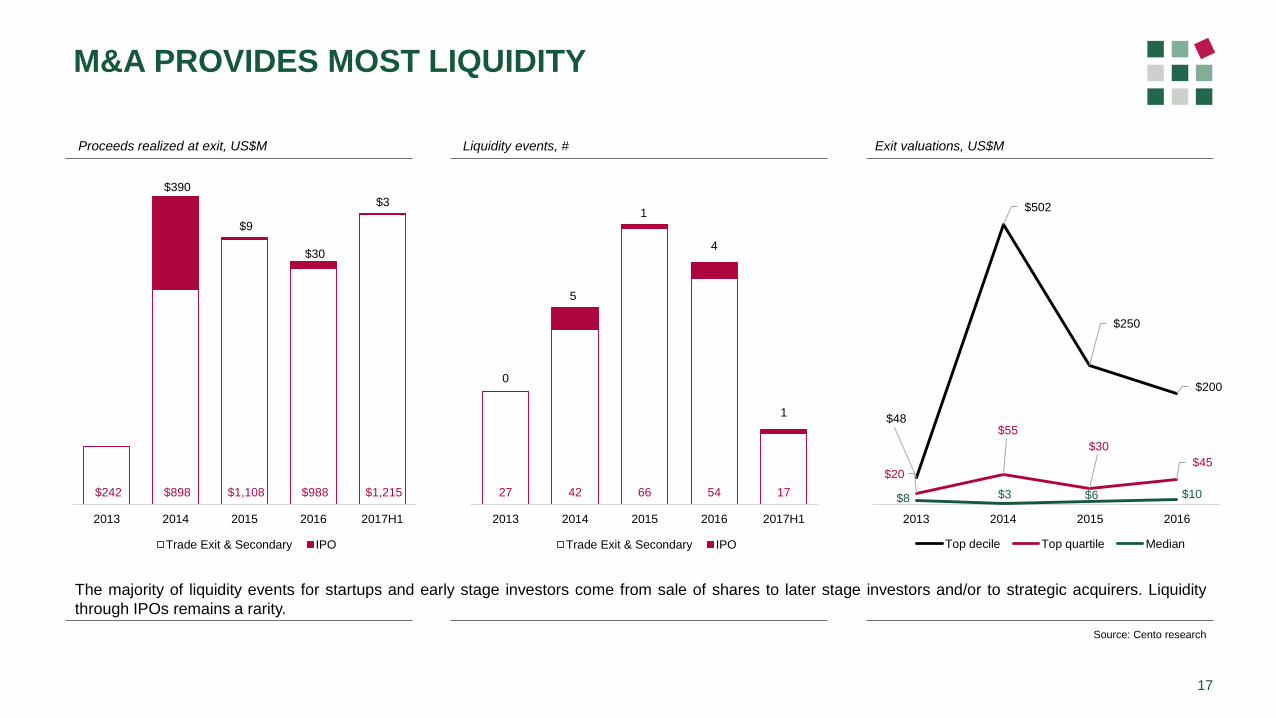
M&A PROVIDES MOST LIQUIDITY
17
Source: Cento research
Liquidity events, #Proceeds realized at exit, US$M
The majority of liquidity events for startups and early stage investors come from sale of shares to later stage investors and/or to strategic acquirers. Liquidity
through IPOs remains a rarity.
27 42 66 54 17
0
5
1
4
1
$-
$10
$20
$30
$40
$50
$60
$70
$80
2013 2014 2015 2016 2017H1
Trade Exit & Secondary IPO
$242 $898 $1,108 $988 $1,215
$390
$9
$30
$3
$-
$200
$400
$600
$800
$1,000
$1,200
$1,400
2013 2014 2015 2016 2017H1
Trade Exit & Secondary IPO
$48
$502
$250
$200
$20
$55
$30
$45
$8 $3 $6 $10
2013 2014 2015 2016
Top decile Top quartile Median
Exit valuations, US$M

EXITS ARE HAPPENING, BUT STILL RELATIVELY FEW IN NUMBER
18
Source: Cento research
$790 $543 $700 $2,200
3
2 2
4
2013 2014 2015 2016 2017F
$67 $239 $220 $80 $100
1
3 3
1 1
2013 2014 2015 2016 2017F
$90 $162 $209 $110 $144
3
5
6
3
4
2013 2014 2015 2016 2017F
$87 $63 $110 $95 $40
7
4
10 10
4
0
2
4
6
8
10
12
0
20
40
60
80
100
120
2013 2014 2015 2016 2017F
$11 $26 $38 $24 $29
4
9
13
98
0
2
4
6
8
10
12
14
0
5
10
15
20
25
30
35
40
45
2013 2014 2015 2016 2017F
$7 $9 $15 $10 $5
12
22
31
25
13
2013 2014 2015 2016 2017F
Amount, US$M
Events, #
Liquidity events and proceeds, <US$1M Liquidity events and proceeds, US$1M+ to $5M Liquidity events and proceeds, US$5M+ to $20M
Liquidity events and proceeds, US$20M+ to $50M Liquidity events and proceeds, US$50M+ to $100M Liquidity events and proceeds, >US$100M

19
Source: Cento research
ACQUIRERS ARE FROM WITHIN SE ASIA & APAC REGION
Country of origin of acquirer, by deals done, 2013-2017 Country of origin of acquirer, by capital invested, 2013-2017, US$M
35
15
98
7
54
2 2
$1,500
$917
$331
$244$176
$86 $84 $72 $55 $51 $50 $47 $40

Methodology
METHODOLOGY
21
Data sources:
Our data is compiled from a number of sources, although we primarily rely on public press
announcements from companies and investors. Our team researches the validity of claims and
supplements incomplete information with our insights. Our data passes through a number of quality
control checks. Inevitably data is incomplete and in some cases we use best estimates to assess a
particular deal.
Deal definitions
Stage:
Each series definition is determined as follows:
- Pre-Series A: amounts from $10K-1M. Purpose of investment tends to be building the idea/team, in
some cases the company generates revenue.
- Series A: amounts from $500K-2M. Product has been built and proven initial/repeatable revenue.
Investment tends to be establishes domestic position, and sometimes scaling regionally.
- Series B: amounts from $2M-10M. Investment tends to be increases scale, either domestically or
regionally.
- Series C+: any amount invested later than Series B. Series C, Series D, later series investments,
pre-IPO, mezzanine.
Deal type:
We focus mainly on venture capital deals – investments made by fund entities into early stage startups,
whether they are from independent funds of corporate venture capital entities. This is subset of the
total number of early stage tech deals in the region.
We separate the following from most of our data, apart from the ‘total capital invested and total deals
done’ chart:
- Corporate transfers: events where a corporate entity funds an entity in the region in which it owns a
majority or significant minority stake (e.g. Rocket Internet, Lippo Group)
- Project financing: A deal which was a partnership for an identified purpose – e.g. Grab-Honda.
- Non-Southeast Asia deals: e.g. India and China focused companies that happen to use Singapore for
their corporate domicile.
Country of origin:
Determined by the country in which the company was founded, and has its primary base of operation
(defined in terms of revenue, if known). At the (subjective) point where the company has both operations
in multiple countries in Southeast Asia and substantial revenues generated in multiple countries, then is
may be classified as Southeast Asia in country of origin.
Sector classification:
Cento’s definition of the industry segment in which the company’s primary business focus sits. A full
taxonomy of sector allocation is available. In cases where a company has multiple sector focus with
different units generating thought to generate substantial revenue, then multi-vertical category is used.
Fund definitions
Mapping fund allocations is an inexact science. We count the number of funds that have been observed
doing early stage tech investment in Southeast Asia. We also try to assess the allocation of those funds
to the region. In some cases (e.g. Cento Ventures) that is equivalent to 100% of their AUM. In many
others with a broader, or no particular, geographic focus, allocation is an estimate based on information
received from the fund manager, or the relative number of deals that they have done within the region
compared to elsewhere.

www.cento.vc
+65 6816 2810
Office address: 56B Pagoda Street, Singapore
059215
Mailing address: Cento Ventures, 3 Church Street,
Level 8, Singapore 049483
Co
nta
ct
22