southern employee benefits conference beyond stock options long-term incentives in a volatile or...
Post on 19-Dec-2015
214 views
TRANSCRIPT

Southern Employee Benefits Conference
Beyond Stock Options
Long-Term Incentives in a Volatile or Protracted Bear Market
Copyright © May 7, 1998

Overview: Stock options have become the dominant form of long-term incentive compensation today.
More companies use options than any other form of long-term incentive.
The value of option grants continues to increase.
Levels of participation have expanded.
Long-term incentives now make up a major portion of total pay.
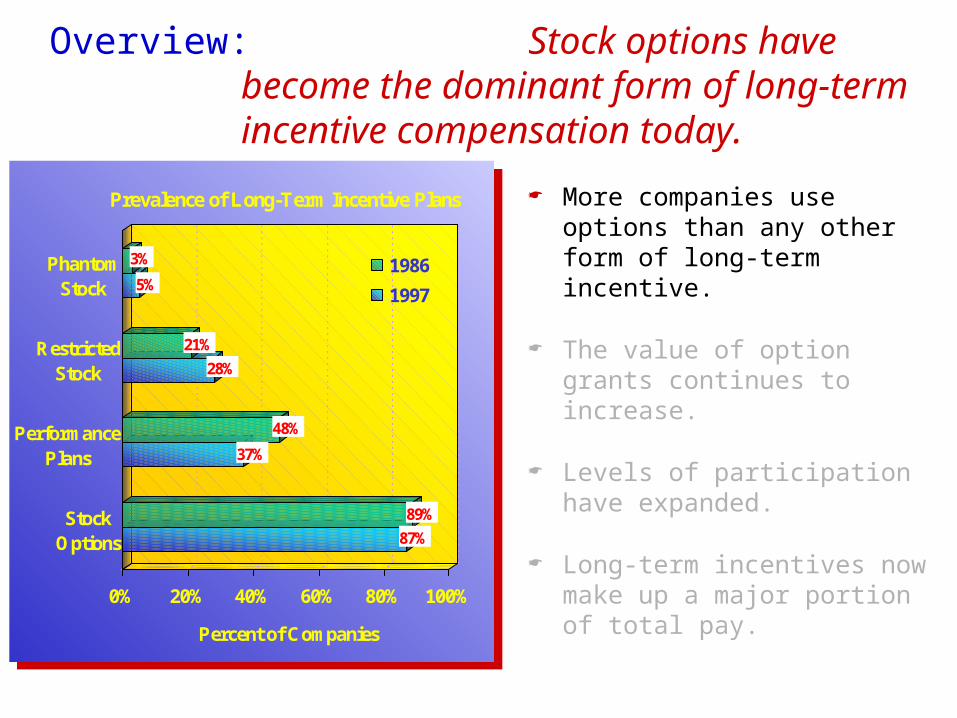
87%
89%
37%
48%
28%
21%
5%
3%
0% 20% 40% 60% 80% 100%
Percent of Companies
StockOptions
PerformancePlans
RestrictedStock
PhantomStock
Prevalence of Long-Term Incentive Plans
1986
1997
Overview: Stock options have become the dominant form of long-term incentive compensation today.
More companies use options than any other form of long-term incentive.
The value of option grants continues to increase.
Levels of participation have expanded.
Long-term incentives now make up a major portion of total pay.
313,500
262,500
222,000
0 100,000 200,000 300,000 400,000
1997
1995
1993
Median Expected Value of Long-Term Incentives($300,000 Base Salary)

2.4%
1.8%
1.69%
1.27%
0.0% 0.5% 1.0% 1.5% 2.0% 2.5%
Workforce Eligibility
1997
1994
1991
1988
Prevalence of Long-Term Incentive Plans
Overview: Stock options have become the dominant form of long-term incentive compensation today.
More companies use options than any other form of long-term incentive.
The value of option grants continues to increase.
Levels of participation have expanded.
Long-term incentives now make up a major portion of total pay.

26% 21% 46% 7%
37% 24% 31% 8%
0% 20% 40% 60% 80% 100%
Percent of Companies
1997
1989
Prevalence of Long-Term Incentive Plans
Base Bonus LTI Benefits
Overview: Stock options have become the dominant form of long-term incentive compensation today.
More companies use options than any other form of long-term incentive.
The value of option grants continues to increase.
Levels of participation have expanded.
Long-term incentives now make up a major portion of total pay.
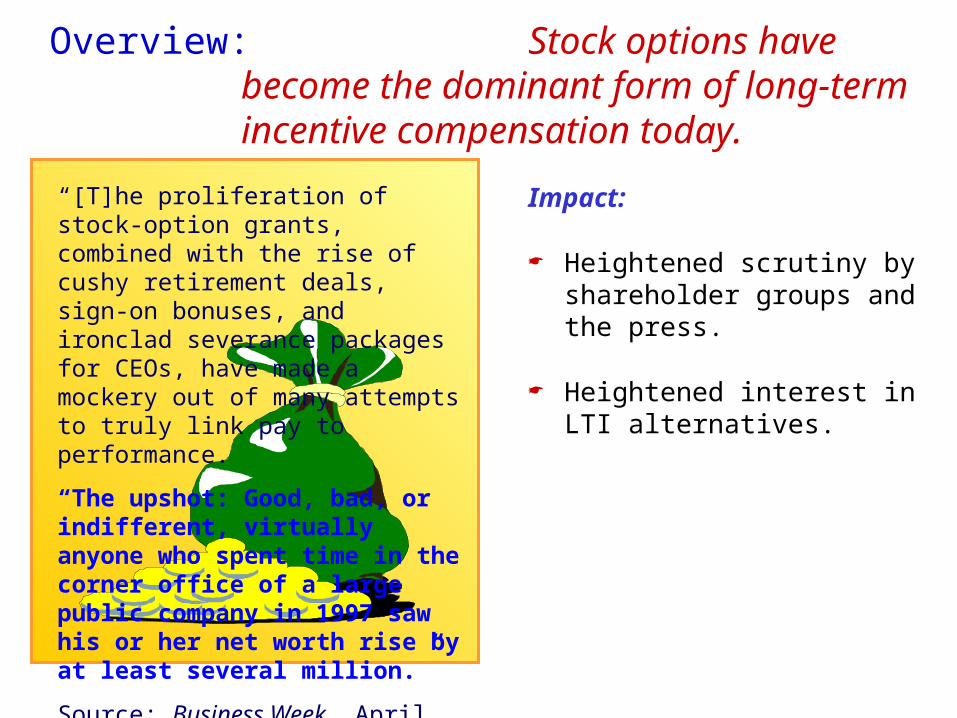
Overview: Stock options have become the dominant form of long-term incentive compensation today.
Impact:
Heightened scrutiny by shareholder groups and the press.
Heightened interest in LTI alternatives.
“[T]he proliferation of stock-option grants, combined with the rise of cushy retirement deals, sign-on bonuses, and ironclad severance packages for CEOs, have made a mockery out of many attempts to truly link pay to performance.
“The upshot: Good, bad, or indifferent, virtually anyone who spent time in the corner office of a large public company in 1997 saw his or her net worth rise by at least several million.”
Source: Business Week, April 20, 1998.

Overview: The pros and cons of management stock options.
Pros Direct alignment of management
and shareholder interests.
A truly long-term perspective.
Better appreciation and understanding of value drivers.
Cons Not line-of-sight.
Can’t differentiate management performance from industry fortune.
Lack stimulus during economic downturns.
Perceived internally and externally as a game of chance.
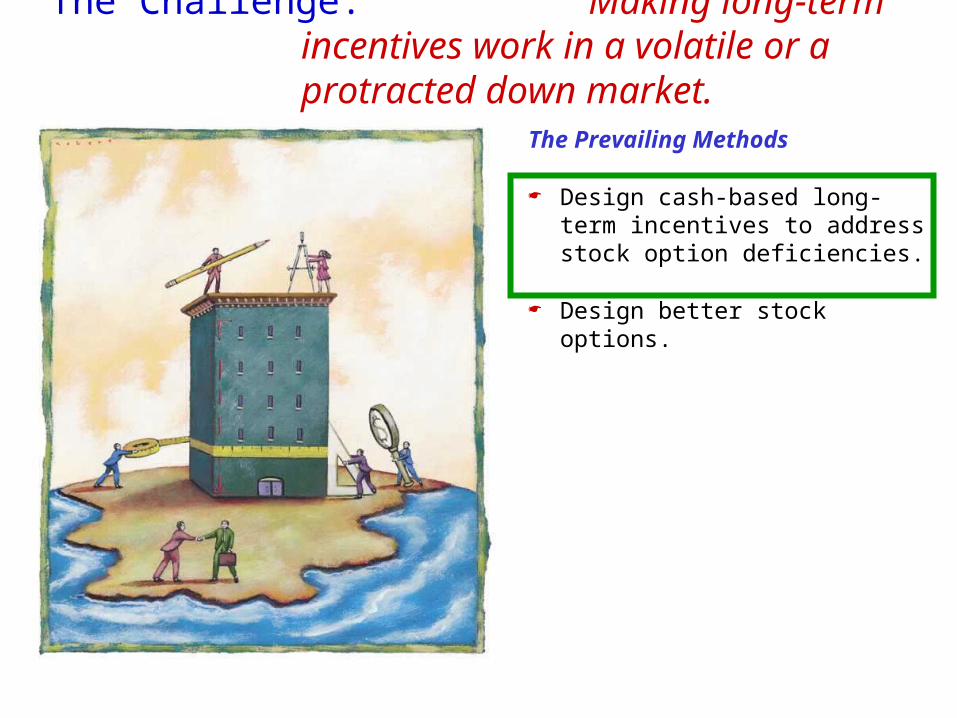
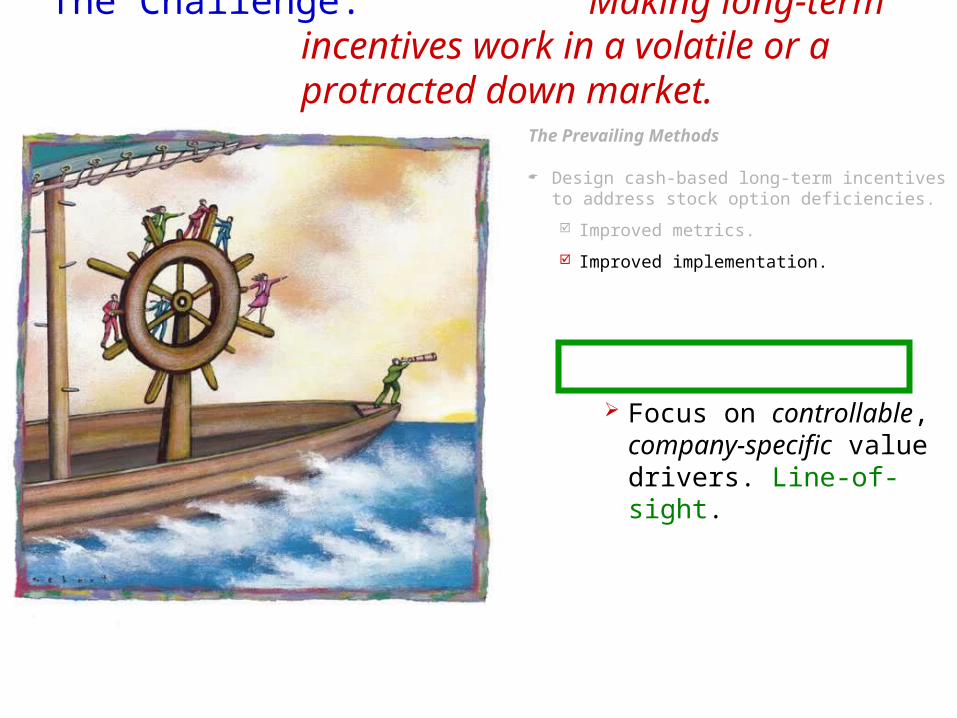
The Challenge: Making long-term incentives work in a volatile or a protracted down market.
The Prevailing Methods
Design cash-based long-term incentives to address stock option deficiencies.
Design better stock options.
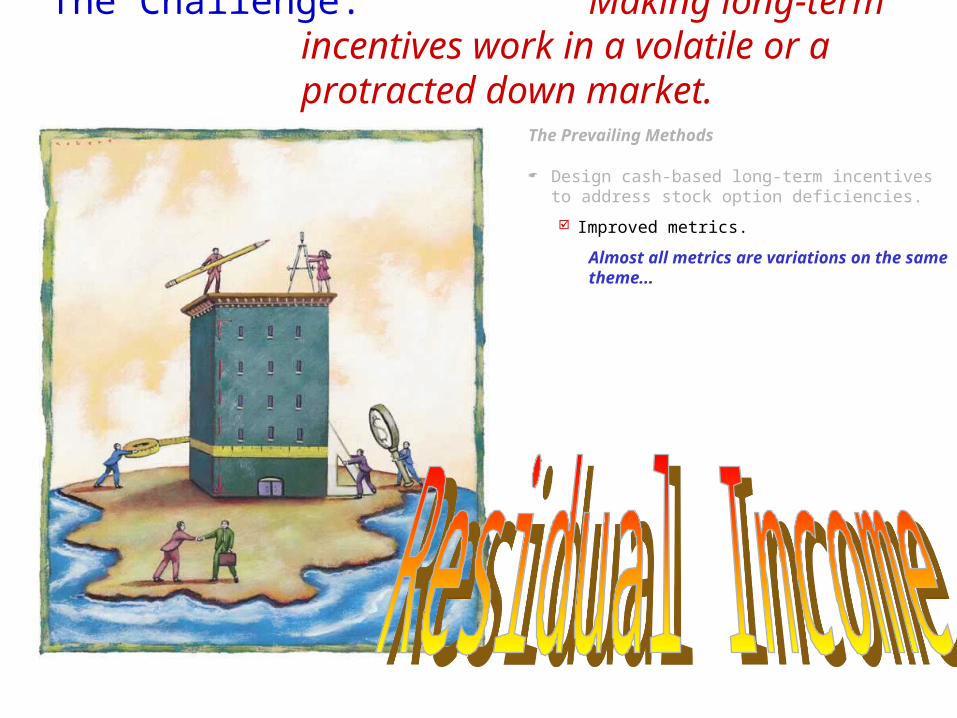
The Challenge: Making long-term incentives work in a volatile or a protracted down market.
The Prevailing Methods
Design cash-based long-term incentives to address stock option deficiencies.
Improved metrics.
Almost all metrics are variations on the same theme...

The Challenge: Making long-term incentives work in a volatile or a protracted down market.
RI = Operating Profit - Opportunity Cost of Running the Business
The return (or expectation) foregone by not investing in a comparably risky portfolio of projects—the weighted cost of debt and equity capital.
Opp. Cost = Cost of Capitalx Beg. Capital
Sales– Cost of Sales– Overhead EBIT– Tax on Operations NOPAT
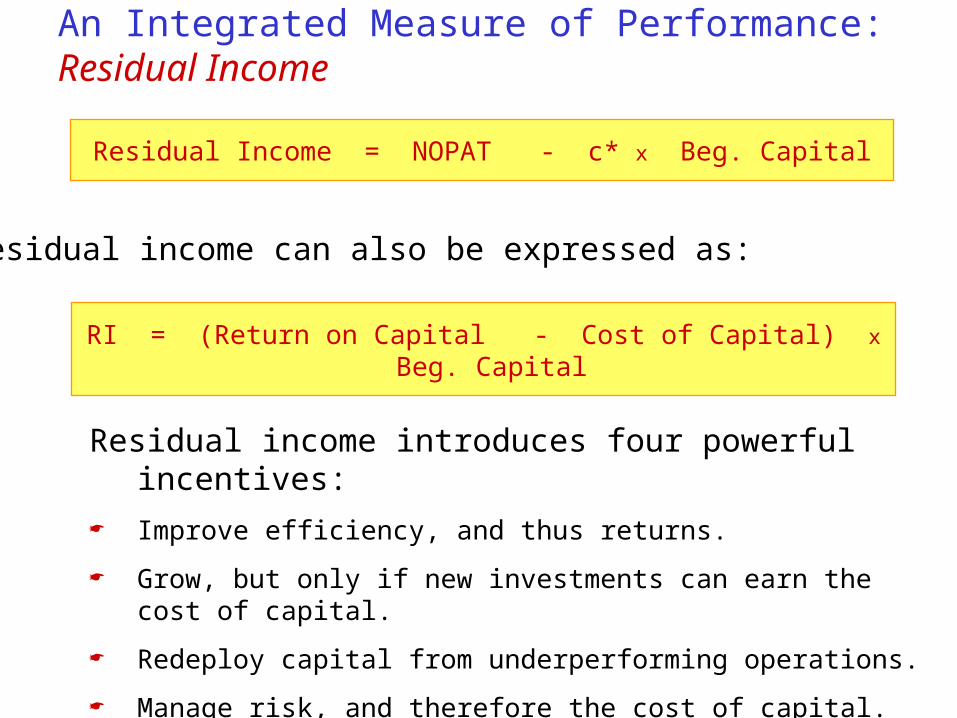
Residual Income = NOPAT - c* x Beg. Capital
An Integrated Measure of Performance: Residual Income
Residual income can also be expressed as:
RI = (Return on Capital - Cost of Capital) x Beg. Capital
Residual income introduces four powerful incentives: Improve efficiency, and thus returns.
Grow, but only if new investments can earn the cost of capital.
Redeploy capital from underperforming operations.
Manage risk, and therefore the cost of capital.

Value Proposition: Residual Income Drives MVA
PV CF1
Value
PV CF3
PV CF2
PV
NOPATC
Discounted Free Cash Flow
Capital
Discounted Residual Income
PV RI1
PV RI2
PV RI3
PV RIC
Value
MVA
The discounted present value of a company’s expected residual income is its market value premium or discount to book value (“MVA”).
A company’s discounted residual income plus its level of capital employed will always equal the discounted present value of expected Free Cash Flow.
Residual income is the only integrated measure of growth and profitability which relates directly to stock value.

The Challenge: Making long-term incentives work in a volatile or a protracted down market.
The Prevailing Methods
Design cash-based long-term incentives to address stock option deficiencies.
Improved metrics.
It all boils down to...
Adopting a metric which works well with your company.
Conceptually simple.
Difficult to manipulate.
Economically rigorous.
The Challenge: Making long-term incentives work in a volatile or a protracted down market.
The Prevailing Methods
Design cash-based long-term incentives to address stock option deficiencies.
Improved metrics.
Improved implementation.
Focus on controllable, company-specific value drivers. Line-of-sight.

Improved Implementation:Making performance measures “line-of-sight”
Raw Materials
Labor
Other
Plant & Equipment
Property
Inventory
Receivables
Payables
Good Will
Intangibles
Revenue
Tax
Operating Expenses
Cost of Capital
Capital Employed
Capital Charge
NOPAT
EVA
Legend:
High Impact Medium Impact Low Impact
Legend:
High Impact Medium Impact Low Impact
Volume
Cost of Goods Sold
SG&A
Cost of Debt
Cost of Equity
Fixed Capital
Working Capital
Other
Price

The Challenge: Making long-term incentives work in a volatile or a protracted down market.
The Prevailing Methods
Design cash-based long-term incentives to address stock option deficiencies.
Improved metrics.
Improved implementation.
Focus on controllable, company-specific value drivers. Line-of-sight.
Make calibration and target-setting truly long-term.
Understand corporate culture and “process.” Help build value-creation coaches.

The Challenge: Making long-term incentives work in a volatile or a protracted down market.
Design cash-based long-term incentives to address stock option deficiencies.
Design better stock options.
What would we like to see?
Real capital at risk. Management rewarded for its
distinctive contribution to share value. Meaningful incentives during
downturns. A strong aversion to repricing.
The Prevailing Methods
Design Challenge 1: Measure good management, not good luck.
Contention: Commodity price movements and stock market activity explain the vast majority of most companies’ stock price performance.
Example: The Specialty Chemical Industry
20% 10% 0% (10%) (20%)% Change in S&P 500
(10%)
(5%)
0%
5%
10%
% Change inMethanol Prices
(15%) (10%) (5%) 0% 5% 10% 15%
% Change in Market Value
(20%) 0% 20%% Change in Ethylene Prices
Sample:
Georgia Gulf CorpLyondell Petrochemical Co
Dow Chem Co
Union Carbide Corp
Olin Corp
R 2
0 637
80 0%
.
.
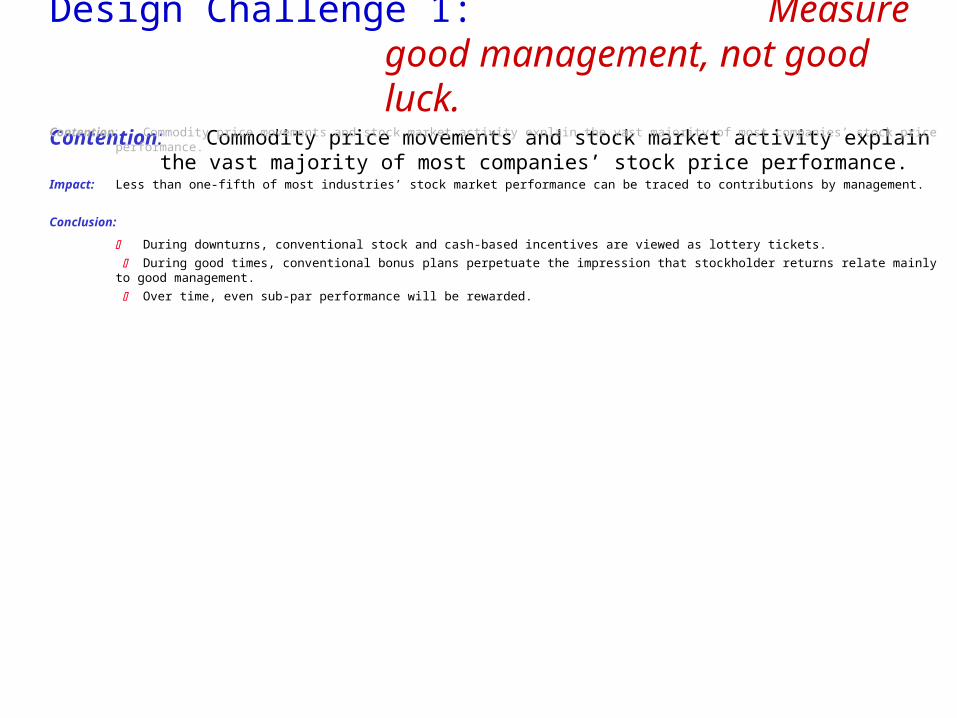
Design Challenge 1: Measure good management, not good luck.
Contention: Commodity price movements and stock market activity explain the vast majority of most companies’ stock price performance.
Contention: Commodity price movements and stock market activity explain the vast majority of most companies’ stock price performance.
Impact: Less than one-fifth of most industries’ stock market performance can be traced to contributions by management.
Conclusion:
During downturns, conventional stock and cash-based incentives are viewed as lottery tickets.
During good times, conventional bonus plans perpetuate the impression that stockholder returns relate mainly to good management.
Over time, even sub-par performance will be rewarded.
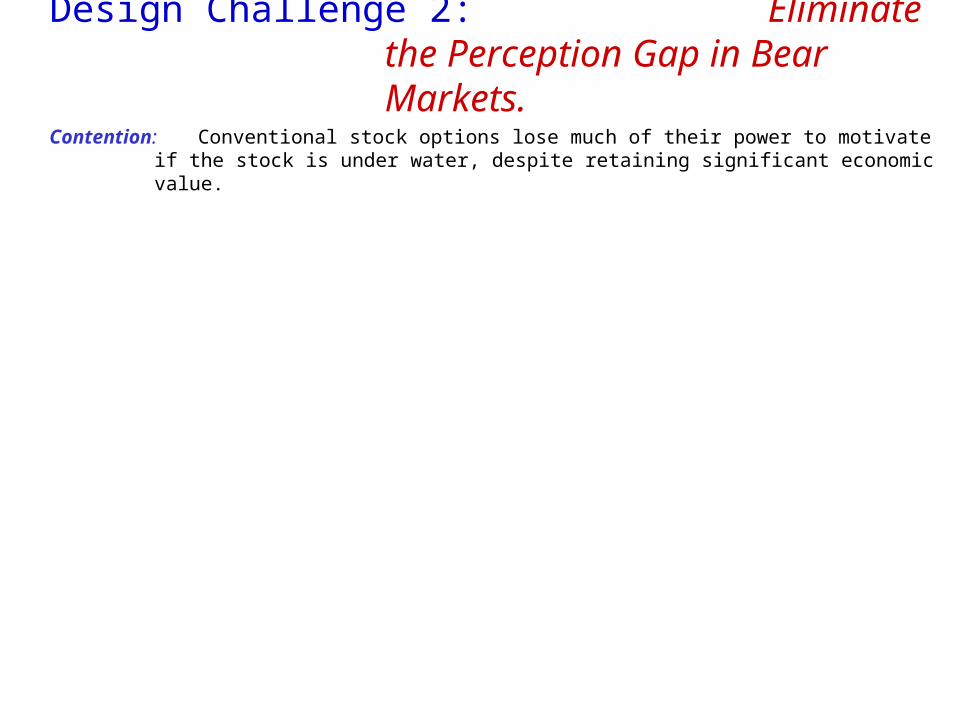
Design Challenge 2: Eliminate the Perception Gap in Bear Markets.
Contention: Conventional stock options lose much of their power to motivate if the stock is under water, despite retaining significant economic value.
($10)
$0
$10
$20
$30
$40
$40 $50 $60 $70 $80 $90 $100Underlying Stock Price
Value ofStock Option
Option ValueExercise Value
Option Value at Grant
Option Value Today
Perceived Value at Grant
Perceived Value Today

Design Challenge 2: Eliminate the Perception Gap in Bear Markets.
Contention: Conventional stock options lose much of their power to motivate if the stock is under water, despite retaining significant economic value.
Implication:
1. There is often a wide gap between management’s perception of a stock option’s value and its economic substance. This is especially true for companies beset by industry cycles.
Reason: Managers focus on exercise or conversion value, not option value.
2. During downturns, stockholders receive a severely diluted motivational return on the high cost of previously granted options.

Design Approach 1: Tinker with the options themselves...
1. Index against industry performance.
Specifically: Exclude value gains (or losses) attributable to the S&P or industry.
Impact: Creates options where the difference between option value and exercise value (and thus the perception gap) is small.
Justifies issuing more options as a consequence.
but don’t confuse this with repricing.
($40)
($20)
$0
$20
$40
$60
$80
$100
$120
$40 $60 $80 $100 $120 $140
1 Standard Option 1 Indexed Option 5.6 Indexed Options
1.0 Slope:
Slope: 5.4
Slope: 0.97
Portfolio of 5.6 at-the-money indexed options is worth just one out-of-the-money option, but ...
The difference in upside (and downside) potential is enormous, thus greatly amplifying incentives.
Opti
on V
alu
e
Stock Value

($10)
$0
$10
$20
$30
$40
$40 $50 $60 $70 $80 $90 $100 $110 $120
1 Standard Option 1 Indexed Option
1.0 Slope:
1.0 Slope:
High covariance with index means much closer relationship between option value and conversion value.
Unchanging strike price and longer term to maturity makes conventional option more valuable than indexed option, despite higher starting point..
Design Approach 1: Tinker with the options themselves...
Indexing options exploits the perception gap to comparative advantage.
Perception Reality
($10)
$0
$10
$20
$30
$40
$40 $50 $60 $70 $80 $90 $100 $110 $120
1 Standard Option 1 Indexed Option
1.0 Slope:
1.0 Slope:
At-the-money option considerably more valuable than out-of-the-money option.
Indexing means more control over destiny—thus greater option value.
Op
tion
Valu
e

($40)
($20)
$0
$20
$40
$60
$80
$100
$120
$40 $60 $80 $100 $120 $140
1 Standard Option
1 Leveraged Option
8.4 Leveraged Options
1.0 Slope:
Slope: 3.7
Slope: 0.4
Design Approach 1: Tinker with the options themselves...
1. Index against industry performance
2. Reward performance, not longevity.
Consider performance options—options which raise the exercise price over time.
Because performance options are worth less than conventional options, managers can be offered more such options without diluting the value of stockholders’ investment.

Design Approach 2: Tinker with capital structure...
1. Make capital structure line-of-sight.
Create equity in the business units themselves.
Partial public offerings.
Spinoffs and split-ups.
Letter stock.
Restructure business portfolio to reflect core competencies.

Design Approach 2: Tinker with capital structure...
1. Make capital structure line-of-sight.
Create equity in the business units themselves.
Partial public offerings.
Spinoffs and split-ups.
Letter stock.
Restructure business portfolio to reflect core competencies.
28 Large Corporate Split-Ups10-Day Gain
5%25%
50%
100%
Hanson PLC
W.R. GraceNat'l Medical
MarriottHost
KodakEastman Chemical
AllegisHertz
D&BAnheuser Busch
Campbell Taggart
Quaker OatsFisher-Price
SearsDean Witter
General MillsDarden
Eli LillyGuidant
James RiverCrown
RoadwayCaliber
GMEDS
Am. CyanamidCytec
BaxterAHS
ITTHartford
Am. ExpressLehman
Cooper IndustriesCooper Cameron
CoorsATX
AT&TLucent,NCR
Morrisoncafeterias, hospitals
MarriottMarriott Int'l
LittonWestern Atlas Union Carbide
Praxair
DoleCastle & Cooke
The LimitedIntibrands
CeridianControl Data
De-Conglomeratization De-Integration
Proactive
Reactive/Defensive
Positive
Negative

17 Large Corporate Split-Ups365-Day Gain
100%
5%25%
50%
Union CarbidePraxair
MarriottMarriott Int'l
CeridianControl Data
Eli LillyGuidant
CoorsATX
SearsDean Witter
KodakEastman Chemical
LittonWestern Atlas
AllegisHertz
Am. ExpressLehman
James RiverCrown
DoleCastle & Cooke
General MillsDarden
Am. CyanamidCytec
The LimitedIntibrands
Cooper IndustriesCooper Cameron
Quaker OatsFisher-Price
De-Conglomeratization De-Integration
Proactive
Reactive/Defensive
Positive
Negative
Design Approach 2: Tinker with capital structure...
1. Make capital structure line-of-sight.
Create equity in the business units themselves.
Partial public offerings.
Spinoffs and split-ups.
Letter stock.
Restructure business portfolio to reflect core competencies.

Design Approach 2: Tinker with capital structure...
1. Make capital structure line-of-sight.
2. Make the stock a management play rather than an industry play.
Issue equity-linked debt—pegged to the stock price of competitors.

Design Approach 2: Tinker with capital structure...
Specifics: DECS or Prides issued against competitors.
Hybrid debt instruments whose interest payments are linked to the performance of a particular stock—in this case, a market-weighted or equally-weighted portfolio of competitors.
Examples: Lyondell, Enron, NationsBank, Netscape, Nextel, Telecom Argentina, plus seven others—each issued for tax reasons, not business reasons. Issuance relatively low-cost and routine.
1. Make capital structure line-of-sight.
2. Make the stock a management play rather than an industry play.

Design Approach 2: Tinker with capital structure...
1. Make capital structure line-of-sight.
2. Make the stock a management play rather than an industry play.
Issue equity-linked debt—pegged to the stock price of competitors.
Issue commodity-linked debt—pegged to the price of raw materials.

The Common Theme: Pay for Performance, Not Luck
Inexpensive way for company, and thus its shareholders, to place an extended bet against the competition while investing long in management.
Lessens industry risk (and thus beta). Effectively hedges a portion of the equity against all risk except that of lagging behind the industry.
Lowers the cost of capital. Although risk reduction for stockholders would be offset by increased risk (and reward) for creditors, the transferred return would be tax deductible.
Improves cash flow. Debt service would decline when the market anticipated an industry downswing, and would rise in anticipation of an upswing.
Transforms investing in company from an industry play into a management play without shuffling investors.

Summary: Getting the most out of long-term incentives.
Equity is still the most powerful long-term motivator.
Real long-term incentives require real at-risk capital.
LTI’s are more effective if made line-of-sight—whether through cash-based incentives, changes in capital structure, portfolio management or better analysis of value drivers.
LTI’s are more effective if they differentiate management performance from the economy’s.

Summary: Getting the most out of long-term incentives.
Bottom Line
Long-term incentives are most effective when part of a comprehensive financial and strategic value-based initiative to make managers think and behave like diversified owners.