southstar energy services
DESCRIPTION
SouthStar Energy Services. Andrew W. Evans Vice President-Finance and Treasurer. How Did We Get Here?. What A Difference A Year Makes. Increased ownership to 70% (Dynegy buyout) Improved credit quality of customer base Stabilized market share - PowerPoint PPT PresentationTRANSCRIPT

SouthStar Energy Services
Andrew W. Evans
Vice President-Finance and Treasurer

2003 Analyst/Investor Conference 2
How Did We Get Here?
REGULATORY TIMELINE
Natural Gas Competition and Deregulation is Effective
GPSC votes to allow no natural gas service disconnections until April 1,
2001 / Moratorium
Infinite Energy becomes Provider of Last Resort (POLR)
The Natural Gas Consumer's Relief Act (HB 1568) becomes effective
SCANA Energy chosen to become Regulated Provider
Southern Company Gas becomes certif icated gas marketer
Random Assignment occurs; AGLC exits the merchant function
GPSC finalizes relief packagefor low -income seniors
May
-97
Jul-9
7
Sep
-97
Nov
-97
Jan-
98
Mar
-98
May
-98
Jul-9
8
Sep
-98
Nov
-98
Jan-
99
Mar
-99
May
-99
Jul-9
9
Sep
-99
Nov
-99
Jan-
00
Mar
-00
May
-00
Jul-0
0
Sep
-00
Nov
-00
Jan-
01
Mar
-01
May
-01
Jul-0
1
Sep
-01
Nov
-01
Jan-
02
Mar
-02
May
-02
Jul-0
2
Sep
-02
Nov
-02
Jan-
03
Mar
-03
May
-03
Jul-0
3
Sep
-03
Nov
-03

2003 Analyst/Investor Conference 3
What A Difference A Year Makes
• Increased ownership to 70% (Dynegy buyout)
• Improved credit quality of customer base
• Stabilized market share
• Continue customer service and credit quality improvements
• Progress toward resolution of disproportionate sharing issue

2003 Analyst/Investor Conference 4
$16.8
$41.5
$10.0
$15.0
$20.0
$25.0
$30.0
$35.0
$40.0
$45.0
$50.0
$55.0
$60.0
In m
illio
ns
2001A 2002A 2003F
SouthStar EBT*
SouthStar Has Become A Solid Annuity-Quality Earnings Contributor
*Denotes earnings for 100% of the partnership.
$45-55

2003 Analyst/Investor Conference 5
GNG 37%Mktr C13%
Others 9%
Mktr A 27%
Mktr B 14%
Largest Retail Marketer in Georgia
• SouthStar markets natural gas in Georgia under the trade name Georgia Natural Gas (GNG)
• SouthStar consistently has 10% lead over second-largest marketer
(538,000 customers)

2003 Analyst/Investor Conference 6
Stabilized Market Share
30
35
40
45
50
Jan-
02
Feb-0
2
Mar
-02
Apr-02
May
-02
Jun-0
2
Jul-0
2
Aug-02
Sep-0
2
Oct-0
2
Nov-02
Dec-02
Jan-
03
Feb-0
3
Mar
-03
Apr-03
May
-03
Jun-0
3
Jul-0
3
Aug-03
Sep-0
3
Oct-0
3
Nov-03
(Mar
ket
Sh
are
%)
SouthStar’s market share is fairly SouthStar’s market share is fairly constant at around 37%constant at around 37%
SouthStar’s market share is fairly SouthStar’s market share is fairly constant at around 37%constant at around 37%

2003 Analyst/Investor Conference 7
Retail Pricing in Georgia
GNG Historical Price vs. Georgia Marketer Average
0.500
0.600
0.700
0.800
0.900
1.000
1.100
Jan-
01
Apr-01
Jul-0
1
Oct-0
1
Jan-
02
Apr-02
Jul-0
2
Oct-0
2
Jan-
03
Apr-03
Jul-0
3
Oct-0
3
Avg. Retail Price GNG Price
$/therm
2003 Analyst/Investor Conference 8
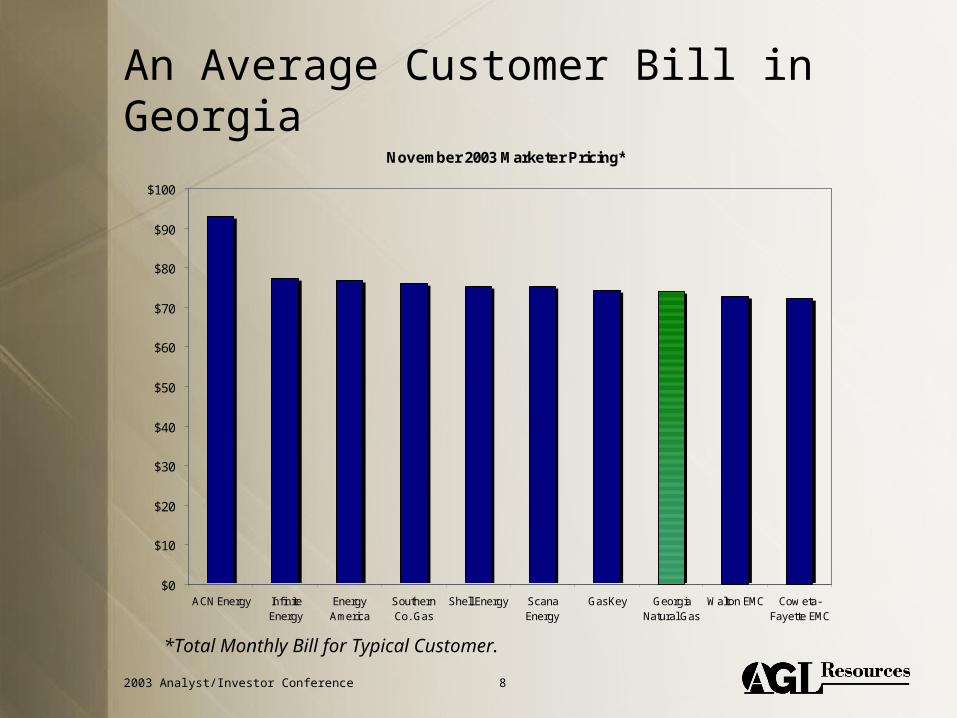
An Average Customer Bill in Georgia
*Total Monthly Bill for Typical Customer.
November 2003 Marketer Pricing*
$0
$10
$20
$30
$40
$50
$60
$70
$80
$90
$100
ACN Energy InfiniteEnergy
EnergyAmerica
SouthernCo. Gas
Shell Energy ScanaEnergy
GasKey GeorgiaNatural Gas
Walton EMC Cow eta-Fayette EMC

2003 Analyst/Investor Conference 9
Significantly Reduced Bad Debt
0123456789
10111213141516171819202122232425
Jan-0
1
Mar
-01
May
-01
Jul-0
1
Sep-01
Nov-01
Jan-0
2
Mar
-02
May
-02
Jul-0
2
Sep-0
2
Nov-0
2
Jan-0
3
Mar
-03
May
-03
Jul-0
3
Sep-03
%
Bad Debt as % of RevenueBad Debt as % of Revenue

2003 Analyst/Investor Conference 10
Focus on Aggressive Collections and Credit Scoring
Historical Monthly Accounts Receivable
$0
$10
$20
$30
$40
$50
$60
$70
Jan-0
1
Mar
-01
May
-01
Jul-0
1
Sep-0
1
Nov-01
Jan-0
2
Mar
-02
May
-02
Jul-0
2
Sep-0
2
Nov-02
Jan-0
3
Mar
-03
May
-03
Jul-0
3
Sep-0
3
31-60 Days 61-90 Days 91+ Days
$ millions

2003 Analyst/Investor Conference 11
Majority of Margin Now Results From Fixed Charges
0.0
10.0
20.0
30.0
40.0
50.0
60.0
70.0
80.0
(%)
2001 2002 2003E
Firm Gross Margin (2001-2003)
Fixed Variable
[1] Fixed Gross Margin is composed of Commercial Interstate Transportation, Customer Service Charges, Service Connection Charges and Late Fees.
[2] Variable Gross Margin is composed of Commodity Margin (net of hedging and Fixed Interstate costs) and Early Termination Charges.

2003 Analyst/Investor Conference 12
Recent Marketing Activities

2003 Analyst/Investor Conference 13
What To Expect in 2004
• Resolve disproportionate sharing issue
• Drive lower cost structure and effective hedging programs
• Increase share of high-value customers
– Higher usage
– Higher load factor
– Higher credit quality