southwestern public service company 2014 energy ... average cost of capital wecc wisconsin energy...
TRANSCRIPT
Southwestern Public Service Company
2014 Energy Efficiency and Load Management Plan
Case No. 13-_________-UT
Prepared in Compliance with the Efficient Use of Energy Act and 17.7.2 NMAC (Energy Efficiency Rule, 2007 version)
August 28, 2013
ii ii
Table of Contents
Glossary of Acronyms and Defined Terms.................................................................... iv Executive Summary.......................................................................................................... 1 I. Portfolio Characteristics .......................................................................................... 4
A. Public Participation................................................................................................. 4 B. Broad Participation of all Classes ........................................................................... 7 C. Estimated Energy and Demand Savings ................................................................. 8 D. Ease of Program Deployment ................................................................................. 8 E. Product Development Process ................................................................................ 8 F. Risk of Technologies and Methods....................................................................... 10 G. Programs Under Review, Rejected, and Future Programs ................................... 10
1. Programs/Measures Under Review.................................................................... 11 2. Programs/Measures Rejected............................................................................. 11 3. Future Programs................................................................................................. 12
H. Goal Setting .......................................................................................................... 13 I. General Marketing ................................................................................................ 13 J. Utility Cost Test and Avoided Costs .................................................................... 14
1. Avoided Costs.................................................................................................... 14 2. Discount Rate/Cost of Capital ........................................................................... 17 3. Net-to-Gross....................................................................................................... 18 4. Transmission Loss Factors................................................................................. 21 5. Non-Energy Benefits ......................................................................................... 21 6. System Benefits ................................................................................................. 21
II. Program Delivery and Administration ................................................................. 22 A. General Marketing and Outreach Plan.................................................................. 22
1. Residential Segment........................................................................................... 22 2. Business Segment .............................................................................................. 22
B. Roles and Responsibilities .................................................................................... 24 C. Reporting Process ................................................................................................. 24 D. Cost Recovery....................................................................................................... 25
1. Rate Impact and Customer Bill Impact.............................................................. 26 2. Shared/Allocated Program Costs ....................................................................... 26 3. Budget Categories.............................................................................................. 27
III. Program Details ...................................................................................................... 29 A. Residential Segment.............................................................................................. 29
1. Energy Feedback Pilot (formerly known as the Consumer Behavior Pilot)...... 29 2. Evaporative Cooling Rebates............................................................................. 34 3. Home Energy Services (Residential and Low-Income)..................................... 36 4. Home Lighting & Recycling.............................................................................. 39 5. Refrigerator Recycling....................................................................................... 42 6. Residential Saver’s Switch® .............................................................................. 44 7. School Education Kits........................................................................................ 47
B. Business Segment ................................................................................................. 49 1. Business Comprehensive ................................................................................... 49 2. Interruptible Credit Option ................................................................................ 58
iii iii
3. Saver’s Switch® for Business ........................................................................... 62 C. Planning & Research Segment.............................................................................. 65
1. Consumer Education.......................................................................................... 66 2. Market Research ................................................................................................ 67 3. Measurement and Verification........................................................................... 68 4. Planning & Administration ................................................................................ 70 5. Product Development......................................................................................... 70
IV. Conclusion ............................................................................................................... 73 Appendix A: Cost-Effectiveness Tests ......................................................................... 74 Appendix B: Planning Assumptions ............................................................................. 88
iv iv
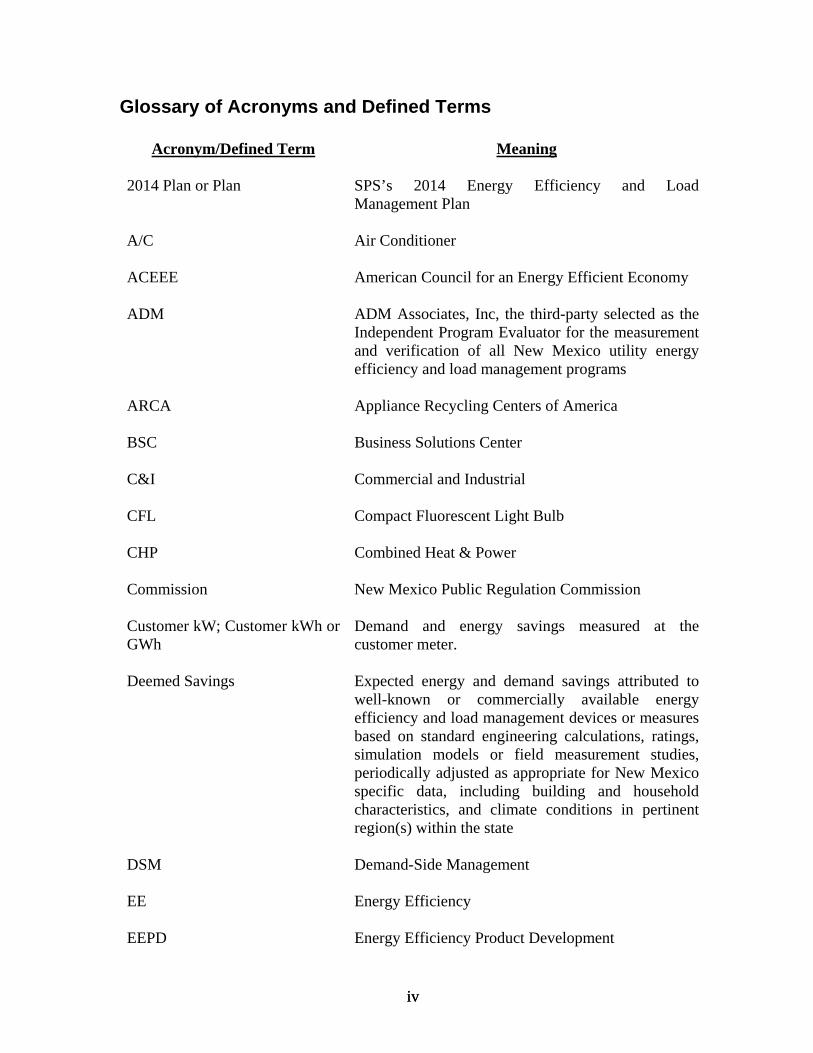
Glossary of Acronyms and Defined Terms
Acronym/Defined Term
Meaning
2014 Plan or Plan SPS’s 2014 Energy Efficiency and Load Management Plan
A/C
Air Conditioner
ACEEE
American Council for an Energy Efficient Economy
ADM ADM Associates, Inc, the third-party selected as the Independent Program Evaluator for the measurement and verification of all New Mexico utility energy efficiency and load management programs
ARCA Appliance Recycling Centers of America
BSC Business Solutions Center
C&I Commercial and Industrial
CFL
Compact Fluorescent Light Bulb
CHP Combined Heat & Power
Commission New Mexico Public Regulation Commission
Customer kW; Customer kWh or GWh
Demand and energy savings measured at the customer meter.
Deemed Savings
Expected energy and demand savings attributed to well-known or commercially available energy efficiency and load management devices or measures based on standard engineering calculations, ratings, simulation models or field measurement studies, periodically adjusted as appropriate for New Mexico specific data, including building and household characteristics, and climate conditions in pertinent region(s) within the state
DSM Demand-Side Management
EE Energy Efficiency
EEPD Energy Efficiency Product Development
v v
Acronym/Defined Term
Meaning
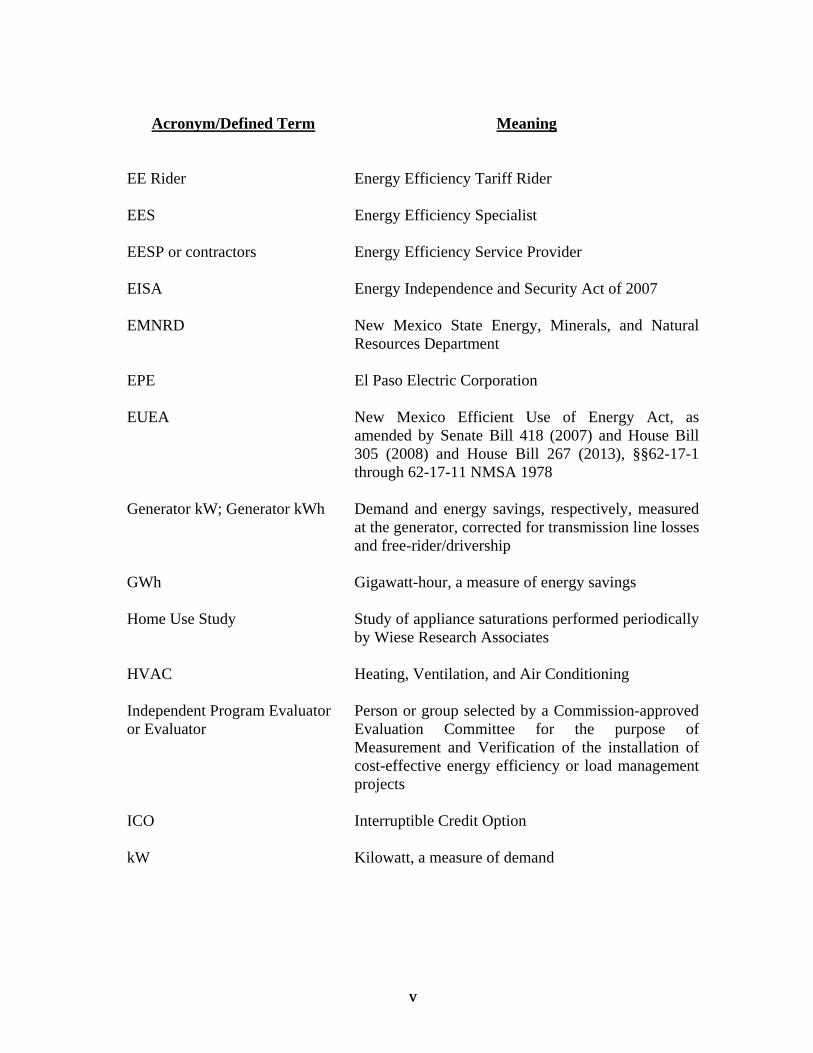
EE Rider Energy Efficiency Tariff Rider
EES Energy Efficiency Specialist
EESP or contractors Energy Efficiency Service Provider
EISA Energy Independence and Security Act of 2007
EMNRD New Mexico State Energy, Minerals, and Natural Resources Department
EPE El Paso Electric Corporation
EUEA
New Mexico Efficient Use of Energy Act, as amended by Senate Bill 418 (2007) and House Bill 305 (2008) and House Bill 267 (2013), §§62-17-1 through 62-17-11 NMSA 1978
Generator kW; Generator kWh Demand and energy savings, respectively, measured at the generator, corrected for transmission line losses and free-rider/drivership
GWh Gigawatt-hour, a measure of energy savings
Home Use Study Study of appliance saturations performed periodically by Wiese Research Associates
HVAC Heating, Ventilation, and Air Conditioning
Independent Program Evaluator or Evaluator
Person or group selected by a Commission-approved Evaluation Committee for the purpose of Measurement and Verification of the installation of cost-effective energy efficiency or load management projects
ICO Interruptible Credit Option
kW Kilowatt, a measure of demand
vi vi
Acronym/Defined Term
Meaning
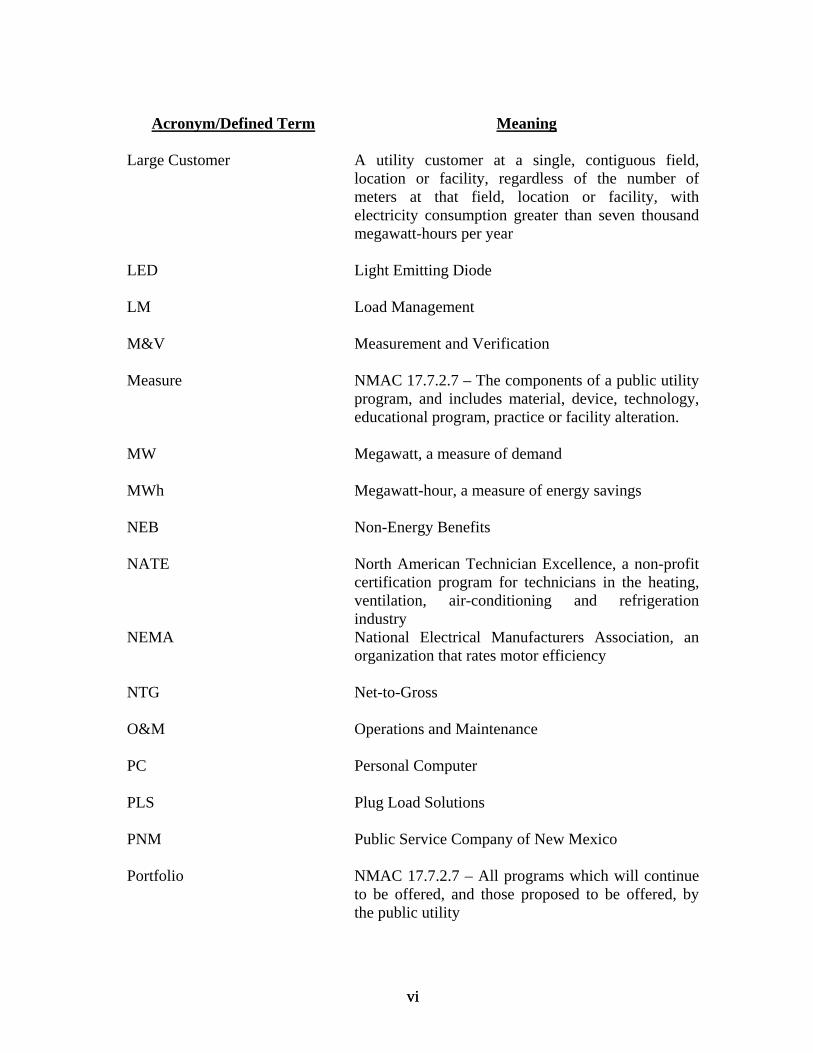
Large Customer
A utility customer at a single, contiguous field, location or facility, regardless of the number of meters at that field, location or facility, with electricity consumption greater than seven thousand megawatt-hours per year
LED
Light Emitting Diode
LM Load Management
M&V
Measurement and Verification
Measure
NMAC 17.7.2.7 – The components of a public utility program, and includes material, device, technology, educational program, practice or facility alteration.
MW Megawatt, a measure of demand
MWh Megawatt-hour, a measure of energy savings
NEB Non-Energy Benefits
NATE North American Technician Excellence, a non-profit certification program for technicians in the heating, ventilation, air-conditioning and refrigeration industry
NEMA National Electrical Manufacturers Association, an organization that rates motor efficiency
NTG Net-to-Gross
O&M Operations and Maintenance
PC Personal Computer
PLS Plug Load Solutions
PNM Public Service Company of New Mexico
Portfolio
NMAC 17.7.2.7 – All programs which will continue to be offered, and those proposed to be offered, by the public utility
vii vii
Acronym/Defined Term
Meaning
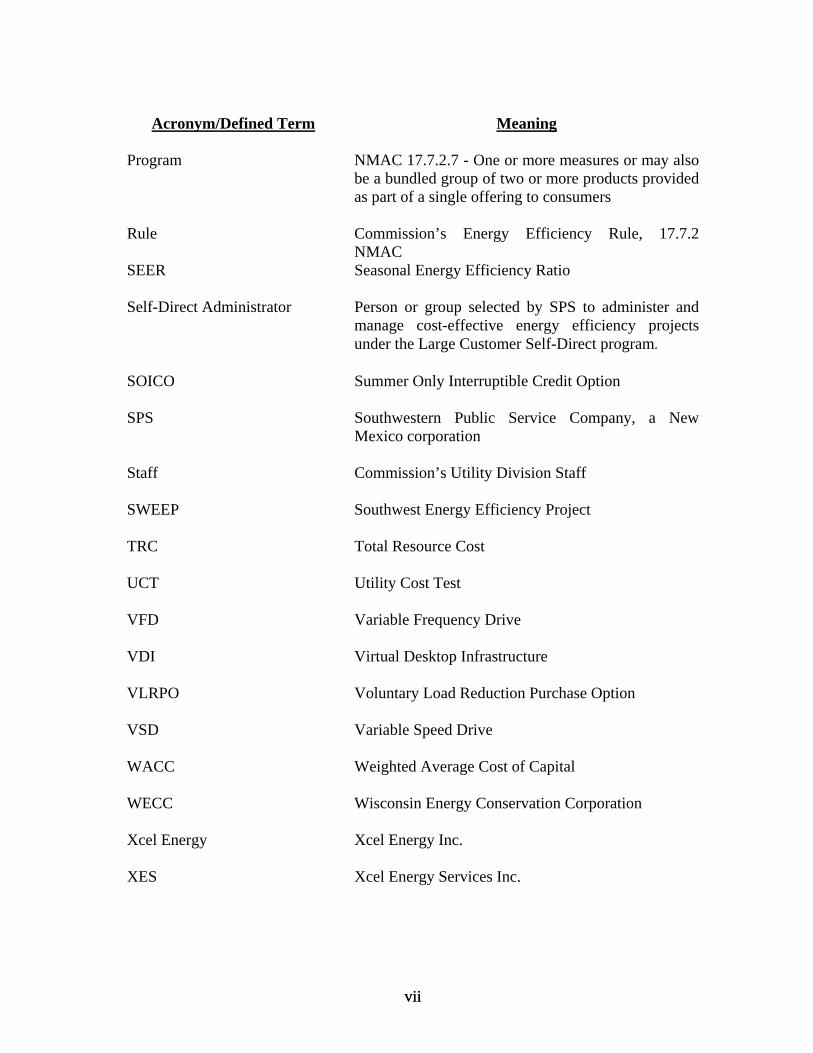
Program
NMAC 17.7.2.7 - One or more measures or may also be a bundled group of two or more products provided as part of a single offering to consumers
Rule Commission’s Energy Efficiency Rule, 17.7.2 NMAC
SEER
Seasonal Energy Efficiency Ratio
Self-Direct Administrator
Person or group selected by SPS to administer and manage cost-effective energy efficiency projects under the Large Customer Self-Direct program.
SOICO Summer Only Interruptible Credit Option
SPS Southwestern Public Service Company, a New Mexico corporation
Staff Commission’s Utility Division Staff
SWEEP Southwest Energy Efficiency Project
TRC Total Resource Cost
UCT Utility Cost Test
VFD Variable Frequency Drive
VDI Virtual Desktop Infrastructure
VLRPO Voluntary Load Reduction Purchase Option
VSD Variable Speed Drive
WACC
Weighted Average Cost of Capital
WECC
Wisconsin Energy Conservation Corporation
Xcel Energy
Xcel Energy Inc.
XES Xcel Energy Services Inc.
1 1
Executive Summary In accordance with the Efficient Use of Energy Act, as amended by Senate Bill 418 (2007), and House Bill 305 (2008) (NMSA 1978, §62-17-1 through 62-17-11, “EUEA”), and House Bill 267 (2013) and the New Mexico Public Regulation Commission’s (“Commission”) 2007 version of the Energy Efficiency Rule (17.7.2 NMAC, “Rule”), Southwestern Public Service Company, a New Mexico corporation (“SPS”) and electric utility operating company that is a wholly owned subsidiary of Xcel Energy Inc. (“Xcel Energy”), respectfully submits for Commission review and approval SPS’s 2014 Energy Efficiency and Load Management Plan (“2014 Plan” or “Plan”). The EUEA requires public utilities to obtain cost-effective and achievable energy efficiency and load management and a reduction of no less than five percent of 2005 retail sales by 2014 and eight percent by 2020. In 2005, SPS’s retail sales were 3,750,469 megawatt-hours (“MWh”). Therefore, the EUEA requirements equate to targets of 187.5 gigawatt-hours (“GWh”) of energy efficiency savings at the customer meter by 2014 and 300 GWh by 2020 at the customer meter. SPS requests that the Commission lower SPS's 2014 minimum savings requirements per the provision in Section 62-17-5(H). SPS believes this is in accordance with the Commission’s ruling in Case No. 11-00439-UT In the Matter of the Commission granting Blanket Variances to Certain Provisions of 17.7.2 NMAC. In this Order, the Commission ruled that,
In lieu of the annual filing requirement under 17.7.2.9.B NMAC, the public utilities subject to the provision shall be required to file such applications not less than every two years, with their next application due two years after they filed their last application for EE program approval.
The Commission stated in this Order that its reasoning for requiring a utility to file its updated EE plan no later than two years after the most recent filing was to have,
…the salutary effect of reducing the regulatory burden of annual filings, and giving interested parties, Commission Staff, the utilities, and the Commission additional time to gain greater experience with individual EE programs.
The 2014 Plan provides SPS’s proposed programs, budgets, and goals for its energy efficiency and load management programs for program years 2014 and 2015.1 SPS proposes a portfolio of electric energy efficiency and load management direct impact programs in two main customer segments: Residential (including Low-Income) and Business (including Large Customer). In addition, the 2014 Plan includes a Planning & Research Segment, which provides support functions for the direct impact programs. 1 This document, throughout and within the associated testimony, will often use the term “the Plan” or “the 2014 Plan” but refers to program years 2014 and 2015 unless otherwise noted.
2 2
With the 2014 Plan, SPS will add Building Tune-Up and combine Lighting Efficiency and Small Business Lighting under the Business Comprehensive program. In addition, SPS will add an on-line component to the Energy Feedback Pilot and will discontinue Business Education. SPS proposes the following programs/products for 2014, designated by “EE” for energy efficiency and “LM” for load management: Residential Segment
• Energy Feedback Pilot (EE); • Evaporative Cooling Rebates (EE); • Home Energy Services (EE); • Home Lighting & Recycling (EE); • Refrigerator Recycling (EE); • School Education Kits (EE); and • Residential Saver’s Switch (LM).
Business Segment
• Business Comprehensive (EE); • Interruptible Credit Option (“ICO”) (LM); and • Saver’s Switch for Business (LM);
Planning and Research Segment
• Consumer Education; • Market Research; • Measurement & Verification (“M&V”); • Planning & Administration; and • Product Development.
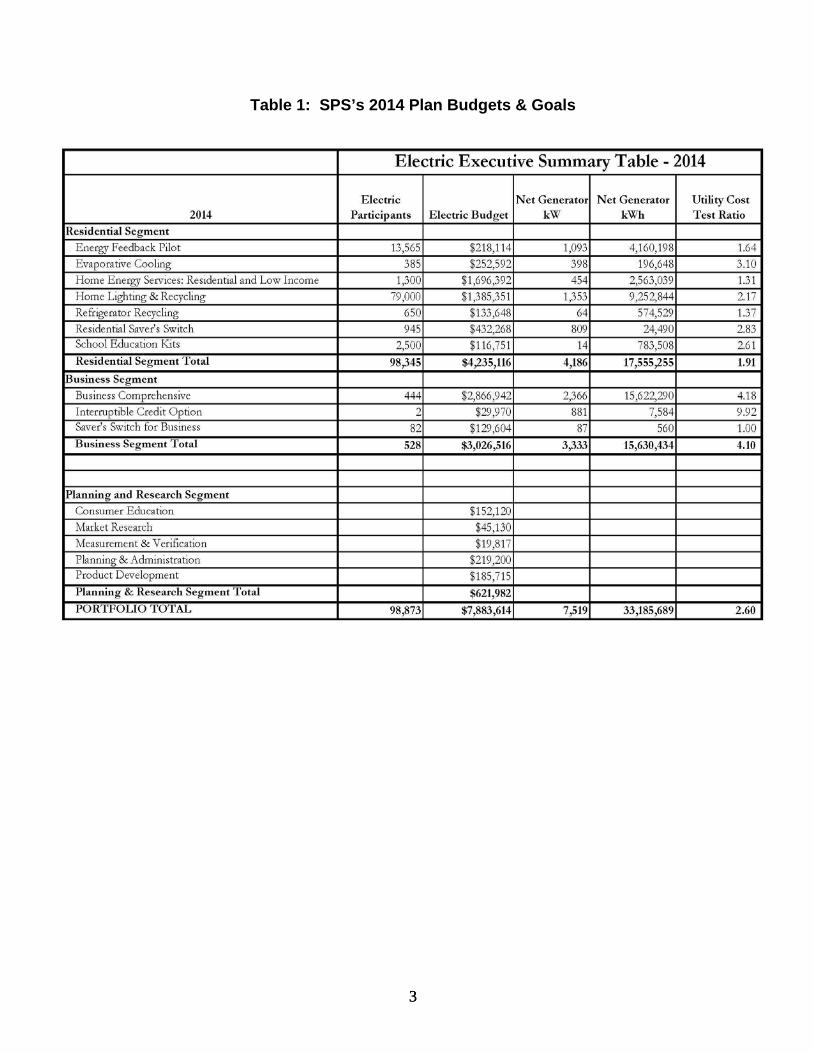
For 2014, SPS is proposing an energy efficiency and load management budget of $7,883,614 and goals of 7,519 net generator kilowatts (“kW”) and 33,185,689 first-year net generator kilowatt-hours (“kWh”), distributed among the programs and customer segments as shown in Table 1 below. The portfolio-level Utility Cost Test (“UCT”) ratio is forecasted to be 2.60.
3 3
Table 1: SPS’s 2014 Plan Budgets & Goals
4 4
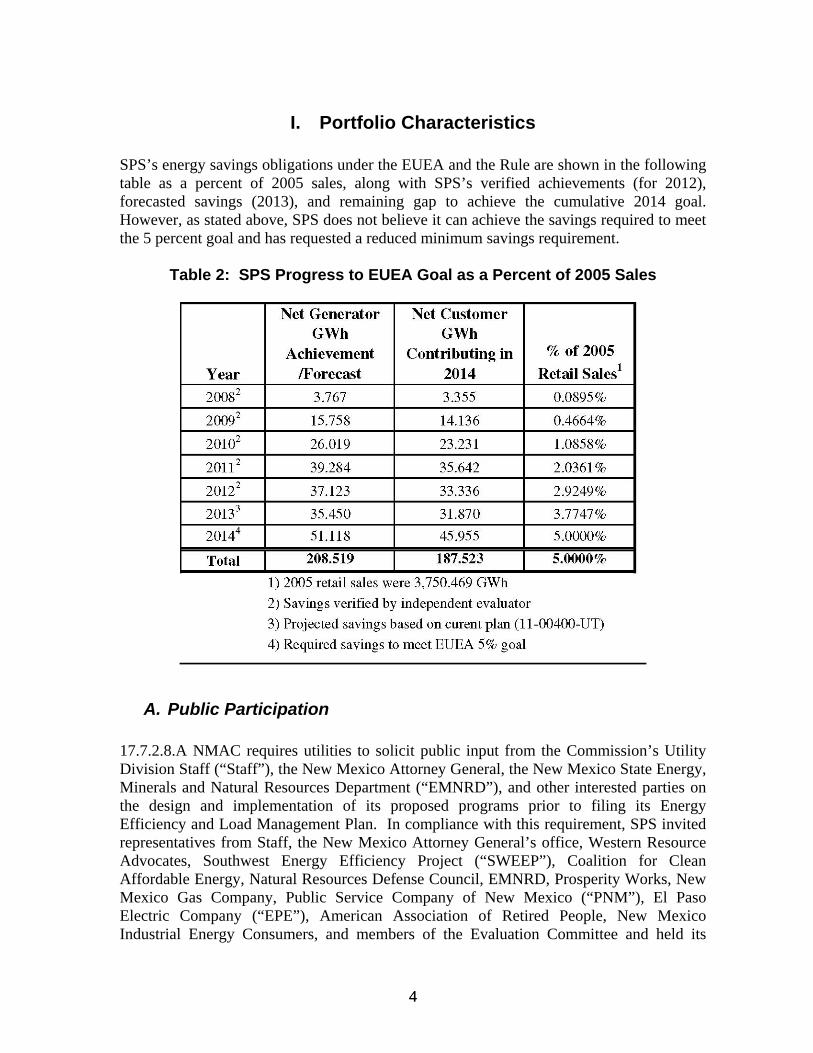
I. Portfolio Characteristics SPS’s energy savings obligations under the EUEA and the Rule are shown in the following table as a percent of 2005 sales, along with SPS’s verified achievements (for 2012), forecasted savings (2013), and remaining gap to achieve the cumulative 2014 goal. However, as stated above, SPS does not believe it can achieve the savings required to meet the 5 percent goal and has requested a reduced minimum savings requirement.
Table 2: SPS Progress to EUEA Goal as a Percent of 2005 Sales
A. Public Participation 17.7.2.8.A NMAC requires utilities to solicit public input from the Commission’s Utility Division Staff (“Staff”), the New Mexico Attorney General, the New Mexico State Energy, Minerals and Natural Resources Department (“EMNRD”), and other interested parties on the design and implementation of its proposed programs prior to filing its Energy Efficiency and Load Management Plan. In compliance with this requirement, SPS invited representatives from Staff, the New Mexico Attorney General’s office, Western Resource Advocates, Southwest Energy Efficiency Project (“SWEEP”), Coalition for Clean Affordable Energy, Natural Resources Defense Council, EMNRD, Prosperity Works, New Mexico Gas Company, Public Service Company of New Mexico (“PNM”), El Paso Electric Company (“EPE”), American Association of Retired People, New Mexico Industrial Energy Consumers, and members of the Evaluation Committee and held its
5 5
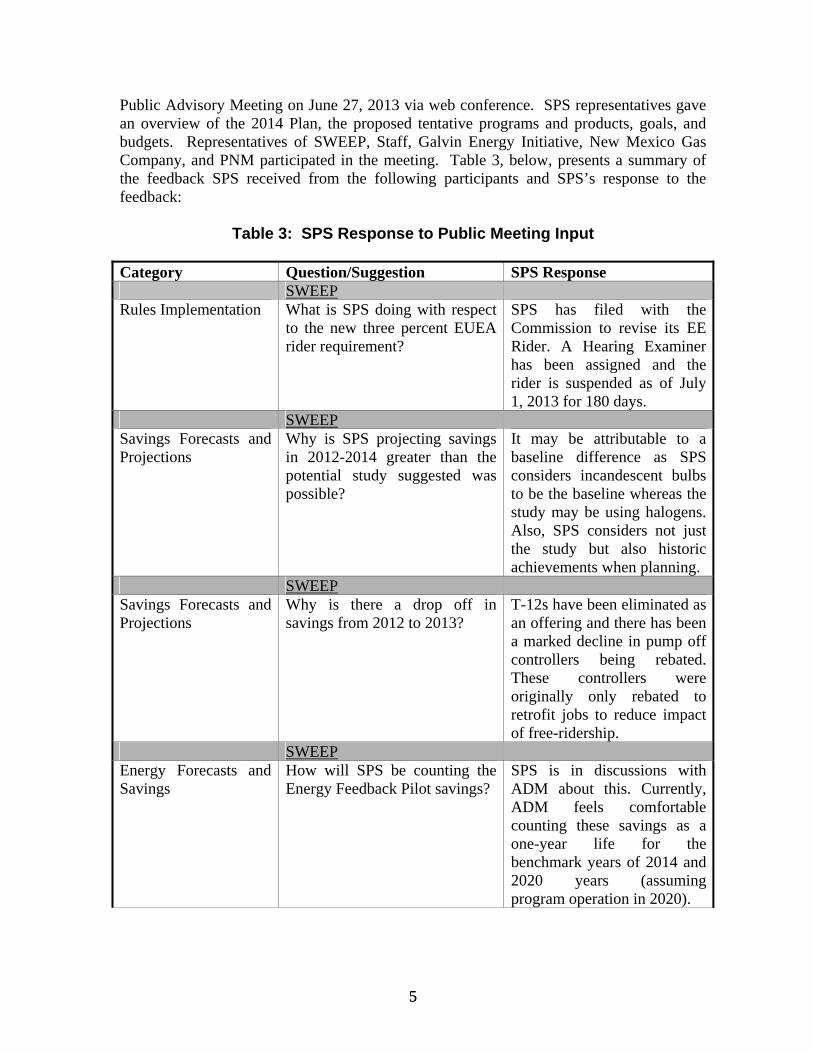
Public Advisory Meeting on June 27, 2013 via web conference. SPS representatives gave an overview of the 2014 Plan, the proposed tentative programs and products, goals, and budgets. Representatives of SWEEP, Staff, Galvin Energy Initiative, New Mexico Gas Company, and PNM participated in the meeting. Table 3, below, presents a summary of the feedback SPS received from the following participants and SPS’s response to the feedback:
Table 3: SPS Response to Public Meeting Input
Category Question/Suggestion SPS Response SWEEP Rules Implementation What is SPS doing with respect
to the new three percent EUEA rider requirement?
SPS has filed with the Commission to revise its EE Rider. A Hearing Examiner has been assigned and the rider is suspended as of July 1, 2013 for 180 days.
SWEEP Savings Forecasts and Projections
Why is SPS projecting savings in 2012-2014 greater than the potential study suggested was possible?
It may be attributable to a baseline difference as SPS considers incandescent bulbs to be the baseline whereas the study may be using halogens. Also, SPS considers not just the study but also historic achievements when planning.
SWEEP Savings Forecasts and Projections
Why is there a drop off in savings from 2012 to 2013?
T-12s have been eliminated as an offering and there has been a marked decline in pump off controllers being rebated. These controllers were originally only rebated to retrofit jobs to reduce impact of free-ridership.
SWEEP Energy Forecasts and Savings
How will SPS be counting the Energy Feedback Pilot savings?
SPS is in discussions with ADM about this. Currently, ADM feels comfortable counting these savings as a one-year life for the benchmark years of 2014 and 2020 years (assuming program operation in 2020).
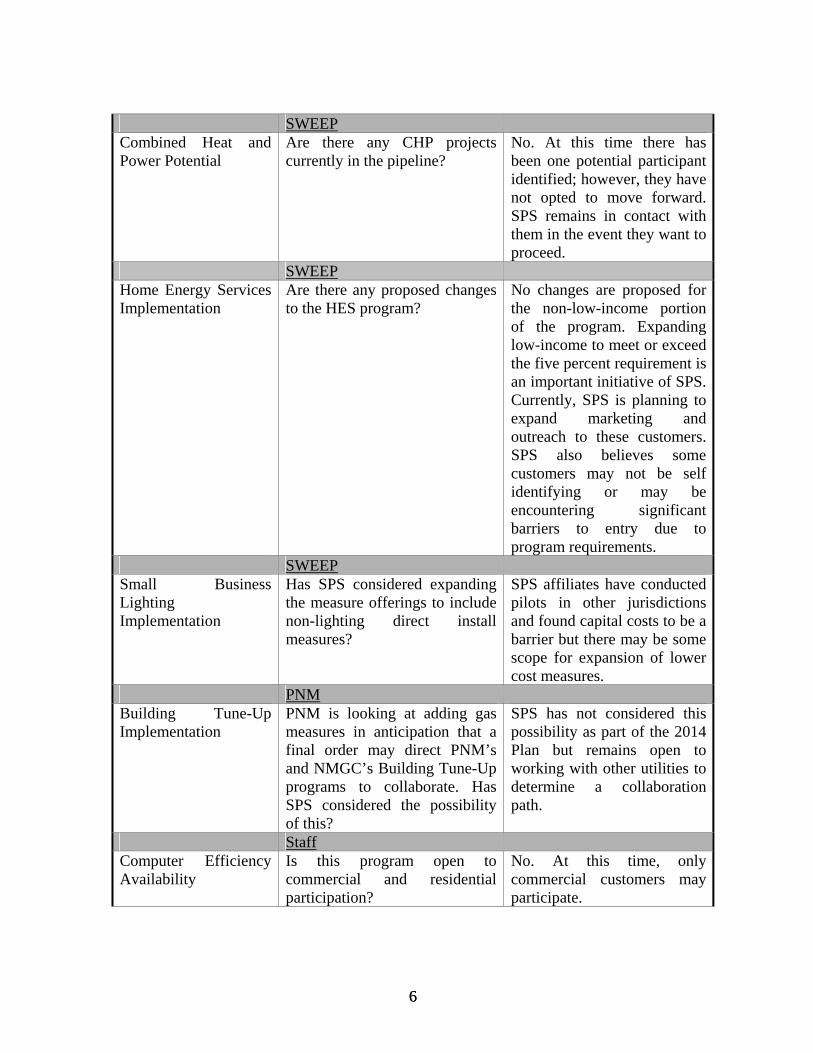
6 6
SWEEP Combined Heat and Power Potential
Are there any CHP projects currently in the pipeline?
No. At this time there has been one potential participant identified; however, they have not opted to move forward. SPS remains in contact with them in the event they want to proceed.
SWEEP Home Energy Services Implementation
Are there any proposed changes to the HES program?
No changes are proposed for the non-low-income portion of the program. Expanding low-income to meet or exceed the five percent requirement is an important initiative of SPS. Currently, SPS is planning to expand marketing and outreach to these customers. SPS also believes some customers may not be self identifying or may be encountering significant barriers to entry due to program requirements.
SWEEP Small Business Lighting Implementation
Has SPS considered expanding the measure offerings to include non-lighting direct install measures?
SPS affiliates have conducted pilots in other jurisdictions and found capital costs to be a barrier but there may be some scope for expansion of lower cost measures.
PNM Building Tune-Up Implementation
PNM is looking at adding gas measures in anticipation that a final order may direct PNM’s and NMGC’s Building Tune-Up programs to collaborate. Has SPS considered the possibility of this?
SPS has not considered this possibility as part of the 2014 Plan but remains open to working with other utilities to determine a collaboration path.
Staff Computer Efficiency Availability
Is this program open to commercial and residential participation?
No. At this time, only commercial customers may participate.
7 7
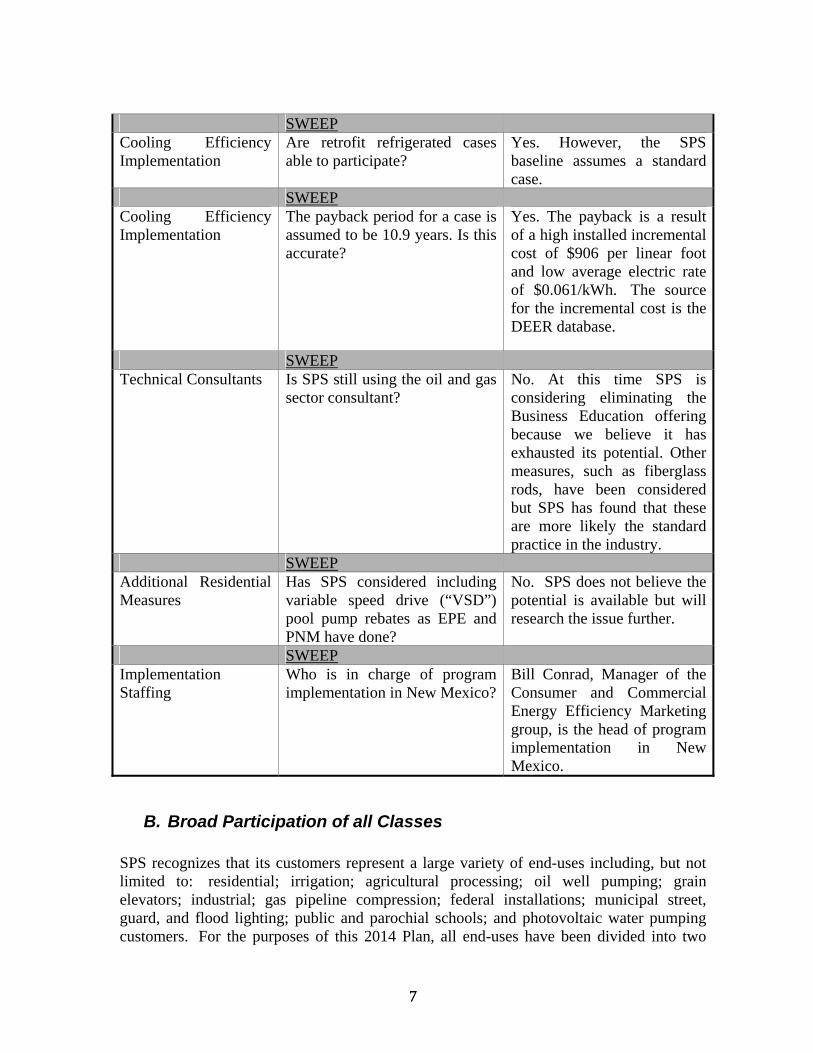
SWEEP Cooling Efficiency Implementation
Are retrofit refrigerated cases able to participate?
Yes. However, the SPS baseline assumes a standard case.
SWEEP Cooling Efficiency Implementation
The payback period for a case is assumed to be 10.9 years. Is this accurate?
Yes. The payback is a result of a high installed incremental cost of $906 per linear foot and low average electric rate of $0.061/kWh. The source for the incremental cost is the DEER database.
SWEEP Technical Consultants Is SPS still using the oil and gas
sector consultant? No. At this time SPS is considering eliminating the Business Education offering because we believe it has exhausted its potential. Other measures, such as fiberglass rods, have been considered but SPS has found that these are more likely the standard practice in the industry.
SWEEP Additional Residential Measures
Has SPS considered including variable speed drive (“VSD”) pool pump rebates as EPE and PNM have done?
No. SPS does not believe the potential is available but will research the issue further.
SWEEP Implementation Staffing
Who is in charge of program implementation in New Mexico?
Bill Conrad, Manager of the Consumer and Commercial Energy Efficiency Marketing group, is the head of program implementation in New Mexico.
B. Broad Participation of all Classes SPS recognizes that its customers represent a large variety of end-uses including, but not limited to: residential; irrigation; agricultural processing; oil well pumping; grain elevators; industrial; gas pipeline compression; federal installations; municipal street, guard, and flood lighting; public and parochial schools; and photovoltaic water pumping customers. For the purposes of this 2014 Plan, all end-uses have been divided into two
8 8
customer segments: Residential and Business. Household and low-income customers fall into the Residential Segment. Commercial, agricultural, municipal, school, and industrial customers fall into the Business Segment. SPS has developed a portfolio that is well-balanced and designed to provide all customers the ability to participate. For business customers, SPS has a Custom product within the Business Comprehensive program that provides rebates for most energy efficiency measures that have not been included in a prescriptive product ensuring that most business customers may participate in a program.
C. Estimated Energy and Demand Savings SPS manages its energy efficiency and load management programs as cost-effectively as possible and maximizes its energy and demand savings at a reasonable cost. The 2014 estimated energy and demand savings of the individual programs are shown in Table 1 (above). SPS’s proposed goals accompany a request for a reduced minimum savings requirement from 2014 cumulative savings goals under the EUEA. SPS’s proposed goals assume that all programs will operate for a full 12 months.
D. Ease of Program Deployment SPS continues to leverage its large institutional infrastructure to bring its energy efficiency programs to the market. Specifically, through Xcel Energy Services (“XES”), SPS has internal capabilities in product development, program management, rebate processing, and regulatory administration, which it can rely on to develop, implement, and administer the energy efficiency and load management programs. SPS intends to administer the Business Comprehensive program internally, which includes: Computer Efficiency, Cooling Efficiency, Custom Efficiency, Large Customer Self-Direct, Lighting Efficiency and Small Business Lighting, and Motor & Drive Efficiency. SPS proposes to add the Building Tune-Up product to its Business Comprehensive program in 2014. The Plan also includes the ICO and Residential and Business Saver’s Switch programs, which are administered internally. Other programs, including Energy Feedback Pilot (formerly described as the Consumer Behavior Pilot), Home Energy Services, Home Lighting & Recycling, Home Energy Services, Refrigerator Recycling, and School Education Kits will be partially or completely administered by third-party providers. The portion of the Computer Efficiency program that provides incentives to manufacturers to design, install, and deliver efficient computers to business customers is administered by a third party as well.
E. Product Development Process For over 20 years, XES has gained significant expertise in the design and development of energy efficiency and load management programs. XES and SPS use a comprehensive product development process to identify, analyze, prioritize, and select the programs to include in its energy efficiency and load management portfolio. The product development process utilizes traditional stage/gate methods in order to foster sound ideas that meet customer needs and Company goals. The process begins by analyzing service territory
9 9
characteristics (e.g., number and types of customers, climate, and market potential) to develop a list of relevant programs that Xcel Energy’s operating companies have successfully operated in other jurisdictions. The specific stages that the product development process then follows are: Opportunity Identification, Framing, Concept Evaluation, Development, Test, and Launch. Ideas are reviewed by management at the transition points between each stage, which allows for proper culling of less effective ideas early in the process before significant work is done. Descriptions of each stage are provided below. Opportunity Identification - The objectives of this stage are to compile ideas for new programs/products from those who are closest to the customers, describe the program concept, and to filter the most viable ideas that will progress to the Framing Stage. This stage begins by asking: “What idea do you have that will solve a customer concern?” This stage solicits ideas from several sources and provides a brief explanation of the concept in the form of an Idea Napkin. To progress to Framing, new ideas must pass a prioritization screening process so that only the most promising ideas are worked on in the Framing Stage. Framing - The objectives of this stage are to evaluate the market opportunity of new program/product ideas. This stage begins by asking: “What is the opportunity for this idea?” The ultimate deliverable of this stage will be a Framing Document, which is the due diligence needed to develop the program/product case. It will also define project boundaries and determine strategic fit from a business, technical, and market perspective. The primary gate decision here is, “Does this concept merit spending more resources?” Concept Evaluation - Once it has been determined that a new concept is a viable opportunity upon which to spend more resources, the program/product idea moves to the Concept Evaluation Stage. The objectives of this stage are to refine and validate assumptions made in the Framing Stage, and to more clearly define the program/product and opportunity. The process to obtain any legal approvals or meet any regulations begins here. The deliverables of this stage are high-level requirements, a Product Case 1.0, and a high-level project plan. The primary gate decision is, “Should we commit the resources/dollars to build this measure, product, or program?” Development - Once the program/product receives concept approval, the process moves to the Development Stage. All high-level requirements are broken down into detailed requirements, and the project plan is refined in order to accomplish physical development of the product and systems. Preliminary launch planning begins in this stage. The deliverable from this stage is a testable product. The primary gate decision is, “Is the measure, product, or program ready for test (if needed) or moved to launch?” Test - Once the measure, product, or program has passed the Development Stage, it is tested against user requirements and usage scenarios to verify desired performance. Operational processes are also tested for flow-through. Testing assesses the readiness for full deployment. Testing could take various forms such as laboratory testing or field trial (pilot testing). Any needed rework of the product before deployment is done in this stage.
10 10
The deliverables of this stage are: end-to-end validation of test results, operational and product/program assessments for full deployment, and the complete marketing plan to bring the product/program to launch. The primary gate decision is, “Are we ready to proceed with launch, or go back to design?” Launch - Upon successful testing, the process moves to the Launch Stage. The objectives of this phase are to stabilize all processes, transition the new product/program into a life cycle, and execute launching the product/program. The primary gate decision is, “Is everything ready from beginning to end that will enable this product/program to be successful?”
F. Risk of Technologies and Methods As discussed above, SPS’s affiliated operating companies have extensive experience designing, implementing, and administering energy efficiency and load management programs in a variety of jurisdictions. The Plan benefits from those years of experience and expertise and allows SPS to have greater confidence in its program proposals. The proposed programs have been offered successfully either in New Mexico or in other jurisdictions. The third-party partnerships are with reputable, long-standing organizations. Therefore, SPS does not perceive a great risk with the technologies or methods it has chosen. However, the New Mexico service area is a significantly different market than other jurisdictions where the Company offers demand-side management (“DSM”) programs. The SPS jurisdiction has much lower population density and a more homogenous business sector with the largest local industries: oil and gas production, food and beverage establishments, and agriculture. In other jurisdictions, manufacturing, commercial real estate, education, and retail are more prevalent and more likely to participate. For its energy efficiency and load management programs, SPS is mindful of the challenges associated with its market, as well as the effect of the economic downturn on customer participation.
G. Programs Under Review, Rejected, and Future Programs SPS draws on the historical knowledge it has developed over the past five years operating Energy Efficiency and Load Management programs in New Mexico. In addition, as part of the development process for the 2014 Plan, SPS referenced the comments from the Public Participation Meetings on June 25, 2009 (for the 2010/11 Plan) and May 17, 2011 (for the 2012 Plan) for ideas on new measures, including Pump-Off Controllers (“POCs”) and Light Emitting Diodes (“LEDs”), that would be added to enhance programs in the 2014 Plan. The new programs/products that were developed for the 2014 Plan are summarized in the Product Development section later in the Plan. The following programs/products were reviewed in the Product Development process, but are either still under review or excluded from the Plan.
11 11
1. Programs/Measures Under Review
a. Residential Pool Pumps Based on feedback from the Public Participation Meeting, SPS is currently reinvestigating the market opportunity to add a prescriptive measure to encourage the installation of VSD residential pool pump motors.
b. Western Cooling Control Device (“WCCD”) SPS is currently investigating the market opportunity to add a prescriptive measure to encourage the installation of the WCCD on residential AC units.
c. Oil Field Measure - Sucker-Rod Pump (“SRP”) VSDs Evidence from another utility suggests that the installation of VSDs on SRPs has the potential to provide significant energy savings, on both an absolute level and per unit of production (kWh/barrel). SPS has struggled to assess this measure due to a lack of data (very few projects have been implemented) and the difficulty of identifying the common baseline condition and savings calculation. SPS will continue to pursue custom projects with which to gain more insight into this technology.
d. Potential Study SPS is currently analyzing the recommendations from the latest potential study to determine whether there are any opportunities to either develop prescriptive products or identify Custom program opportunities.
e. Low-Income Home Energy Services SPS is currently working to develop a contract with a State agency with access to the records needed to verify low-income program participants. SPS expects that by developing this partnership it will be able to remove significant barriers to program participation, which will encourage contractors and customers to return to the program. In addition, SPS will also continue to review the low-income programs of other utilities and look to, where possible, implement similar strategies.
2. Programs/Measures Rejected
a. Oil Field Measure - Composite/Fiberglass Pump Rods on SRPs In its efforts to identify more prescriptive measures for the oil and gas production market, SPS investigated a prescriptive incentive for composite/fiberglass pump rods on SRPs. By installing composite/fiberglass pump rods, it is possible to increase production without changing the surface pumping unit because fiberglass rods are light and can reduce load on the unit structure compared to steel rods.

12 12
Evaluation efforts A consultant specializing in oil well applications was hired to investigate the opportunities. The consultant is familiar with oil well technology and with utility incentive program requirements. Measure Assessment A deemed rebate for fiberglass rods for new SRPs or retrofit projects will not be pursued for the following reasons:
• Product Maturity - This energy efficiency technology is in the later phases of the commercialization process. (40 years old)
• Incremental Cost (new wells) - The incremental equipment cost of a fiberglass rod versus a steel rod is negative.
• Incremental Cost (existing wells) – This is difficult to determine because the decision to do so is not based simply on energy consumption and potential energy savings. Examples of other reasons to replace steel with fiberglass:
Address corrosion issues vs. corrosion inhibitors; Enable an operator to go deeper on a well; and/or Unload a gear box from 90 or 95 percent (unsafe) down to 80 percent (safe).
3. Future Programs SPS believes its proposed 2014 Plan provides sufficient program opportunities to cover the most common electric end-uses operated in households and businesses. As new technologies become available, the Product Development team will evaluate them for inclusion in future programs. SPS has incorporated into its programs many of the energy efficiency program ideas that have been previously suggested for review by outside parties, including: LED wall packs (exterior lighting), LED parking garage lighting, low-loss filters, expanded air compressor offerings, anti-sweat heater controls, electronically commutated motors for refrigeration, and residential freezer rebates. In the future, SPS intends to evaluate its load management programs in more detail in order to:
• Review and develop advances in air conditioning control strategies software and hardware);
• Identify and develop options for advanced appliance controls and new plug controls;
• Monitor and implement advanced load management control technologies; • Identify new load management communication control systems; • Evaluate customer and load aggregation strategies and options; and • Identify energy storage technologies for load management.
13 13
H. Goal Setting SPS considered the following factors while developing its energy efficiency and load management program goals and budgets for the 2014 Plan:
• legislated goals; • legislated budget parameters; • historical and expected participation levels; • settlement requirements; • incremental cost of energy efficient equipment; • results of market potential study; • recent Commission decisions; and • cost-effectiveness.
I. General Marketing SPS proposes to market to both the residential and business customer segments based on the number of customers, relative size of each customer, and potential for conservation at the customer site. SPS uses a more personal sales approach for large commercial and industrial (“C&I”) customers because they generally have larger and more complex energy efficiency and load management opportunities. Small business customers may work with XES’s Business Solutions Center (“BSC”) to learn more about program offerings. In contrast, because energy efficiency potential for individual residential customers is relatively small and costs per participant need to be strictly controlled, SPS relies most heavily on mass-market advertising and promotion for this segment as well as trade partners that have been trained to utilize the programs. In addition to formal rebate and incentive programs, SPS maintains a large database of energy savings information on its website (xcelenergy.com). All currently rebated measures, as well as rebate amounts, can be found on the website. Customers and the general public are able to access information on the latest technologies and practices available for saving energy. Residential customers can access information on low/no-cost ways to save energy, performing an energy assessment, and calculating appliance energy consumption. Business customers can keep up-to-date on new technologies and access one of several energy advisor or energy assessment tools. The 2014 proposed programs are designed to accommodate diverse customer lifestyles and provide convenient participation and information to assist customers in making wise energy choices. In addition to its direct impact program portfolio, SPS plans to provide consumer education, as well as conduct market research, product development, and planning and administration to support these programs. More detailed marketing approaches are available in the program description sections of the Plan.
14 14
J. Utility Cost Test and Avoided Costs 17.7.2.9(C)(1) NMAC requires that utility energy efficiency and load management programs be cost-effective, and 62-17-4.C of the EUEA states the Utility Cost Test shall be used to determine cost-effectiveness. Programs are cost-effective if they achieve positive net benefits in the UCT. All of the programs proposed by SPS in the 2014 Plan are cost-effective (i.e., achieve positive UCT net benefits) at the estimated budget and participation levels. 17.7.2.9.F NMAC specifies that programs, but not all measures, must be cost-effective. Individual program-level UCT results are provided in Table 1. The following sections describe the assumptions SPS has made in order to perform the cost-effectiveness, energy, and demand savings estimates.
1. Avoided Costs In order to determine the cost-effectiveness of its programs, SPS must first calculate the avoided generation, transmission, distribution, and marginal energy costs associated with the energy efficiency and load management savings.
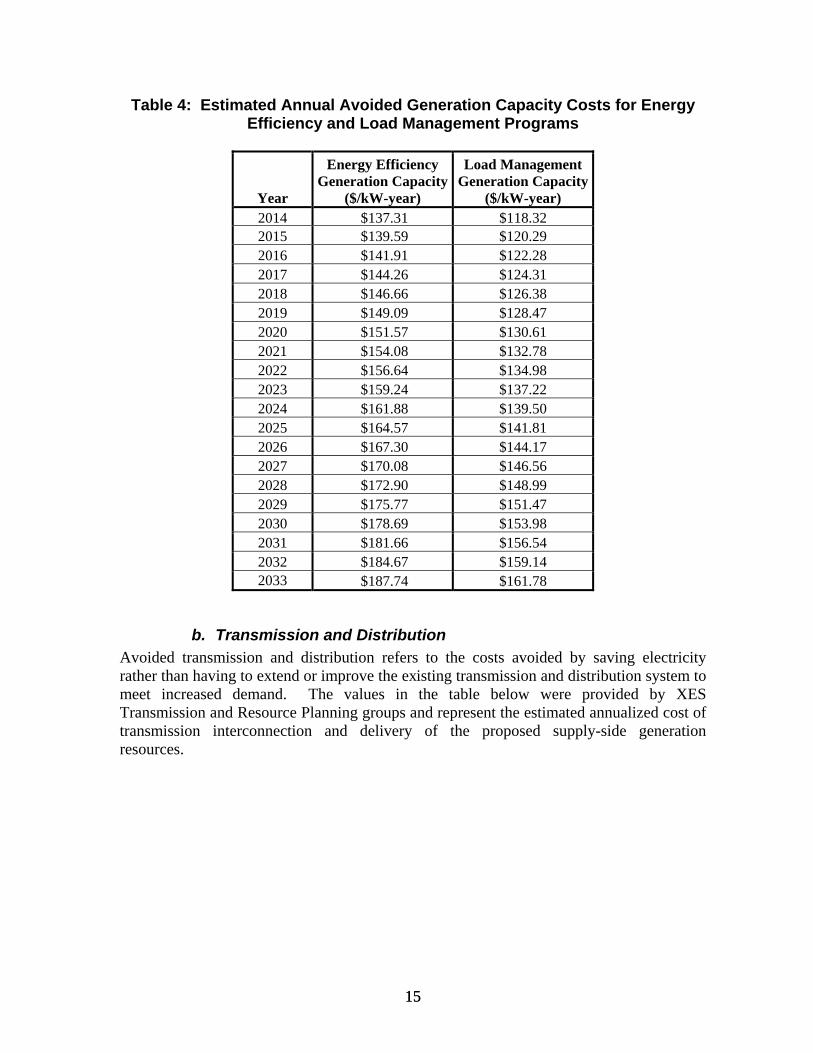
a. Generation Avoided generation represents the cost of supply-side generation resources displaced by energy efficiency and load management programs. The avoided generation values used in the 2014 Plan were derived by XES’s Resource Planning group. SPS used a portfolio approach considering future resource needs and forecasted generation additions to the SPS system consistent with the final order in Case No. 07-00376-UT2. Resources were selected that most closely met resource needs based on an overall least-cost approach that balanced actual resource cost and the corresponding cost of energy. The analysis covered the entire 20-year planning period of this Plan. Table 4 below provides the annual values of avoided generation costs from 2014 to 2033.
2 Case No. 07-00376-UT; In the Matter of Southwestern Public Service Company’s Application for Approval of Electric Energy Efficiency and Load Management Programs and Program Cost Tariff Rider Pursuant to the New Mexico Public Utility Act and the Efficient Use of Energy Act; Final Order (Apr. 17, 2008).
15 15
Table 4: Estimated Annual Avoided Generation Capacity Costs for Energy Efficiency and Load Management Programs
Year
Energy Efficiency Generation Capacity
($/kW-year)
Load Management Generation Capacity
($/kW-year) 2014 $137.31 $118.322015 $139.59 $120.29 2016 $141.91 $122.28 2017 $144.26 $124.31 2018 $146.66 $126.38 2019 $149.09 $128.47 2020 $151.57 $130.61 2021 $154.08 $132.78 2022 $156.64 $134.98 2023 $159.24 $137.22 2024 $161.88 $139.50 2025 $164.57 $141.81 2026 $167.30 $144.17 2027 $170.08 $146.56 2028 $172.90 $148.99 2029 $175.77 $151.47 2030 $178.69 $153.98 2031 $181.66 $156.54 2032 $184.67 $159.14 2033 $187.74 $161.78
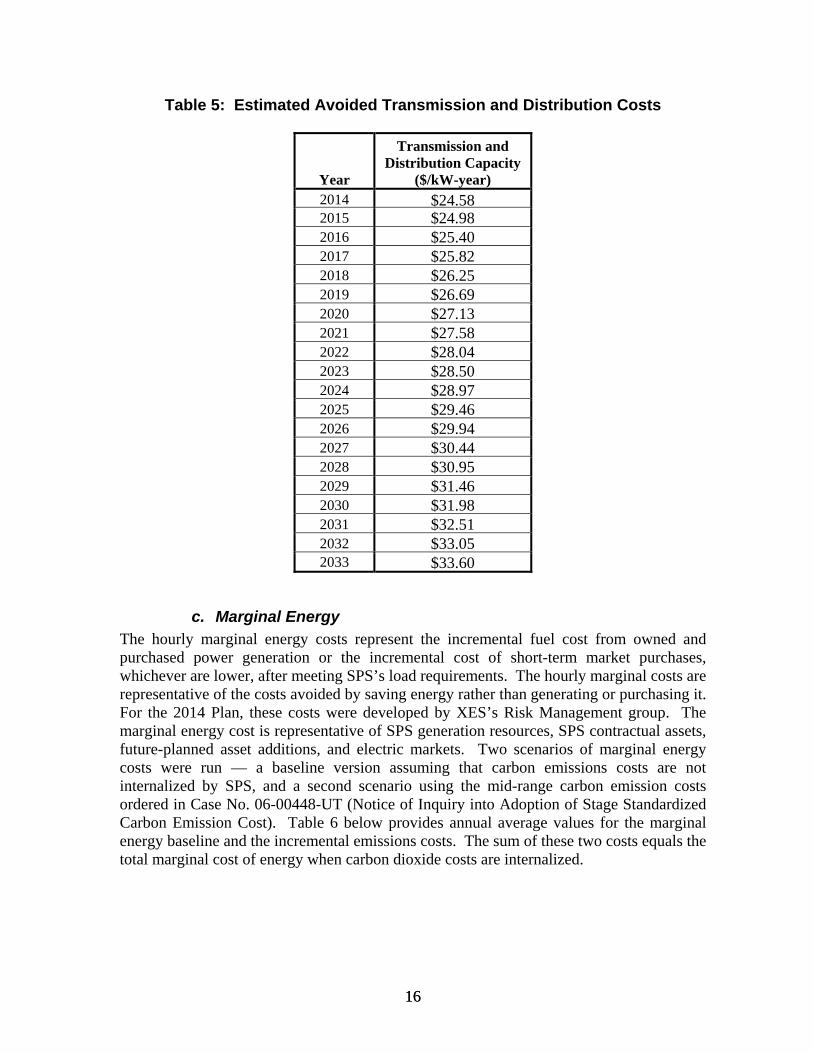
b. Transmission and Distribution Avoided transmission and distribution refers to the costs avoided by saving electricity rather than having to extend or improve the existing transmission and distribution system to meet increased demand. The values in the table below were provided by XES Transmission and Resource Planning groups and represent the estimated annualized cost of transmission interconnection and delivery of the proposed supply-side generation resources.
16 16
Table 5: Estimated Avoided Transmission and Distribution Costs
Year
Transmission and Distribution Capacity
($/kW-year) 2014 $24.582015 $24.982016 $25.402017 $25.822018 $26.252019 $26.692020 $27.132021 $27.582022 $28.042023 $28.502024 $28.972025 $29.462026 $29.942027 $30.442028 $30.952029 $31.462030 $31.982031 $32.512032 $33.052033 $33.60
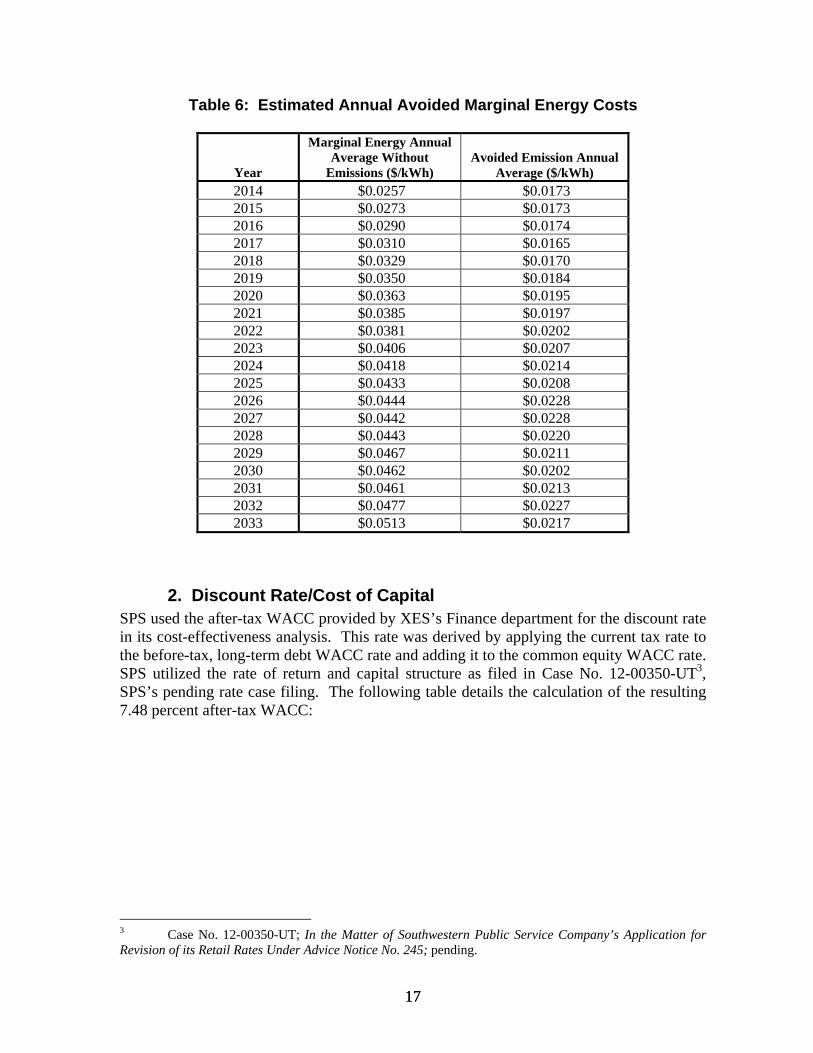
c. Marginal Energy The hourly marginal energy costs represent the incremental fuel cost from owned and purchased power generation or the incremental cost of short-term market purchases, whichever are lower, after meeting SPS’s load requirements. The hourly marginal costs are representative of the costs avoided by saving energy rather than generating or purchasing it. For the 2014 Plan, these costs were developed by XES’s Risk Management group. The marginal energy cost is representative of SPS generation resources, SPS contractual assets, future-planned asset additions, and electric markets. Two scenarios of marginal energy costs were run — a baseline version assuming that carbon emissions costs are not internalized by SPS, and a second scenario using the mid-range carbon emission costs ordered in Case No. 06-00448-UT (Notice of Inquiry into Adoption of Stage Standardized Carbon Emission Cost). Table 6 below provides annual average values for the marginal energy baseline and the incremental emissions costs. The sum of these two costs equals the total marginal cost of energy when carbon dioxide costs are internalized.
17 17
Table 6: Estimated Annual Avoided Marginal Energy Costs
Year
Marginal Energy Annual Average Without
Emissions ($/kWh) Avoided Emission Annual
Average ($/kWh) 2014 $0.0257 $0.0173 2015 $0.0273 $0.0173 2016 $0.0290 $0.0174 2017 $0.0310 $0.0165 2018 $0.0329 $0.0170 2019 $0.0350 $0.0184 2020 $0.0363 $0.0195 2021 $0.0385 $0.0197 2022 $0.0381 $0.0202 2023 $0.0406 $0.0207 2024 $0.0418 $0.0214 2025 $0.0433 $0.0208 2026 $0.0444 $0.0228 2027 $0.0442 $0.0228 2028 $0.0443 $0.0220 2029 $0.0467 $0.0211 2030 $0.0462 $0.0202 2031 $0.0461 $0.0213 2032 $0.0477 $0.0227 2033 $0.0513 $0.0217
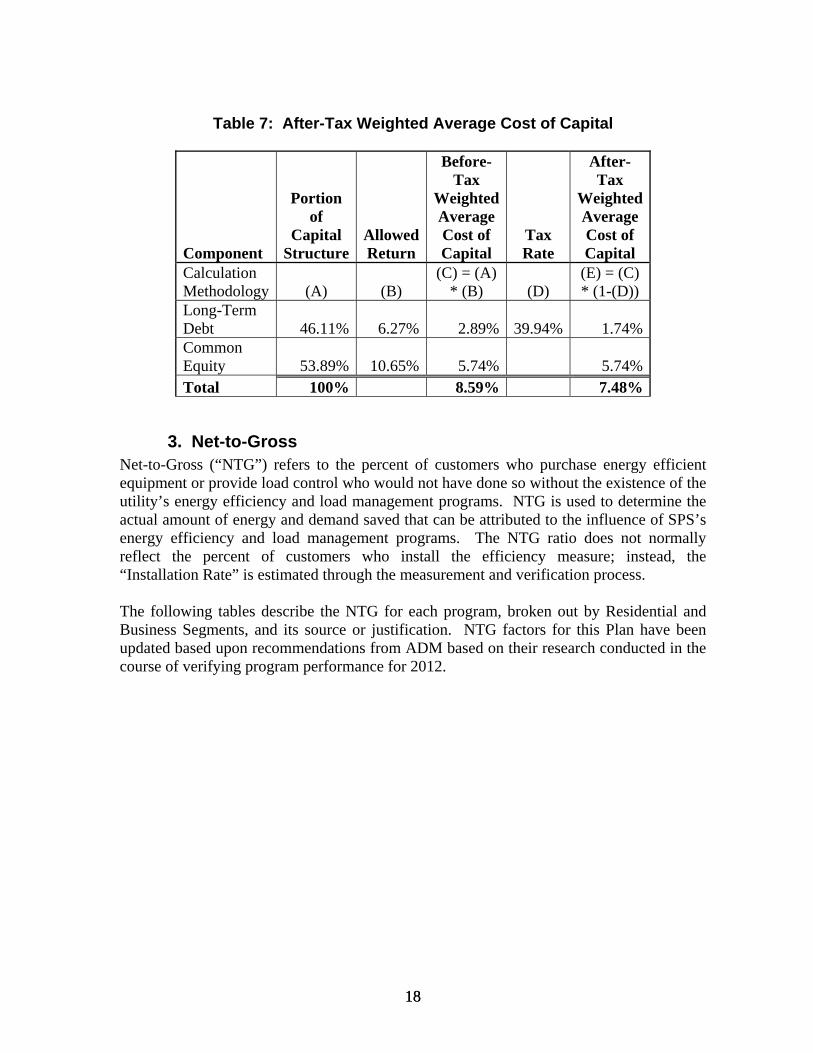
2. Discount Rate/Cost of Capital SPS used the after-tax WACC provided by XES’s Finance department for the discount rate in its cost-effectiveness analysis. This rate was derived by applying the current tax rate to the before-tax, long-term debt WACC rate and adding it to the common equity WACC rate. SPS utilized the rate of return and capital structure as filed in Case No. 12-00350-UT3, SPS’s pending rate case filing. The following table details the calculation of the resulting 7.48 percent after-tax WACC:
3 Case No. 12-00350-UT; In the Matter of Southwestern Public Service Company’s Application for Revision of its Retail Rates Under Advice Notice No. 245; pending.
18 18
Table 7: After-Tax Weighted Average Cost of Capital
Component
Portion of
Capital Structure
Allowed Return
Before-Tax
Weighted Average Cost of Capital
Tax Rate
After-Tax
Weighted Average Cost of Capital
Calculation Methodology (A) (B)
(C) = (A) * (B) (D)
(E) = (C) * (1-(D))
Long-Term Debt 46.11% 6.27% 2.89% 39.94% 1.74% Common Equity 53.89% 10.65% 5.74% 5.74% Total 100% 8.59% 7.48%
3. Net-to-Gross Net-to-Gross (“NTG”) refers to the percent of customers who purchase energy efficient equipment or provide load control who would not have done so without the existence of the utility’s energy efficiency and load management programs. NTG is used to determine the actual amount of energy and demand saved that can be attributed to the influence of SPS’s energy efficiency and load management programs. The NTG ratio does not normally reflect the percent of customers who install the efficiency measure; instead, the “Installation Rate” is estimated through the measurement and verification process. The following tables describe the NTG for each program, broken out by Residential and Business Segments, and its source or justification. NTG factors for this Plan have been updated based upon recommendations from ADM based on their research conducted in the course of verifying program performance for 2012.
19 19
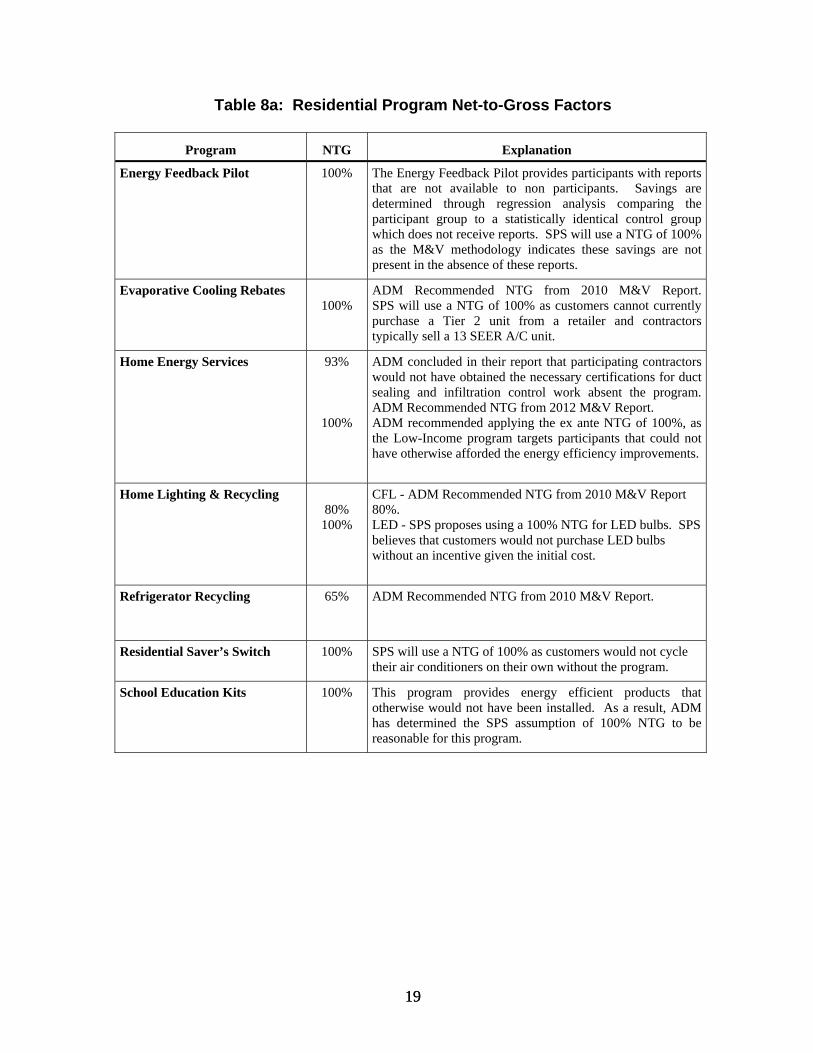
Table 8a: Residential Program Net-to-Gross Factors
Program NTG Explanation
Energy Feedback Pilot 100% The Energy Feedback Pilot provides participants with reports that are not available to non participants. Savings are determined through regression analysis comparing the participant group to a statistically identical control group which does not receive reports. SPS will use a NTG of 100% as the M&V methodology indicates these savings are not present in the absence of these reports.
Evaporative Cooling Rebates
100%
ADM Recommended NTG from 2010 M&V Report.SPS will use a NTG of 100% as customers cannot currently purchase a Tier 2 unit from a retailer and contractors typically sell a 13 SEER A/C unit.
Home Energy Services 93%
100%
ADM concluded in their report that participating contractors would not have obtained the necessary certifications for duct sealing and infiltration control work absent the program. ADM Recommended NTG from 2012 M&V Report. ADM recommended applying the ex ante NTG of 100%, as the Low-Income program targets participants that could not have otherwise afforded the energy efficiency improvements.
Home Lighting & Recycling
80%
100%
CFL - ADM Recommended NTG from 2010 M&V Report 80%. LED - SPS proposes using a 100% NTG for LED bulbs. SPS believes that customers would not purchase LED bulbs without an incentive given the initial cost.
Refrigerator Recycling
65% ADM Recommended NTG from 2010 M&V Report.
Residential Saver’s Switch 100% SPS will use a NTG of 100% as customers would not cycle their air conditioners on their own without the program.
School Education Kits 100% This program provides energy efficient products that otherwise would not have been installed. As a result, ADM has determined the SPS assumption of 100% NTG to be reasonable for this program.
20 20
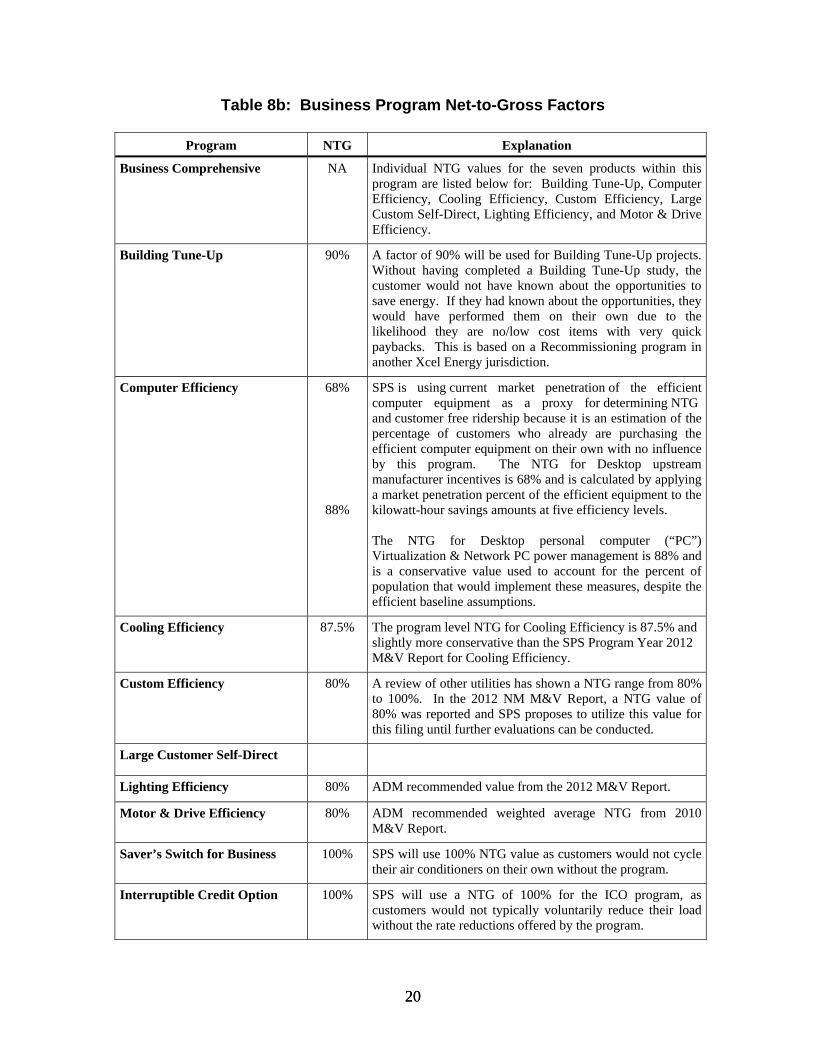
Table 8b: Business Program Net-to-Gross Factors
Program NTG Explanation
Business Comprehensive NA Individual NTG values for the seven products within this program are listed below for: Building Tune-Up, Computer Efficiency, Cooling Efficiency, Custom Efficiency, Large Custom Self-Direct, Lighting Efficiency, and Motor & Drive Efficiency.
Building Tune-Up 90% A factor of 90% will be used for Building Tune-Up projects. Without having completed a Building Tune-Up study, the customer would not have known about the opportunities to save energy. If they had known about the opportunities, they would have performed them on their own due to the likelihood they are no/low cost items with very quick paybacks. This is based on a Recommissioning program in another Xcel Energy jurisdiction.
Computer Efficiency 68%
88%
SPS is using current market penetration of the efficient computer equipment as a proxy for determining NTG and customer free ridership because it is an estimation of the percentage of customers who already are purchasing the efficient computer equipment on their own with no influence by this program. The NTG for Desktop upstream manufacturer incentives is 68% and is calculated by applying a market penetration percent of the efficient equipment to the kilowatt-hour savings amounts at five efficiency levels. The NTG for Desktop personal computer (“PC”) Virtualization & Network PC power management is 88% and is a conservative value used to account for the percent of population that would implement these measures, despite the efficient baseline assumptions.
Cooling Efficiency 87.5% The program level NTG for Cooling Efficiency is 87.5% and slightly more conservative than the SPS Program Year 2012 M&V Report for Cooling Efficiency.
Custom Efficiency 80% A review of other utilities has shown a NTG range from 80% to 100%. In the 2012 NM M&V Report, a NTG value of 80% was reported and SPS proposes to utilize this value for this filing until further evaluations can be conducted.
Large Customer Self-Direct
Lighting Efficiency 80% ADM recommended value from the 2012 M&V Report.
Motor & Drive Efficiency 80% ADM recommended weighted average NTG from 2010 M&V Report.
Saver’s Switch for Business 100% SPS will use 100% NTG value as customers would not cycle their air conditioners on their own without the program.
Interruptible Credit Option 100% SPS will use a NTG of 100% for the ICO program, as customers would not typically voluntarily reduce their load without the rate reductions offered by the program.
21 21
4. Transmission Loss Factors The Transmission Loss Factor accounts for the energy lost in the form of heat due to resistance while electricity is being transmitted from the generator to the customer. This value becomes important because energy and demand savings are typically measured at the customer meter and must be converted into generator savings to understand their impact on resource planning. SPS uses a weighted average loss factor of 7.7 percent for the annual energy saved, and a factor of 10.4 percent at the time of system peak for the annual capacity savings for all business programs. For residential programs, these factors are 11.8 percent for the annual energy saved, and 16.2 percent for the annual capacity savings. These factors are consistent with those used in SPS’s most recently filed base rate case (Case No. 12-00350-UT).
5. Non-Energy Benefits Non-energy benefits (“NEBs”) are those savings to the customer or utility that result from participation in an energy efficiency or load management program, but that are not directly related to the consumption of fuel served by SPS (electricity). Such NEBs may include savings from reduced outages, arrearages, savings, or costs related to the change in consumption of fuel not served by SPS (e.g., natural gas, propane, wood, etc.), or incremental operation and maintenance (“O&M”) savings of labor, maintenance, or materials. Since the UCT does not consider participant benefits and costs, SPS has not included NEBs in its benefit-cost analyses.
6. System Benefits System benefits refer to the benefits received by everyone served by SPS’s electrical system as a result of SPS offering energy efficiency and load management programs. By definition, cost-effective energy efficiency and load management programs deliver system benefits to all customers by reducing or alleviating the need to build new generation, transmission, or distribution to meet growing customer demand. While the participants in these programs will reap the additional benefit of a decrease in their electricity consumption, all customers will benefit from the system reductions. The total portfolio UCT for 2014 is projected to be 2.60, which demonstrates that the benefits (the avoided costs of generation, transmission, distribution of traditional power plants or purchases of power) outweigh the projected energy efficiency and load management programs’ utility and customer costs by a ratio of more than 2 to 1.
22 22
II. Program Delivery and Administration
A. General Marketing and Outreach Plan SPS has developed an extensive marketing and outreach plan to target residential (including low-income) and business customers throughout the service area. The following sections describe the plans specific to each customer segment.
1. Residential Segment The focus during 2014 will be to increase awareness and interest in energy efficiency among homeowners and renters. Efficiency messages will be promoted through a variety of channels, including:
• efficient equipment distributors and installation contractors; • advertising, bill inserts, newsletters, and direct mail campaigns; • internet, email, and social media marketing; • Xcel Energy’s residential call center; and • joint promotions with Consumer Education and SPS’s other efficiency programs.
In addition to this messaging, SPS will also re-evaluate and reorganize the structure of its low-income offerings. Primary to this will be the development of a contract with a state agency that is positioned to help SPS reduce barriers to customer participation in the Low-Income HES program. In the past, SPS has found barriers to income reporting have negatively affected participation by reducing customer interest and discouraging contractor participation. By reducing these barriers and gaining access to income-qualified participants, SPS hopes to reduce barriers to participation. In addition, SPS will also evaluate the low-income offerings of other utilities to determine if there are existing savings opportunities and where possible will consider implementing programs to seize these opportunities to provide energy saving services.
2. Business Segment SPS will use a wide variety of channels and marketing tactics to reach its business customers and trade allies. The ultimate goal is to increase program awareness and knowledge with customers and trade partners, drive efficient equipment stocking practices, and increase program participation. SPS will use the following channels to interact with customers:
• Account Managers – Account Managers will work with SPS’s large, managed account customers to inform them of energy efficiency programs, help them identify qualifying energy efficiency opportunities, and walk them through the participation process. This channel is very important for the customized programs due to the participation requirements and complexities of analyzing energy savings.
23 23
• Energy Efficiency Specialists – The Energy Efficiency Specialists (“EES”) from the Business Solutions Center will handle all interactions with SPS’s small and mid-sized non-managed account customers. They will educate business customers about efficiency programs and cross-sell energy efficiency on incoming calls for utility issues. In addition, they will proactively reach out to customers to help promote energy efficiency programs, guide customers through the application process, and prepare paperwork for rebate submission.
• Trade Relations Manager – The Trade Relations Manager will conduct outreach to trade partners, including distributors, wholesalers, and installation contractors. This position educates local and regional trade partners about our efficiency programs through personal meetings, workshops, and training sessions. They also provide valuable feedback on new technologies and program improvements.
• Third-Party Program Implementers – SPS will rely on a third-party program implementer to provide direct customer marketing, outreach, and trade training for specific program offerings. The implementer will perform energy efficiency audits and will recommend participation in all Business programs. The implementer will also perform a sales engineering role supporting both managed and non-managed customers. The implementer will also assist customers to complete rebate applications and process supporting documentation.
SPS will use the following marketing tactics to notify and educate business customers about the programs:
• program collateral including feature sheets, case studies, rebate applications, and engineering analysis worksheets;
• newsletters; • presentations to Chambers of Commerce, trade organizations, and architectural
and engineering firms; and • targeted campaigns via direct mail or email to customers and trade allies.
SPS remains committed to delivering cost-effective projects in the future, and to that end, it is implementing strategies to accelerate customer acceptance going forward. SPS’s efforts to improve business performance include:
• continuing to build general energy efficiency and program awareness with customers;
• expanding trade outreach to increase the number of energy efficiency proponents in its service territory;
• increasing large customer planning and sales efforts; and • continuing to aggressively market all business programs.
SPS is confident that these activities will significantly augment the work already started in New Mexico and build a strong pipeline of energy efficiency projects for completion in future years.
24 24
B. Roles and Responsibilities SPS typically uses resources from several different internal departments to administer its energy efficiency and load management programs. Specifically, the following employees contribute to the process:
• Market Research Analyst – performs and oversees research on the energy efficiency market to help guide program planning;
• Product Developer – identifies and develops the proposed programs and products; • Program Manager – manages overall program marketing and performance
tracking; • Account Manager – interacts with large business customers to promote programs; • Trade Relations Manager – works with the trade (vendors, contractors, and
manufacturers) to educate them about the programs; • Energy Efficiency Engineer – reviews Custom Efficiency and Large Customer
Self-Direct applications, and helps to develop and refine product deemed savings and technical assumptions;
• Energy Efficiency Specialist – works with small and mid-sized account customers.
• Rebate Processor – reviews/approves applications and invoices and pays rebates; and
• Regulatory Analyst – performs benefit-cost analyses, drafts and manages program filings, and corresponds with regulators and other interested parties.
In addition, SPS works with outside groups such as equipment vendors and manufacturers, community agencies, third-party administrators, and contractors as noted in the individual program descriptions.
C. Reporting Process SPS filed its first annual report reflecting its 2008 program year on August 1, 2009, and has filed its 2009, 2010, and 2011 annual reports each subsequent year. The 2012 annual report was filed on August 1, 2013. Listed below are the details provided in this report:
• Actual expenditures and verified achievements of the preceding calendar year; • Reporting requirements as stated in 17.7.2.13 NMAC; • Reconciliation information for the Energy Efficiency Tariff Rider; • Program/project descriptions, including an explanation of deviations from goal
and changes during 2012 organized into the Residential, Business, and Planning & Research Segments; and
• Benefit-cost analyses for the Residential and Business programs, as well as the overall portfolio.
25 25
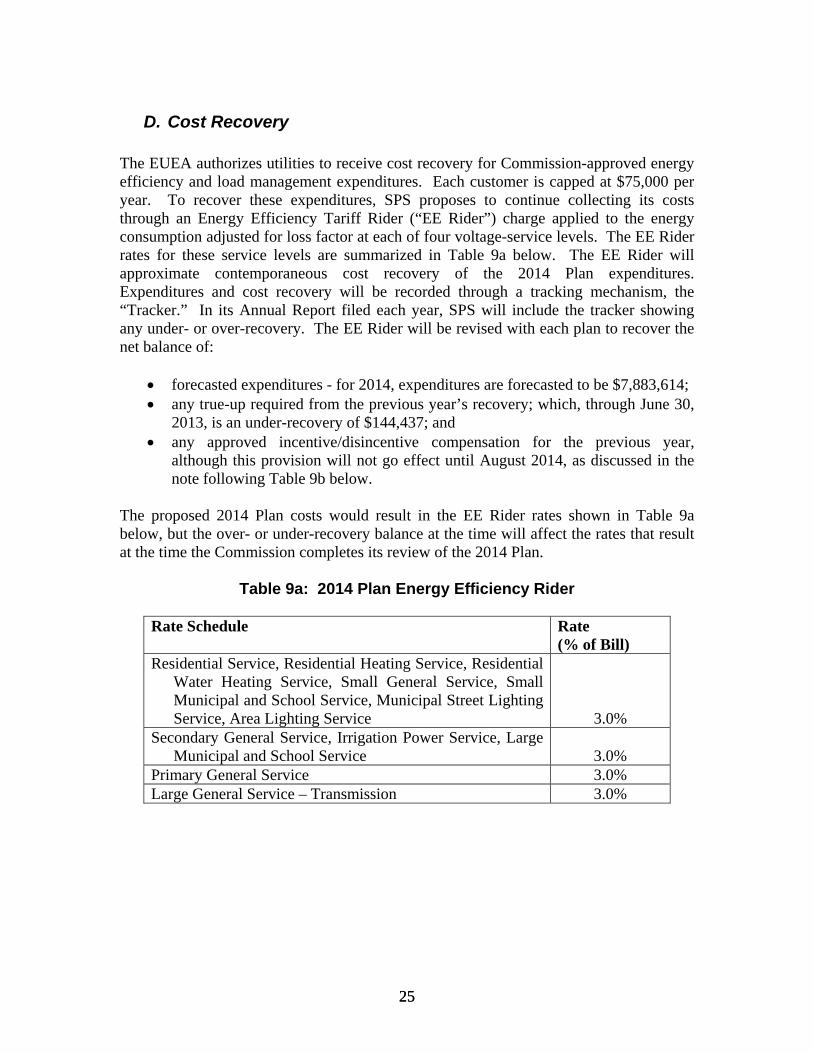
D. Cost Recovery The EUEA authorizes utilities to receive cost recovery for Commission-approved energy efficiency and load management expenditures. Each customer is capped at $75,000 per year. To recover these expenditures, SPS proposes to continue collecting its costs through an Energy Efficiency Tariff Rider (“EE Rider”) charge applied to the energy consumption adjusted for loss factor at each of four voltage-service levels. The EE Rider rates for these service levels are summarized in Table 9a below. The EE Rider will approximate contemporaneous cost recovery of the 2014 Plan expenditures. Expenditures and cost recovery will be recorded through a tracking mechanism, the “Tracker.” In its Annual Report filed each year, SPS will include the tracker showing any under- or over-recovery. The EE Rider will be revised with each plan to recover the net balance of:
• forecasted expenditures - for 2014, expenditures are forecasted to be $7,883,614; • any true-up required from the previous year’s recovery; which, through June 30,
2013, is an under-recovery of $144,437; and • any approved incentive/disincentive compensation for the previous year,
although this provision will not go effect until August 2014, as discussed in the note following Table 9b below.
The proposed 2014 Plan costs would result in the EE Rider rates shown in Table 9a below, but the over- or under-recovery balance at the time will affect the rates that result at the time the Commission completes its review of the 2014 Plan.
Table 9a: 2014 Plan Energy Efficiency Rider
Rate Schedule Rate (% of Bill)
Residential Service, Residential Heating Service, Residential Water Heating Service, Small General Service, Small Municipal and School Service, Municipal Street Lighting Service, Area Lighting Service 3.0%
Secondary General Service, Irrigation Power Service, Large Municipal and School Service 3.0%
Primary General Service 3.0% Large General Service – Transmission 3.0%
26 26
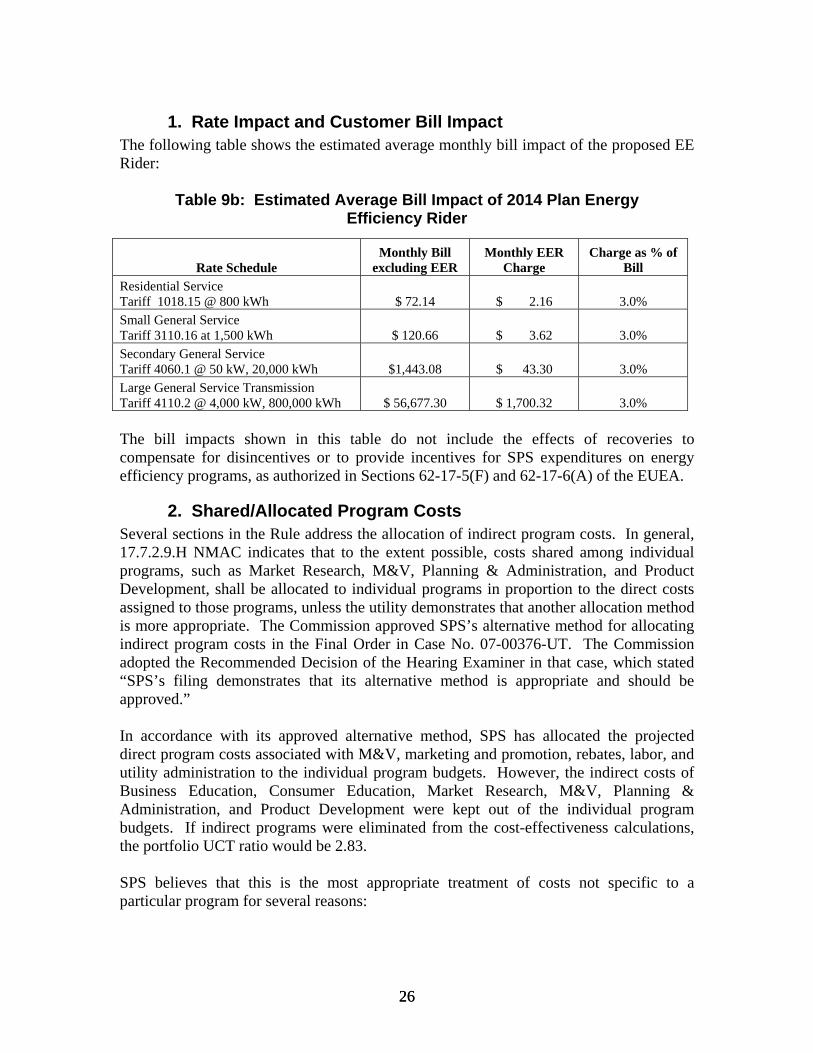
1. Rate Impact and Customer Bill Impact The following table shows the estimated average monthly bill impact of the proposed EE Rider:
Table 9b: Estimated Average Bill Impact of 2014 Plan Energy
Efficiency Rider
The bill impacts shown in this table do not include the effects of recoveries to compensate for disincentives or to provide incentives for SPS expenditures on energy efficiency programs, as authorized in Sections 62-17-5(F) and 62-17-6(A) of the EUEA.
2. Shared/Allocated Program Costs Several sections in the Rule address the allocation of indirect program costs. In general, 17.7.2.9.H NMAC indicates that to the extent possible, costs shared among individual programs, such as Market Research, M&V, Planning & Administration, and Product Development, shall be allocated to individual programs in proportion to the direct costs assigned to those programs, unless the utility demonstrates that another allocation method is more appropriate. The Commission approved SPS’s alternative method for allocating indirect program costs in the Final Order in Case No. 07-00376-UT. The Commission adopted the Recommended Decision of the Hearing Examiner in that case, which stated “SPS’s filing demonstrates that its alternative method is appropriate and should be approved.” In accordance with its approved alternative method, SPS has allocated the projected direct program costs associated with M&V, marketing and promotion, rebates, labor, and utility administration to the individual program budgets. However, the indirect costs of Business Education, Consumer Education, Market Research, M&V, Planning & Administration, and Product Development were kept out of the individual program budgets. If indirect programs were eliminated from the cost-effectiveness calculations, the portfolio UCT ratio would be 2.83. SPS believes that this is the most appropriate treatment of costs not specific to a particular program for several reasons:
Rate Schedule Monthly Bill
excluding EER Monthly EER
Charge Charge as % of
Bill Residential Service Tariff 1018.15 @ 800 kWh $ 72.14 $ 2.16 3.0% Small General Service Tariff 3110.16 at 1,500 kWh $ 120.66 $ 3.62 3.0% Secondary General Service Tariff 4060.1 @ 50 kW, 20,000 kWh $1,443.08 $ 43.30 3.0% Large General Service Transmission Tariff 4110.2 @ 4,000 kW, 800,000 kWh $ 56,677.30 $ 1,700.32 3.0%
27 27
• First, such costs are often not directly related to individual programs. Therefore, to use the direct costs of those particular programs as an allocation method would not be accurate.
• Second, these types of costs are often irregular, with large expenses in some years and almost no expenditures in other years. If SPS must allocate these charges to the programs, regardless of magnitude, it may result in certain programs becoming non-cost-effective.
• Third, given the variation in these costs from year-to-year, and the suggested method to allocate based on direct program costs, it would be very difficult for SPS to manage individual program budgets and insure their cost-effectiveness because program managers would not know how much to expect from these indirect programs.
• Finally, it is more administratively efficient for SPS to manage the indirect costs outside of the individual programs. SPS’s internal accounting system uses individual accounting codes for each indirect program as well as for each direct-impact program. These indirect costs could not be allocated directly to the programs, but would first be charged to their subject area, and then allocated to the programs, creating a two-step accounting process instead of one.
3. Budget Categories SPS intends to use the following five budget categories to track and report its annual expenditures for each energy efficiency and load management program:
• Total Incentive – The total dollars paid in rebates to customers. • Internal Administration – This category includes the costs for:
o Project Delivery – to deliver the program to the customer including Program Manager labor and costs;
o Utility Administration – to administer the program internally, including Rebate Processing and Planning & Administration;
o Other Project Administration – internal or external costs not covered in any other cost category. These costs may include outside contractors and consultants hired to perform installation, engineering, or other services for SPS to assist in delivery or administration of programs to customers; and
o Research & Development – internal costs to develop the programs. • Third-Party Delivery – Used only when a third party administers, implements, or
delivers a major portion of the program to customers. This should include all costs that the third party incurs, minus the cost of the energy efficient equipment, which should be counted as a rebate.
• Promotion – Costs to promote the programs. • M&V – Costs to perform M&V on the programs.
The following table describe SPS’s proposed program expenditures split into the proposed budget categories listed above.
28 28
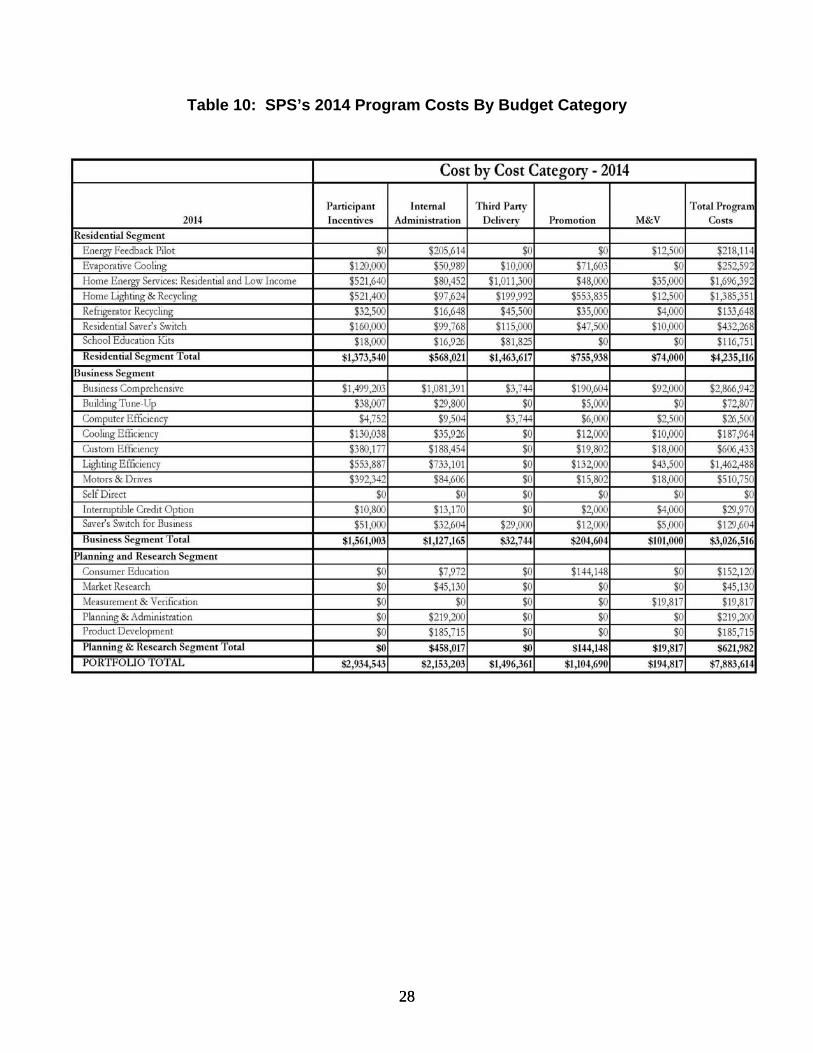
Table 10: SPS’s 2014 Program Costs By Budget Category
29 29
III. Program Details
A. Residential Segment SPS will continue to offer a wide range of product offerings to serve the Residential Segment in 2014. These offerings will be available to over 92,000 customers residing in single family homes, multi-family homes, and apartments and condominiums in southeastern New Mexico. The Residential Segment will focus on educating customers about energy efficiency, giving them simple ways to participate, and encouraging them to make long-term commitments to reduce their energy usage. The marketing strategy for the Residential Segment is to build awareness and provide consumers a variety of energy efficiency offerings, including direct impact measures, indirect impact services, and educational tools. SPS will execute Residential Segment outreach and marketing efforts through the use of targeted advertising, statement messaging, community meetings, events at local retailers, as well as content and tools on Xcel Energy websites xcelenergy.com and responsiblebynature.com. SPS proposes to offer residential customers seven energy efficiency programs in the 2014 Plan, including (i) Energy Feedback Pilot, (ii) Evaporative Cooling, (iii) Home Energy Services (Residential and Low-Income), (iv) Home Lighting & Recycling, (v) Refrigerator Recycling, (vi) Residential Saver’s Switch, and (vii) School Education Kits. The following sections detail each of the proposed programs.
1. Energy Feedback Pilot (formerly known as the Consumer Behavior Pilot)
a. Program Description
SPS began studying ways to influence consumer behavior to save energy in 2010 which resulted in the development of a three-year (2011-2013) Energy Feedback Pilot program to quantify the effects of informational feedback on energy consumption in 15,000 households, consistent with the Commission’s Final Order in Case No. 09-00352-UT. The feedback communication strategies from this pilot program are intended to result in a persistent decrease in energy usage by inducing changes in the behavior of the end-user and increased or earlier adoption of energy efficient technologies and energy efficient practices that remain even after the feedback is removed. The Energy Feedback Pilot will determine when, how, and why customers may change their consumption behavior when provided with information by utilizing energy use feedback modalities and frequencies.

30 30
The Energy Feedback Pilot is administered by a third-party provider, Opower, based on their Home Energy Reports feedback system. Opower will provide selected customers with Home Energy Reports comprised of carefully-crafted components designed to work together to drive efficiency gains and maximize engagement. The reports provide customers with contextualized energy use, data-driven insights, and targeted action steps, all leading to a sustainable drop in electricity use. In order to develop targeted messages, Opower will analyze an array of data streams to derive insights about customer segments and individual customers. This data includes historical and meter data, rebate and purchase information, and third-party data, such as housing, demographics (e.g., age, wealth, number of residents in a household), customer usage patterns, past product participation, weather, geography, and more. On a monthly basis, Opower will compile the usage data that has been provided by SPS and generate the appropriate analysis to create personalized reports mailed to all 15,000 individuals enrolled in this method. Following the receipt of the Home Energy Report, customers may choose to call into the call center and talk to customer service representatives about questions regarding their energy usage or to inquire about participation in other products. The representatives are trained to handle these inquiries and will have access to a special help system that specifically provides support for this Energy Feedback Pilot product. For customers who can benefit, their enrollment in other products or participation in rebates will be handled through established SPS rebate program channels. Customers will be selected to receive reports on a varying frequency, with the average customer receiving over six reports in the first year of the product. The goals of the Energy Feedback Pilot are:
• To educate SPS customers about energy usage and conservation allowing them to make behavioral choices in their homes.
• To provide online access and test the difference in effectiveness versus directly mailing a Home Energy Report to a select group of SPS customers up to six times per year.
• To develop awareness of energy conservation among all SPS customers and encourage enrollment and participation in the energy conservation programs.
• To track and measure the energy savings that occurs as a result of participating in the Energy Feedback Pilot program including the persistence of savings over time.
Key questions addressed by this pilot are:
• How much can SPS reduce residential electricity use by providing periodic feedback, motivation, and recommendations targeted by market segment?
• Do the reductions in energy use achieved by providing feedback persist over time?
• Can likely high savers be identified and targeted in advance to maximize product cost-effectiveness?
31 31
• How do customers perceive the types of feedback, and what actions (behavioral, low-cost, capital investment) account for the savings achieved?
• Does on-line feedback provide as much energy savings as print reports? Similarly, are incremental savings achieved for participants who have access to both print and on-line versions?
Budget The majority of the budget for this pilot is based on costs associated with Opower, the service provider. In addition to program administration, most of Opower’s costs result from paper, printing, envelopes, and postage for the Home Energy Reports. The utility administrative costs for a three-year pilot are somewhat frontloaded because of the data set-up/transfer to Opower and other work involved with the setup. M&V costs were estimated by ADM based on similar evaluations they’ve conducted and their newly approved M&V contract.
Changes for 2014 Set-up and preparation for the pilot proved to take longer than anticipated and was not completed until early in 2012. As such, SPS plans to continue the pilot through 2014 so a full three years (2012–2014) of results can be evaluated per the program’s original intent. For 2014, SPS will introduce an additional component to the Pilot in the form of on-line access. This will allow all customers who access My Account to retrieve personalized feedback data, similar to what is currently provided through paper reports. Adding this dimension will allow SPS to determine whether electronic feedback mechanisms are as impactful as print and if cost-effective incremental savings are achieved when customers are provided both on-line and print Energy Feedback Reports. The pilot began with an initial population of 15,000 participants in 2012. Since that time, participation has dropped due to participants opting out or moving. Based on this attrition rate, SPS expects approximately 12,029 participants to receive print reports in 2014. Participation in the on-line version of the program is estimated to be 1,438 participants.
b. Program Administration Customers are engaged through the random selection of 15,000 participants and a statistically significant and homogeneous non-contact control group of approximately the same size. Customers were informed of their selection as participants at the beginning of the pilot and have been offered the opportunity to withdraw (or opt-out) from the participant group. The control group customers will never be contacted or influenced by any contact with this study. Because the goal is to estimate the impact of large-scale feedback products, participants were selected from the general population and recruited in a manner that minimized self-selection bias. Appropriate control and comparison groups will allow us to isolate effects attributable to each strategy. No additional participants will be added to the group receiving print material in 2014.
32 32
The on-line version of the Energy Feedback program is opt-in. Customers become participants once they log onto My Account and go to the Energy Feedback tab. To help drive this engagement, SPS plans to use low-cost/high-impact marketing outreach methods such as e-mail, promotion, and marketing alongside MyAccount communications and bill information. We will be testing various marketing methods and messages to determine which have the highest impacts to drive the program’s success. The persistence of savings or the length of time customers and SPS continue to realize the energy savings resulting from the energy feedback provided is key to the program’s cost-effectiveness. The feedback strategies are intended to result in a persistent decrease in energy usage by inducing long lasting changes in the behavior of the end-user and an increased or earlier adoption of high efficiency technologies and energy efficient practices that remain even after the feedback is removed. To assess persistence, this project will leverage findings from similar programs within SPS’s service territory and from other utilities. In past studies by other utilities (e.g., Sacramento Municipal Utility District, Connexus Energy, City of Fort Collins, Pacific Gas and Electric), similar programs with persistence measurement have been run for up to a two-year period with gradually declining savings delivered throughout the period. Ongoing measurement of these programs will continue to be monitored by SPS.
c. Marketing and Outreach Plan
There are no financial rewards or rebates at this time. SPS will track the same customer participant group for the entire three-year pilot period. The pilot will study the persistence of the behaviors to determine the true measure lifetime. SPS will calculate and recognize savings periodically using a comparison of the Participant Group and the Control Group as it occurs and only if it occurs. SPS will track standard rebates by customer/account and will subtract the energy saved through these product participations from the Energy Feedback results to prevent double counting. SPS will also survey participants to see if they have purchased any rebated equipment that may contribute to the savings. These savings, if determined to be significant, will also be subtracted from the pilot total to prevent double counting.
d. Measurement & Verification Plan
Opower’s M&V of energy performance is a key outcome provided as part of this program. Opower conducts a rigorous statistical analysis to measure the savings difference between participants and the control group. Meter data for all participants, comparison homes and control homes will be file-transferred via a secure file transfer protocol for continuous analysis and performance reporting. Contractual agreements with Opower include confidentiality and data privacy language that has been reviewed by legal counsel and conforms to SPS’s most current Customer Data Privacy standards.
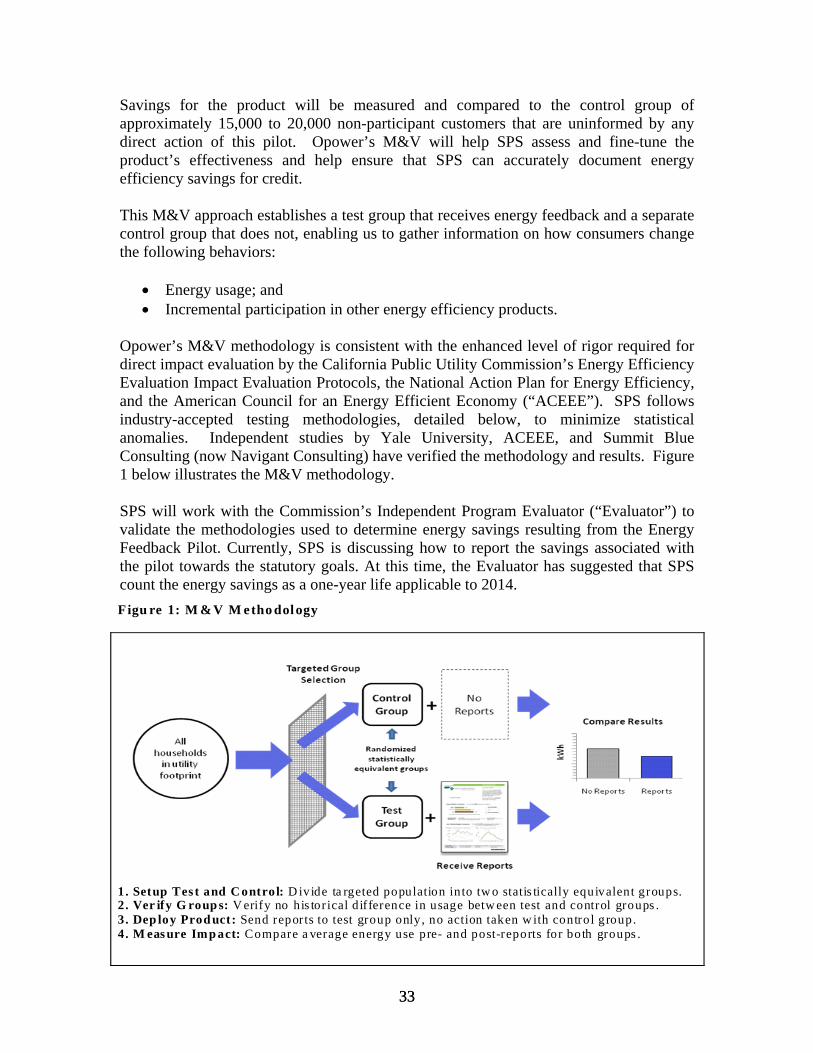
33 33
Savings for the product will be measured and compared to the control group of approximately 15,000 to 20,000 non-participant customers that are uninformed by any direct action of this pilot. Opower’s M&V will help SPS assess and fine-tune the product’s effectiveness and help ensure that SPS can accurately document energy efficiency savings for credit. This M&V approach establishes a test group that receives energy feedback and a separate control group that does not, enabling us to gather information on how consumers change the following behaviors:
• Energy usage; and • Incremental participation in other energy efficiency products.
Opower’s M&V methodology is consistent with the enhanced level of rigor required for direct impact evaluation by the California Public Utility Commission’s Energy Efficiency Evaluation Impact Evaluation Protocols, the National Action Plan for Energy Efficiency, and the American Council for an Energy Efficient Economy (“ACEEE”). SPS follows industry-accepted testing methodologies, detailed below, to minimize statistical anomalies. Independent studies by Yale University, ACEEE, and Summit Blue Consulting (now Navigant Consulting) have verified the methodology and results. Figure 1 below illustrates the M&V methodology. SPS will work with the Commission’s Independent Program Evaluator (“Evaluator”) to validate the methodologies used to determine energy savings resulting from the Energy Feedback Pilot. Currently, SPS is discussing how to report the savings associated with the pilot towards the statutory goals. At this time, the Evaluator has suggested that SPS count the energy savings as a one-year life applicable to 2014. Figu re 1: M & V M etho dology
1. Setup Tes t and C ontrol: D ivide ta rgeted population into tw o statis tically equivalent groups. 2 . Ver ify G roup s: V erify no his torical difference in usage betw een test and control groups . 3 . Dep loy Prod uct: Send reports to test group only, no action taken w ith control group. 4 . M eas ure Imp act: Compare a verage energy use pre- and post-reports for both groups .
34 34
To compare the results of the control group with those participants who receive energy feedback, Opower will use the following equation: Electric - kWh saved (test group) = kWh used (control group) – kWh used (test group) – kWh saved by rebated equipment (product participation) for the same time period and same customers. Demand reduction in kW will also be determined based on system peak demand, residential load curves, and participant demand data.
e. Cost Effectiveness Tests
See Appendix A for the 2014 Energy Feedback Pilot program benefit-cost analyses and Appendix B for the forecast planning assumptions. The planning assumptions are based on the actual savings percentages achieved for the pilot in 2012.
2. Evaporative Cooling Rebates
a. Program Description The Evaporative Cooling Rebate program provides a cash rebate to SPS customers who purchase evaporative cooling equipment for residential use. This program strives to increase energy efficiency in residential homes by encouraging consumers to purchase evaporative coolers rather than central air conditioning. Because not all local retailers and contractors stock high efficiency evaporative cooling units, the overall goals of the 2014 program are to educate customers on the benefits of using an evaporative cooler and to encourage retailers and contractors to stock high efficiency units. We have offered rebates on two tiers of evaporative cooler units, “Standard System” (Tier 1) and “Premium System” (Tier 2). Rebates are now available only for Premium Systems, which include equipment with media saturation effectiveness of 85 percent or higher, remote thermostat control, and periodic purge water control. Only new, permanently installed direct, indirect, or two-stage evaporative cooling units qualify for the program. Customers must select their model from the pre-qualified equipment list. Portable coolers or systems with vapor compression backup are not eligible, nor are used or reconditioned equipment.
Budget The budget for the Evaporative Cooling Rebate program is based on historical experience and the participation goal for 2014. The majority of the funds will go toward customer rebates, contractor/retailer incentives, and program promotions. Evaporative Cooling promotions include: an advertising campaign, retailer in-store signage, program applications, educational information about Tier 2 such as brochures for customers and contractors, bill inserts/onserts along with update articles, and possible contractor training if needed.
35 35
Changes for 2014 The Evaporative Cooling program has discontinued rebates for Standard System (formerly known as Tier 1) evaporative coolers per recommendations from evaluation of the product. SPS will coordinate marketing efforts and additional education on Premium System (Tier 2) products and will simplify language around the system terms eligible for rebate.
b. Program Administration SPS will administer the Evaporative Cooling program internally. Customers will purchase the qualifying equipment and have it installed by the contractor of their choice. SPS will maintain a list of preferred vendors who will assist the customer to determine eligible equipment, complete rebate applications, and answer technical questions.
c. Marketing and Outreach Plan
The Evaporative Cooling program will include the following strategic marketing efforts:
• advertising through local radio, print, and internet ads have historically yielded increased awareness and participation in the mid-summer;
• contractor/retailer incentives to increase contractor support of the program; • customer e-mail newsletters; • bill inserts/onserts during the cooling season; and • contractor packets to all contractors in the SPS New Mexico area detailing the
program and its benefits. SPS will target local dealers and retailers in SPS’s New Mexico service area to receive program literature and promote the program. Retailers and Trade Partners in New Mexico will be an essential part of customer awareness efforts and will receive information on program changes regularly.
d. Measurement & Verification Plan
Since this program has been the subject of M&V in the past, and due to the relatively small size, the independent evaluator will not perform M&V on the program.
e. Cost Effectiveness Tests
See Appendix A for the 2014 program benefit-cost analyses and Appendix B for the forecast planning assumptions.
36 36
3. Home Energy Services (Residential and Low-Income)
a. Program Description The Home Energy Services offering will be provided to both residential and low-income customers with differing requirements and parameters for each customer group. The following sections describe these requirements by group. The Home Energy Services program provides incentives to Energy Efficiency Service Providers (“EESPs” or “contractors”) for the installation of a range of upgrades that save energy and reduce costs for existing residential and low-income households. Qualifying residential customers can receive any combination of attic insulation, air infiltration reduction, duct leakage repairs, radiant barriers, energy efficient showerheads, programmable thermostats, evaporative cooling, air source heat pumps, and high efficiency central air conditioners with a quality installation. The air conditioner quality installation process is based on standards developed by the Air Conditioning Contractors of America which define the steps a contractor must take to ensure that customer’s equipment is installed appropriately to achieve energy savings and proper operation. The Quality Installation process requires a load calculation to determine proper size of the equipment to be installed, which helps ensure that the total energy savings potential of newly installed A/C equipment is realized. SPS is focused on four quality installation elements:
• load calculation and equipment sizing; • refrigeration charging, testing, and performance; • air flow testing, adjustment, and performance; and • duct sealing and repairs where feasible.
SPS also requires contractors to have at least one North American Technician Excellence certified technician on staff. The Low-Income product is designed similarly to the Residential Home Energy Services product and is frequently referred to as Low-Income Home Energy Services. Income-qualified customers will receive attic insulation, air infiltration reduction, duct leakage repairs, showerheads, evaporative cooling, CFLs, refrigerator upgrades, radiant barriers, and thermostats at reduced cost. The primary objective of this program is to achieve cost-effective reductions in energy consumption in residential homes. Additional objectives of the program are to:
• encourage private sector delivery of energy efficiency products and services; • utilize a whole-house approach to upgrade efficiently; and • significantly reduce barriers to participation by streamlining program procedures
and M&V requirements.

37 37
SPS will partner with qualifying EESPs to deliver these services. EESPs must apply to the program and be approved in order to participate. SPS will require EESPs to receive pre-approval for targeted multi-family sites prior to installation of any energy efficiency measures for which an incentive will be requested. Note that the Home Energy Services offering will be provided to both residential and low-income customers. The low-income offering will use the same qualified contractors and offer similar services as the residential offering.
Budget In 2014, the Residential and Low-Income Home Energy Services budgets will be combined, as they were in 2013, specified in the 2012 Stipulation and adopted in Case No. 11-00400-UT. Incentives are paid based on deemed energy savings that have been adjusted down on a per measure basis as a result of ADM’s recommendations. The budget is primarily calculated by reviewing historical costs per participant and applying those costs to the estimated 2014 participants. Participation rates were determined by considering a feasible number of energy efficiency projects and the most likely measures to be installed during the year. To estimate the number of projects for 2014, historical participation from 2011 and 2012 and feedback from the contractors were used. The Home Energy Services program devotes over 50 percent of its budget to contractor incentives and third-party administration, another 30 percent to customer incentives and the remainder to administrative activities such as measurement and verification, data capture and analysis, processing for rebates, and communications/promotions.
Changes for 2014 In 2013, SPS found that there were significant barriers to participation in the Low-Income HES program. Specifically, there was reluctance by contractors to request and secure personal information relating to a customer’s income level. This resulted in contractors opting against program participation and resulted in no direct participation during the first half of 2013.4 To remedy this, SPS is seeking to contract with a state agency that has the necessary access to customer records and can verify income status when necessary. In addition, SPS proposes to reduce the reporting burden by changing the methodology for qualification as a low-income participant in 2014. Currently, potential participants are required to provide a copy of documentation that certifies the type of qualification a participant selects. As the current self-certification form states, documentation may include a copy of food stamp eligibility, a current paycheck stub, or the first page of a tax return. SPS has and will continue to review its risk assessment and mitigation strategies and leverage experience from the SPS Texas jurisdiction in order to reduce the chance of inaccurate self-certification. 4 SPS does not believe this means that no low-income customer participated in the program, only that they were not reported as such. SPS expects that low-income participants were recorded as standard Residential HES participants due to lack of documentation.
38 38
Reducing the participant’s burden of reporting will not be the only steps SPS may undertake with respect to the Low-Income HES program. SPS will also conduct a full evaluation of other utilities’ low-income offerings to determine if there are potential programs that could fulfill unmet needs. If SPS identifies any potential programs, it will meet with stakeholders to refine its program design and bring a final proposal forward for Commission approval.
b. Program Administration
Incentives are paid to contractors on the basis of deemed savings per measure performed. SPS will pay the approved EESPs an incentive for installing approved efficiency measures in customer homes. To determine the total rebate, each project will be evaluated individually based on the efficiency measures incorporated and the summer demand and annual energy savings achieved. Applications for payment after measure installation must describe: the EESP; the scope and location of work; the number and type of measures installed; the time period for completion of work; the payment requested; and the energy demand and consumption savings expected by the installed measures. Some of the measures offered in the Home Energy Services program are also rebated through other programs in SPS’s portfolio. In these cases, SPS will offer a standardized rebate for that measure regardless of the program through which it comes. SPS will administer the Home Energy Services program and will contract with third-party EESPs to perform all marketing and installations for this program. SPS will hold a series of workshops and contact experienced contractors to explain the program, its process, and participation requirements. In order to be approved as a certified EESP, each contractor will be required to demonstrate a commitment to fulfilling program objectives and a competency in completing the proposed project. To do so, EESPs will be required to submit the following information as part of the application process:
• a description of the EESP’s business, including relevant experience, areas of expertise, and references;
• a work plan that covers the design, implementation, project schedule, operation, and management of the project, including M&V of the project (the amount of detail required in this work plan will vary with project size);
• evidence of credit rating; • proof of applicable insurance, licenses, and permits; • a valid New Mexico Contractor’s License (GB-2, or GB-98); • a New Mexico tax number; • a valid New Mexico business license; and • SPS-approved certification for at least one person on each work crew.
39 39
c. Marketing and Outreach Plan
Historically, all marketing and promotion has been the responsibility of the third-party contractors participating in the program. SPS will rely on the approved contractors to market the program to individual customers. Additionally, SPS will conduct outreach for the program sponsors through a variety of marketing methods, including brochures, workshops, advertising, bill inserts, and other appropriate means. When and if possible, SPS will also contact and coordinate with community agencies such as the New Mexico Mortgage Finance Authority or Prosperity Works for the low-income portion of the program. Due to the reduction in participation over the past two years, SPS will initiate a marketing plan to supplement the contractor advertising and utilize radio, newspaper, direct seminars, and co-op advertising in an effort to increase customer participation
d. Measurement & Verification Plan
Auditing will be performed by Energy Matters LLC of Albuquerque prior to payment of contractor invoices to ensure that the Home Energy Services’ contractors are performing the work they invoice and that the work is done correctly. The Evaluator will perform M&V on the program in 2014. The savings for this prescriptive program will be calculated using deemed savings algorithms provided directly to the Evaluator. The Evaluator reviews the technical assumptions, decides on M&V methods appropriate for each program or prescriptive measure, and makes recommendations to changes in technical assumptions based on review and M&V.
e. Cost Effectiveness Tests See Appendix A for the 2014 Home Energy Services program benefit-cost analyses and Appendix B for the forecast planning assumptions.
4. Home Lighting & Recycling a. Program Description
The Home Lighting & Recycling program provides resources for customers to purchase energy efficient light bulbs and dispose of them in an environmentally friendly manner. Energy efficient light bulbs are an economical and easy way for customers to save electricity. Through this program, customers may purchase compact fluorescent light (“CFL”) and light emitting diode (“LED”) bulbs at a discount at participating retailers. To encourage proper disposal of CFLs, SPS also provides recycling services. Customers may recycle CFLs free of charge at local Ace Hardware stores.
40 40
SPS promotes energy efficient lighting by offering in-store retail discount promotions. In these promotions, the bulb manufacturer, retailer, and SPS combine funds to offer instant rebates on a variety of bulb models enabling customers to purchase discounted CFLs and LEDs. CFLs are priced starting at a dollar each. LEDs are discounted by up to $10.00. SPS partners with retailers including Home Depot, Walmart, Ace Hardware, and Albertson’s. Customers receive the discounted price at the register at the time of the purchase. There is no mail-in rebate form. Bulb Recycling The CFL Recycling component provides an environmentally friendly method for customers to dispose of CFLs. SPS created a partnership with Ace Hardware to serve as the retail arm for CFL recycling. Customers can bring spent CFLs to any Ace Hardware store and recycle them free of charge. The retailer stores the bulbs in a covered bin until it is full and ships the bulbs to the recycler in the postage paid bin. SPS covers the cost to ship and recycle the bulbs. The retailer calls to ask for a replacement bin to be shipped. Currently, there is no known health risk associated with LED disposal. Therefore, SPS will not offer LED recycling at this time. Budget The goal for this program was developed by reviewing market potential and logistics, including an analysis of historical sales data, retail store chains, and local promotional opportunities. This in turn helps in determining estimated costs for budget development. The Home Lighting budget has increased because LED bulbs are projected to make up a larger percentage of the lighting portfolio. LED bulbs have higher incentives and require more marketing and education to increase sales. The Home Lighting & Recycling program budget is based primarily on the number of program participants (bulbs sold). SPS developed the budget by combining costs for incentives, implementation, advertising, promotion, and labor. The advertising costs will be spent on TV, radio, online, and print advertising. Changes in 2014 The Energy Independence and Security Act (“EISA”) of 2007 required the phase-out of the production of incandescent bulbs and a myriad of specialty incandescent bulbs over a three-year period. The legislation required manufacturers to increase the efficiency of these bulbs by 30 percent while maintaining current lumen levels. This transition period began on January 1, 2012 and will be completed in 2014. The new lighting standards are shown in the chart below.
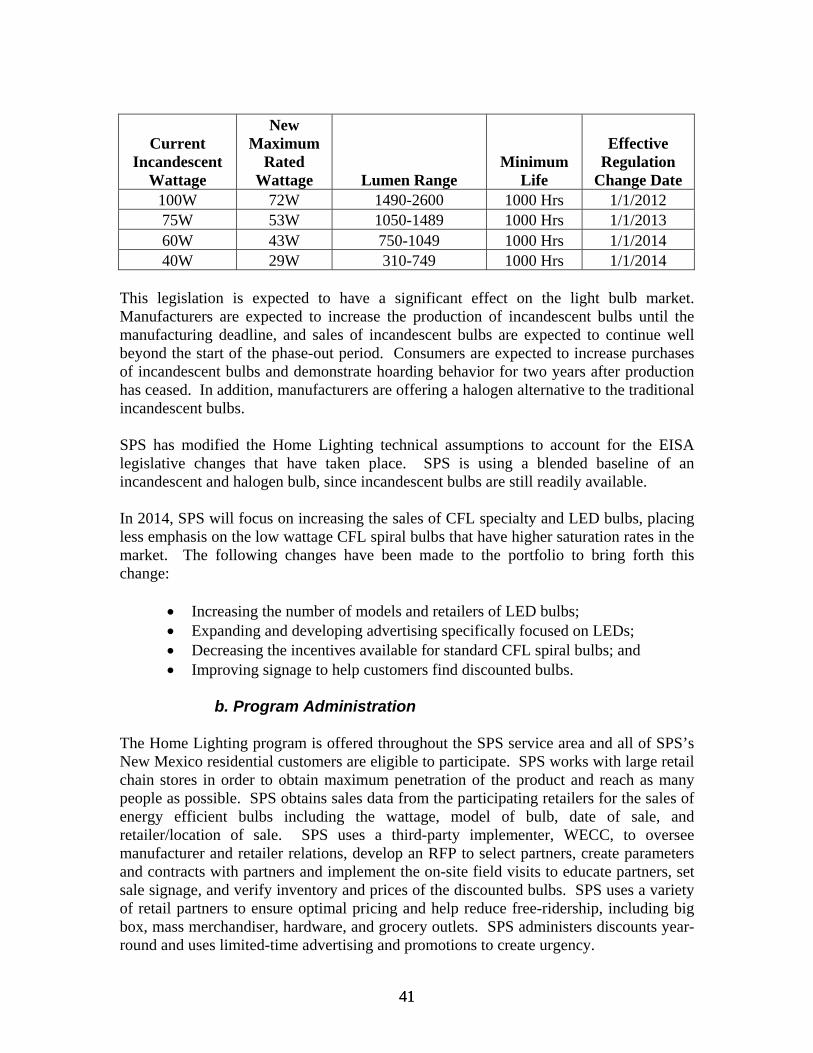
41 41
Current Incandescent
Wattage
New Maximum
Rated Wattage Lumen Range
Minimum Life
Effective Regulation
Change Date 100W 72W 1490-2600 1000 Hrs 1/1/2012 75W 53W 1050-1489 1000 Hrs 1/1/2013 60W 43W 750-1049 1000 Hrs 1/1/2014 40W 29W 310-749 1000 Hrs 1/1/2014
This legislation is expected to have a significant effect on the light bulb market. Manufacturers are expected to increase the production of incandescent bulbs until the manufacturing deadline, and sales of incandescent bulbs are expected to continue well beyond the start of the phase-out period. Consumers are expected to increase purchases of incandescent bulbs and demonstrate hoarding behavior for two years after production has ceased. In addition, manufacturers are offering a halogen alternative to the traditional incandescent bulbs. SPS has modified the Home Lighting technical assumptions to account for the EISA legislative changes that have taken place. SPS is using a blended baseline of an incandescent and halogen bulb, since incandescent bulbs are still readily available. In 2014, SPS will focus on increasing the sales of CFL specialty and LED bulbs, placing less emphasis on the low wattage CFL spiral bulbs that have higher saturation rates in the market. The following changes have been made to the portfolio to bring forth this change:
• Increasing the number of models and retailers of LED bulbs; • Expanding and developing advertising specifically focused on LEDs; • Decreasing the incentives available for standard CFL spiral bulbs; and • Improving signage to help customers find discounted bulbs.
b. Program Administration
The Home Lighting program is offered throughout the SPS service area and all of SPS’s New Mexico residential customers are eligible to participate. SPS works with large retail chain stores in order to obtain maximum penetration of the product and reach as many people as possible. SPS obtains sales data from the participating retailers for the sales of energy efficient bulbs including the wattage, model of bulb, date of sale, and retailer/location of sale. SPS uses a third-party implementer, WECC, to oversee manufacturer and retailer relations, develop an RFP to select partners, create parameters and contracts with partners and implement the on-site field visits to educate partners, set sale signage, and verify inventory and prices of the discounted bulbs. SPS uses a variety of retail partners to ensure optimal pricing and help reduce free-ridership, including big box, mass merchandiser, hardware, and grocery outlets. SPS administers discounts year-round and uses limited-time advertising and promotions to create urgency.

42 42
c. Marketing and Outreach Plan
The objectives of the Home Lighting & Recycling program are to: motivate customers to purchase CFLs and LEDs; persuade them to try using the bulbs in different applications throughout their homes; and encourage them to recycle the CFL bulbs when they burn out. SPS uses discount incentives to motivate customers to purchase bulbs. The value of the incentive varies by the type and cost of the bulb. The discounted bulbs are available at participating retailers. Customers can find a listing of participating retailers, locations and the bulbs that are discounted on the Xcel Energy website. Xcel Energy creates awareness of the program and drives customers to the retailers and/or website with television, radio, print, point-of-purchase display, outdoor bill boards, and online advertising. SPS also uses local consumer events and promotions to distribute free CFLs.
d. Measurement & Verification Plan
The energy savings for this prescriptive program will be calculated using deemed savings algorithms provided directly to the Evaluator. The Evaluator will review the technical assumptions, apply M&V methods appropriate for the program, and make recommendations for change based on their technical review.
e. Cost-Effectiveness Tests See Appendix A for the 2014 program benefit-cost analyses and Appendix B for the forecast planning assumptions.
5. Refrigerator Recycling a. Program Description
The Refrigerator Recycling program is designed to decrease the number of inefficient refrigerators and freezers in residential households. The objective of the program is to reduce energy usage by allowing customers to dispose of their operable, inefficient primary refrigerators, secondary refrigerators, and freezer units in an environmentally safe and compliant manner. Customers with qualifying units will receive a rebate for their participation and will not be directly responsible for any costs associated with pick-up, transportation, disposal, or proper recycling of their refrigerator. Qualifying Appliances: All refrigerator/freezer units must meet the following requirements in order to participate in the program and be picked up for recycling:
43 43
• Must be an operational primary or secondary refrigerator unit or a standalone freezer. Operational is defined as in working order. Refrigerators and freezers must be capable of freezing water.
• Refrigerator/Freezer must be plugged in the night before the pick-up date (customer will receive a call from the vendor, reminding them to do this). This is to ensure full operation when inspected at the time of pick up; and
• Appliances must be no smaller than 10 cubic feet or no larger than 30 cubic feet. Appliances will be categorized as follows for program reporting:
• Primary: used as the primary unit in the home at present time; • Secondary: used as a secondary unit for at least two months prior to pick up; • Freezer: used separately from the primary refrigerator and is a standalone unit.
There will be a limit of two freezers and/or refrigerators per household. Customers will be limited to a maximum rebate of $100 in a given program year per household. Budget The Refrigerator Recycling program budget was developed based on our participation goals. Recycling-related expenditures and rebates account for approximately 60 percent of the overall budget. Marketing and labor expenses were then determined and added as administrative expenses. Changes for 2014 SPS will reduce the rebate amount from $75/unit to $50/unit in 2014 in order to remain cost-effective under the UCT.
b. Program Administration SPS will administer the Refrigerator Recycling program internally with the assistance of the third-party contractor, Appliance Recycling Centers of America (“ARCA”). ARCA will be responsible for receiving and processing customer requests. Marketing messages will direct customers to contact the third-party provider via a toll-free telephone number or online request form. ARCA will dispatch personnel, who have passed Xcel Energy’s security screening process, to pick up the refrigerator. Customers will be scheduled for pick-up within 30 days of initial call, or whenever the customer’s schedule time allows and will receive their rebate check within four to six weeks after the unit is picked up. ARCA will conduct tracking and reporting for this program, which is provided to the Evaluator that includes the following:
• Weekly reports that identify program participation; • Model and serial numbers for all recycled units; • Participant information such as name, address, phone, and customer account
number; • Total number of units collected or rejected by address;
44 44
• Data on rejected participants; and • Provide any required reporting set forth by any federal, state or local applicable
regulatory agency.
c. Marketing and Outreach Plan Customers will learn about this program through various marketing channels such as bill inserts/onserts, update newsletters to customers, direct mail, Xcel Energy’s website, and/or local print media. The program will be available to customers year-round; however, the marketing strategy will utilize spring and fall campaigns to promote the program. The target market consists of customers who are disposing of their primary or secondary refrigerator, or freezer unit. Customer interest in this type of product is seasonal, usually occurring in the spring, summer, and early fall seasons (prior to the Thanksgiving holiday). Product demand peaks in the summer months, which is associated with customer home improvement projects. Deployment of our promotional tactics will coincide with seasonal interest. SPS will incorporate social marketing to identify potential participants and thereby drive program activity. In addition, SPS will cross-promote the benefits of recycling with the Consumer Education program.
d. Measurement & Verification Plan The third-party contractor, ARCA, is contracted to perform M&V on this program. In addition, ARCA’s technical services department is responsible for verifying that transporters of regulated waste are in compliance with federal, state, and local regulations pertaining to their business. ARCA’s quality assurance process for these vendors includes internal audits performed by ARCA to verify that the subcontractors for transportation of regulated waste are in adherence to regulations.
e. Cost-Effectiveness Tests See Appendix A for the 2014 program benefit-cost analyses and Appendix B for the forecasted planning assumptions. SPS will reduce the rebate amount for the Refrigerator Recycling program from $75/unit to $50/unit in order to remain cost-effective under the UCT. This change will also make SPS more consistent with other utilities and the other jurisdictions where the program is offered.
6. Residential Saver’s Switch® a. Program Description
Saver’s Switch is a demand response program that offers bill credits as an incentive for residential customers to allow SPS to control operation of their central air conditioners and electric water heaters on days when the system is approaching its peak. This program is generally utilized on hot summer days when SPS’s load is expected to reach near-peak capacity. Saver’s Switch helps reduce the impact of escalating demand and price for peak electricity.

45 45
The program employs switches that receive a control signal to interrupt air conditioner compressors and electric water heaters during peak periods, typically in the afternoons on weekdays. When the program is activated, participating air conditioners are cycled off and on in 15 to 20-minute intervals determined by “adaptive algorithm” cycling strategy for the duration of the control period, usually three to five hours. This strategy allows the switches to “learn” how a customer’s air conditioner is being operated in order to achieve a 50 percent reduction in load. For enrolled electric water heaters, the entire load is shed for the duration of the control period. Due to the limitations of available communications technologies in the area, Saver’s Switch is currently only available to customers in Roswell, Carlsbad, Clovis, Hobbs, Portales, and Artesia. Budget The primary costs associated with operating the Saver’s Switch program are driven by the number of expected participants, and include:
• The cost of switches; • The cost of installations; • Marketing expenses; • M&V expenses for evaluating program performance; and • Rebates to participating customers.
Relative to other programs offered in New Mexico, Saver’s Switch expenses for monitoring are quite significant. Monitoring is conducted by installing data loggers at a sampling of customer premises. The loggers measure air conditioning activity over the course of the cooling season. Data gathered is used to determine the load impact from activating Saver’s Switches. Installing and retrieving the loggers entails multiple visits to the customer premise. The cost is largely independent of the number of program participants. Although the program is relatively small, this activity accounts for a significant portion of the overall budget. The Evaluator will use this data to verify the savings generated by the program. The internal administration portion of the budget accounts for roughly 46 percent and is primarily driven by the cost of the switches and the monitoring. The installation of the switches is accounted for in the Third-Party Delivery budget category.
Changes for 2014 None.
b. Program Administration The Residential Saver’s Switch program is promoted to customers using a variety of channels. Customers may sign up for the program via a mail-in form, phone, or the Xcel Energy website. Applications are generally processed and switches installed within six to eight weeks.
46 46
A contracted third party handles equipment installation, removal, and associated service calls. Due to variations in air conditioner age and location, the installer will make the final on-site determination as to whether the customer qualifies for the program. The Saver’s Switch program has the following additional requirements:
• The program does not offer customers the choice of opting out of individual control days. The one exception is in the case of medical emergencies where customers can be removed from the program on short notice.
• When a customer moves into a premise with a pre-existing switch, they are automatically enrolled in the program, but notified that they may opt-out.
Saver’s Switch can be activated at the request of SPS’s Commercial Operations or Transmission Operations under the following conditions:
• Commercial Operations will activate Saver’s Switch along with other load management programs in order to maintain reserves on the system above 200 megawatts (“MW”).
• SPS will consider activating the program when obligation loads are high (above 4,400 MW), or if the forecasted reserves fall below 200 MW. This would likely be during periods with temperatures above 100 degrees or when large SPS-owned generation units are off line.
• SPS’s Transmission Operations would also expect to request program activation if a Load Serving Entity in the SPS Balancing Authority5 is at North American Electric Reliability Corporation Energy Emergency Alert Level 2.
Activation of load management programs would take place prior to, or concurrent with, public appeals for conservation to reduce load to relieve a local transmission overload or unacceptably low transmission voltage. SPS is sensitive to the fact that participants in Saver’s Switch may leave the program if they deem it overused. SPS will make every attempt to avoid activating the program multiple days in a row.
c. Marketing and Outreach Plan SPS estimates that about 62,000 residential customers in New Mexico have central air conditioning. Where possible, SPS will direct its promotional efforts towards those customers identified as likely to have central air conditioning. SPS may use the following marketing channels to promote participation:
• Bill inserts and newsletters to customers; • Direct mail, including e-mail marketing; and • Outbound telemarketing.
5 A Balancing Authority is the responsible entity that integrates resource plans ahead of time, maintains load-interchange-generation balance within a Balancing Authority area, and supports interconnection frequency in real-time.

47 47
In addition, SPS will consider offering an up-front incentive to new participants, depending on customer interest.
d. Measurement & Verification Plan
The savings for this prescriptive program will be calculated using deemed savings algorithms based on data collected through SPS’s load research department. Upon completion of field research, the raw data and tabulated results will be provided to the Evaluator for their input and final determination of estimated load relief. In addition, SPS’s load research organization will lead an annual research project to evaluate the load relief achieved from existing and new Saver’s Switch units. SPS uses third parties specializing in load research projects to collect and analyze the data. A sample of each type of switch is included in the annual research project. This is done with a data logger installed on-site to monitor an air conditioner’s energy use and how that use changes on a control day. The results are used to document the extent of load relief achieved during a control day.
e. Cost-Effectiveness Tests See Appendix A for program benefit-cost analyses and Appendix B for the forecasted planning assumptions.
7. School Education Kits a. Program Description
School Education Kits is a turnkey educational program that combines energy efficiency curriculum for teachers with easy-to-install energy efficient and water-saving measures for students to install at home. SPS intends to reach fifth grade students in its New Mexico service area with this annual program. In 2014, the School Education Kits program will provide the following classroom materials to each student participant:
• CFL (13 Watt – 60 Watt Equivalent); • CFL (18 Watt – 75 Watt Equivalent); • High efficiency showerhead (1.5 gpm); • Kitchen aerator (1.5 gpm); • Furnace air filter alarm; • LED night light; • Digital water/air thermometer; • Toilet leak detector tablets; • Mini tape measure; and • Parent evaluation card

48 48
The program provides direct-impact conservation as part of an education program, building awareness of energy conservation in children, and providing energy efficiency programs to customers of all income levels. Budget The School Education Kits budget was developed based on SPS’s participation goals and historical budgets. About 67 percent of the School Education Kits program budget will be paid to the third-party contractor for administration of the program. The remainder of the budget is designated for the cost of the kits, as well as internal labor to provide direction and oversight to the implementer, prepare and analyze data for reporting, and manage program expenditures. The School Education Kits program does not pay a rebate, but rather provides free energy efficiency curriculum and activity kits to participating classrooms. Identified incentive dollars are the estimated value of the measures of the kit. Changes for 2014 None.
b. Program Administration The program will be marketed and administered by a third-party contractor. The third-party contractor assumes all responsibility for curriculum and kit development, outreach to teachers, delivery of materials, and participant survey. SPS pays a flat rate per kit to cover all of the services. In addition, the third-party contractor will perform pre- and post-surveys to provide installation data on the program. These surveys will:
• Confirm installation of energy and water saving devices. These results will be used, along with deemed savings estimates, to determine the demand and energy savings from the kits based on students and teacher responses identifying the number of CFLs, low-flow showerheads, and faucet aerators that were installed, and;
• Identify each student’s electricity provider.
c. Marketing and Outreach Plan The third-party contractor will manage all aspects of the School Education Kits program marketing and outreach activities. They will identify the schools that are within SPS’s New Mexico service area and determine the approximate number of eligible teachers and students. They will send out customized marketing materials to help enroll the classrooms. The materials explain the program, while providing teachers with helpful tips to teach the energy efficiency curriculum to their students. Kits will also provide teachers with information about how and why SPS sponsors this program offering and the importance of conservation as part of their curriculum. As in the past, SPS and the
49 49
third-party contractor will continue to work together to determine the strategic approach for identifying schools.
d. Measurement & Verification Plan Since this program has been the subject of M&V in previous program years (2008-2010) and due to its relatively small size, the Evaluator will not perform M&V on the program in 2014.
e. Cost-Effectiveness Tests See Appendix A for the 2014 benefit-cost analyses and Appendix B for the forecasted planning assumptions.
B. Business Segment SPS has nearly 20,000 commercial, industrial, and agricultural customers in its Business Segment in New Mexico. This customer group consumes a substantial share of the total energy in the service area, and, as such, represents much of the energy efficiency and load management potential for the region. SPS encourages business customers to reduce their energy use, offset energy peaks, and minimize environmental impacts through a variety of programs, offering prescriptive rebates, customized programs, and study-funding. Despite these efforts, SPS business customers experience a number of barriers to participation, including:
• Business customers often have little or no capital to invest in projects; • Business customers require very short payback periods for their projects; and • Typical projects have very long lead times.
To combat these barriers, SPS’s Account Managers, trade allies, EESPs, and Energy Efficiency Specialists (“EES”) are trained to address the specific needs of business customers. SPS commonly assigns an Account Manager to its larger, more complex customers. EES (phone-based account managers) serve the mid-market and small business customers, prospect for and promote savings opportunities, and manage the application and project completion process. Awareness-building communication campaigns, community and trade outreach, site visits, and electronic communications are also key components of the strategy to penetrate our market.
1. Business Comprehensive
a. Program Description Business Comprehensive is the bundling of traditional prescriptive, custom, and study/implementation products to provide customers with less complexity as they evaluate participation in SPS programs. This program includes the Computer Efficiency,
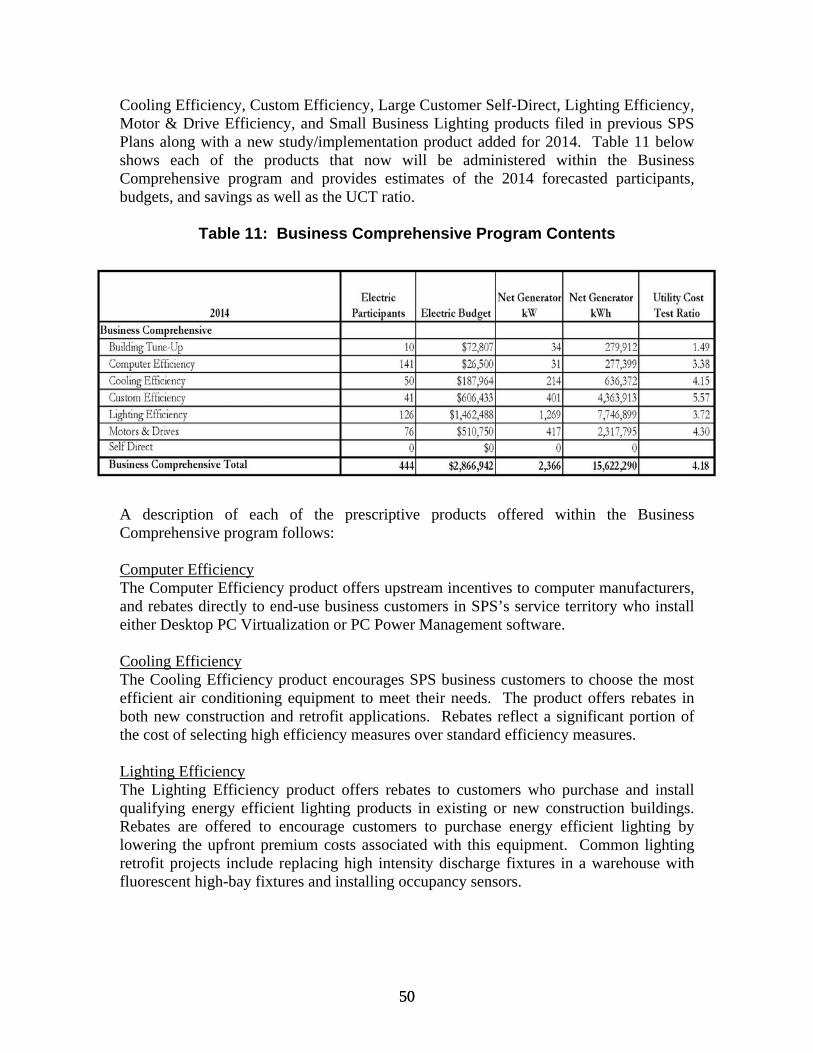
50 50
Cooling Efficiency, Custom Efficiency, Large Customer Self-Direct, Lighting Efficiency, Motor & Drive Efficiency, and Small Business Lighting products filed in previous SPS Plans along with a new study/implementation product added for 2014. Table 11 below shows each of the products that now will be administered within the Business Comprehensive program and provides estimates of the 2014 forecasted participants, budgets, and savings as well as the UCT ratio.
Table 11: Business Comprehensive Program Contents
A description of each of the prescriptive products offered within the Business Comprehensive program follows: Computer Efficiency The Computer Efficiency product offers upstream incentives to computer manufacturers, and rebates directly to end-use business customers in SPS’s service territory who install either Desktop PC Virtualization or PC Power Management software. Cooling Efficiency The Cooling Efficiency product encourages SPS business customers to choose the most efficient air conditioning equipment to meet their needs. The product offers rebates in both new construction and retrofit applications. Rebates reflect a significant portion of the cost of selecting high efficiency measures over standard efficiency measures. Lighting Efficiency The Lighting Efficiency product offers rebates to customers who purchase and install qualifying energy efficient lighting products in existing or new construction buildings. Rebates are offered to encourage customers to purchase energy efficient lighting by lowering the upfront premium costs associated with this equipment. Common lighting retrofit projects include replacing high intensity discharge fixtures in a warehouse with fluorescent high-bay fixtures and installing occupancy sensors.
51 51
Motor & Drive Efficiency The Motor & Drive Efficiency product is designed to reduce the barriers that prevent customers from purchasing high efficiency motors, variable frequency drives (“VFDs”), or motor controls. To overcome these barriers, SPS offers rebates to customers who install:
• National Electrical Manufacturers Association (“NEMA”) Premium Efficiency® motors, as upgrades to existing, operational motors;
• Motors that exceed NEMA Premium Efficiency® standards; • VFDs to vary the speed of motors; • Motor controllers to reduce the energy consumption of motors that must operate
at a constant speed; • Pump-Off Controllers on oil wells; or • Energy efficient compressed air equipment.
A description of each of the custom products offered within the Business Comprehensive program follows: Custom Efficiency The Custom Efficiency product is designed to provide SPS’s business customers rebates on a wide variety of unique or unusual equipment and process improvements that are not covered by the prescriptive products, including combined heat and power (“CHP”) projects.6 Rebates may be offered for measures that exceed standard efficiency options. The rebate is intended to reduce the incremental project cost of the higher efficiency option, thereby encouraging customers to choose the more energy efficient option. Since energy applications and building system complexity can vary greatly by customer type, it is important for customers to have a customized energy efficiency option to help them implement cost-effective energy efficiency measures. The Custom Efficiency product includes an evaluation component in order to introduce large commercial and industrial customers to energy efficiency opportunities and build the product pipeline for future years. This component of the Custom Efficiency product is modeled after the Process Efficiency program that Xcel Energy offers in other jurisdictions, but differs in that it is available to large commercial and industrial customers instead of being limited to manufacturing customers. The goals of this component, called the Large C&I Study, are to:
• Increase customer awareness of energy consumption and opportunities to reduce consumption;
• Identify and develop specific conservation opportunities; • Drive customers to implement identified measures through existing prescriptive
and customized rebate programs; and
6 At this time, SPS does not have any active CHP projects in its pipeline; however, SPS has identified a potential CHP participant and will continue discussions with this customer and any other potential participants during the 2014 and 2015 program years.
52 52
• Drive customers to implement low capital and or short payback measures even though they may not qualify for an implementation rebate.
The Large C&I Study effort has several phases, which are customized and defined in a Memorandum of Understanding between SPS and each customer:
• Phase 1: Identification – Interested C&I customers will receive a free, one-day, on-site energy assessment performed by SPS staff and a contract vendor. At the end of the assessment, the customer will receive a detailed report identifying their energy consumption habits and conservation opportunities.
• Phase 2: Scoping – SPS will provide support and resources to further define and provide recommendations for energy savings opportunities identified in Phase 1. The customer will pay no more than $7,500 towards these efforts.
• Phase 3: Implementation – Implementation of measures scoped in Phase 2 will typically follow one of two paths:
o Customers implementing measures that qualify for rebates under one of the prescriptive rebate products (i.e., Lighting Efficiency, Motor & Drive Efficiency, etc.) or the Custom Efficiency Product will receive rebates in accordance with the appropriate product.
o Customers who implement measures scoped in Phase 2 that do not meet program/product requirements will not receive a rebate; however, SPS will count the energy and demand savings resulting from implementation.
SPS is targeting customers with aggregated annual consumption greater than 10 GWh for participation in the Large C&I Study. These C&I customers typically offer the largest potential conservation opportunities per study dollar spent. Account Managers will contact eligible customers and describe the product to solicit participation. Based on Xcel Energy’s experience with similar products, SPS expects project lifecycles to be greater than one year. Large Customer Self-Direct As an alternative to the guided process of the Custom Efficiency product, the Large Customer Self-Direct product is available to SPS customers with contiguous facilities that use over 7,000 MWh per year (“Large Customer”). These large customers account for 47 percent of the peak kW and 55 percent of the annual consumption of the entire commercial and industrial customer base, but only account for 0.2 percent of total commercial and industrial premises. Self-direct participants are also eligible for the other Business Segment programs. The Large Customer Self-Direct product entitles customers who use more than 7,000 MWh per year at a single, contiguous facility to apply for either:
• A bill credit of up to 70 percent of the energy efficiency tariff rider charges for approved incremental expenditures made towards cost-effective energy efficiency or load management; or
53 53
• An exemption of up to 70 percent of the energy efficiency tariff rider charges for 24 months if the customer demonstrates that it has exhausted all cost-effective energy efficiency or load management projects at its facility.
In this context, a project is cost-effective if it has a simple payback period of more than one year, but less than seven years. The Self-Direct option will be available to any SPS Large Customer. To claim a credit, the customer must submit to the Self-Direct Administrator an energy efficiency project description, along with relevant engineering studies showing the projected savings, expenditures, and cost effectiveness, by November 30 of the year preceding the installation of the project. To claim an exemption, the customer must submit to the Self-Direct Administrator a detailed engineering study showing the absence of cost-effective energy efficiency investments and an affidavit confirming the results of the engineering study from the Evaluator by November 30 of the year preceding the exemption. An energy efficiency project must reduce electric energy consumption or peak demand and be cost-effective in order to qualify for a credit. Large Customers will be able to receive the credit only after expenditures have been made, the project has been completed, and the Evaluator has determined that the efficiency measures are properly installed and are able to deliver the expected energy or peak demand savings. For projects that take more than one year to complete, annual credits for operating energy efficiency measures will be determined by the Evaluator. Eligible expenses incurred in excess of $52,500 in any year may be recovered in the subsequent year. Eligible expenses are actual expenses reasonably incurred by a Large Customer in connection with construction, installation, or implementation of an eligible project, including but not limited to, equipment costs, engineering and consulting expenses, and finance charges. Energy efficiency expenses are eligible only to the extent that incremental expenses are incurred to achieve energy efficiency levels that exceed industry standards as determined by the Evaluator based on practices set forth in 17.7.2.13.E NMAC. A description of the study product offered within the Business Comprehensive program follows: Building Tune-Up The Building Tune-Up product, new to the 2014 Plan, is a study/implementation option targeted to buildings smaller than 75,000 square feet. The study vendor, selected by SPS, will work through a checklist of measures focusing on the proper operation of existing equipment and complete fixes on-site as appropriate. The Building Tune-Up product is designed to assist smaller business customers to improve the efficiency of existing building operations by identifying existing functional systems that can be “tuned up” to run as efficiently as possible through low- or no-cost improvements.
54 54
Examples of typical Building Tune-Up measures include:7 • Calibration/tune-up of Energy Management System points; • Adjustment of outside air and return air dampers; • Resetting the chilled water and hot water supply temperatures; • Optimizing the start/stop of air handlers and makeup air units (early shutdown in
the evening, late start in the morning); • Resetting chiller condenser water temperature; and • Eliminating simultaneous heating and cooling.
Building Tune-Up consists of two phases: diagnosis (study) and implementation. SPS offers rebates for Building Tune-Up studies and the implementation of recommissioning measures. To ensure consistency with the studies and implementation of on-site fixes, SPS will hire a qualified engineering firm to complete both the study and implementation phases. Budget Budgets were developed based on the established goals. Rebates, labor, and promotional expenses comprise the majority of the budget.
• Incentives: The largest portion of the Business Comprehensive budget is dedicated to customer rebates, which will be paid based on the energy savings achieved. The rebate budget is an average of all the rebate amounts which have been tracked in previous years. Prescriptive rebates are based on both the kW saved and a reasonable but attractive percent of the incremental cost of higher efficiency. Custom rebates are based on the calculated savings of expected projects.
• Promotions: The promotional budget includes spending for print advertising, educational and sales materials, online advertising, and seminars for customers and the trade.
• Internal Administration: This was determined by estimating the number of full-time employees needed to manage the product and execute the marketing strategy, trade incentives, and engineering analysis and rebate processing, including internal employees and external consultants and/or contract labor. Approximately 45 percent of the internal administration budget is dedicated to the cost of conducting engineering analysis for custom projects to ensure energy savings are accurate and credible.
• M&V: The time and cost the Evaluator expends to verify energy savings, by in-person customer visits or post-project telephone surveys or metering.
7 At this time, SPS will not be offering gas measures like those proposed by PNM and EPE for inclusion in their Building Tune-Up programs. However, SPS may review these measures for potential addition in the future.
55 55
Changes for 2014 • SPS will add Building Tune-Up to the Business Comprehensive program and
discontinue the Business Education program in 2014.8 • Cooling Efficiency rebate levels for the lowest tier direct expansion measures
were increased for the 2014 Plan to encourage participation among this product group and to encourage manufacturers to supply more efficient products to the marketplace.
• In 2014, the Small Business Lighting program and Lighting Efficiency product will combine into one product within the Business Comprehensive program. The Small Business Lighting program has proven to be a successful program for SPS customers and will continue offering the same free lighting audits, current and new rebates, and simple one-stop services but for all SPS customers.
In addition, the program will add the following new measures:
• Cooling Efficiency: o Anti-Sweat Heater Controls o Evaporator Fan Motor Controls o Medium Temperature Refrigerated Case Replacement o No Heat Case Doors
• Lighting Efficiency
o ENERGY STAR Qualified Interior Commercial LED Retrofit Fixture (screw-in) Downlights, 25W or less
o Bi-Level Stairwell Fixtures with Integrated Sensors o Photocell o Lighting Optimization Lamp removal in T8 systems. Must include high
efficiency electronic ballasts. T12 and T8 systems both qualify as existing (removed) equipment.
o LED Wall Pack Fixtures – Exterior and Parking Garage o LED Parking Garage Low Bay Fixtures o High Efficiency Electronic Ballasts
b. Program Administration
Customers learn about the program and its benefits through newsletters, direct mail, trade allies, Account Managers, and EES. Applications for the program are available both on Xcel Energy’s website (xcelenergy.com) and from trade allies. Customers may apply for rebates by completing the application and providing a detailed invoice for the newly
8 The Business Education program, which has been included in SPS’s energy efficiency and load management offerings since 2011, was originally intended to help SPS better understand the operation of the oil and gas customer segment. By doing so, SPS intended to better inform its marketing and operational strategy for this segment. With the information that has been gathered from this research, SPS is now better prepared to market and operate its Custom Program in a way that is most beneficial to the oil and gas segment. With the application of this information, SPS is now confident it can cease this research effort.

56 56
installed efficient equipment. The equipment must be new and meet all the qualifications detailed on the application. After the customer has installed the equipment, the application and invoice must be submitted to SPS within 12 months of the invoice date. Once the paperwork is completed and submitted, rebate checks will be mailed to the customer within six to eight weeks. Participants in the program may submit their application to their Account Manager or an EES. The custom components of the Business Comprehensive program will be administered internally. The project review process involves the following steps:
1. Application – Prior to purchase and installation of equipment, customers must submit an application and receive pre-approval for their projects. The application form requests a description of the project, operating hours, and costs.
2. Pre-Approval – To qualify for a rebate, projects must be cost-effective using the UCT. Xcel Energy’s engineering team will review the proposal, specifically reviewing the project’s demand and energy savings relative to industry standards and the interactive energy effects of the system components. Non-energy benefits, such as maintenance savings and reduced water consumption, are considered in the analysis.
3. Pre-Approval Notification – Typically, within approximately ten business days after receiving the complete proposal information, SPS will determine whether or not the project qualifies and notifies the customer of the decision and the rebate amount (if project is pre-approved).
4. Implementation – Once the customer has received pre-approval, they may purchase and install their new energy efficient equipment or process improvement.
5. Post-Project Review & Payment of Rebate – Upon completion of the project, the customer must notify SPS. If the project has undergone any changes of scope or equipment, a second engineering analysis will be performed to determine whether the project still qualifies under the program guidelines and what level of rebate is owed.
The study components of the Business Comprehensive program will be administered through a third-party study provider. Customers will learn about the program and its benefits through newsletters, direct mail, trade allies, Account Managers, and EES. Applications for the program are available both on Xcel Energy’s website (xcelenergy.com) and from trade allies. Customers may apply for study rebates by completing the application and corresponding Building Tune-Up. Once the study is completed and paperwork submitted, rebate checks will be mailed to the customer within six to eight weeks. Participants in the program may submit their application to their Account Manager or an EES.
c. Marketing and Outreach Plan
The Business Comprehensive program creates a base level of awareness and knowledge in the marketplace through newsletters and direct mail to customers and trade allies.

57 57
These tactics make customers aware of the key benefits of energy efficiency and its applicability to their systems, and give the trade a platform from which to educate customers on high efficiency solutions for their particular applications. The program also provides tools for the customers and trade allies to evaluate rebates and incorporate them into purchase decisions. SPS Account Managers and EES will educate customers on specific energy efficiency opportunities, evaluate rebate potential, and assist in the rebate application process. The trade can find similar assistance through SPS’s Trade Relations Manager. In some cases, the trades may be offered a cash incentive to promote qualifying products. Marketing communications will revolve around the benefits of energy efficiency through paybacks, lifecycle costs, and environmental benefits. SPS aims to help its customers understand the benefits of cutting costs by choosing high efficiency equipment. Newer equipment is typically more efficient, more reliable, and may have more effective controls than older systems providing both energy and non-energy benefits to the end user. SPS will use the following methods to reach and educate customers and trade allies: Xcel Energy website (xcelenergy.com), collateral materials, direct mailings, Email campaigns, newsletters, and the Trade Relations Manger.
To reach its energy savings goal, SPS needs to continue to educate customers and increase awareness of the program offerings. It is also necessary to partner with the trade allies and position customer incentives as a tool to increase their sales volumes. Trade allies are one of SPS’s greatest assets in continuing to educate customers on the benefits of energy efficient equipment. SPS’s internal Account Managers and EES are also an essential part of assisting customers with program participation and understanding.
d. Measurement & Verification Plan The savings for the prescriptive products will be calculated using deemed savings algorithms, provided directly to the Evaluator. The Evaluator will review the deemed technical assumptions, decide on M&V methods per prescriptive product, and make recommendations regarding necessary changes to the technical assumptions for prescriptive measures. Custom project savings will be calculated individually per project. The Evaluator will review the engineering assumptions prior to the project being approved and establish an M&V plan specific to the project.
e. Cost-Effectiveness Tests See Appendix A for the 2014 Program benefit-cost analyses and Appendix B for the forecasted planning assumptions.
58 58
2. Interruptible Credit Option
a. Program Description
The Interruptible Credit Option (“ICO”) program will offer incentives to New Mexico business customers who allow SPS to interrupt their load during periods of high demand, such as hot summer days. In return, customers receive a monthly bill credit, which varies depending on how much load they are willing to interrupt and how far in advance they receive notification of the interruption. Interruption periods are triggered by capacity, contingency, and/or economic constraints. By participating in this program, ICO customers will help reduce the amount of electricity needed, which helps SPS meet electric system requirements at critical times. Customers may enroll or bid (depending on which contract option they choose) between January 1 and March 1 of each year. To qualify, customers must have an Interruptible Demand and a Contract Interruptible Load of at least 300 kW during the months of June, July, August, and September. To participate, customers must sign an ICO contract, which will specify the number of hours they contract to be interrupted each year, their advance notice option, and Contract Firm demand selected. The options include 40 hours, 80 hours, or 160 hours of annual interruption. Customers also have an advance notice interruption options of one-hour or no-notice. Customers must install a phone line that is connected to their meter, which allows SPS to provide near real-time usage information. Customers who select the no-notice option must pay for SPS to install equipment that will provide physical control over their interruptible load. There are two ICO contract terms offered: the three-year and summer only (“SOICO”) options. The three-year plan automatically renews for rolling three-year periods and requires a three-year written notice required to cancel participation in the program. Any time during the first year of service under this schedule, a customer may opt to cancel their contract by returning all monthly credits paid by SPS, up until the date of cancellation. No additional cost will be assessed. The SOICO option is available to customers in a summer only contract term which must be renewed each year and cannot be cancelled during the contract year. Another option offered to customers is the voluntary load reduction purchase option (“VLRPO”). This option provides SPS with an additional power purchase resource to more efficiently manage system requirements during exceptional periods. During such periods, New Mexico customers will have the opportunity to provide voluntary load reduction and receive pricing associated with energy supply markets. Use of this service will be limited to exceptional situations when enough lead time is available to reach agreement on specific terms with customers. SPS expects the use of this service will normally occur during summer periods of very high temperature and humidity conditions or during periods of significant and extended difficulties with regional generation or transmission systems.
59 59
This voluntary option is available to customers who agree to provide load reduction in amounts of 500 kW or greater. Customers under this option shall complete an enabling agreement with SPS to establish general terms for payment in return for voluntary load reductions. Availability is subject to SPS approval. Completion of the enabling agreement qualifies the customer to submit an offer to participate in any Buyback Period. The enabling agreement expedites the purchase process by leaving only specific terms to be determined before a specific Buyback Period. Customers that have an enabling agreement with SPS have the option, but are under no obligation, to offer to sell energy to SPS during any Buyback Period. Likewise, SPS has the option, but not the obligation, to accept any offer by the customer. If a customer is interested in selling energy to SPS, the enabling agreement provides the structure and procedures for establishing the price and quantity for a specific energy purchase by SPS. Budget The budget for this program was established based on the amount of contracted load and the number of hours of load SPS anticipates to receive in 2014. SPS is basing the customer and budget forecasts on experience gained from other business interruptible programs it has offered. The customer promotion budget includes the development of marketing materials such as customer ICO System Guides, program features, and benefits collateral. The budget also includes spending for annual training for both customers and SPS Account Managers. This annual training will ensure that all involved in the program are updated on the latest enhancements and revisions. The budget also includes system upgrades, maintenance, testing, and training associated with the technology needed to support the program. Customers in the ICO program do not receive a rebate. Instead, they will receive a monthly credit for the interruptible load they provide. The customer’s credit calculation is based on the lesser of their Contract Interruptible Load or their Interruptible Demand for each month. Credits vary by season and are higher in the summer months. Other factors that influence the Monthly Credit rate include the type of service the customer receives, the interrupt notice option they choose (1-hour or No-Notice), and the number of annual Interruptible Hours agreed to under contract (40, 80, or 160 hours per year). Customers in the SOICO program will receive a monthly credit (June through September) for the interruptible load they provide. Changes for 2014 SPS will closely monitor its ICO budget in 2014 and cap spending at $150,000. Although participation has been limited in past years, SPS is concerned that the program could very easily gain a few more participants, which could cause the budget to be overspent with little warning. While SPS believes the chance of this occurring is small, SPS believes it is best to take a conservative approach, capping total spending at this time and reserving the right to adjust budgets in the future should program participation increases be seen. By retaining this flexibility, SPS will be able to adjust underperforming budgets or shift funds from more efficiently performing programs to supplement the ICO program. Furthermore, the tariffs for the ICO programs are separate
60 60
from the tariffs for other programs and therefore a change like SPS is proposing requires a distinct tariff change.
b. Program Administration
SPS will administer and manage the ICO program internally. All contracts, marketing/sales, billing processes, program training, credit record maintenance, energy market administration, and load control procedures are handled internally. Most operational work is also completed internally. SPS utilizes an interruption system to notify customers of events and provide customers with energy trend information. The VLRPO system notifies customers of events, offers energy prices, and provides the customer the opportunity to accept, reject, or negotiate the energy price offer. SPS will use the following process to determine when to call an interruption:
1. Each operating day, SPS operators will evaluate the margin between total available resources (power plants, transmission, market options, and purchased power contracts) and forecasted loads plus required operating reserves.
2. When the margins fall between SPS’s largest power plant (Tolk) and 200 MW, SPS must evaluate whether to call upon the ICO buy-through option.
3. When the margin falls below 200 MW, SPS may call a capacity interruption. 4. If SPS calls an interruption through the ICO buy-through option, then the avoided
cost is calculated based on the marginal unit (or purchased power contract) in SPS’s portfolio.
5. The price is then broadcast to the ICO participants to facilitate their decision as to whether to buy-through or reduce their loads.
6. The buy-through cost is then calculated from actual operating data for billing purposes.
SPS retains data on all short-term, non-firm sales made during economic interruptions to demonstrate the hourly needs of the system and costs of alternatives available to system operators, as required by Paragraph L of the Recommended Decision in Case No. 08-00333-UT9.
c. Marketing and Outreach Plan For a program of this nature, it is not only important to promote the program to potential customers, but to also provide participants with ongoing support and communication. The marketing of this program is an on-going process that includes initial discussion to recruit participants, then ongoing communication to ensure customers realize the program value and can continue to reap the benefits of the program. SPS faces certain challenges while promoting this program, including: recruiting customers with large enough curtailable load to qualify, assuring customers that they can shed load and still operate efficiently, and convincing specific industries (i.e., oil and gas
9 Case No. 08-00333-UT; In the Matter of Southwestern Public Service Company’s Application for Approval of its 2009 Energy Efficiency and Load Management Plan and Associated Programs and its Program Cost Tariff Riders, Final Order Adopting Recommended Decision (Mar. 31, 2009).

61 61
production) to participate when it is more economical to continue production rather than interrupt their operation. Because of the size of the customers eligible for this program, SPS will market the program primarily through its Account Managers. Account Managers will contact and meet with potential qualifying customers to introduce customers to the various program options, discuss program requirements and responsibilities, and ensure the program is a good fit. The Account Managers will play a crucial role by interacting with customers on a regular basis to ensure customer satisfaction. In addition, SPS will use the following marketing materials to communicate the features and benefits of the program:
• New Mexico ICO System Guide – This guide will be provided to new customers when trained on the program and to existing customers on an as-needed basis to serve as a valuable reference in navigating the ICO system (provided by Account Manager after sign up).
• ICO Feature Sheet – This piece will summarize the program features and benefits and help potential customers determine their qualification status (available on xcelenergy.com).
• ICO Savings Credit Sheet – This reference will outline the various control options and assist customers in understanding the savings they could realize by participating in the program (available on xcelenergy.com).
• New Mexico ICO webpage on xcelenergy.com10 – Comprehensive program information will be included on the Xcel Energy website for potential customers. The site will be updated annually or whenever there are program updates.
• VLRPO Feature Sheet – This piece will summarize the program features and benefits and help potential customers determine their qualification status (available on xcelenergy.com).
• New Mexico VLRPO User’s Manual – This manual will be provided to new customers when trained on the program and to existing customers on an as-needed basis to serve as a valuable reference in navigating the VLRPO system (provided by Account Manager after sign up).
d. Measurement & Verification Plan
The savings for this load management program will be calculated based on technical assumptions derived from interval data collected via recording meters that are installed for each customer. Due to the small number of customers expected to participate in 2014, the Evaluator will not perform M&V in this Plan.
10 http://www.xcelenergy.com/Save_Money_&_Energy/For_Your_Business/Interruptible_&_Time_of_Use/Interruptible_Credit_Option_(ICO)_-_NM

62 62
e. Cost-Effectiveness Tests See Appendix A for the 2014 program benefit-cost analyses and Appendix B for the forecasted planning assumptions.
3. Saver’s Switch® for Business
a. Program Description Saver’s Switch is a demand response program that offers bill credits as an incentive for commercial customers to allow SPS to control operation of their central air conditioners on days when the system is approaching its peak. This program is generally utilized on hot summer days when SPS’s load is expected to reach near-peak capacity. Saver’s Switch helps reduce the impact of escalating demand and price for peak electricity. When the program is activated, a control signal is sent to interrupt the air conditioning load during peak periods, typically in the afternoons on weekdays. Interrupted air conditioners are cycled off and on in 15-20 minute increments for the duration of the control period. Deployed switches utilize an “adaptive algorithm” cycling strategy. This strategy allows the switches to “learn” how a customer’s air conditioning is being operated in order to achieve a 50 percent reduction in load. Due to limitations of available communications technologies in the area, Saver’s Switch is currently only available to customers in Roswell, Carlsbad, Clovis, Hobbs, Portales, and Artesia. Budget The primary costs associated with operating the Saver’s Switch program are driven by the number of expected participants, and include:
• The cost of switches; • The cost of installations; • Marketing expenses; • M&V expenses for evaluating program performance; and • Rebates to participating customers.
Relative to other programs offered in New Mexico, M&V expenses for Saver’s Switch are quite significant. Monitoring of the Saver’s Switch program is conducted by installing data loggers at a sampling of customer premises. The loggers measure air conditioning activity over the course of the cooling season. The data gathered is used to determine the resulting savings from activating Saver’s Switches. Installing and retrieving the loggers entails multiple visits to the customer premise. The cost is largely independent of the size of the program. With the program size being relatively small, monitoring accounts for a significant portion of the overall budget.

63 63
The internal administration portion of the budget is primarily driven by the cost of the switches and the data monitoring. The installation of the switches is accounted for in the Third-Party Delivery budget category. Changes for 2014 None.
b. Program Administration The Saver’s Switch program is promoted to customers using a variety of channels. Customers may sign up for the program via a mail-in form, phone, or the Xcel Energy website. Applications are generally processed and switches installed within six to eight weeks. A contracted third-party handles equipment installation, removal, and associated service calls. Due to variations in air conditioner age and location, the installer will make the final on-site determination as to whether the customer qualifies for the program. The Saver’s Switch program has the following additional requirements:
• The program does not offer customers the choice of opting out of individual control days.
• When a customer moves into a premise with a pre-existing switch, they are automatically enrolled in the program, but notified that they may opt-out.
Saver’s Switch can be activated at the request of SPS’s Commercial Operations or Transmission Operations under the following conditions:
• Commercial Operations will activate Saver’s Switch along with other load management programs in order to maintain reserves on the system above 200 MW.
• SPS will consider activating the program when obligation loads are high (above 4,400 MW), or if the forecasted reserves fall below 200 MW. This would likely occur when temperatures are above 100 degrees or when large SPS-owned generation units are off line.
• SPS’s Transmission Operations would also expect to request program activation if a Load Serving Entity in the SPS Balancing Authority is at NERC Energy Emergency Alert Level 2.
Activation of load management programs would take place prior to, or concurrent with, public appeals for conservation to reduce load to relieve a local transmission overload or unacceptably low transmission voltage. SPS is sensitive to the fact that participants in Saver’s Switch may leave the program if they deem it overused. SPS will make every attempt to avoid activating the program multiple days in a row.
64 64
c. Marketing and Outreach Plan SPS estimates that about 14,500 commercial customers in New Mexico have central air conditioning. SPS may use the following marketing channels to promote participation:
• bill inserts and newsletters to customers; • direct mail, including e-mail marketing; and • outbound telemarketing.
d. Measurement & Verification Plan
The savings for this prescriptive program will be calculated using deemed savings algorithms based on data collected through SPS’s load research department. Upon completion of field research, the raw data and tabulated results will be provided to the Evaluator for their input and final determination of estimated load relief. SPS’s load research organization will lead an annual research project to evaluate the load relief achieved from existing and new Saver’s Switch units. SPS uses third parties specializing in load research projects to collect and analyze the data. A sample of each type of switch is included in the annual research project. This is done with a data logger installed on-site to monitor an air conditioner’s energy use and how that use changes on a control day. The results are used to document the extent of load relief achieved during a control day.
e. Cost-Effectiveness Tests See Appendix A for benefit-cost analyses and Appendix B for the forecasted planning assumptions. In load research estimates generated in 2012, average load reduction among commercial program participants fell significantly from 2011 levels. The program is cost effective as proposed in this plan due to the life-cycle savings that are applied to new switches upon installation. This is a key difference when comparing this plan with the M&V report, which only determines the single-year benefits and costs of the program. Since previously-installed switches will continue to provide load relief for 15 years after installation, the cost effectiveness will improve as the total population of participants increases. While the program is cost effective, SPS will conduct an extensive technical review of the program to accelerate the path to increased cost effectiveness by either measure (single year or lifetime benefits) in the future. The program review will focus on four areas:
1. Field Checks of Deployed Saver’s Switches
As of the end of 2012, there were 100 participants in the program with a total of 295 Saver’s Switches installed on AC units. SPS plans to conduct field inspections of up to 100 percent of the current population to validate that:
65 65
• Switches are properly installed and not subject to tampering; • Signal reception is at an acceptable level; • Switches respond appropriately upon signaling; and • AC size and type (single stage and dual stage) are properly recorded.
2. Switch Manufacturer Review The Saver’s Switch program in other jurisdictions relies on public paging infrastructure for signaling switches to control air conditioners. In SPS’s New Mexico service territory, there are no public paging systems available. Instead, SPS relies on SPS-owned communications towers. This is why program participation is currently limited to six towns. The switch manufacturer has provided equipment especially designed for this application. SPS intends to review the current design with the manufacturer to validate that:
• The switches are equipped with the expected logic for determining control strategies to achieve the desired load reduction;
• The switches are calculating AC run-time correctly; and • The switches are programmed to monitor the correct signal frequencies (if
signaling issues are encountered in the field checks).
3. Current Participant Review The program requires a minimum AC size of five tons for participation. In the early phases of the program, switches were deployed on units smaller than required. Upon completion of the field checks, SPS will review current participants to identify if the presence of smaller AC units in the program reduces savings achievements. If so, customers with equipment under five tons may be removed from participation.
4. Program Promotion Refinements A review of achievements by customer segments (i.e., SIC codes) may provide guidance as to whether certain industry groups are more likely to provide greater levels of load relief than others. Findings may guide marketing activities to target and engage higher potential customers.
C. Planning & Research Segment The Planning & Research Segment consists of internal company functions (not customer-facing), which support the direct impact energy efficiency and load management programs. The Segment includes energy efficiency-related expenses for Consumer Education, Market Research, M&V, Planning & Administration, and Product Development. The overall objectives of the Planning & Research Segment are to:
66 66
• Provide strategic direction for SPS’s energy efficiency and load management programs;
• Support direct impact programs through education and opportunity identification; • Ensure regulatory compliance with energy efficiency and load management
legislation and rules; • Guide SPS internal policy issues related to energy efficiency and load
management; • Evaluate program technical assumptions, program achievements, cost-
effectiveness, and marketing strategies; • Provide segment and target market information; • Analyze overall effects of SPS’s energy efficiency and load management portfolio
on customer usage and overall system peak demand and system energy usage; • Measure customer satisfaction with SPS’s energy efficiency and load
management efforts; and • Develop new energy efficiency and load management programs.
Because of the indirect nature of the Planning & Research Segment, the normal program categories (i.e., rebate structure, program administration, marketing & outreach, M&V, and cost-effectiveness) do not apply. The following sections are limited to a description of each program.
1. Consumer Education Consumer Education is an indirect impact program that focuses primarily on creating consumer awareness of energy efficiency while providing residential customers with information on what they can do in their daily lives to reduce their energy usage. The program also supports the various energy efficiency and load management products SPS offers to residential customers. SPS employs a variety of resources and channels to communicate conservation and energy efficiency messages, including the Xcel Energy website, print, direct mail, radio, and community outreach events. SPS has found through industry and internal market research that customers who are educated on the benefits of energy efficiency are much more likely to participate in DSM programs. This research also shows that customers need multiple exposures to the same message before it becomes knowledge. SPS believes that this general education drives customers to participate in its portfolio of programs. SPS’s Consumer Education program targets all of its New Mexico residential customers. The primary emphasis will continue to focus on:
• Community-based events, such as home shows and conservation events; • Messaging through local newspaper websites and local radios; • Targeted communications to address seasonal usage challenges; • Conservation messaging through Xcel Energy’s newsletters and bill inserts to
residential customers; and • Creation and publication of reference education materials (in English and
Spanish).

67 67
SPS has approximately 92,000 residential customers in its New Mexico service territory. SPS plans to interface with approximately 80 percent of the residential customer base through bill inserts, community outreach events, and conservation advertising. Budget The Consumer Education budget was developed based on past experience building awareness and community outreach in New Mexico, as well as projected costs for reaching customers through multiple communication channels and tactics including:
• Community-based events; • Direct mail campaigns and promotions about conservation; • Bill inserts; and • Advertising, including, print, radio, and web.
Changes for 2014 None.
2. Market Research The Market Research group oversees a variety of research efforts that are used to assist SPS with energy efficiency and load management decision-making. These research functions are needed to provide overall support for clarifying issues and for thoroughly understanding both current and potential customers. Often, similar information is collected over multiple service territories, making comparisons possible. In 2014, the Market Research group plans to conduct several projects and studies as described below:
• Home Use Study – Quantitative research about New Mexico residential customers to gauge appliance saturation.
• Dun & Bradstreet Business List Purchase – Quarterly update on the demographics of existing business customers. This updated information can then be used to understand, profile, and target marketing efforts more effectively.
• E Source Membership – Robust repository of secondary and syndicated research resources for national marketing studies, research services, and consulting services.
• Business DSM Awareness, Attitude & Usage Studies – Quantitative research to gauge the energy awareness and energy efficient behaviors of Business SPS customers.
Budget The Market Research budget was developed based on past experience and the costs of the projects listed above. Changes for 2014 None.
68 68
3. Measurement and Verification 17.7.2.13(E) NMAC requires that all energy efficiency and load management programs be subject to measurement and verification through the Evaluator, where M&V is defined as “activities to determine or approximate with a high degree of certainty the actual demand and energy reductions from energy efficiency and load management programs.” Under the direction of the Commission and Evaluation Committee, the Evaluator will conduct an analysis of specified programs and provide a report on its findings. SPS will facilitate the M&V of all of its direct impact energy efficiency and load management programs according to the requirements set forth in the New Mexico rules and statutes.
a. Selection of the Independent Program Evaluator As a member of the Evaluation Committee, SPS has worked with the Commission to develop selection criteria and a contract for the Evaluator.
b. Measurement & Verification Process In 2014, SPS will require M&V of selected prescriptive programs (deemed savings) and its custom programs (calculated savings). The Evaluator will provide an individual M&V Plan for programs describing both the annual and comprehensive plans according to the program characteristics. The following are nationally accepted guidelines as to the type of M&V for each category of energy efficiency and load management programs: Prescriptive Programs/Products Prescriptive products are those pre-defined, common energy efficiency measures that do not require individual complex engineering analysis. These measures make up a program, making the program ‘prescriptive’ in nature. The gross savings from prescriptive programs, which are determined using deemed savings technical assumptions, will be verified each year based on the factors identified in the deemed savings algorithm. In addition, the independent evaluator may choose to perform field measurements and verification in order to fine-tune the technical assumptions. For some programs, such as Home Energy Services, which provide savings that may be detected at the whole-house level; the Evaluator may choose to perform an independent billing analysis of electric billings before and after the installation of measures, in order to calculate the gross savings. SPS’s algorithms and underlying deemed savings assumptions will be provided to the Evaluator to assist in its review. As part of their responsibilities, the Commission may rely on the Evaluator to assist the Commission in their review of these deemed savings technical assumptions. In addition, the Evaluator will review program processes and establish net-to-gross ratios to account for free-ridership. Custom Products For the custom projects (e.g., Custom Efficiency and Large Customer Self-Direct), SPS and the Evaluator will analyze each project’s savings separately, employing both internal and external engineers to calculate and provide expert engineering reviews. For projects
69 69
that have large energy savings or unique technologies, the Evaluator may choose to perform pre- and post-metering of the efficiency measure or process. If metering is not physically or economically feasible, engineering models, or other regression analyses may be employed to calculate the savings of each project. Load Management Programs To monitor its load management programs, SPS will provide interval-metering data for a census of the ICO customers. For the Saver’s Switch programs, statistical samples of air conditioners will be metered during the summer months. The Evaluator will use this data to analyze the gross and net savings impacts of the program by November 30 of each year for the previous summer and winter interruptions. In addition, the Evaluator may perform more comprehensive evaluations surveying customers at least once during a three-year period in order to provide recommendations for improvements to the program delivery and marketing processes.
c. Portfolio-Level M&V The Evaluator will assess the cost-effectiveness of all programs each year prior to the annual status report filing. In compliance with reporting requirements, the Evaluator’s M&V Report will include:
• Expenditure documentation, at both the total portfolio and individual program levels;
• Measured and verified savings; • Cost-effectiveness of all of SPS’s energy efficiency and load management
programs; • Deemed savings assumptions and all other assumptions used by the Evaluator;
and • Description of the M&V process, including confirmation that:
o measures are actually installed; o installations meet reasonable quality standards; and o measures are operating correctly and are expected to generate the
predicted savings. Budget The 2014 budget for indirect M&V expenses includes the following:
• Internal labor and expenses to provide project management of the entire M&V process, to interface with the Evaluator processing invoices and tracking costs, and to ensure internally that proper M&V and data tracking is in place.
• Fees to be charged by the Evaluator for preparing reports, reviewing technical assumptions, preparing discovery responses, testimony, and participating in hearings if needed.
70 70
In addition, SPS has budgeted for direct program-related M&V costs for the specific programs that ADM has designated for M&V in 2014. For total budgeted costs see Table 1, and for the cost for each program by cost category, see Table 10. Programs that will not require M&V in 2014 are: Evaporative Cooling, School Educations Kits, and Large Customer Self-Direct.11 Changes for 2014 In 2014, the Evaluator will exclude non-energy benefits from the savings and UCT cost-effectiveness calculations. The program Technical Assumptions will be modified to exclude non-energy O&M savings. For example, where there is water savings, secondary electrical savings presumed from the pumping of that water are excluded. This change is to make the M&V process consistent with the requirement that utilities use the UCT as the cost-effectiveness test. Unlike the TRC, which counts non-energy benefits, the TRC does not take these benefits into account.
4. Planning & Administration Planning & Administration provides policies and procedures for effectively addressing the requirements of the energy efficiency and load management regulatory processes. This functional team manages all regulatory filings, directs and carries out benefit-cost analyses, provides tracking and reporting of energy efficiency and load management achievements and expenditures, and analyzes and prepares cost recovery reports. The costs of outside legal services are included within this function as well. Outside legal services are retained for the purposes of preparing and filing of DSM regulatory reports, DSM plans, and settlements and representing SPS at all DSM evidentiary hearings. In addition, Planning & Administration supports the energy efficiency and load management components of resource planning, participates in rulemaking, and provides internal policy guidance. These functions are needed to ensure a cohesive and high-quality energy efficiency portfolio that meets legal requirements as well as the expectations of SPS’s customers, regulators, and staff. Budget The 2014 budget includes funds for: internal labor to prepare filings and benefit-cost analyses, outside legal services to support energy efficiency and load management filings and hearings, and employee expenses related to travel to and from New Mexico. Changes for 2014 None.
5. Product Development The Product Development group identifies, assesses, and develops new energy efficiency and load management products and services that can be offered to customers in SPS’s New Mexico service area. The product development process starts with ideas and
11 Note that Small Business Lighting is shown on a separate line, though it will be included with Lighting Efficiency in 2014.

71 71
concepts from customers, regulators, energy professionals, interest groups, and Xcel Energy staff. These ideas are then carefully screened and only ideas with the most potential are selected for the development process. For 2014 and beyond, the Product Development group will be a major contributor to SPS’s efforts to achieve its increasing conservation goals. Measures, products, and programs are selected for development based on a variety of criteria, including: savings potential, cost of savings, ability to be developed quickly, longevity of the offering (i.e., how long until a technology being rebated becomes the standard), level of market barriers and risk. The Product Development group developed the following new energy efficiency measures and products for the 2014 Plan: Building Tune-Up (new product) The Building Tune-Up product was designed in accordance with the 2012 DSM Plan Stipulation and Settlement Agreement. Product features:
1. Xcel Energy Building Tune-Up service provider to perform low-cost audit 2. Targets buildings < 75,000 square feet 3. Audit costs $5,000 - $8,000 4. Customer pays fixed fee of $1,000 5. Checklist must be completed 6. Service provider able to do on-site fixes 7. Low-cost/no-cost and behavioral measures quantified and tracked to program
New Business Cooling Measures
• Anti-Sweat Heater Controls: Offer a prescriptive rebate for installing anti-sweat heater controls to turn off anti-sweat heaters on refrigerated case doors
• Evaporator Fan Motor Controls: Offer a prescriptive rebate for Evaporator Fan Motor Controls
• Medium Temperature Refrigerated Case Replacement: Offer a prescriptive rebate for replacing an existing medium temperature refrigerated case with a more efficient case with doors
• No Heat Case Doors: Offer a prescriptive rebate for replacing existing standard refrigerated case doors with more efficient doors that don’t require anti-sweat heaters
New Business Lighting Measures • ENERGY STAR Qualified Interior Commercial LED Retrofit Fixture (screw-in)
Downlights, 25 Watts or less: Offer a prescriptive rebate for ENERGY STAR Qualified Interior Commercial LED Retrofit Fixture (screw-in) Downlights
• Bi-Level Stairwell Fixtures with Integrated Sensors: Offer a prescriptive rebate for Bi-Level Stairwell Fixtures with Integrated Sensors
• Photocell

72 72
• Lighting Optimization Lamp removal in T8 systems. Must include high efficiency electronic ballasts. T12 and T8 systems both qualify as existing (removed) equipment
• LED Wall Pack Fixtures – Exterior and Parking Garage: Offer a prescriptive rebate for LED Wall Pack Fixtures for both exterior and parking garage applications
• LED Parking Garage Low Bay Fixtures: Offer a prescriptive rebate for LED Parking Garage Low Bay Fixtures
• High Efficiency Electronic Ballasts Budget The 2014 budget includes funds for internal labor as well as outside consultant support. Changes for 2014 None.
73 73
IV. Conclusion SPS proposes a portfolio of energy efficiency and load management programs, consistent with the EUEA requirement. The 10 programs are: Residential Segment
• Energy Feedback Pilot (EE); • Evaporative Cooling Rebates (EE); • Home Energy Services (EE): • Home Lighting & Recycling (EE); • Refrigerator Recycling (EE); • School Education Kits (EE); and • Residential Saver’s Switch (LM).
Business Segment
• Business Comprehensive (EE); • Interruptible Credit Option (LM); and • Saver’s Switch for Business (LM).
These programs were designed to offer SPS’s customers opportunities for broad participation and the ability to reduce their energy consumption and peak demand. SPS solicited input on the proposed 2014 Plan program design from Staff, the Attorney General, EMNRD, and other interested stakeholders, including large customers, environmental, and low-income advocates. Each of the programs pass the UCT, while the overall 2014 portfolio results in a UCT ratio of 2.60. SPS has provided two appendices to this Plan:
• Appendix A contains the cost-effectiveness analyses of the individual programs, the customer segments, and the portfolio as a whole; and
• Appendix B presents the detailed forecasted planning assumptions on which the energy and demand savings projections and the cost-effectiveness analyses were calculated.
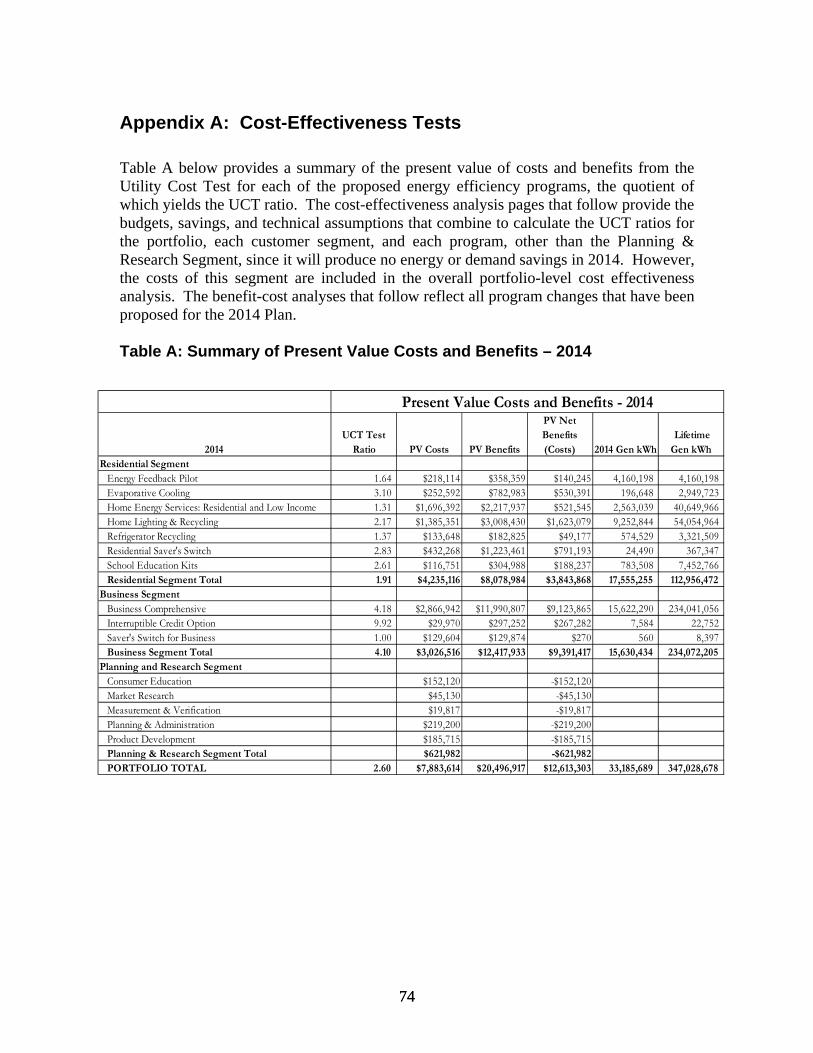
74 74
Appendix A: Cost-Effectiveness Tests Table A below provides a summary of the present value of costs and benefits from the Utility Cost Test for each of the proposed energy efficiency programs, the quotient of which yields the UCT ratio. The cost-effectiveness analysis pages that follow provide the budgets, savings, and technical assumptions that combine to calculate the UCT ratios for the portfolio, each customer segment, and each program, other than the Planning & Research Segment, since it will produce no energy or demand savings in 2014. However, the costs of this segment are included in the overall portfolio-level cost effectiveness analysis. The benefit-cost analyses that follow reflect all program changes that have been proposed for the 2014 Plan. Table A: Summary of Present Value Costs and Benefits – 2014
2014UCT Test
Ratio PV Costs PV Benefits
PV Net Benefits (Costs) 2014 Gen kWh
LifetimeGen kWh
Residential Segment Energy Feedback Pilot 1.64 $218,114 $358,359 $140,245 4,160,198 4,160,198 Evaporative Cooling 3.10 $252,592 $782,983 $530,391 196,648 2,949,723 Home Energy Services: Residential and Low Income 1.31 $1,696,392 $2,217,937 $521,545 2,563,039 40,649,966 Home Lighting & Recycling 2.17 $1,385,351 $3,008,430 $1,623,079 9,252,844 54,054,964 Refrigerator Recycling 1.37 $133,648 $182,825 $49,177 574,529 3,321,509 Residential Saver's Switch 2.83 $432,268 $1,223,461 $791,193 24,490 367,347 School Education Kits 2.61 $116,751 $304,988 $188,237 783,508 7,452,766 Residential Segment Total 1.91 $4,235,116 $8,078,984 $3,843,868 17,555,255 112,956,472
Business SegmentBusiness Comprehensive 4.18 $2,866,942 $11,990,807 $9,123,865 15,622,290 234,041,056 Interruptible Credit Option 9.92 $29,970 $297,252 $267,282 7,584 22,752 Saver's Switch for Business 1.00 $129,604 $129,874 $270 560 8,397 Business Segment Total 4.10 $3,026,516 $12,417,933 $9,391,417 15,630,434 234,072,205
Planning and Research SegmentConsumer Education $152,120 -$152,120Market Research $45,130 -$45,130Measurement & Verification $19,817 -$19,817Planning & Administration $219,200 -$219,200Product Development $185,715 -$185,715Planning & Research Segment Total $621,982 -$621,982PORTFOLIO TOTAL 2.60 $7,883,614 $20,496,917 $12,613,303 33,185,689 347,028,678
Present Value Costs and Benefits - 2014
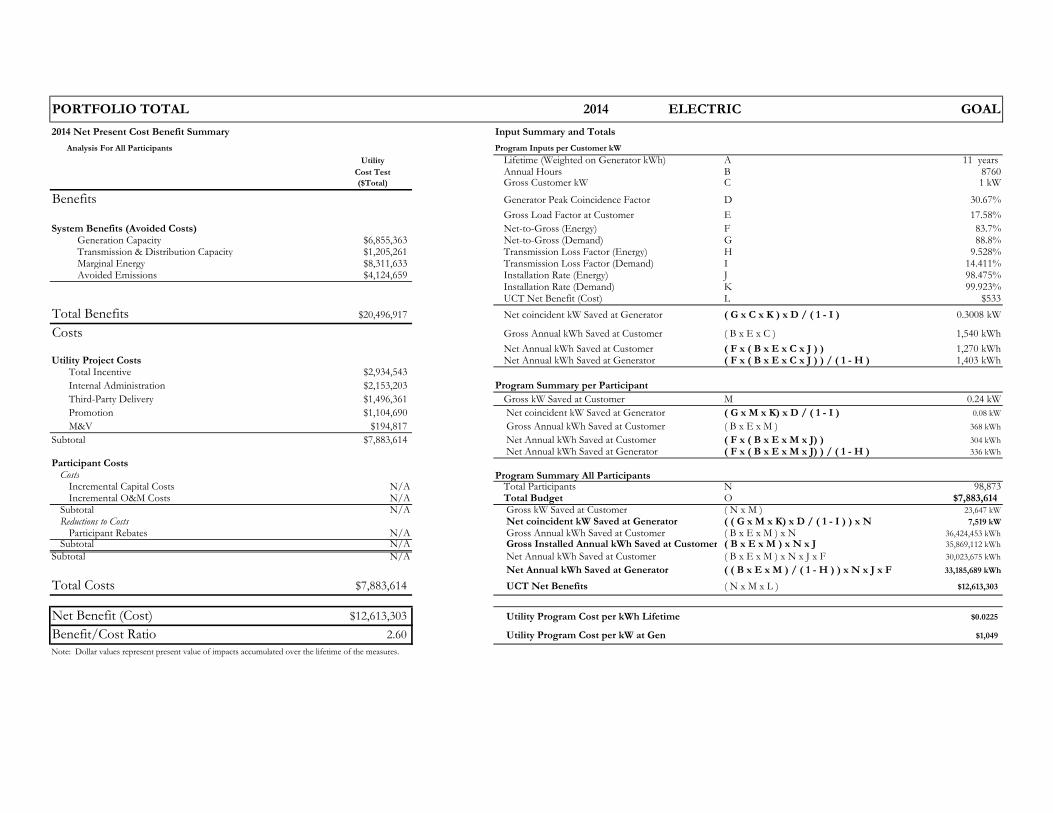
PORTFOLIO TOTAL 2014 ELECTRIC GOAL
2014 Net Present Cost Benefit Summary Input Summary and Totals
Analysis For All Participants Program Inputs per Customer kW
Utility Lifetime (Weighted on Generator kWh) A 11 years Cost Test Annual Hours B 8760($Total) Gross Customer kW C 1 kW
Benefits Generator Peak Coincidence Factor D 30.67%
Gross Load Factor at Customer E 17.58%
System Benefits (Avoided Costs) Net-to-Gross (Energy) F 83.7%Generation Capacity $6,855,363 Net-to-Gross (Demand) G 88.8%Transmission & Distribution Capacity $1,205,261 Transmission Loss Factor (Energy) H 9.528%Marginal Energy $8,311,633 Transmission Loss Factor (Demand) I 14.411%Avoided Emissions $4,124,659 Installation Rate (Energy) J 98.475%
Installation Rate (Demand) K 99.923%UCT Net Benefit (Cost) L $533
Total Benefits $20,496,917 Net coincident kW Saved at Generator ( G x C x K ) x D / ( 1 - I ) 0.3008 kW
Costs Gross Annual kWh Saved at Customer ( B x E x C ) 1,540 kWh
Net Annual kWh Saved at Customer ( F x ( B x E x C x J ) ) 1,270 kWh Utility Project Costs Net Annual kWh Saved at Generator ( F x ( B x E x C x J ) ) / ( 1 - H ) 1,403 kWh
Total Incentive $2,934,543
Internal Administration $2,153,203 Program Summary per Participant
Third-Party Delivery $1,496,361 Gross kW Saved at Customer M 0.24 kW
Promotion $1,104,690 Net coincident kW Saved at Generator ( G x M x K) x D / ( 1 - I ) 0.08 kW
M&V $194,817 Gross Annual kWh Saved at Customer ( B x E x M ) 368 kWh
Subtotal $7,883,614 Net Annual kWh Saved at Customer ( F x ( B x E x M x J) ) 304 kWh
Net Annual kWh Saved at Generator ( F x ( B x E x M x J) ) / ( 1 - H ) 336 kWh
Participant CostsCosts Program Summary All ParticipantsIncremental Capital Costs N/A Total Participants N 98,873Incremental O&M Costs N/A Total Budget O $7,883,614
Subtotal N/A Gross kW Saved at Customer ( N x M ) 23,647 kW
Reductions to Costs Net coincident kW Saved at Generator ( ( G x M x K) x D / ( 1 - I ) ) x N 7,519 kW
Participant Rebates N/A Gross Annual kWh Saved at Customer ( B x E x M ) x N 36,424,453 kWh
Subtotal N/A Gross Installed Annual kWh Saved at Customer ( B x E x M ) x N x J 35,869,112 kWh
Subtotal N/A Net Annual kWh Saved at Customer ( B x E x M ) x N x J x F 30,023,675 kWh
Net Annual kWh Saved at Generator ( ( B x E x M ) / ( 1 - H ) ) x N x J x F 33,185,689 kWh
Total Costs $7,883,614 UCT Net Benefits ( N x M x L ) $12,613,303
Net Benefit (Cost) $12,613,303 Utility Program Cost per kWh Lifetime $0.0225
Benefit/Cost Ratio 2.60 Utility Program Cost per kW at Gen $1,049
Note: Dollar values represent present value of impacts accumulated over the lifetime of the measures.
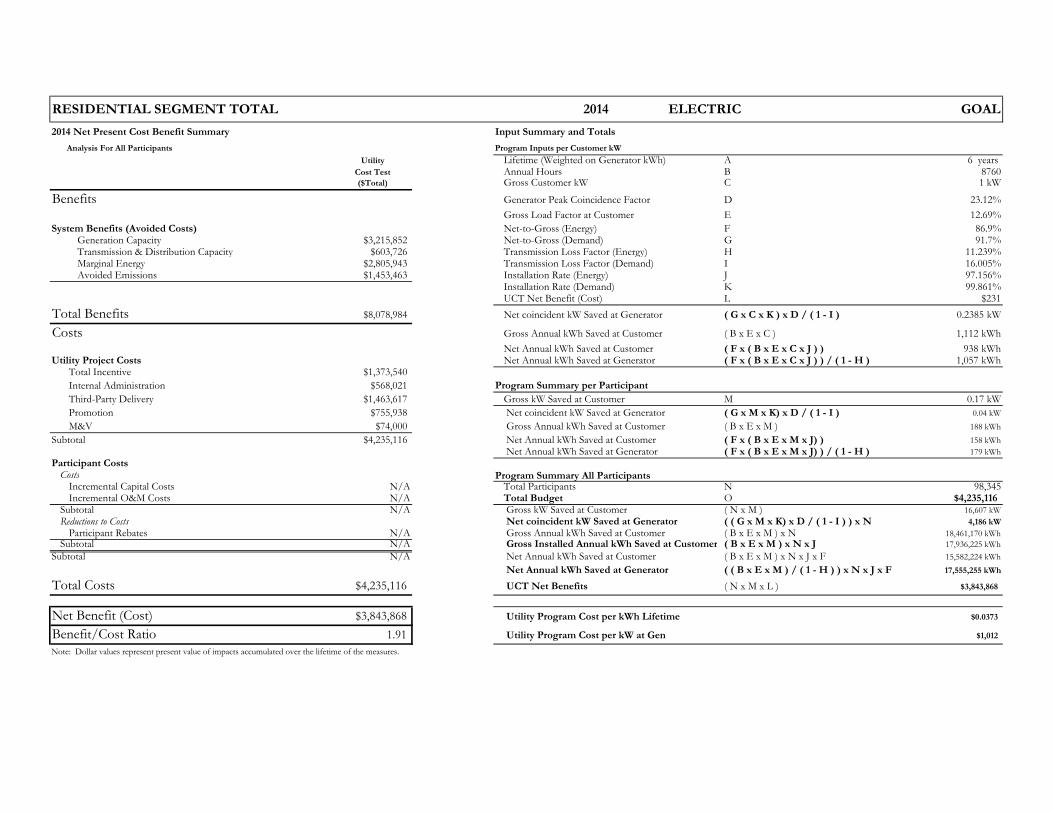
RESIDENTIAL SEGMENT TOTAL 2014 ELECTRIC GOAL
2014 Net Present Cost Benefit Summary Input Summary and Totals
Analysis For All Participants Program Inputs per Customer kW
Utility Lifetime (Weighted on Generator kWh) A 6 years Cost Test Annual Hours B 8760($Total) Gross Customer kW C 1 kW
Benefits Generator Peak Coincidence Factor D 23.12%
Gross Load Factor at Customer E 12.69%
System Benefits (Avoided Costs) Net-to-Gross (Energy) F 86.9%Generation Capacity $3,215,852 Net-to-Gross (Demand) G 91.7%Transmission & Distribution Capacity $603,726 Transmission Loss Factor (Energy) H 11.239%Marginal Energy $2,805,943 Transmission Loss Factor (Demand) I 16.005%Avoided Emissions $1,453,463 Installation Rate (Energy) J 97.156%
Installation Rate (Demand) K 99.861%UCT Net Benefit (Cost) L $231
Total Benefits $8,078,984 Net coincident kW Saved at Generator ( G x C x K ) x D / ( 1 - I ) 0.2385 kW
Costs Gross Annual kWh Saved at Customer ( B x E x C ) 1,112 kWh
Net Annual kWh Saved at Customer ( F x ( B x E x C x J ) ) 938 kWh Utility Project Costs Net Annual kWh Saved at Generator ( F x ( B x E x C x J ) ) / ( 1 - H ) 1,057 kWh
Total Incentive $1,373,540
Internal Administration $568,021 Program Summary per Participant
Third-Party Delivery $1,463,617 Gross kW Saved at Customer M 0.17 kW
Promotion $755,938 Net coincident kW Saved at Generator ( G x M x K) x D / ( 1 - I ) 0.04 kW
M&V $74,000 Gross Annual kWh Saved at Customer ( B x E x M ) 188 kWh
Subtotal $4,235,116 Net Annual kWh Saved at Customer ( F x ( B x E x M x J) ) 158 kWh
Net Annual kWh Saved at Generator ( F x ( B x E x M x J) ) / ( 1 - H ) 179 kWh
Participant CostsCosts Program Summary All ParticipantsIncremental Capital Costs N/A Total Participants N 98,345Incremental O&M Costs N/A Total Budget O $4,235,116
Subtotal N/A Gross kW Saved at Customer ( N x M ) 16,607 kW
Reductions to Costs Net coincident kW Saved at Generator ( ( G x M x K) x D / ( 1 - I ) ) x N 4,186 kW
Participant Rebates N/A Gross Annual kWh Saved at Customer ( B x E x M ) x N 18,461,170 kWh
Subtotal N/A Gross Installed Annual kWh Saved at Customer ( B x E x M ) x N x J 17,936,225 kWh
Subtotal N/A Net Annual kWh Saved at Customer ( B x E x M ) x N x J x F 15,582,224 kWh
Net Annual kWh Saved at Generator ( ( B x E x M ) / ( 1 - H ) ) x N x J x F 17,555,255 kWh
Total Costs $4,235,116 UCT Net Benefits ( N x M x L ) $3,843,868
Net Benefit (Cost) $3,843,868 Utility Program Cost per kWh Lifetime $0.0373
Benefit/Cost Ratio 1.91 Utility Program Cost per kW at Gen $1,012
Note: Dollar values represent present value of impacts accumulated over the lifetime of the measures.

ENERGY FEEDBACK PILOT 2014 ELECTRIC GOAL
2014 Net Present Cost Benefit Summary Input Summary and Totals
Analysis For All Participants Program Inputs per Customer kW
Utility Lifetime (Weighted on Generator kWh) A 1 years Cost Test Annual Hours B 8760($Total) Gross Customer kW C 1 kW
Benefits Generator Peak Coincidence Factor D 75.01%
Gross Load Factor at Customer E 34.32%
System Benefits (Avoided Costs) Net-to-Gross (Energy) F 100.0%Generation Capacity $149,958 Net-to-Gross (Demand) G 100.0%Transmission & Distribution Capacity $26,906 Transmission Loss Factor (Energy) H 11.800%Marginal Energy $111,755 Transmission Loss Factor (Demand) I 16.200%Avoided Emissions $69,740 Installation Rate (Energy) J 100.000%
Installation Rate (Demand) K 100.000%UCT Net Benefit (Cost) L $115
Total Benefits $358,359 Net coincident kW Saved at Generator ( G x C x K ) x D / ( 1 - I ) 0.8504 kW
Costs Gross Annual kWh Saved at Customer ( B x E x C ) 3,006 kWh
Net Annual kWh Saved at Customer ( F x ( B x E x C x J ) ) 3,006 kWh Utility Project Costs Net Annual kWh Saved at Generator ( F x ( B x E x C x J ) ) / ( 1 - H ) 3,408 kWh
Total Incentive $0
Internal Administration $205,614 Program Summary per Participant
Third-Party Delivery $0 Gross kW Saved at Customer M 0.09 kW
Promotion $0 Net coincident kW Saved at Generator ( G x M x K) x D / ( 1 - I ) 0.08 kW
M&V $12,500 Gross Annual kWh Saved at Customer ( B x E x M ) 270 kWh
Subtotal $218,114 Net Annual kWh Saved at Customer ( F x ( B x E x M x J) ) 270 kWh
Net Annual kWh Saved at Generator ( F x ( B x E x M x J) ) / ( 1 - H ) 307 kWh
Participant CostsCosts Program Summary All ParticipantsIncremental Capital Costs N/A Total Participants N 13,565Incremental O&M Costs N/A Total Budget O $218,114
Subtotal N/A Gross kW Saved at Customer ( N x M ) 1,221 kW
Reductions to Costs Net coincident kW Saved at Generator ( ( G x M x K) x D / ( 1 - I ) ) x N 1,093 kW
Participant Rebates N/A Gross Annual kWh Saved at Customer ( B x E x M ) x N 3,669,294 kWh
Subtotal N/A Gross Installed Annual kWh Saved at Customer ( B x E x M ) x N x J 3,669,294 kWh
Subtotal N/A Net Annual kWh Saved at Customer ( B x E x M ) x N x J x F 3,669,294 kWh
Net Annual kWh Saved at Generator ( ( B x E x M ) / ( 1 - H ) ) x N x J x F 4,160,198 kWh
Total Costs $218,114 UCT Net Benefits ( N x M x L ) $140,245
Net Benefit (Cost) $140,245 Utility Program Cost per kWh Lifetime $0.0524
Benefit/Cost Ratio 1.64 Utility Program Cost per kW at Gen $200
Note: Dollar values represent present value of impacts accumulated over the lifetime of the measures.
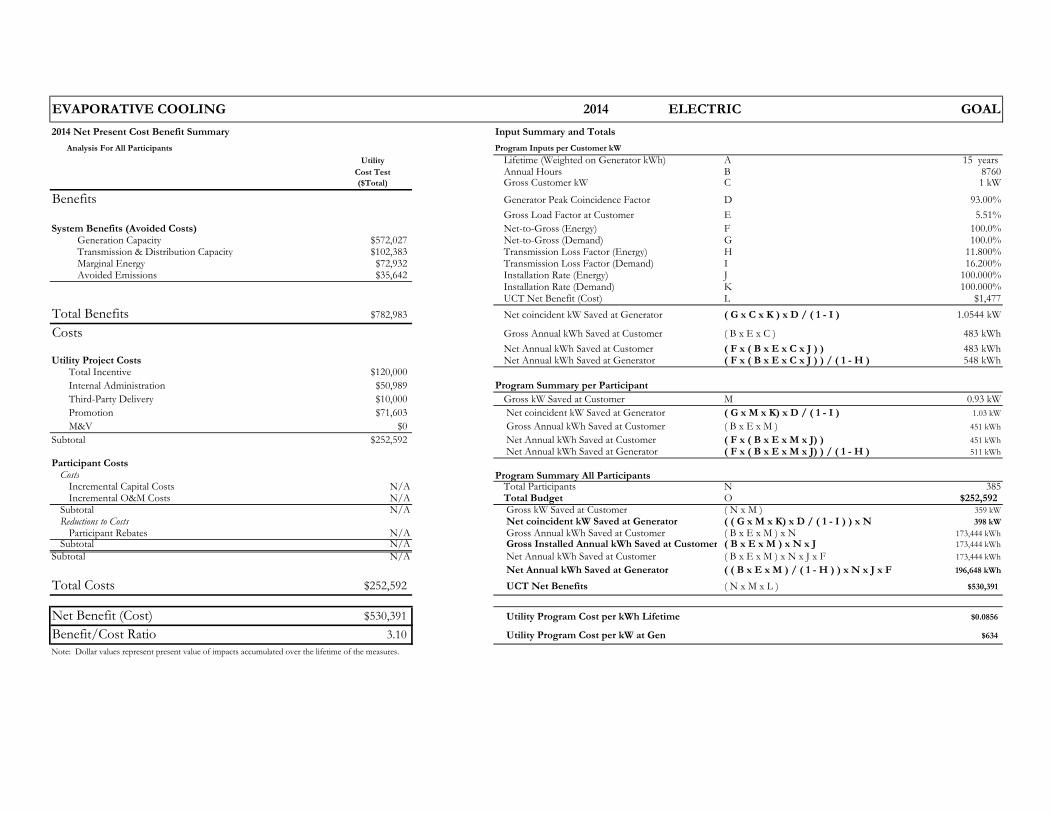
EVAPORATIVE COOLING 2014 ELECTRIC GOAL
2014 Net Present Cost Benefit Summary Input Summary and Totals
Analysis For All Participants Program Inputs per Customer kW
Utility Lifetime (Weighted on Generator kWh) A 15 years Cost Test Annual Hours B 8760($Total) Gross Customer kW C 1 kW
Benefits Generator Peak Coincidence Factor D 93.00%
Gross Load Factor at Customer E 5.51%
System Benefits (Avoided Costs) Net-to-Gross (Energy) F 100.0%Generation Capacity $572,027 Net-to-Gross (Demand) G 100.0%Transmission & Distribution Capacity $102,383 Transmission Loss Factor (Energy) H 11.800%Marginal Energy $72,932 Transmission Loss Factor (Demand) I 16.200%Avoided Emissions $35,642 Installation Rate (Energy) J 100.000%
Installation Rate (Demand) K 100.000%UCT Net Benefit (Cost) L $1,477
Total Benefits $782,983 Net coincident kW Saved at Generator ( G x C x K ) x D / ( 1 - I ) 1.0544 kW
Costs Gross Annual kWh Saved at Customer ( B x E x C ) 483 kWh
Net Annual kWh Saved at Customer ( F x ( B x E x C x J ) ) 483 kWh Utility Project Costs Net Annual kWh Saved at Generator ( F x ( B x E x C x J ) ) / ( 1 - H ) 548 kWh
Total Incentive $120,000
Internal Administration $50,989 Program Summary per Participant
Third-Party Delivery $10,000 Gross kW Saved at Customer M 0.93 kW
Promotion $71,603 Net coincident kW Saved at Generator ( G x M x K) x D / ( 1 - I ) 1.03 kW
M&V $0 Gross Annual kWh Saved at Customer ( B x E x M ) 451 kWh
Subtotal $252,592 Net Annual kWh Saved at Customer ( F x ( B x E x M x J) ) 451 kWh
Net Annual kWh Saved at Generator ( F x ( B x E x M x J) ) / ( 1 - H ) 511 kWh
Participant CostsCosts Program Summary All ParticipantsIncremental Capital Costs N/A Total Participants N 385Incremental O&M Costs N/A Total Budget O $252,592
Subtotal N/A Gross kW Saved at Customer ( N x M ) 359 kW
Reductions to Costs Net coincident kW Saved at Generator ( ( G x M x K) x D / ( 1 - I ) ) x N 398 kW
Participant Rebates N/A Gross Annual kWh Saved at Customer ( B x E x M ) x N 173,444 kWh
Subtotal N/A Gross Installed Annual kWh Saved at Customer ( B x E x M ) x N x J 173,444 kWh
Subtotal N/A Net Annual kWh Saved at Customer ( B x E x M ) x N x J x F 173,444 kWh
Net Annual kWh Saved at Generator ( ( B x E x M ) / ( 1 - H ) ) x N x J x F 196,648 kWh
Total Costs $252,592 UCT Net Benefits ( N x M x L ) $530,391
Net Benefit (Cost) $530,391 Utility Program Cost per kWh Lifetime $0.0856
Benefit/Cost Ratio 3.10 Utility Program Cost per kW at Gen $634
Note: Dollar values represent present value of impacts accumulated over the lifetime of the measures.
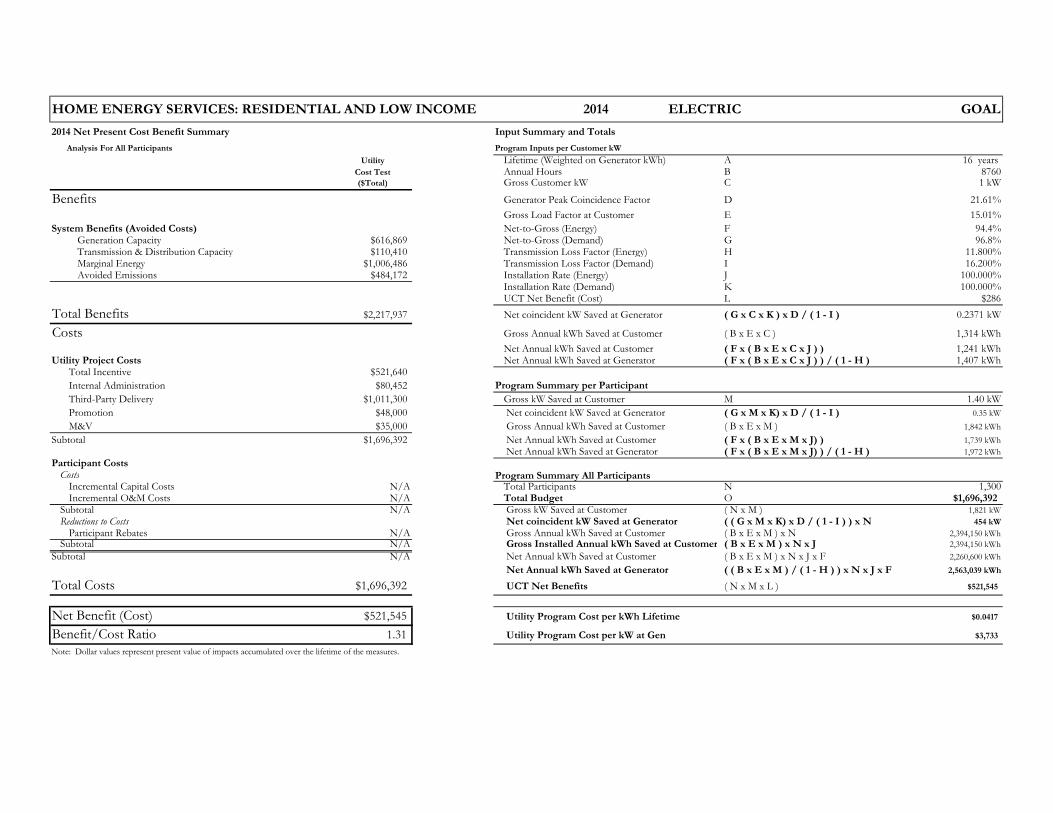
HOME ENERGY SERVICES: RESIDENTIAL AND LOW INCOME 2014 ELECTRIC GOAL
2014 Net Present Cost Benefit Summary Input Summary and Totals
Analysis For All Participants Program Inputs per Customer kW
Utility Lifetime (Weighted on Generator kWh) A 16 years Cost Test Annual Hours B 8760($Total) Gross Customer kW C 1 kW
Benefits Generator Peak Coincidence Factor D 21.61%
Gross Load Factor at Customer E 15.01%
System Benefits (Avoided Costs) Net-to-Gross (Energy) F 94.4%Generation Capacity $616,869 Net-to-Gross (Demand) G 96.8%Transmission & Distribution Capacity $110,410 Transmission Loss Factor (Energy) H 11.800%Marginal Energy $1,006,486 Transmission Loss Factor (Demand) I 16.200%Avoided Emissions $484,172 Installation Rate (Energy) J 100.000%
Installation Rate (Demand) K 100.000%UCT Net Benefit (Cost) L $286
Total Benefits $2,217,937 Net coincident kW Saved at Generator ( G x C x K ) x D / ( 1 - I ) 0.2371 kW
Costs Gross Annual kWh Saved at Customer ( B x E x C ) 1,314 kWh
Net Annual kWh Saved at Customer ( F x ( B x E x C x J ) ) 1,241 kWh Utility Project Costs Net Annual kWh Saved at Generator ( F x ( B x E x C x J ) ) / ( 1 - H ) 1,407 kWh
Total Incentive $521,640
Internal Administration $80,452 Program Summary per Participant
Third-Party Delivery $1,011,300 Gross kW Saved at Customer M 1.40 kW
Promotion $48,000 Net coincident kW Saved at Generator ( G x M x K) x D / ( 1 - I ) 0.35 kW
M&V $35,000 Gross Annual kWh Saved at Customer ( B x E x M ) 1,842 kWh
Subtotal $1,696,392 Net Annual kWh Saved at Customer ( F x ( B x E x M x J) ) 1,739 kWh
Net Annual kWh Saved at Generator ( F x ( B x E x M x J) ) / ( 1 - H ) 1,972 kWh
Participant CostsCosts Program Summary All ParticipantsIncremental Capital Costs N/A Total Participants N 1,300Incremental O&M Costs N/A Total Budget O $1,696,392
Subtotal N/A Gross kW Saved at Customer ( N x M ) 1,821 kW
Reductions to Costs Net coincident kW Saved at Generator ( ( G x M x K) x D / ( 1 - I ) ) x N 454 kW
Participant Rebates N/A Gross Annual kWh Saved at Customer ( B x E x M ) x N 2,394,150 kWh
Subtotal N/A Gross Installed Annual kWh Saved at Customer ( B x E x M ) x N x J 2,394,150 kWh
Subtotal N/A Net Annual kWh Saved at Customer ( B x E x M ) x N x J x F 2,260,600 kWh
Net Annual kWh Saved at Generator ( ( B x E x M ) / ( 1 - H ) ) x N x J x F 2,563,039 kWh
Total Costs $1,696,392 UCT Net Benefits ( N x M x L ) $521,545
Net Benefit (Cost) $521,545 Utility Program Cost per kWh Lifetime $0.0417
Benefit/Cost Ratio 1.31 Utility Program Cost per kW at Gen $3,733
Note: Dollar values represent present value of impacts accumulated over the lifetime of the measures.
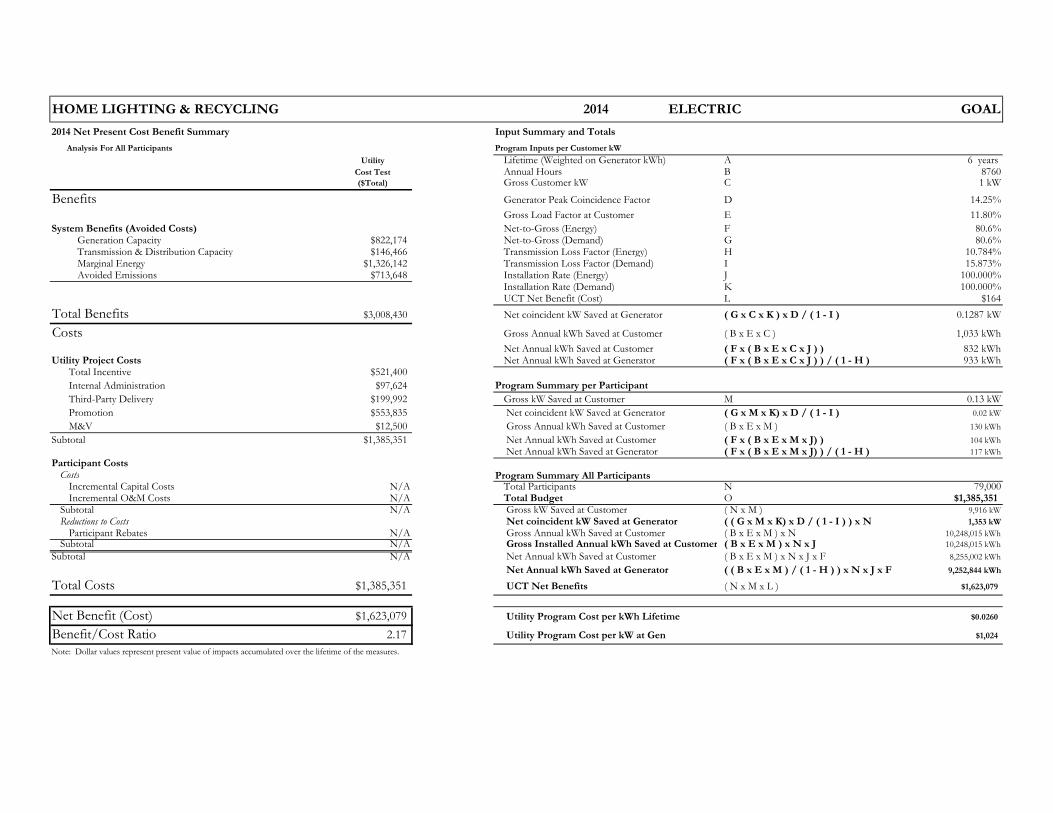
HOME LIGHTING & RECYCLING 2014 ELECTRIC GOAL
2014 Net Present Cost Benefit Summary Input Summary and Totals
Analysis For All Participants Program Inputs per Customer kW
Utility Lifetime (Weighted on Generator kWh) A 6 years Cost Test Annual Hours B 8760($Total) Gross Customer kW C 1 kW
Benefits Generator Peak Coincidence Factor D 14.25%
Gross Load Factor at Customer E 11.80%
System Benefits (Avoided Costs) Net-to-Gross (Energy) F 80.6%Generation Capacity $822,174 Net-to-Gross (Demand) G 80.6%Transmission & Distribution Capacity $146,466 Transmission Loss Factor (Energy) H 10.784%Marginal Energy $1,326,142 Transmission Loss Factor (Demand) I 15.873%Avoided Emissions $713,648 Installation Rate (Energy) J 100.000%
Installation Rate (Demand) K 100.000%UCT Net Benefit (Cost) L $164
Total Benefits $3,008,430 Net coincident kW Saved at Generator ( G x C x K ) x D / ( 1 - I ) 0.1287 kW
Costs Gross Annual kWh Saved at Customer ( B x E x C ) 1,033 kWh
Net Annual kWh Saved at Customer ( F x ( B x E x C x J ) ) 832 kWh Utility Project Costs Net Annual kWh Saved at Generator ( F x ( B x E x C x J ) ) / ( 1 - H ) 933 kWh
Total Incentive $521,400
Internal Administration $97,624 Program Summary per Participant
Third-Party Delivery $199,992 Gross kW Saved at Customer M 0.13 kW
Promotion $553,835 Net coincident kW Saved at Generator ( G x M x K) x D / ( 1 - I ) 0.02 kW
M&V $12,500 Gross Annual kWh Saved at Customer ( B x E x M ) 130 kWh
Subtotal $1,385,351 Net Annual kWh Saved at Customer ( F x ( B x E x M x J) ) 104 kWh
Net Annual kWh Saved at Generator ( F x ( B x E x M x J) ) / ( 1 - H ) 117 kWh
Participant CostsCosts Program Summary All ParticipantsIncremental Capital Costs N/A Total Participants N 79,000Incremental O&M Costs N/A Total Budget O $1,385,351
Subtotal N/A Gross kW Saved at Customer ( N x M ) 9,916 kW
Reductions to Costs Net coincident kW Saved at Generator ( ( G x M x K) x D / ( 1 - I ) ) x N 1,353 kW
Participant Rebates N/A Gross Annual kWh Saved at Customer ( B x E x M ) x N 10,248,015 kWh
Subtotal N/A Gross Installed Annual kWh Saved at Customer ( B x E x M ) x N x J 10,248,015 kWh
Subtotal N/A Net Annual kWh Saved at Customer ( B x E x M ) x N x J x F 8,255,002 kWh
Net Annual kWh Saved at Generator ( ( B x E x M ) / ( 1 - H ) ) x N x J x F 9,252,844 kWh
Total Costs $1,385,351 UCT Net Benefits ( N x M x L ) $1,623,079
Net Benefit (Cost) $1,623,079 Utility Program Cost per kWh Lifetime $0.0260
Benefit/Cost Ratio 2.17 Utility Program Cost per kW at Gen $1,024
Note: Dollar values represent present value of impacts accumulated over the lifetime of the measures.
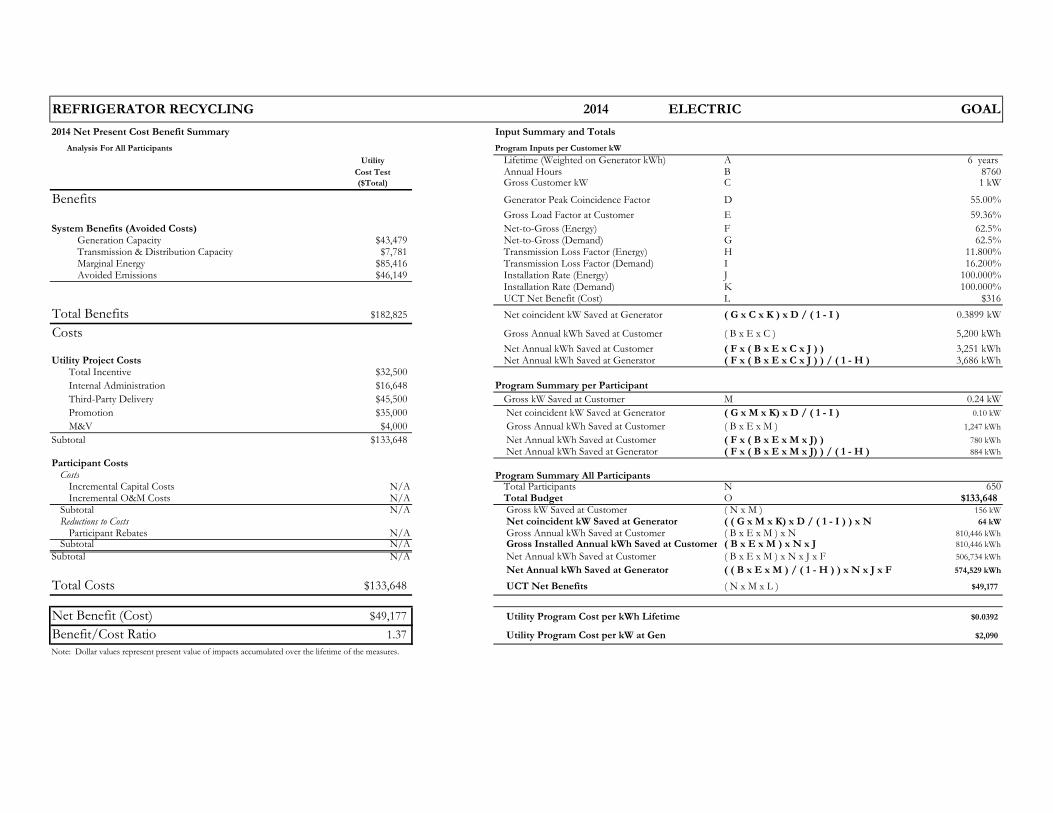
REFRIGERATOR RECYCLING 2014 ELECTRIC GOAL
2014 Net Present Cost Benefit Summary Input Summary and Totals
Analysis For All Participants Program Inputs per Customer kW
Utility Lifetime (Weighted on Generator kWh) A 6 years Cost Test Annual Hours B 8760($Total) Gross Customer kW C 1 kW
Benefits Generator Peak Coincidence Factor D 55.00%
Gross Load Factor at Customer E 59.36%
System Benefits (Avoided Costs) Net-to-Gross (Energy) F 62.5%Generation Capacity $43,479 Net-to-Gross (Demand) G 62.5%Transmission & Distribution Capacity $7,781 Transmission Loss Factor (Energy) H 11.800%Marginal Energy $85,416 Transmission Loss Factor (Demand) I 16.200%Avoided Emissions $46,149 Installation Rate (Energy) J 100.000%
Installation Rate (Demand) K 100.000%UCT Net Benefit (Cost) L $316
Total Benefits $182,825 Net coincident kW Saved at Generator ( G x C x K ) x D / ( 1 - I ) 0.3899 kW
Costs Gross Annual kWh Saved at Customer ( B x E x C ) 5,200 kWh
Net Annual kWh Saved at Customer ( F x ( B x E x C x J ) ) 3,251 kWh Utility Project Costs Net Annual kWh Saved at Generator ( F x ( B x E x C x J ) ) / ( 1 - H ) 3,686 kWh
Total Incentive $32,500
Internal Administration $16,648 Program Summary per Participant
Third-Party Delivery $45,500 Gross kW Saved at Customer M 0.24 kW
Promotion $35,000 Net coincident kW Saved at Generator ( G x M x K) x D / ( 1 - I ) 0.10 kW
M&V $4,000 Gross Annual kWh Saved at Customer ( B x E x M ) 1,247 kWh
Subtotal $133,648 Net Annual kWh Saved at Customer ( F x ( B x E x M x J) ) 780 kWh
Net Annual kWh Saved at Generator ( F x ( B x E x M x J) ) / ( 1 - H ) 884 kWh
Participant CostsCosts Program Summary All ParticipantsIncremental Capital Costs N/A Total Participants N 650Incremental O&M Costs N/A Total Budget O $133,648
Subtotal N/A Gross kW Saved at Customer ( N x M ) 156 kW
Reductions to Costs Net coincident kW Saved at Generator ( ( G x M x K) x D / ( 1 - I ) ) x N 64 kW
Participant Rebates N/A Gross Annual kWh Saved at Customer ( B x E x M ) x N 810,446 kWh
Subtotal N/A Gross Installed Annual kWh Saved at Customer ( B x E x M ) x N x J 810,446 kWh
Subtotal N/A Net Annual kWh Saved at Customer ( B x E x M ) x N x J x F 506,734 kWh
Net Annual kWh Saved at Generator ( ( B x E x M ) / ( 1 - H ) ) x N x J x F 574,529 kWh
Total Costs $133,648 UCT Net Benefits ( N x M x L ) $49,177
Net Benefit (Cost) $49,177 Utility Program Cost per kWh Lifetime $0.0392
Benefit/Cost Ratio 1.37 Utility Program Cost per kW at Gen $2,090
Note: Dollar values represent present value of impacts accumulated over the lifetime of the measures.
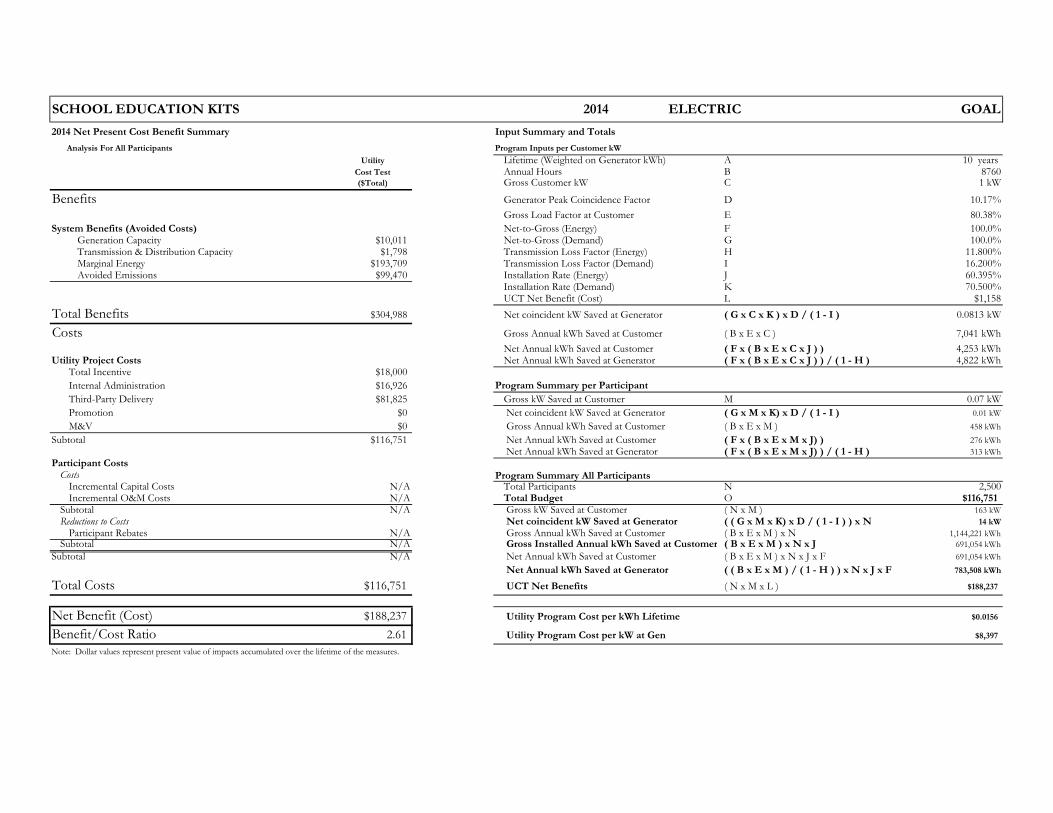
SCHOOL EDUCATION KITS 2014 ELECTRIC GOAL
2014 Net Present Cost Benefit Summary Input Summary and Totals
Analysis For All Participants Program Inputs per Customer kW
Utility Lifetime (Weighted on Generator kWh) A 10 years Cost Test Annual Hours B 8760($Total) Gross Customer kW C 1 kW
Benefits Generator Peak Coincidence Factor D 10.17%
Gross Load Factor at Customer E 80.38%
System Benefits (Avoided Costs) Net-to-Gross (Energy) F 100.0%Generation Capacity $10,011 Net-to-Gross (Demand) G 100.0%Transmission & Distribution Capacity $1,798 Transmission Loss Factor (Energy) H 11.800%Marginal Energy $193,709 Transmission Loss Factor (Demand) I 16.200%Avoided Emissions $99,470 Installation Rate (Energy) J 60.395%
Installation Rate (Demand) K 70.500%UCT Net Benefit (Cost) L $1,158
Total Benefits $304,988 Net coincident kW Saved at Generator ( G x C x K ) x D / ( 1 - I ) 0.0813 kW
Costs Gross Annual kWh Saved at Customer ( B x E x C ) 7,041 kWh
Net Annual kWh Saved at Customer ( F x ( B x E x C x J ) ) 4,253 kWh Utility Project Costs Net Annual kWh Saved at Generator ( F x ( B x E x C x J ) ) / ( 1 - H ) 4,822 kWh
Total Incentive $18,000
Internal Administration $16,926 Program Summary per Participant
Third-Party Delivery $81,825 Gross kW Saved at Customer M 0.07 kW
Promotion $0 Net coincident kW Saved at Generator ( G x M x K) x D / ( 1 - I ) 0.01 kW
M&V $0 Gross Annual kWh Saved at Customer ( B x E x M ) 458 kWh
Subtotal $116,751 Net Annual kWh Saved at Customer ( F x ( B x E x M x J) ) 276 kWh
Net Annual kWh Saved at Generator ( F x ( B x E x M x J) ) / ( 1 - H ) 313 kWh
Participant CostsCosts Program Summary All ParticipantsIncremental Capital Costs N/A Total Participants N 2,500Incremental O&M Costs N/A Total Budget O $116,751
Subtotal N/A Gross kW Saved at Customer ( N x M ) 163 kW
Reductions to Costs Net coincident kW Saved at Generator ( ( G x M x K) x D / ( 1 - I ) ) x N 14 kW
Participant Rebates N/A Gross Annual kWh Saved at Customer ( B x E x M ) x N 1,144,221 kWh
Subtotal N/A Gross Installed Annual kWh Saved at Customer ( B x E x M ) x N x J 691,054 kWh
Subtotal N/A Net Annual kWh Saved at Customer ( B x E x M ) x N x J x F 691,054 kWh
Net Annual kWh Saved at Generator ( ( B x E x M ) / ( 1 - H ) ) x N x J x F 783,508 kWh
Total Costs $116,751 UCT Net Benefits ( N x M x L ) $188,237
Net Benefit (Cost) $188,237 Utility Program Cost per kWh Lifetime $0.0156
Benefit/Cost Ratio 2.61 Utility Program Cost per kW at Gen $8,397
Note: Dollar values represent present value of impacts accumulated over the lifetime of the measures.
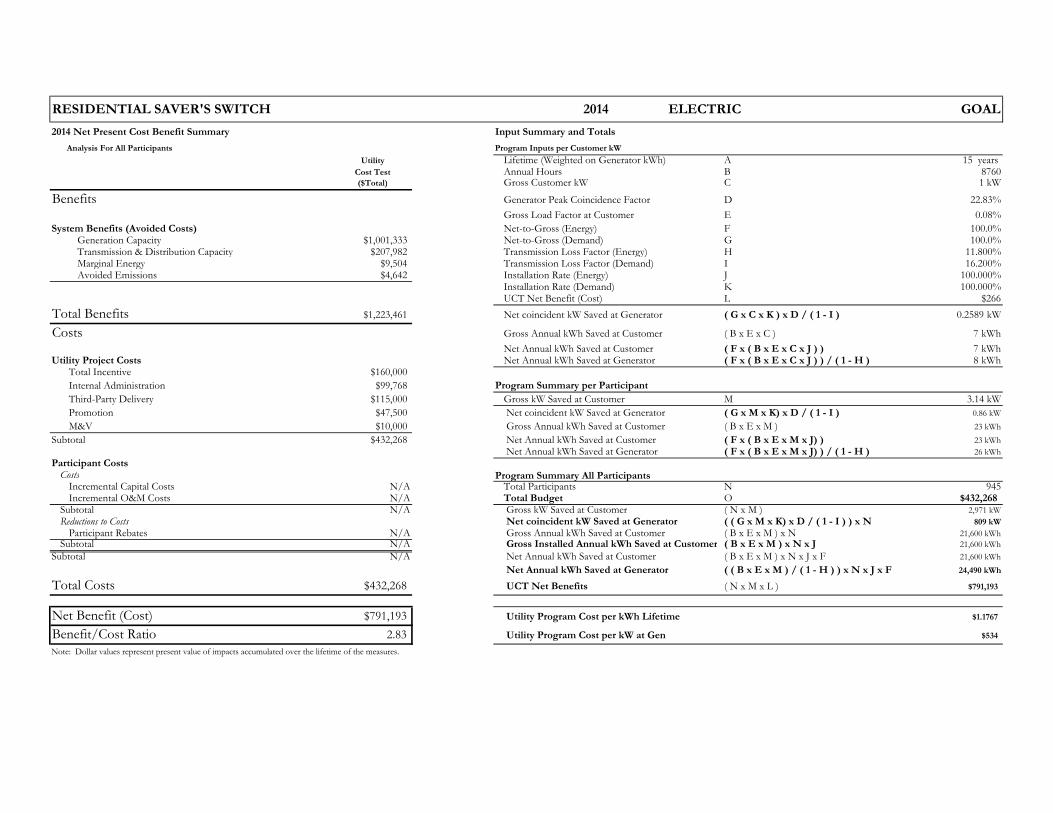
RESIDENTIAL SAVER'S SWITCH 2014 ELECTRIC GOAL
2014 Net Present Cost Benefit Summary Input Summary and Totals
Analysis For All Participants Program Inputs per Customer kW
Utility Lifetime (Weighted on Generator kWh) A 15 years Cost Test Annual Hours B 8760($Total) Gross Customer kW C 1 kW
Benefits Generator Peak Coincidence Factor D 22.83%
Gross Load Factor at Customer E 0.08%
System Benefits (Avoided Costs) Net-to-Gross (Energy) F 100.0%Generation Capacity $1,001,333 Net-to-Gross (Demand) G 100.0%Transmission & Distribution Capacity $207,982 Transmission Loss Factor (Energy) H 11.800%Marginal Energy $9,504 Transmission Loss Factor (Demand) I 16.200%Avoided Emissions $4,642 Installation Rate (Energy) J 100.000%
Installation Rate (Demand) K 100.000%UCT Net Benefit (Cost) L $266
Total Benefits $1,223,461 Net coincident kW Saved at Generator ( G x C x K ) x D / ( 1 - I ) 0.2589 kW
Costs Gross Annual kWh Saved at Customer ( B x E x C ) 7 kWh
Net Annual kWh Saved at Customer ( F x ( B x E x C x J ) ) 7 kWh Utility Project Costs Net Annual kWh Saved at Generator ( F x ( B x E x C x J ) ) / ( 1 - H ) 8 kWh
Total Incentive $160,000
Internal Administration $99,768 Program Summary per Participant
Third-Party Delivery $115,000 Gross kW Saved at Customer M 3.14 kW
Promotion $47,500 Net coincident kW Saved at Generator ( G x M x K) x D / ( 1 - I ) 0.86 kW
M&V $10,000 Gross Annual kWh Saved at Customer ( B x E x M ) 23 kWh
Subtotal $432,268 Net Annual kWh Saved at Customer ( F x ( B x E x M x J) ) 23 kWh
Net Annual kWh Saved at Generator ( F x ( B x E x M x J) ) / ( 1 - H ) 26 kWh
Participant CostsCosts Program Summary All ParticipantsIncremental Capital Costs N/A Total Participants N 945Incremental O&M Costs N/A Total Budget O $432,268
Subtotal N/A Gross kW Saved at Customer ( N x M ) 2,971 kW
Reductions to Costs Net coincident kW Saved at Generator ( ( G x M x K) x D / ( 1 - I ) ) x N 809 kW
Participant Rebates N/A Gross Annual kWh Saved at Customer ( B x E x M ) x N 21,600 kWh
Subtotal N/A Gross Installed Annual kWh Saved at Customer ( B x E x M ) x N x J 21,600 kWh
Subtotal N/A Net Annual kWh Saved at Customer ( B x E x M ) x N x J x F 21,600 kWh
Net Annual kWh Saved at Generator ( ( B x E x M ) / ( 1 - H ) ) x N x J x F 24,490 kWh
Total Costs $432,268 UCT Net Benefits ( N x M x L ) $791,193
Net Benefit (Cost) $791,193 Utility Program Cost per kWh Lifetime $1.1767
Benefit/Cost Ratio 2.83 Utility Program Cost per kW at Gen $534
Note: Dollar values represent present value of impacts accumulated over the lifetime of the measures.
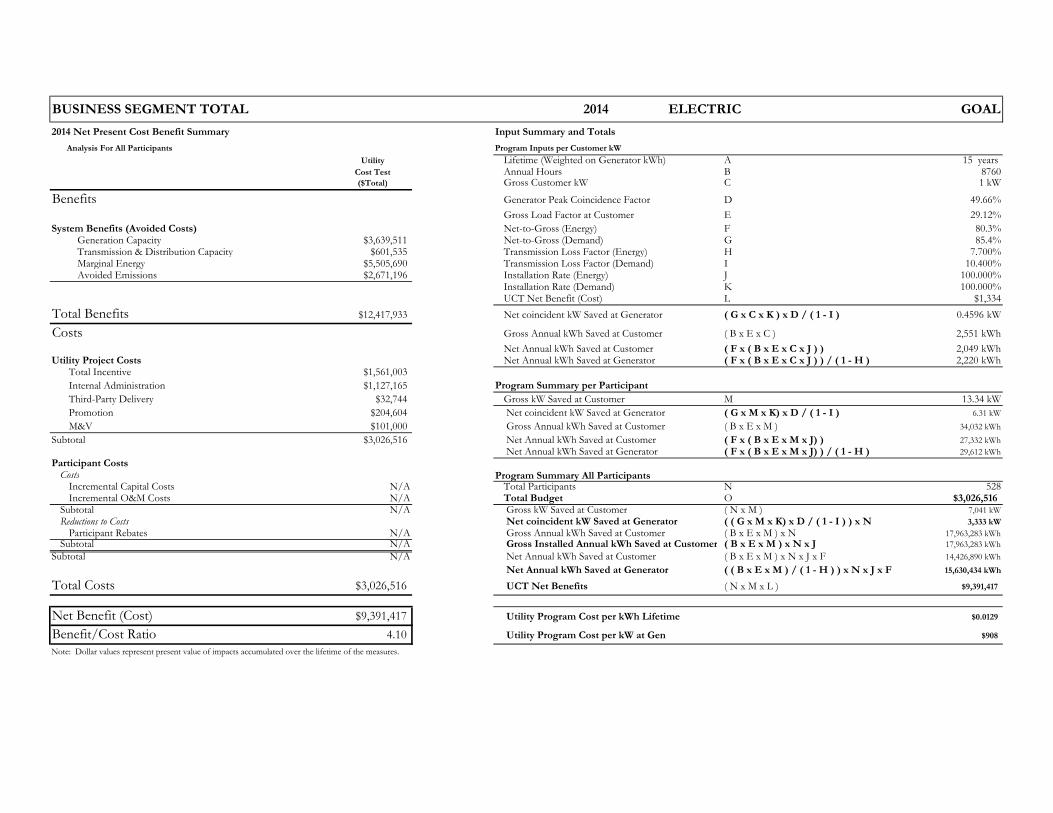
BUSINESS SEGMENT TOTAL 2014 ELECTRIC GOAL
2014 Net Present Cost Benefit Summary Input Summary and Totals
Analysis For All Participants Program Inputs per Customer kW
Utility Lifetime (Weighted on Generator kWh) A 15 years Cost Test Annual Hours B 8760($Total) Gross Customer kW C 1 kW
Benefits Generator Peak Coincidence Factor D 49.66%
Gross Load Factor at Customer E 29.12%
System Benefits (Avoided Costs) Net-to-Gross (Energy) F 80.3%Generation Capacity $3,639,511 Net-to-Gross (Demand) G 85.4%Transmission & Distribution Capacity $601,535 Transmission Loss Factor (Energy) H 7.700%Marginal Energy $5,505,690 Transmission Loss Factor (Demand) I 10.400%Avoided Emissions $2,671,196 Installation Rate (Energy) J 100.000%
Installation Rate (Demand) K 100.000%UCT Net Benefit (Cost) L $1,334
Total Benefits $12,417,933 Net coincident kW Saved at Generator ( G x C x K ) x D / ( 1 - I ) 0.4596 kW
Costs Gross Annual kWh Saved at Customer ( B x E x C ) 2,551 kWh
Net Annual kWh Saved at Customer ( F x ( B x E x C x J ) ) 2,049 kWh Utility Project Costs Net Annual kWh Saved at Generator ( F x ( B x E x C x J ) ) / ( 1 - H ) 2,220 kWh
Total Incentive $1,561,003
Internal Administration $1,127,165 Program Summary per Participant
Third-Party Delivery $32,744 Gross kW Saved at Customer M 13.34 kW
Promotion $204,604 Net coincident kW Saved at Generator ( G x M x K) x D / ( 1 - I ) 6.31 kW
M&V $101,000 Gross Annual kWh Saved at Customer ( B x E x M ) 34,032 kWh
Subtotal $3,026,516 Net Annual kWh Saved at Customer ( F x ( B x E x M x J) ) 27,332 kWh
Net Annual kWh Saved at Generator ( F x ( B x E x M x J) ) / ( 1 - H ) 29,612 kWh
Participant CostsCosts Program Summary All ParticipantsIncremental Capital Costs N/A Total Participants N 528Incremental O&M Costs N/A Total Budget O $3,026,516
Subtotal N/A Gross kW Saved at Customer ( N x M ) 7,041 kW
Reductions to Costs Net coincident kW Saved at Generator ( ( G x M x K) x D / ( 1 - I ) ) x N 3,333 kW
Participant Rebates N/A Gross Annual kWh Saved at Customer ( B x E x M ) x N 17,963,283 kWh
Subtotal N/A Gross Installed Annual kWh Saved at Customer ( B x E x M ) x N x J 17,963,283 kWh
Subtotal N/A Net Annual kWh Saved at Customer ( B x E x M ) x N x J x F 14,426,890 kWh
Net Annual kWh Saved at Generator ( ( B x E x M ) / ( 1 - H ) ) x N x J x F 15,630,434 kWh
Total Costs $3,026,516 UCT Net Benefits ( N x M x L ) $9,391,417
Net Benefit (Cost) $9,391,417 Utility Program Cost per kWh Lifetime $0.0129
Benefit/Cost Ratio 4.10 Utility Program Cost per kW at Gen $908
Note: Dollar values represent present value of impacts accumulated over the lifetime of the measures.
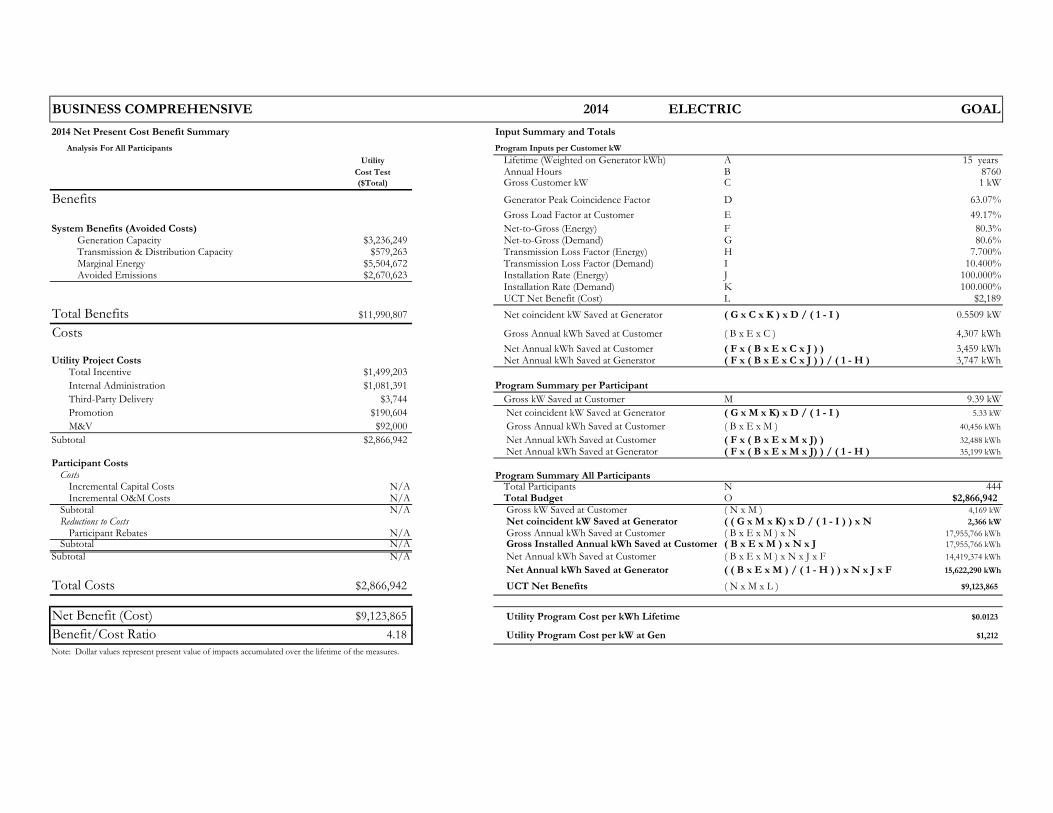
BUSINESS COMPREHENSIVE 2014 ELECTRIC GOAL
2014 Net Present Cost Benefit Summary Input Summary and Totals
Analysis For All Participants Program Inputs per Customer kW
Utility Lifetime (Weighted on Generator kWh) A 15 years Cost Test Annual Hours B 8760($Total) Gross Customer kW C 1 kW
Benefits Generator Peak Coincidence Factor D 63.07%
Gross Load Factor at Customer E 49.17%
System Benefits (Avoided Costs) Net-to-Gross (Energy) F 80.3%Generation Capacity $3,236,249 Net-to-Gross (Demand) G 80.6%Transmission & Distribution Capacity $579,263 Transmission Loss Factor (Energy) H 7.700%Marginal Energy $5,504,672 Transmission Loss Factor (Demand) I 10.400%Avoided Emissions $2,670,623 Installation Rate (Energy) J 100.000%
Installation Rate (Demand) K 100.000%UCT Net Benefit (Cost) L $2,189
Total Benefits $11,990,807 Net coincident kW Saved at Generator ( G x C x K ) x D / ( 1 - I ) 0.5509 kW
Costs Gross Annual kWh Saved at Customer ( B x E x C ) 4,307 kWh
Net Annual kWh Saved at Customer ( F x ( B x E x C x J ) ) 3,459 kWh Utility Project Costs Net Annual kWh Saved at Generator ( F x ( B x E x C x J ) ) / ( 1 - H ) 3,747 kWh
Total Incentive $1,499,203
Internal Administration $1,081,391 Program Summary per Participant
Third-Party Delivery $3,744 Gross kW Saved at Customer M 9.39 kW
Promotion $190,604 Net coincident kW Saved at Generator ( G x M x K) x D / ( 1 - I ) 5.33 kW
M&V $92,000 Gross Annual kWh Saved at Customer ( B x E x M ) 40,456 kWh
Subtotal $2,866,942 Net Annual kWh Saved at Customer ( F x ( B x E x M x J) ) 32,488 kWh
Net Annual kWh Saved at Generator ( F x ( B x E x M x J) ) / ( 1 - H ) 35,199 kWh
Participant CostsCosts Program Summary All ParticipantsIncremental Capital Costs N/A Total Participants N 444Incremental O&M Costs N/A Total Budget O $2,866,942
Subtotal N/A Gross kW Saved at Customer ( N x M ) 4,169 kW
Reductions to Costs Net coincident kW Saved at Generator ( ( G x M x K) x D / ( 1 - I ) ) x N 2,366 kW
Participant Rebates N/A Gross Annual kWh Saved at Customer ( B x E x M ) x N 17,955,766 kWh
Subtotal N/A Gross Installed Annual kWh Saved at Customer ( B x E x M ) x N x J 17,955,766 kWh
Subtotal N/A Net Annual kWh Saved at Customer ( B x E x M ) x N x J x F 14,419,374 kWh
Net Annual kWh Saved at Generator ( ( B x E x M ) / ( 1 - H ) ) x N x J x F 15,622,290 kWh
Total Costs $2,866,942 UCT Net Benefits ( N x M x L ) $9,123,865
Net Benefit (Cost) $9,123,865 Utility Program Cost per kWh Lifetime $0.0123
Benefit/Cost Ratio 4.18 Utility Program Cost per kW at Gen $1,212
Note: Dollar values represent present value of impacts accumulated over the lifetime of the measures.
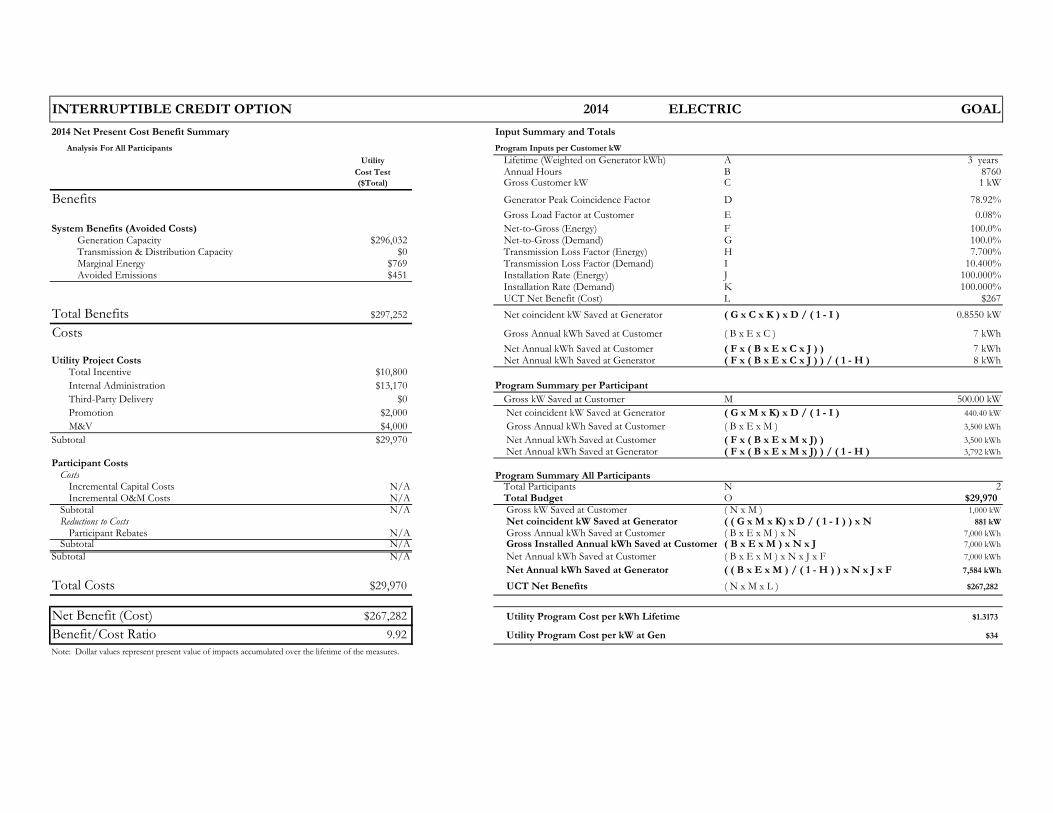
INTERRUPTIBLE CREDIT OPTION 2014 ELECTRIC GOAL
2014 Net Present Cost Benefit Summary Input Summary and Totals
Analysis For All Participants Program Inputs per Customer kW
Utility Lifetime (Weighted on Generator kWh) A 3 years Cost Test Annual Hours B 8760($Total) Gross Customer kW C 1 kW
Benefits Generator Peak Coincidence Factor D 78.92%
Gross Load Factor at Customer E 0.08%
System Benefits (Avoided Costs) Net-to-Gross (Energy) F 100.0%Generation Capacity $296,032 Net-to-Gross (Demand) G 100.0%Transmission & Distribution Capacity $0 Transmission Loss Factor (Energy) H 7.700%Marginal Energy $769 Transmission Loss Factor (Demand) I 10.400%Avoided Emissions $451 Installation Rate (Energy) J 100.000%
Installation Rate (Demand) K 100.000%UCT Net Benefit (Cost) L $267
Total Benefits $297,252 Net coincident kW Saved at Generator ( G x C x K ) x D / ( 1 - I ) 0.8550 kW
Costs Gross Annual kWh Saved at Customer ( B x E x C ) 7 kWh
Net Annual kWh Saved at Customer ( F x ( B x E x C x J ) ) 7 kWh Utility Project Costs Net Annual kWh Saved at Generator ( F x ( B x E x C x J ) ) / ( 1 - H ) 8 kWh
Total Incentive $10,800
Internal Administration $13,170 Program Summary per Participant
Third-Party Delivery $0 Gross kW Saved at Customer M 500.00 kW
Promotion $2,000 Net coincident kW Saved at Generator ( G x M x K) x D / ( 1 - I ) 440.40 kW
M&V $4,000 Gross Annual kWh Saved at Customer ( B x E x M ) 3,500 kWh
Subtotal $29,970 Net Annual kWh Saved at Customer ( F x ( B x E x M x J) ) 3,500 kWh
Net Annual kWh Saved at Generator ( F x ( B x E x M x J) ) / ( 1 - H ) 3,792 kWh
Participant CostsCosts Program Summary All ParticipantsIncremental Capital Costs N/A Total Participants N 2Incremental O&M Costs N/A Total Budget O $29,970
Subtotal N/A Gross kW Saved at Customer ( N x M ) 1,000 kW
Reductions to Costs Net coincident kW Saved at Generator ( ( G x M x K) x D / ( 1 - I ) ) x N 881 kW
Participant Rebates N/A Gross Annual kWh Saved at Customer ( B x E x M ) x N 7,000 kWh
Subtotal N/A Gross Installed Annual kWh Saved at Customer ( B x E x M ) x N x J 7,000 kWh
Subtotal N/A Net Annual kWh Saved at Customer ( B x E x M ) x N x J x F 7,000 kWh
Net Annual kWh Saved at Generator ( ( B x E x M ) / ( 1 - H ) ) x N x J x F 7,584 kWh
Total Costs $29,970 UCT Net Benefits ( N x M x L ) $267,282
Net Benefit (Cost) $267,282 Utility Program Cost per kWh Lifetime $1.3173
Benefit/Cost Ratio 9.92 Utility Program Cost per kW at Gen $34
Note: Dollar values represent present value of impacts accumulated over the lifetime of the measures.
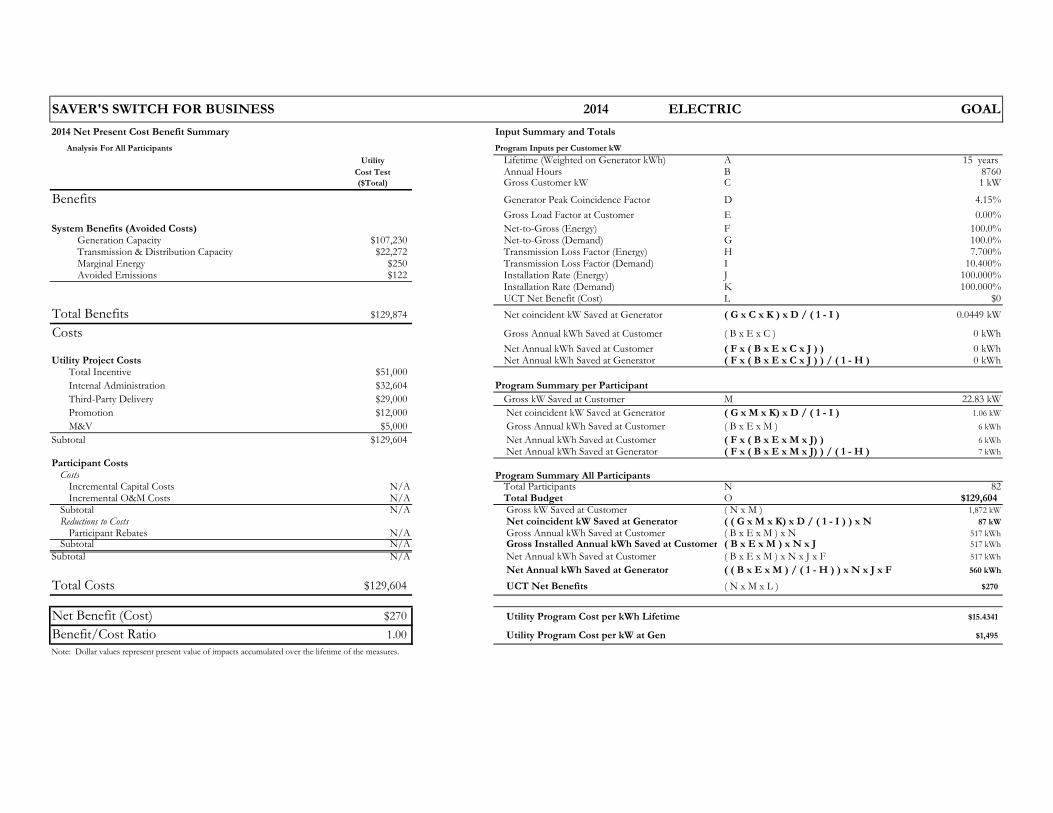
SAVER'S SWITCH FOR BUSINESS 2014 ELECTRIC GOAL
2014 Net Present Cost Benefit Summary Input Summary and Totals
Analysis For All Participants Program Inputs per Customer kW
Utility Lifetime (Weighted on Generator kWh) A 15 years Cost Test Annual Hours B 8760($Total) Gross Customer kW C 1 kW
Benefits Generator Peak Coincidence Factor D 4.15%
Gross Load Factor at Customer E 0.00%
System Benefits (Avoided Costs) Net-to-Gross (Energy) F 100.0%Generation Capacity $107,230 Net-to-Gross (Demand) G 100.0%Transmission & Distribution Capacity $22,272 Transmission Loss Factor (Energy) H 7.700%Marginal Energy $250 Transmission Loss Factor (Demand) I 10.400%Avoided Emissions $122 Installation Rate (Energy) J 100.000%
Installation Rate (Demand) K 100.000%UCT Net Benefit (Cost) L $0
Total Benefits $129,874 Net coincident kW Saved at Generator ( G x C x K ) x D / ( 1 - I ) 0.0449 kW
Costs Gross Annual kWh Saved at Customer ( B x E x C ) 0 kWh
Net Annual kWh Saved at Customer ( F x ( B x E x C x J ) ) 0 kWh Utility Project Costs Net Annual kWh Saved at Generator ( F x ( B x E x C x J ) ) / ( 1 - H ) 0 kWh
Total Incentive $51,000
Internal Administration $32,604 Program Summary per Participant
Third-Party Delivery $29,000 Gross kW Saved at Customer M 22.83 kW
Promotion $12,000 Net coincident kW Saved at Generator ( G x M x K) x D / ( 1 - I ) 1.06 kW
M&V $5,000 Gross Annual kWh Saved at Customer ( B x E x M ) 6 kWh
Subtotal $129,604 Net Annual kWh Saved at Customer ( F x ( B x E x M x J) ) 6 kWh
Net Annual kWh Saved at Generator ( F x ( B x E x M x J) ) / ( 1 - H ) 7 kWh
Participant CostsCosts Program Summary All ParticipantsIncremental Capital Costs N/A Total Participants N 82Incremental O&M Costs N/A Total Budget O $129,604
Subtotal N/A Gross kW Saved at Customer ( N x M ) 1,872 kW
Reductions to Costs Net coincident kW Saved at Generator ( ( G x M x K) x D / ( 1 - I ) ) x N 87 kW
Participant Rebates N/A Gross Annual kWh Saved at Customer ( B x E x M ) x N 517 kWh
Subtotal N/A Gross Installed Annual kWh Saved at Customer ( B x E x M ) x N x J 517 kWh
Subtotal N/A Net Annual kWh Saved at Customer ( B x E x M ) x N x J x F 517 kWh
Net Annual kWh Saved at Generator ( ( B x E x M ) / ( 1 - H ) ) x N x J x F 560 kWh
Total Costs $129,604 UCT Net Benefits ( N x M x L ) $270
Net Benefit (Cost) $270 Utility Program Cost per kWh Lifetime $15.4341
Benefit/Cost Ratio 1.00 Utility Program Cost per kW at Gen $1,495
Note: Dollar values represent present value of impacts accumulated over the lifetime of the measures.
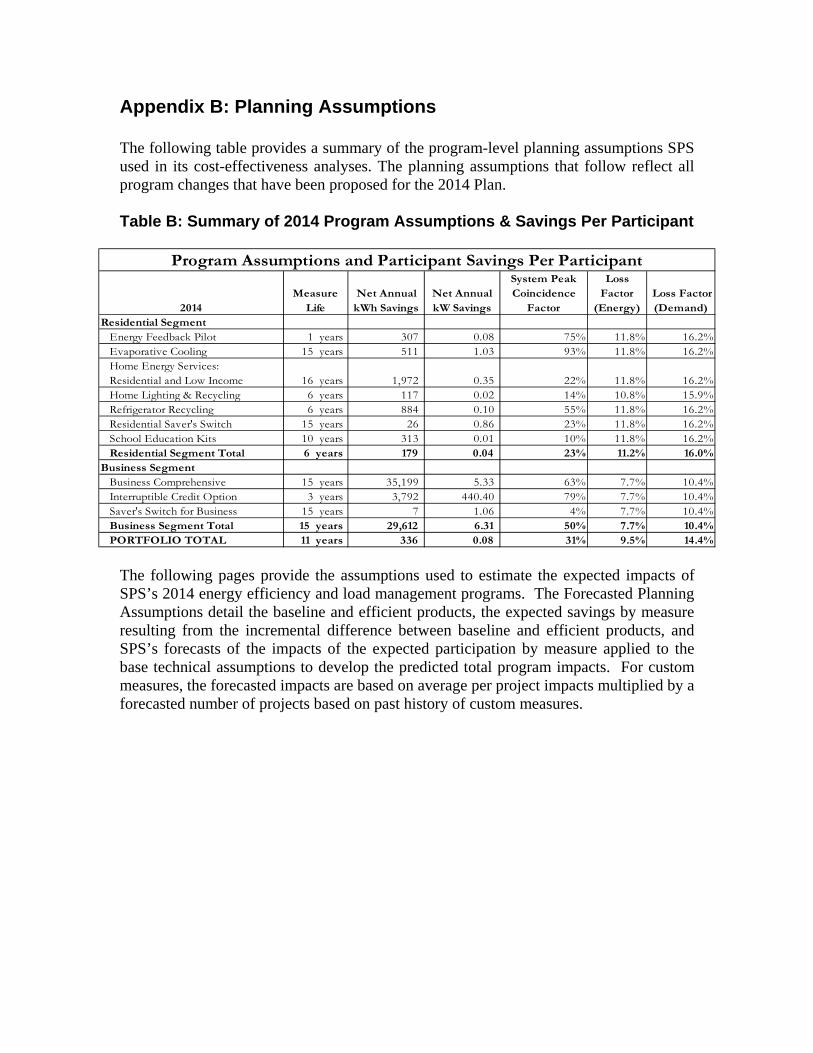
Appendix B: Planning Assumptions The following table provides a summary of the program-level planning assumptions SPS used in its cost-effectiveness analyses. The planning assumptions that follow reflect all program changes that have been proposed for the 2014 Plan. Table B: Summary of 2014 Program Assumptions & Savings Per Participant
The following pages provide the assumptions used to estimate the expected impacts of SPS’s 2014 energy efficiency and load management programs. The Forecasted Planning Assumptions detail the baseline and efficient products, the expected savings by measure resulting from the incremental difference between baseline and efficient products, and SPS’s forecasts of the impacts of the expected participation by measure applied to the base technical assumptions to develop the predicted total program impacts. For custom measures, the forecasted impacts are based on average per project impacts multiplied by a forecasted number of projects based on past history of custom measures.
2014Measure
LifeNet Annual kWh Savings
Net Annual kW Savings
System Peak Coincidence
Factor
Loss Factor
(Energy) Loss Factor (Demand)
Residential Segment Energy Feedback Pilot 1 years 307 0.08 75% 11.8% 16.2%Evaporative Cooling 15 years 511 1.03 93% 11.8% 16.2%Home Energy Services: Residential and Low Income 16 years 1,972 0.35 22% 11.8% 16.2%Home Lighting & Recycling 6 years 117 0.02 14% 10.8% 15.9%Refrigerator Recycling 6 years 884 0.10 55% 11.8% 16.2%Residential Saver's Switch 15 years 26 0.86 23% 11.8% 16.2%School Education Kits 10 years 313 0.01 10% 11.8% 16.2%Residential Segment Total 6 years 179 0.04 23% 11.2% 16.0%
Business SegmentBusiness Comprehensive 15 years 35,199 5.33 63% 7.7% 10.4%Interruptible Credit Option 3 years 3,792 440.40 79% 7.7% 10.4%Saver's Switch for Business 15 years 7 1.06 4% 7.7% 10.4%Business Segment Total 15 years 29,612 6.31 50% 7.7% 10.4%PORTFOLIO TOTAL 11 years 336 0.08 31% 9.5% 14.4%
Program Assumptions and Participant Savings Per Participant
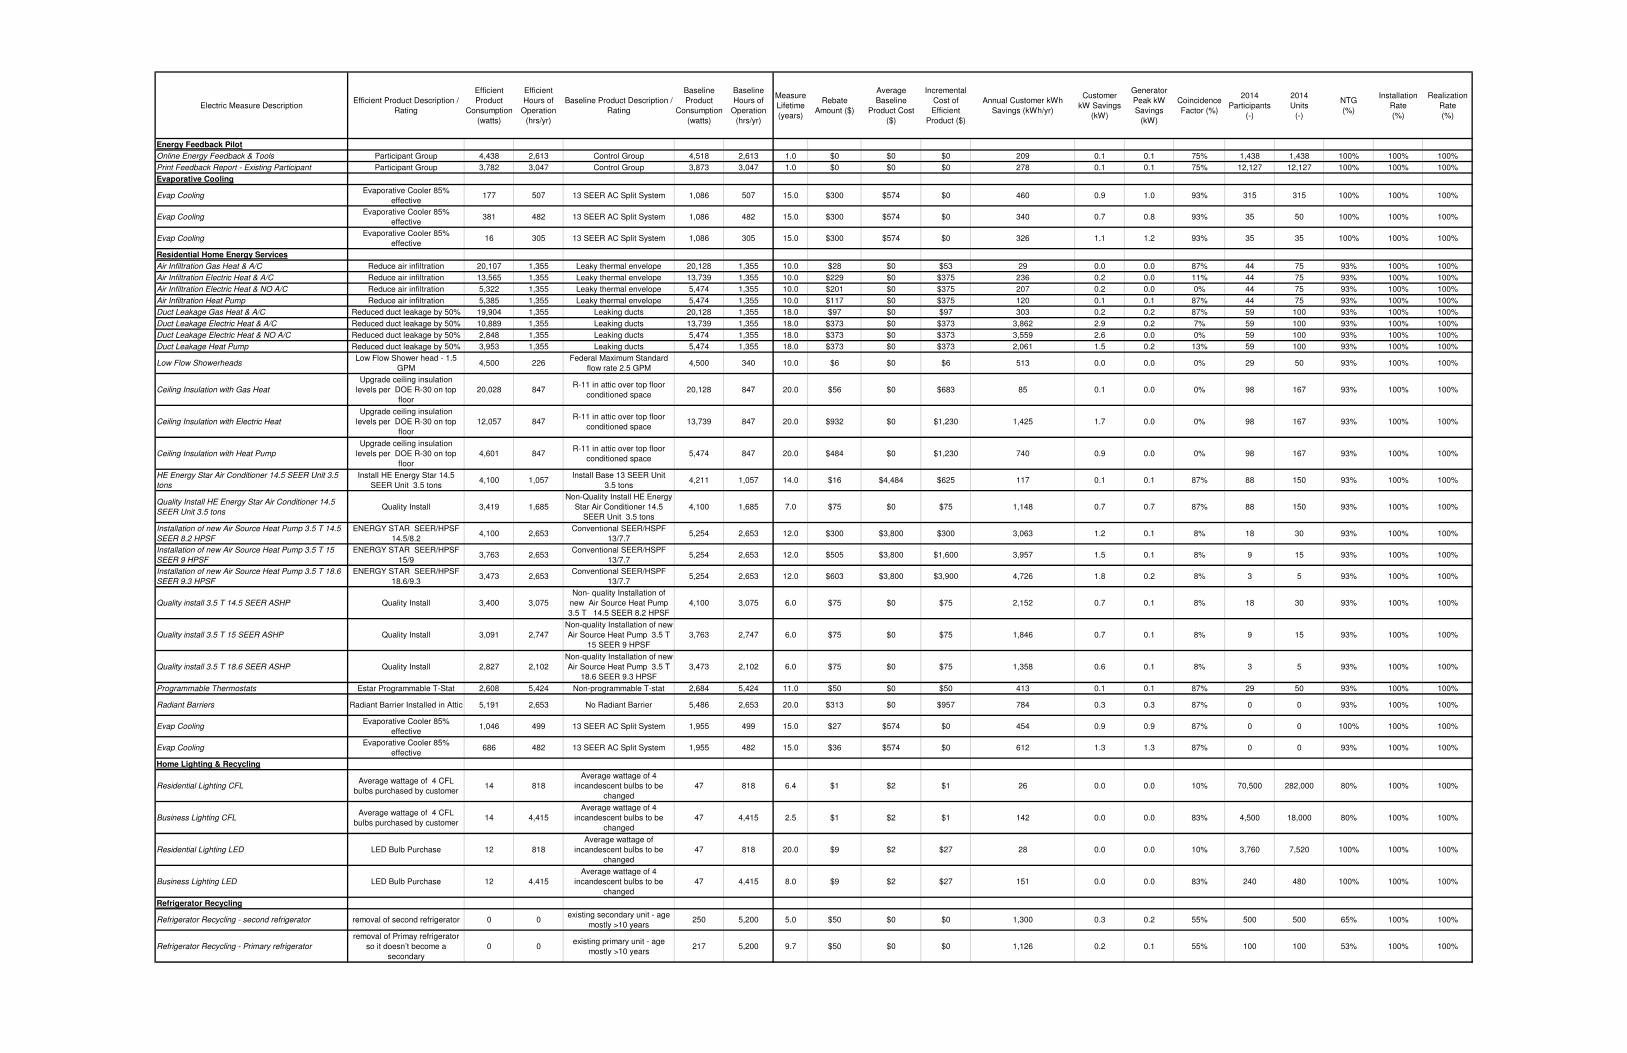
Electric Measure DescriptionEfficient Product Description /
Rating
Efficient
Product
Consumption
(watts)
Efficient
Hours of
Operation
(hrs/yr)
Baseline Product Description /
Rating
Baseline
Product
Consumption
(watts)
Baseline
Hours of
Operation
(hrs/yr)
Measure
Lifetime
(years)
Rebate
Amount ($)
Average
Baseline
Product Cost
($)
Incremental
Cost of
Efficient
Product ($)
Annual Customer kWh
Savings (kWh/yr)
Customer
kW Savings
(kW)
Generator
Peak kW
Savings
(kW)
Coincidence
Factor (%)
2014
Participants
(-)
2014
Units
(-)
NTG
(%)
Installation
Rate
(%)
Realization
Rate
(%)
Energy Feedback Pilot 0 0 0 0 0 0.0 $0 $0 $0 0 0.0 0.0 0% 0 0 0% 0% 100%
Online Energy Feedback & Tools Participant Group 4,438 2,613 Control Group 4,518 2,613 1.0 $0 $0 $0 209 0.1 0.1 75% 1,438 1,438 100% 100% 100%
Print Feedback Report - Existing Participant Participant Group 3,782 3,047 Control Group 3,873 3,047 1.0 $0 $0 $0 278 0.1 0.1 75% 12,127 12,127 100% 100% 100%
Evaporative Cooling 0 0 0 0 0.0 $0 $0 $0 0 0.0 0.0 0% 0 0 0% 0% 100%
Evap CoolingEvaporative Cooler 85%
effective177 507 13 SEER AC Split System 1,086 507 15.0 $300 $574 $0 460 0.9 1.0 93% 315 315 100% 100% 100%
Evap CoolingEvaporative Cooler 85%
effective381 482 13 SEER AC Split System 1,086 482 15.0 $300 $574 $0 340 0.7 0.8 93% 35 50 100% 100% 100%
Evap CoolingEvaporative Cooler 85%
effective16 305 13 SEER AC Split System 1,086 305 15.0 $300 $574 $0 326 1.1 1.2 93% 35 35 100% 100% 100%
Residential Home Energy Services 0 0 0 0 0.0 $0 $0 $0 0 0.0 0.0 0% 0 0 0% 0% 100%
Air Infiltration Gas Heat & A/C Reduce air infiltration 20,107 1,355 Leaky thermal envelope 20,128 1,355 10.0 $28 $0 $53 29 0.0 0.0 87% 44 75 93% 100% 100%
Air Infiltration Electric Heat & A/C Reduce air infiltration 13,565 1,355 Leaky thermal envelope 13,739 1,355 10.0 $229 $0 $375 236 0.2 0.0 11% 44 75 93% 100% 100%
Air Infiltration Electric Heat & NO A/C Reduce air infiltration 5,322 1,355 Leaky thermal envelope 5,474 1,355 10.0 $201 $0 $375 207 0.2 0.0 0% 44 75 93% 100% 100%
Air Infiltration Heat Pump Reduce air infiltration 5,385 1,355 Leaky thermal envelope 5,474 1,355 10.0 $117 $0 $375 120 0.1 0.1 87% 44 75 93% 100% 100%
Duct Leakage Gas Heat & A/C Reduced duct leakage by 50% 19,904 1,355 Leaking ducts 20,128 1,355 18.0 $97 $0 $97 303 0.2 0.2 87% 59 100 93% 100% 100%
Duct Leakage Electric Heat & A/C Reduced duct leakage by 50% 10,889 1,355 Leaking ducts 13,739 1,355 18.0 $373 $0 $373 3,862 2.9 0.2 7% 59 100 93% 100% 100%
Duct Leakage Electric Heat & NO A/C Reduced duct leakage by 50% 2,848 1,355 Leaking ducts 5,474 1,355 18.0 $373 $0 $373 3,559 2.6 0.0 0% 59 100 93% 100% 100%
Duct Leakage Heat Pump Reduced duct leakage by 50% 3,953 1,355 Leaking ducts 5,474 1,355 18.0 $373 $0 $373 2,061 1.5 0.2 13% 59 100 93% 100% 100%
Low Flow ShowerheadsLow Flow Shower head - 1.5
GPM 4,500 226
Federal Maximum Standard
flow rate 2.5 GPM4,500 340 10.0 $6 $0 $6 513 0.0 0.0 0% 29 50 93% 100% 100%
Ceiling Insulation with Gas Heat
Upgrade ceiling insulation
levels per DOE R-30 on top
floor
20,028 847R-11 in attic over top floor
conditioned space20,128 847 20.0 $56 $0 $683 85 0.1 0.0 0% 98 167 93% 100% 100%
Ceiling Insulation with Electric Heat
Upgrade ceiling insulation
levels per DOE R-30 on top
floor
12,057 847R-11 in attic over top floor
conditioned space13,739 847 20.0 $932 $0 $1,230 1,425 1.7 0.0 0% 98 167 93% 100% 100%
Ceiling Insulation with Heat Pump
Upgrade ceiling insulation
levels per DOE R-30 on top
floor
4,601 847R-11 in attic over top floor
conditioned space5,474 847 20.0 $484 $0 $1,230 740 0.9 0.0 0% 98 167 93% 100% 100%
HE Energy Star Air Conditioner 14.5 SEER Unit 3.5
tons
Install HE Energy Star 14.5
SEER Unit 3.5 tons4,100 1,057
Install Base 13 SEER Unit
3.5 tons4,211 1,057 14.0 $16 $4,484 $625 117 0.1 0.1 87% 88 150 93% 100% 100%
Quality Install HE Energy Star Air Conditioner 14.5
SEER Unit 3.5 tonsQuality Install 3,419 1,685
Non-Quality Install HE Energy
Star Air Conditioner 14.5
SEER Unit 3.5 tons
4,100 1,685 7.0 $75 $0 $75 1,148 0.7 0.7 87% 88 150 93% 100% 100%
Installation of new Air Source Heat Pump 3.5 T 14.5
SEER 8.2 HPSF
ENERGY STAR SEER/HPSF
14.5/8.24,100 2,653
Conventional SEER/HSPF
13/7.75,254 2,653 12.0 $300 $3,800 $300 3,063 1.2 0.1 8% 18 30 93% 100% 100%
Installation of new Air Source Heat Pump 3.5 T 15
SEER 9 HPSF
ENERGY STAR SEER/HPSF
15/93,763 2,653
Conventional SEER/HSPF
13/7.75,254 2,653 12.0 $505 $3,800 $1,600 3,957 1.5 0.1 8% 9 15 93% 100% 100%
Installation of new Air Source Heat Pump 3.5 T 18.6
SEER 9.3 HPSF
ENERGY STAR SEER/HPSF
18.6/9.33,473 2,653
Conventional SEER/HSPF
13/7.75,254 2,653 12.0 $603 $3,800 $3,900 4,726 1.8 0.2 8% 3 5 93% 100% 100%
Quality install 3.5 T 14.5 SEER ASHP Quality Install 3,400 3,075
Non- quality Installation of
new Air Source Heat Pump
3.5 T 14.5 SEER 8.2 HPSF
4,100 3,075 6.0 $75 $0 $75 2,152 0.7 0.1 8% 18 30 93% 100% 100%
Quality install 3.5 T 15 SEER ASHP Quality Install 3,091 2,747
Non-quality Installation of new
Air Source Heat Pump 3.5 T
15 SEER 9 HPSF
3,763 2,747 6.0 $75 $0 $75 1,846 0.7 0.1 8% 9 15 93% 100% 100%
Quality install 3.5 T 18.6 SEER ASHP Quality Install 2,827 2,102
Non-quality Installation of new
Air Source Heat Pump 3.5 T
18.6 SEER 9.3 HPSF
3,473 2,102 6.0 $75 $0 $75 1,358 0.6 0.1 8% 3 5 93% 100% 100%
Programmable Thermostats Estar Programmable T-Stat 2,608 5,424 Non-programmable T-stat 2,684 5,424 11.0 $50 $0 $50 413 0.1 0.1 87% 29 50 93% 100% 100%
Radiant Barriers Radiant Barrier Installed in Attic 5,191 2,653 No Radiant Barrier 5,486 2,653 20.0 $313 $0 $957 784 0.3 0.3 87% 0 0 93% 100% 100%
Evap CoolingEvaporative Cooler 85%
effective1,046 499 13 SEER AC Split System 1,955 499 15.0 $27 $574 $0 454 0.9 0.9 87% 0 0 100% 100% 100%
Evap CoolingEvaporative Cooler 85%
effective686 482 13 SEER AC Split System 1,955 482 15.0 $36 $574 $0 612 1.3 1.3 87% 0 0 93% 100% 100%
Home Lighting & Recycling 0 0 0 0 0.0 $0 $0 $0 0 0.0 0.0 0% 0 0 0% 0% 100%
Residential Lighting CFLAverage wattage of 4 CFL
bulbs purchased by customer14 818
Average wattage of 4
incandescent bulbs to be
changed
47 818 6.4 $1 $2 $1 26 0.0 0.0 10% 70,500 282,000 80% 100% 100%
Business Lighting CFLAverage wattage of 4 CFL
bulbs purchased by customer14 4,415
Average wattage of 4
incandescent bulbs to be
changed
47 4,415 2.5 $1 $2 $1 142 0.0 0.0 83% 4,500 18,000 80% 100% 100%
Residential Lighting LED LED Bulb Purchase 12 818
Average wattage of
incandescent bulbs to be
changed
47 818 20.0 $9 $2 $27 28 0.0 0.0 10% 3,760 7,520 100% 100% 100%
Business Lighting LED LED Bulb Purchase 12 4,415
Average wattage of 4
incandescent bulbs to be
changed
47 4,415 8.0 $9 $2 $27 151 0.0 0.0 83% 240 480 100% 100% 100%
Refrigerator Recycling 0 0 0 0 0.0 $0 $0 $0 0 0.0 0.0 0% 0 0 0% 0% 100%
Refrigerator Recycling - second refrigerator removal of second refrigerator 0 0existing secondary unit - age
mostly >10 years250 5,200 5.0 $50 $0 $0 1,300 0.3 0.2 55% 500 500 65% 100% 100%
Refrigerator Recycling - Primary refrigerator
removal of Primay refrigerator
so it doesn’t become a
secondary
0 0existing primary unit - age
mostly >10 years217 5,200 9.7 $50 $0 $0 1,126 0.2 0.1 55% 100 100 53% 100% 100%
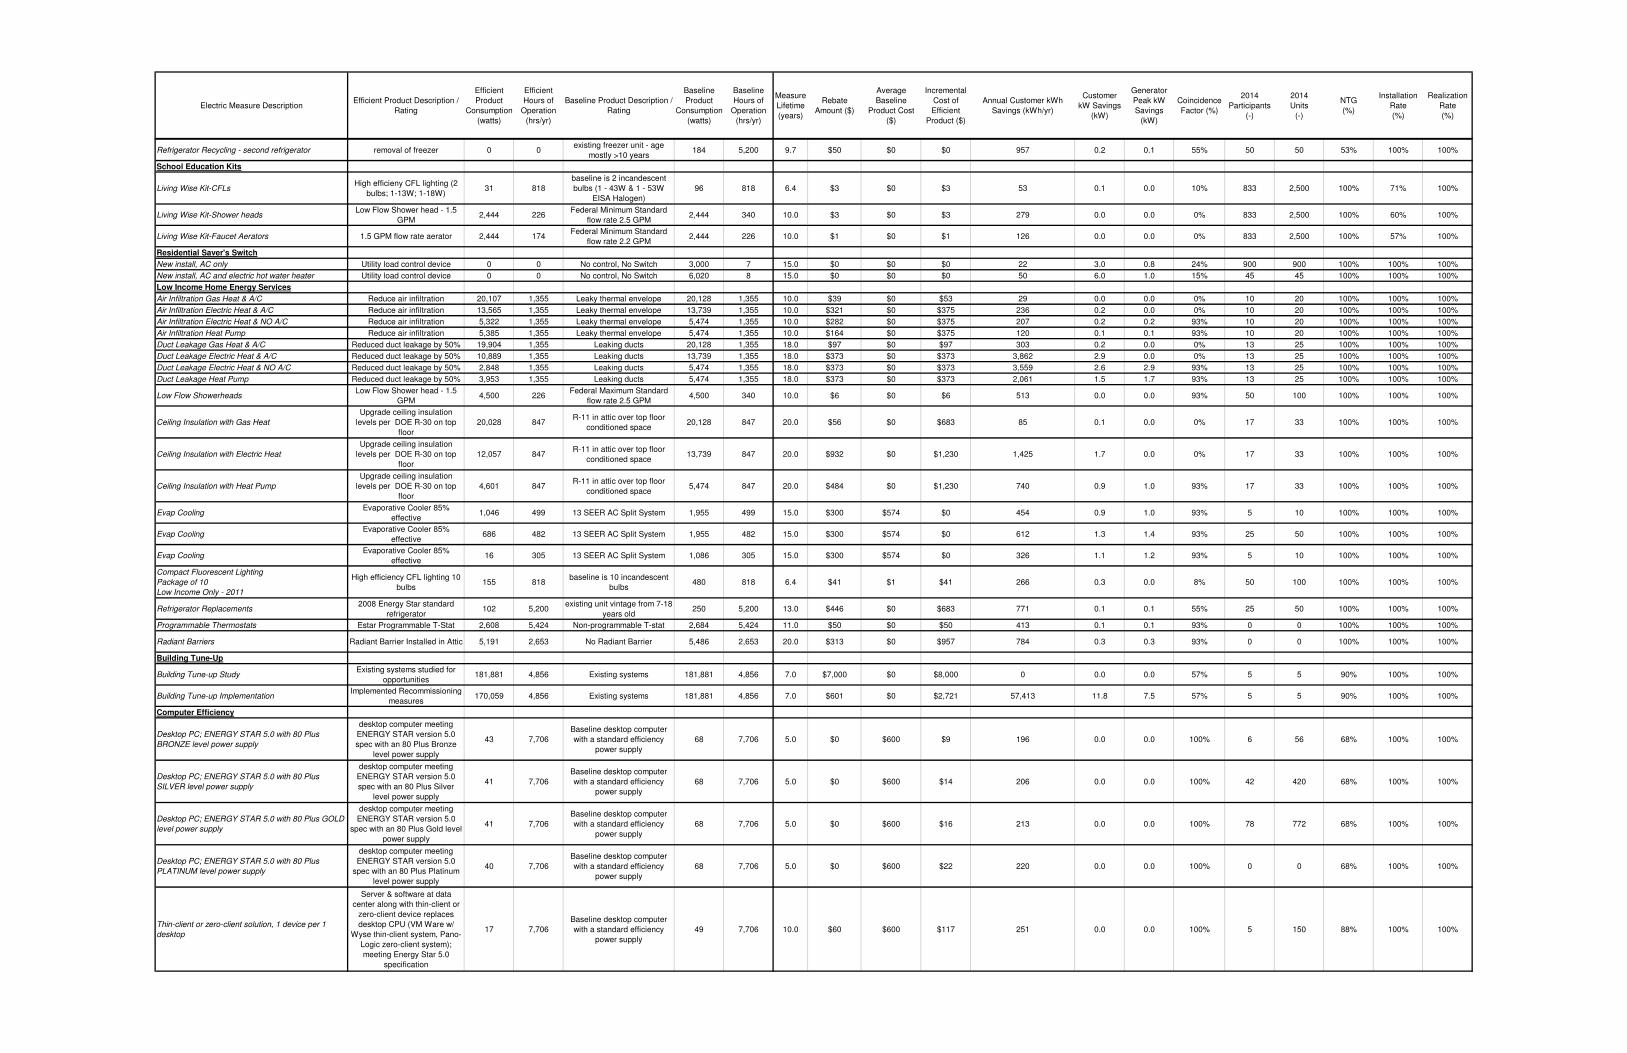
Electric Measure DescriptionEfficient Product Description /
Rating
Efficient
Product
Consumption
(watts)
Efficient
Hours of
Operation
(hrs/yr)
Baseline Product Description /
Rating
Baseline
Product
Consumption
(watts)
Baseline
Hours of
Operation
(hrs/yr)
Measure
Lifetime
(years)
Rebate
Amount ($)
Average
Baseline
Product Cost
($)
Incremental
Cost of
Efficient
Product ($)
Annual Customer kWh
Savings (kWh/yr)
Customer
kW Savings
(kW)
Generator
Peak kW
Savings
(kW)
Coincidence
Factor (%)
2014
Participants
(-)
2014
Units
(-)
NTG
(%)
Installation
Rate
(%)
Realization
Rate
(%)
Refrigerator Recycling - second refrigerator removal of freezer 0 0existing freezer unit - age
mostly >10 years184 5,200 9.7 $50 $0 $0 957 0.2 0.1 55% 50 50 53% 100% 100%
School Education Kits 0 0 0 0 0.0 $0 $0 $0 0 0.0 0.0 0% 0 0 0% 0% 100%
Living Wise Kit-CFLsHigh efficieny CFL lighting (2
bulbs; 1-13W; 1-18W)31 818
baseline is 2 incandescent
bulbs (1 - 43W & 1 - 53W
EISA Halogen)
96 818 6.4 $3 $0 $3 53 0.1 0.0 10% 833 2,500 100% 71% 100%
Living Wise Kit-Shower headsLow Flow Shower head - 1.5
GPM 2,444 226
Federal Minimum Standard
flow rate 2.5 GPM2,444 340 10.0 $3 $0 $3 279 0.0 0.0 0% 833 2,500 100% 60% 100%
Living Wise Kit-Faucet Aerators 1.5 GPM flow rate aerator 2,444 174Federal Minimum Standard
flow rate 2.2 GPM2,444 226 10.0 $1 $0 $1 126 0.0 0.0 0% 833 2,500 100% 57% 100%
Residential Saver's Switch 0 0 0 0 0.0 $0 $0 $0 0 0.0 0.0 0% 0 0 0% 0% 100%
New install, AC only Utility load control device 0 0 No control, No Switch 3,000 7 15.0 $0 $0 $0 22 3.0 0.8 24% 900 900 100% 100% 100%
New install, AC and electric hot water heater Utility load control device 0 0 No control, No Switch 6,020 8 15.0 $0 $0 $0 50 6.0 1.0 15% 45 45 100% 100% 100%
Low Income Home Energy Services 0 0 0 0 0.0 $0 $0 $0 0 0.0 0.0 0% 0 0 0% 0% 100%
Air Infiltration Gas Heat & A/C Reduce air infiltration 20,107 1,355 Leaky thermal envelope 20,128 1,355 10.0 $39 $0 $53 29 0.0 0.0 0% 10 20 100% 100% 100%
Air Infiltration Electric Heat & A/C Reduce air infiltration 13,565 1,355 Leaky thermal envelope 13,739 1,355 10.0 $321 $0 $375 236 0.2 0.0 0% 10 20 100% 100% 100%
Air Infiltration Electric Heat & NO A/C Reduce air infiltration 5,322 1,355 Leaky thermal envelope 5,474 1,355 10.0 $282 $0 $375 207 0.2 0.2 93% 10 20 100% 100% 100%
Air Infiltration Heat Pump Reduce air infiltration 5,385 1,355 Leaky thermal envelope 5,474 1,355 10.0 $164 $0 $375 120 0.1 0.1 93% 10 20 100% 100% 100%
Duct Leakage Gas Heat & A/C Reduced duct leakage by 50% 19,904 1,355 Leaking ducts 20,128 1,355 18.0 $97 $0 $97 303 0.2 0.0 0% 13 25 100% 100% 100%
Duct Leakage Electric Heat & A/C Reduced duct leakage by 50% 10,889 1,355 Leaking ducts 13,739 1,355 18.0 $373 $0 $373 3,862 2.9 0.0 0% 13 25 100% 100% 100%
Duct Leakage Electric Heat & NO A/C Reduced duct leakage by 50% 2,848 1,355 Leaking ducts 5,474 1,355 18.0 $373 $0 $373 3,559 2.6 2.9 93% 13 25 100% 100% 100%
Duct Leakage Heat Pump Reduced duct leakage by 50% 3,953 1,355 Leaking ducts 5,474 1,355 18.0 $373 $0 $373 2,061 1.5 1.7 93% 13 25 100% 100% 100%
Low Flow ShowerheadsLow Flow Shower head - 1.5
GPM 4,500 226
Federal Maximum Standard
flow rate 2.5 GPM4,500 340 10.0 $6 $0 $6 513 0.0 0.0 93% 50 100 100% 100% 100%
Ceiling Insulation with Gas Heat
Upgrade ceiling insulation
levels per DOE R-30 on top
floor
20,028 847R-11 in attic over top floor
conditioned space20,128 847 20.0 $56 $0 $683 85 0.1 0.0 0% 17 33 100% 100% 100%
Ceiling Insulation with Electric Heat
Upgrade ceiling insulation
levels per DOE R-30 on top
floor
12,057 847R-11 in attic over top floor
conditioned space13,739 847 20.0 $932 $0 $1,230 1,425 1.7 0.0 0% 17 33 100% 100% 100%
Ceiling Insulation with Heat Pump
Upgrade ceiling insulation
levels per DOE R-30 on top
floor
4,601 847R-11 in attic over top floor
conditioned space5,474 847 20.0 $484 $0 $1,230 740 0.9 1.0 93% 17 33 100% 100% 100%
Evap CoolingEvaporative Cooler 85%
effective1,046 499 13 SEER AC Split System 1,955 499 15.0 $300 $574 $0 454 0.9 1.0 93% 5 10 100% 100% 100%
Evap CoolingEvaporative Cooler 85%
effective686 482 13 SEER AC Split System 1,955 482 15.0 $300 $574 $0 612 1.3 1.4 93% 25 50 100% 100% 100%
Evap CoolingEvaporative Cooler 85%
effective16 305 13 SEER AC Split System 1,086 305 15.0 $300 $574 $0 326 1.1 1.2 93% 5 10 100% 100% 100%
Compact Fluorescent Lighting
Package of 10
Low Income Only - 2011
High efficiency CFL lighting 10
bulbs155 818
baseline is 10 incandescent
bulbs480 818 6.4 $41 $1 $41 266 0.3 0.0 8% 50 100 100% 100% 100%
Refrigerator Replacements2008 Energy Star standard
refrigerator102 5,200
existing unit vintage from 7-18
years old250 5,200 13.0 $446 $0 $683 771 0.1 0.1 55% 25 50 100% 100% 100%
Programmable Thermostats Estar Programmable T-Stat 2,608 5,424 Non-programmable T-stat 2,684 5,424 11.0 $50 $0 $50 413 0.1 0.1 93% 0 0 100% 100% 100%
Radiant Barriers Radiant Barrier Installed in Attic 5,191 2,653 No Radiant Barrier 5,486 2,653 20.0 $313 $0 $957 784 0.3 0.3 93% 0 0 100% 100% 100%
Building Tune-Up 0 0 0 0 0.0 $0 $0 $0 0 0.0 0.0 0% 0 0 0% 0% 100%
Building Tune-up StudyExisting systems studied for
opportunities181,881 4,856 Existing systems 181,881 4,856 7.0 $7,000 $0 $8,000 0 0.0 0.0 57% 5 5 90% 100% 100%
Building Tune-up ImplementationImplemented Recommissioning
measures170,059 4,856 Existing systems 181,881 4,856 7.0 $601 $0 $2,721 57,413 11.8 7.5 57% 5 5 90% 100% 100%
Computer Efficiency 0 0 0 0 0.0 $0 $0 $0 0 0.0 0.0 0% 0 0 0% 0% 100%
Desktop PC; ENERGY STAR 5.0 with 80 Plus
BRONZE level power supply
desktop computer meeting
ENERGY STAR version 5.0
spec with an 80 Plus Bronze
level power supply
43 7,706
Baseline desktop computer
with a standard efficiency
power supply
68 7,706 5.0 $0 $600 $9 196 0.0 0.0 100% 6 56 68% 100% 100%
Desktop PC; ENERGY STAR 5.0 with 80 Plus
SILVER level power supply
desktop computer meeting
ENERGY STAR version 5.0
spec with an 80 Plus Silver
level power supply
41 7,706
Baseline desktop computer
with a standard efficiency
power supply
68 7,706 5.0 $0 $600 $14 206 0.0 0.0 100% 42 420 68% 100% 100%
Desktop PC; ENERGY STAR 5.0 with 80 Plus GOLD
level power supply
desktop computer meeting
ENERGY STAR version 5.0
spec with an 80 Plus Gold level
power supply
41 7,706
Baseline desktop computer
with a standard efficiency
power supply
68 7,706 5.0 $0 $600 $16 213 0.0 0.0 100% 78 772 68% 100% 100%
Desktop PC; ENERGY STAR 5.0 with 80 Plus
PLATINUM level power supply
desktop computer meeting
ENERGY STAR version 5.0
spec with an 80 Plus Platinum
level power supply
40 7,706
Baseline desktop computer
with a standard efficiency
power supply
68 7,706 5.0 $0 $600 $22 220 0.0 0.0 100% 0 0 68% 100% 100%
Thin-client or zero-client solution, 1 device per 1
desktop
Server & software at data
center along with thin-client or
zero-client device replaces
desktop CPU (VM Ware w/
Wyse thin-client system, Pano-
Logic zero-client system);
meeting Energy Star 5.0
specification
17 7,706
Baseline desktop computer
with a standard efficiency
power supply
49 7,706 10.0 $60 $600 $117 251 0.0 0.0 100% 5 150 88% 100% 100%
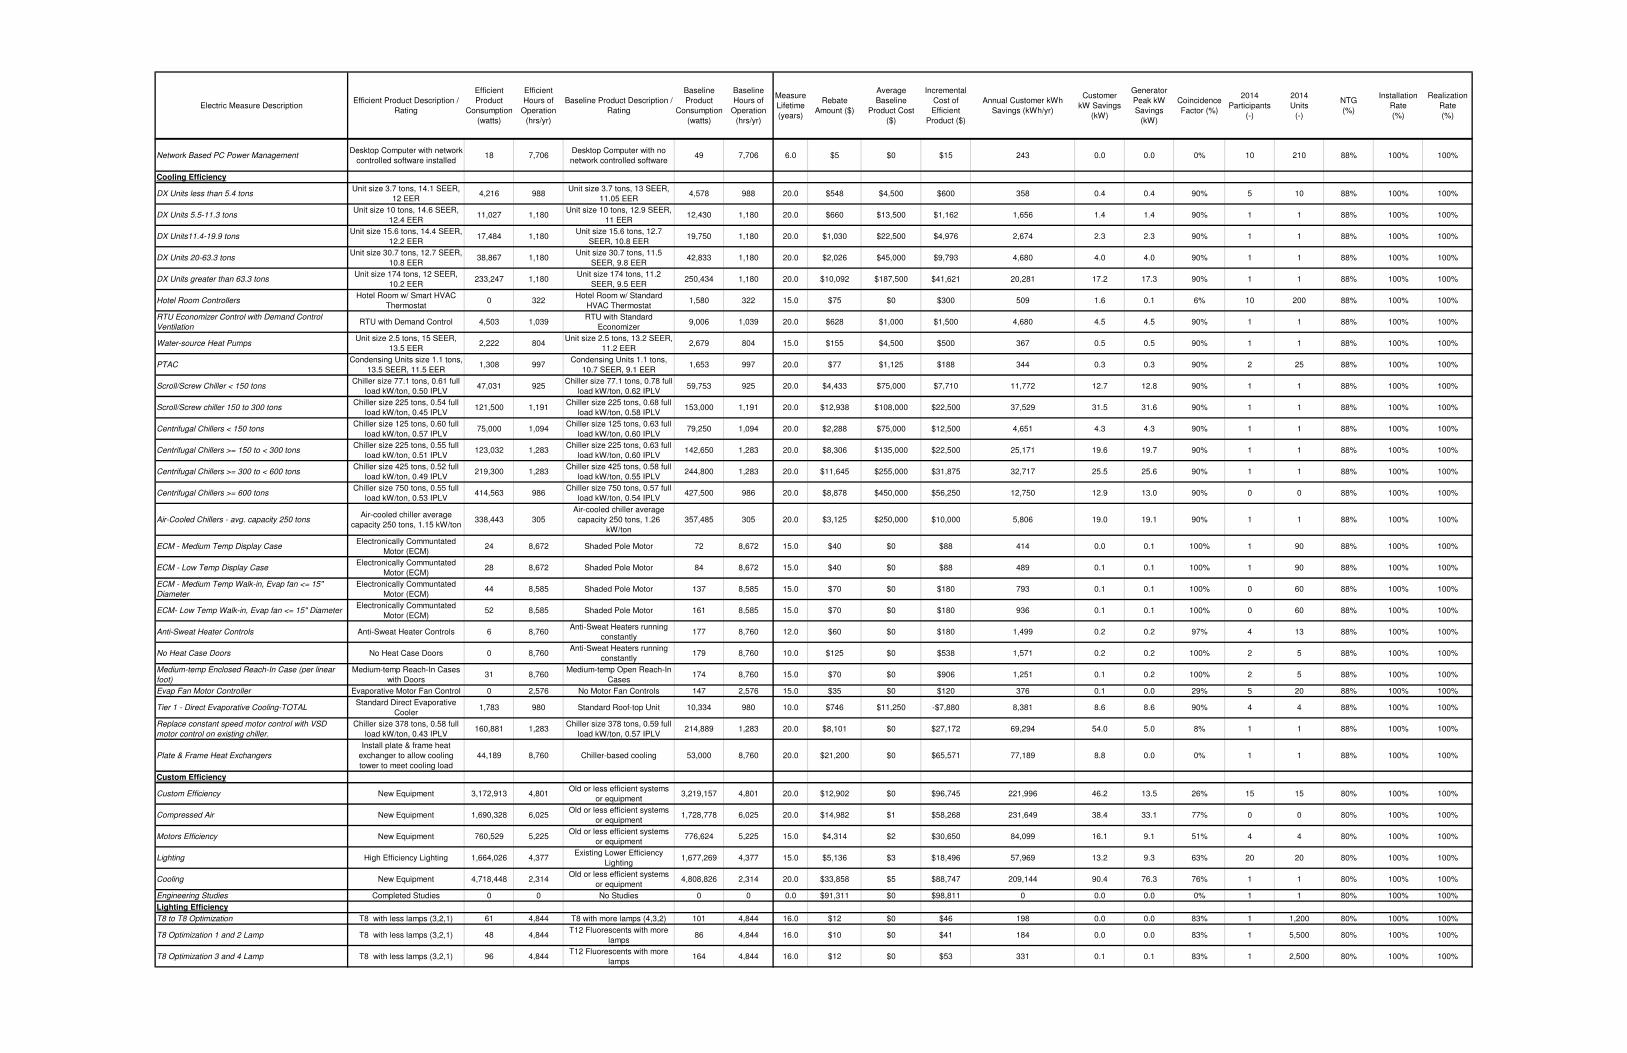
Electric Measure DescriptionEfficient Product Description /
Rating
Efficient
Product
Consumption
(watts)
Efficient
Hours of
Operation
(hrs/yr)
Baseline Product Description /
Rating
Baseline
Product
Consumption
(watts)
Baseline
Hours of
Operation
(hrs/yr)
Measure
Lifetime
(years)
Rebate
Amount ($)
Average
Baseline
Product Cost
($)
Incremental
Cost of
Efficient
Product ($)
Annual Customer kWh
Savings (kWh/yr)
Customer
kW Savings
(kW)
Generator
Peak kW
Savings
(kW)
Coincidence
Factor (%)
2014
Participants
(-)
2014
Units
(-)
NTG
(%)
Installation
Rate
(%)
Realization
Rate
(%)
Network Based PC Power ManagementDesktop Computer with network
controlled software installed18 7,706
Desktop Computer with no
network controlled software49 7,706 6.0 $5 $0 $15 243 0.0 0.0 0% 10 210 88% 100% 100%
Cooling Efficiency 0 0 0 0 0.0 $0 $0 $0 0 0.0 0.0 0% 0 0 0% 0% 100%
DX Units less than 5.4 tonsUnit size 3.7 tons, 14.1 SEER,
12 EER4,216 988
Unit size 3.7 tons, 13 SEER,
11.05 EER4,578 988 20.0 $548 $4,500 $600 358 0.4 0.4 90% 5 10 88% 100% 100%
DX Units 5.5-11.3 tonsUnit size 10 tons, 14.6 SEER,
12.4 EER11,027 1,180
Unit size 10 tons, 12.9 SEER,
11 EER12,430 1,180 20.0 $660 $13,500 $1,162 1,656 1.4 1.4 90% 1 1 88% 100% 100%
DX Units11.4-19.9 tonsUnit size 15.6 tons, 14.4 SEER,
12.2 EER17,484 1,180
Unit size 15.6 tons, 12.7
SEER, 10.8 EER19,750 1,180 20.0 $1,030 $22,500 $4,976 2,674 2.3 2.3 90% 1 1 88% 100% 100%
DX Units 20-63.3 tonsUnit size 30.7 tons, 12.7 SEER,
10.8 EER38,867 1,180
Unit size 30.7 tons, 11.5
SEER, 9.8 EER42,833 1,180 20.0 $2,026 $45,000 $9,793 4,680 4.0 4.0 90% 1 1 88% 100% 100%
DX Units greater than 63.3 tonsUnit size 174 tons, 12 SEER,
10.2 EER233,247 1,180
Unit size 174 tons, 11.2
SEER, 9.5 EER250,434 1,180 20.0 $10,092 $187,500 $41,621 20,281 17.2 17.3 90% 1 1 88% 100% 100%
Hotel Room ControllersHotel Room w/ Smart HVAC
Thermostat0 322
Hotel Room w/ Standard
HVAC Thermostat1,580 322 15.0 $75 $0 $300 509 1.6 0.1 6% 10 200 88% 100% 100%
RTU Economizer Control with Demand Control
VentilationRTU with Demand Control 4,503 1,039
RTU with Standard
Economizer9,006 1,039 20.0 $628 $1,000 $1,500 4,680 4.5 4.5 90% 1 1 88% 100% 100%
Water-source Heat PumpsUnit size 2.5 tons, 15 SEER,
13.5 EER2,222 804
Unit size 2.5 tons, 13.2 SEER,
11.2 EER2,679 804 15.0 $155 $4,500 $500 367 0.5 0.5 90% 1 1 88% 100% 100%
PTACCondensing Units size 1.1 tons,
13.5 SEER, 11.5 EER1,308 997
Condensing Units 1.1 tons,
10.7 SEER, 9.1 EER1,653 997 20.0 $77 $1,125 $188 344 0.3 0.3 90% 2 25 88% 100% 100%
Scroll/Screw Chiller < 150 tonsChiller size 77.1 tons, 0.61 full
load kW/ton, 0.50 IPLV47,031 925
Chiller size 77.1 tons, 0.78 full
load kW/ton, 0.62 IPLV59,753 925 20.0 $4,433 $75,000 $7,710 11,772 12.7 12.8 90% 1 1 88% 100% 100%
Scroll/Screw chiller 150 to 300 tonsChiller size 225 tons, 0.54 full
load kW/ton, 0.45 IPLV121,500 1,191
Chiller size 225 tons, 0.68 full
load kW/ton, 0.58 IPLV153,000 1,191 20.0 $12,938 $108,000 $22,500 37,529 31.5 31.6 90% 1 1 88% 100% 100%
Centrifugal Chillers < 150 tonsChiller size 125 tons, 0.60 full
load kW/ton, 0.57 IPLV75,000 1,094
Chiller size 125 tons, 0.63 full
load kW/ton, 0.60 IPLV79,250 1,094 20.0 $2,288 $75,000 $12,500 4,651 4.3 4.3 90% 1 1 88% 100% 100%
Centrifugal Chillers >= 150 to < 300 tonsChiller size 225 tons, 0.55 full
load kW/ton, 0.51 IPLV123,032 1,283
Chiller size 225 tons, 0.63 full
load kW/ton, 0.60 IPLV142,650 1,283 20.0 $8,306 $135,000 $22,500 25,171 19.6 19.7 90% 1 1 88% 100% 100%
Centrifugal Chillers >= 300 to < 600 tonsChiller size 425 tons, 0.52 full
load kW/ton, 0.49 IPLV219,300 1,283
Chiller size 425 tons, 0.58 full
load kW/ton, 0.55 IPLV244,800 1,283 20.0 $11,645 $255,000 $31,875 32,717 25.5 25.6 90% 1 1 88% 100% 100%
Centrifugal Chillers >= 600 tonsChiller size 750 tons, 0.55 full
load kW/ton, 0.53 IPLV414,563 986
Chiller size 750 tons, 0.57 full
load kW/ton, 0.54 IPLV427,500 986 20.0 $8,878 $450,000 $56,250 12,750 12.9 13.0 90% 0 0 88% 100% 100%
Air-Cooled Chillers - avg. capacity 250 tonsAir-cooled chiller average
capacity 250 tons, 1.15 kW/ton338,443 305
Air-cooled chiller average
capacity 250 tons, 1.26
kW/ton
357,485 305 20.0 $3,125 $250,000 $10,000 5,806 19.0 19.1 90% 1 1 88% 100% 100%
ECM - Medium Temp Display CaseElectronically Communtated
Motor (ECM)24 8,672 Shaded Pole Motor 72 8,672 15.0 $40 $0 $88 414 0.0 0.1 100% 1 90 88% 100% 100%
ECM - Low Temp Display CaseElectronically Communtated
Motor (ECM)28 8,672 Shaded Pole Motor 84 8,672 15.0 $40 $0 $88 489 0.1 0.1 100% 1 90 88% 100% 100%
ECM - Medium Temp Walk-in, Evap fan <= 15"
Diameter
Electronically Communtated
Motor (ECM)44 8,585 Shaded Pole Motor 137 8,585 15.0 $70 $0 $180 793 0.1 0.1 100% 0 60 88% 100% 100%
ECM- Low Temp Walk-in, Evap fan <= 15" DiameterElectronically Communtated
Motor (ECM)52 8,585 Shaded Pole Motor 161 8,585 15.0 $70 $0 $180 936 0.1 0.1 100% 0 60 88% 100% 100%
Anti-Sweat Heater Controls Anti-Sweat Heater Controls 6 8,760Anti-Sweat Heaters running
constantly177 8,760 12.0 $60 $0 $180 1,499 0.2 0.2 97% 4 13 88% 100% 100%
No Heat Case Doors No Heat Case Doors 0 8,760Anti-Sweat Heaters running
constantly179 8,760 10.0 $125 $0 $538 1,571 0.2 0.2 100% 2 5 88% 100% 100%
Medium-temp Enclosed Reach-In Case (per linear
foot)
Medium-temp Reach-In Cases
with Doors 31 8,760
Medium-temp Open Reach-In
Cases174 8,760 15.0 $70 $0 $906 1,251 0.1 0.2 100% 2 5 88% 100% 100%
Evap Fan Motor Controller Evaporative Motor Fan Control 0 2,576 No Motor Fan Controls 147 2,576 15.0 $35 $0 $120 376 0.1 0.0 29% 5 20 88% 100% 100%
Tier 1 - Direct Evaporative Cooling-TOTALStandard Direct Evaporative
Cooler1,783 980 Standard Roof-top Unit 10,334 980 10.0 $746 $11,250 -$7,880 8,381 8.6 8.6 90% 4 4 88% 100% 100%
Replace constant speed motor control with VSD
motor control on existing chiller.
Chiller size 378 tons, 0.58 full
load kW/ton, 0.43 IPLV160,881 1,283
Chiller size 378 tons, 0.59 full
load kW/ton, 0.57 IPLV214,889 1,283 20.0 $8,101 $0 $27,172 69,294 54.0 5.0 8% 1 1 88% 100% 100%
Plate & Frame Heat Exchangers
Install plate & frame heat
exchanger to allow cooling
tower to meet cooling load
44,189 8,760 Chiller-based cooling 53,000 8,760 20.0 $21,200 $0 $65,571 77,189 8.8 0.0 0% 1 1 88% 100% 100%
Custom Efficiency 0 0 0 0 0.0 $0 $0 $0 0 0.0 0.0 0% 0 0 0% 0% 100%
Custom Efficiency New Equipment 3,172,913 4,801Old or less efficient systems
or equipment3,219,157 4,801 20.0 $12,902 $0 $96,745 221,996 46.2 13.5 26% 15 15 80% 100% 100%
Compressed Air New Equipment 1,690,328 6,025Old or less efficient systems
or equipment1,728,778 6,025 20.0 $14,982 $1 $58,268 231,649 38.4 33.1 77% 0 0 80% 100% 100%
Motors Efficiency New Equipment 760,529 5,225Old or less efficient systems
or equipment776,624 5,225 15.0 $4,314 $2 $30,650 84,099 16.1 9.1 51% 4 4 80% 100% 100%
Lighting High Efficiency Lighting 1,664,026 4,377Existing Lower Efficiency
Lighting1,677,269 4,377 15.0 $5,136 $3 $18,496 57,969 13.2 9.3 63% 20 20 80% 100% 100%
Cooling New Equipment 4,718,448 2,314Old or less efficient systems
or equipment4,808,826 2,314 20.0 $33,858 $5 $88,747 209,144 90.4 76.3 76% 1 1 80% 100% 100%
Engineering Studies Completed Studies 0 0 No Studies 0 0 0.0 $91,311 $0 $98,811 0 0.0 0.0 0% 1 1 80% 100% 100%
Lighting Efficiency 0 0 0 0 0.0 $0 $0 $0 0 0.0 0.0 0% 0 0 0% 0% 100%
T8 to T8 Optimization T8 with less lamps (3,2,1) 61 4,844 T8 with more lamps (4,3,2) 101 4,844 16.0 $12 $0 $46 198 0.0 0.0 83% 1 1,200 80% 100% 100%
T8 Optimization 1 and 2 Lamp T8 with less lamps (3,2,1) 48 4,844T12 Fluorescents with more
lamps86 4,844 16.0 $10 $0 $41 184 0.0 0.0 83% 1 5,500 80% 100% 100%
T8 Optimization 3 and 4 Lamp T8 with less lamps (3,2,1) 96 4,844T12 Fluorescents with more
lamps164 4,844 16.0 $12 $0 $53 331 0.1 0.1 83% 1 2,500 80% 100% 100%
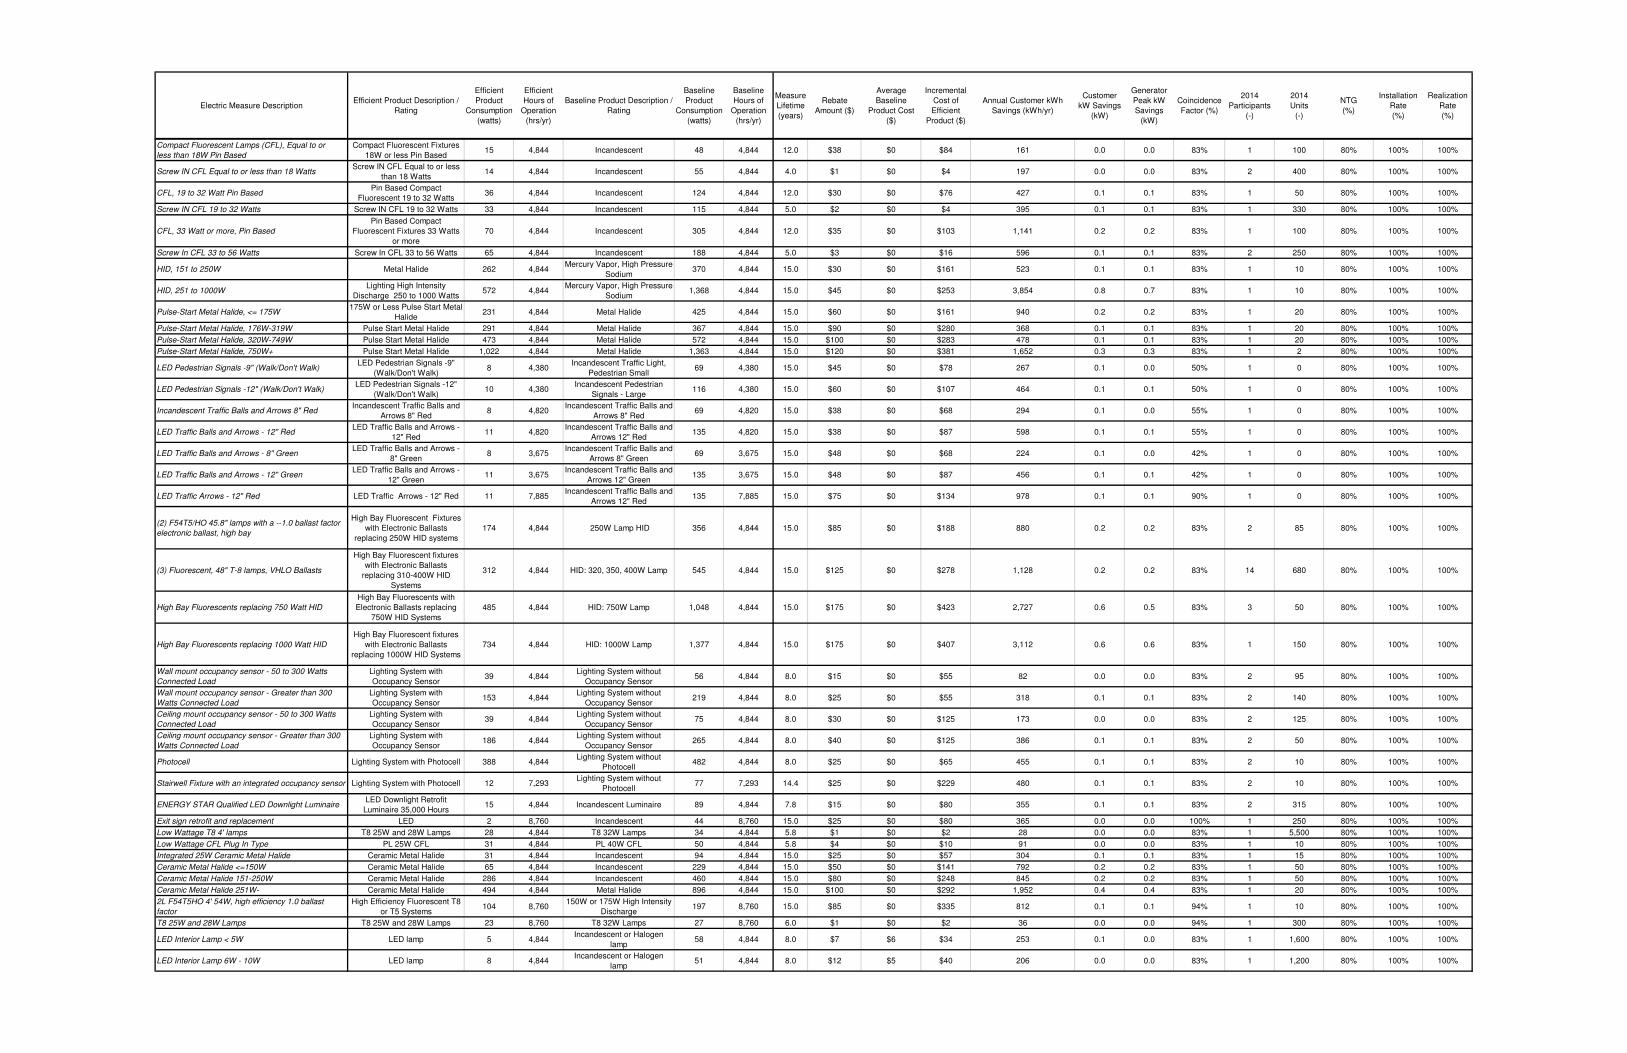
Electric Measure DescriptionEfficient Product Description /
Rating
Efficient
Product
Consumption
(watts)
Efficient
Hours of
Operation
(hrs/yr)
Baseline Product Description /
Rating
Baseline
Product
Consumption
(watts)
Baseline
Hours of
Operation
(hrs/yr)
Measure
Lifetime
(years)
Rebate
Amount ($)
Average
Baseline
Product Cost
($)
Incremental
Cost of
Efficient
Product ($)
Annual Customer kWh
Savings (kWh/yr)
Customer
kW Savings
(kW)
Generator
Peak kW
Savings
(kW)
Coincidence
Factor (%)
2014
Participants
(-)
2014
Units
(-)
NTG
(%)
Installation
Rate
(%)
Realization
Rate
(%)
Compact Fluorescent Lamps (CFL), Equal to or
less than 18W Pin Based
Compact Fluorescent Fixtures
18W or less Pin Based15 4,844 Incandescent 48 4,844 12.0 $38 $0 $84 161 0.0 0.0 83% 1 100 80% 100% 100%
Screw IN CFL Equal to or less than 18 WattsScrew IN CFL Equal to or less
than 18 Watts14 4,844 Incandescent 55 4,844 4.0 $1 $0 $4 197 0.0 0.0 83% 2 400 80% 100% 100%
CFL, 19 to 32 Watt Pin BasedPin Based Compact
Fluorescent 19 to 32 Watts36 4,844 Incandescent 124 4,844 12.0 $30 $0 $76 427 0.1 0.1 83% 1 50 80% 100% 100%
Screw IN CFL 19 to 32 Watts Screw IN CFL 19 to 32 Watts 33 4,844 Incandescent 115 4,844 5.0 $2 $0 $4 395 0.1 0.1 83% 1 330 80% 100% 100%
CFL, 33 Watt or more, Pin Based
Pin Based Compact
Fluorescent Fixtures 33 Watts
or more
70 4,844 Incandescent 305 4,844 12.0 $35 $0 $103 1,141 0.2 0.2 83% 1 100 80% 100% 100%
Screw In CFL 33 to 56 Watts Screw In CFL 33 to 56 Watts 65 4,844 Incandescent 188 4,844 5.0 $3 $0 $16 596 0.1 0.1 83% 2 250 80% 100% 100%
HID, 151 to 250W Metal Halide 262 4,844Mercury Vapor, High Pressure
Sodium370 4,844 15.0 $30 $0 $161 523 0.1 0.1 83% 1 10 80% 100% 100%
HID, 251 to 1000WLighting High Intensity
Discharge 250 to 1000 Watts572 4,844
Mercury Vapor, High Pressure
Sodium1,368 4,844 15.0 $45 $0 $253 3,854 0.8 0.7 83% 1 10 80% 100% 100%
Pulse-Start Metal Halide, <= 175W175W or Less Pulse Start Metal
Halide231 4,844 Metal Halide 425 4,844 15.0 $60 $0 $161 940 0.2 0.2 83% 1 20 80% 100% 100%
Pulse-Start Metal Halide, 176W-319W Pulse Start Metal Halide 291 4,844 Metal Halide 367 4,844 15.0 $90 $0 $280 368 0.1 0.1 83% 1 20 80% 100% 100%
Pulse-Start Metal Halide, 320W-749W Pulse Start Metal Halide 473 4,844 Metal Halide 572 4,844 15.0 $100 $0 $283 478 0.1 0.1 83% 1 20 80% 100% 100%
Pulse-Start Metal Halide, 750W+ Pulse Start Metal Halide 1,022 4,844 Metal Halide 1,363 4,844 15.0 $120 $0 $381 1,652 0.3 0.3 83% 1 2 80% 100% 100%
LED Pedestrian Signals -9" (Walk/Don't Walk)LED Pedestrian Signals -9"
(Walk/Don't Walk)8 4,380
Incandescent Traffic Light,
Pedestrian Small69 4,380 15.0 $45 $0 $78 267 0.1 0.0 50% 1 0 80% 100% 100%
LED Pedestrian Signals -12" (Walk/Don't Walk)LED Pedestrian Signals -12"
(Walk/Don't Walk)10 4,380
Incandescent Pedestrian
Signals - Large116 4,380 15.0 $60 $0 $107 464 0.1 0.1 50% 1 0 80% 100% 100%
Incandescent Traffic Balls and Arrows 8" RedIncandescent Traffic Balls and
Arrows 8" Red8 4,820
Incandescent Traffic Balls and
Arrows 8" Red69 4,820 15.0 $38 $0 $68 294 0.1 0.0 55% 1 0 80% 100% 100%
LED Traffic Balls and Arrows - 12" RedLED Traffic Balls and Arrows -
12" Red11 4,820
Incandescent Traffic Balls and
Arrows 12" Red135 4,820 15.0 $38 $0 $87 598 0.1 0.1 55% 1 0 80% 100% 100%
LED Traffic Balls and Arrows - 8" GreenLED Traffic Balls and Arrows -
8" Green8 3,675
Incandescent Traffic Balls and
Arrows 8" Green69 3,675 15.0 $48 $0 $68 224 0.1 0.0 42% 1 0 80% 100% 100%
LED Traffic Balls and Arrows - 12" GreenLED Traffic Balls and Arrows -
12" Green11 3,675
Incandescent Traffic Balls and
Arrows 12" Green135 3,675 15.0 $48 $0 $87 456 0.1 0.1 42% 1 0 80% 100% 100%
LED Traffic Arrows - 12" Red LED Traffic Arrows - 12" Red 11 7,885Incandescent Traffic Balls and
Arrows 12" Red135 7,885 15.0 $75 $0 $134 978 0.1 0.1 90% 1 0 80% 100% 100%
(2) F54T5/HO 45.8" lamps with a --1.0 ballast factor
electronic ballast, high bay
High Bay Fluorescent Fixtures
with Electronic Ballasts
replacing 250W HID systems
174 4,844 250W Lamp HID 356 4,844 15.0 $85 $0 $188 880 0.2 0.2 83% 2 85 80% 100% 100%
(3) Fluorescent, 48" T-8 lamps, VHLO Ballasts
High Bay Fluorescent fixtures
with Electronic Ballasts
replacing 310-400W HID
Systems
312 4,844 HID: 320, 350, 400W Lamp 545 4,844 15.0 $125 $0 $278 1,128 0.2 0.2 83% 14 680 80% 100% 100%
High Bay Fluorescents replacing 750 Watt HID
High Bay Fluorescents with
Electronic Ballasts replacing
750W HID Systems
485 4,844 HID: 750W Lamp 1,048 4,844 15.0 $175 $0 $423 2,727 0.6 0.5 83% 3 50 80% 100% 100%
High Bay Fluorescents replacing 1000 Watt HID
High Bay Fluorescent fixtures
with Electronic Ballasts
replacing 1000W HID Systems
734 4,844 HID: 1000W Lamp 1,377 4,844 15.0 $175 $0 $407 3,112 0.6 0.6 83% 1 150 80% 100% 100%
Wall mount occupancy sensor - 50 to 300 Watts
Connected Load
Lighting System with
Occupancy Sensor39 4,844
Lighting System without
Occupancy Sensor56 4,844 8.0 $15 $0 $55 82 0.0 0.0 83% 2 95 80% 100% 100%
Wall mount occupancy sensor - Greater than 300
Watts Connected Load
Lighting System with
Occupancy Sensor153 4,844
Lighting System without
Occupancy Sensor219 4,844 8.0 $25 $0 $55 318 0.1 0.1 83% 2 140 80% 100% 100%
Ceiling mount occupancy sensor - 50 to 300 Watts
Connected Load
Lighting System with
Occupancy Sensor39 4,844
Lighting System without
Occupancy Sensor75 4,844 8.0 $30 $0 $125 173 0.0 0.0 83% 2 125 80% 100% 100%
Ceiling mount occupancy sensor - Greater than 300
Watts Connected Load
Lighting System with
Occupancy Sensor186 4,844
Lighting System without
Occupancy Sensor265 4,844 8.0 $40 $0 $125 386 0.1 0.1 83% 2 50 80% 100% 100%
Photocell Lighting System with Photocell 388 4,844Lighting System without
Photocell482 4,844 8.0 $25 $0 $65 455 0.1 0.1 83% 2 10 80% 100% 100%
Stairwell Fixture with an integrated occupancy sensor Lighting System with Photocell 12 7,293Lighting System without
Photocell77 7,293 14.4 $25 $0 $229 480 0.1 0.1 83% 2 10 80% 100% 100%
ENERGY STAR Qualified LED Downlight LuminaireLED Downlight Retrofit
Luminaire 35,000 Hours15 4,844 Incandescent Luminaire 89 4,844 7.8 $15 $0 $80 355 0.1 0.1 83% 2 315 80% 100% 100%
Exit sign retrofit and replacement LED 2 8,760 Incandescent 44 8,760 15.0 $25 $0 $80 365 0.0 0.0 100% 1 250 80% 100% 100%
Low Wattage T8 4' lamps T8 25W and 28W Lamps 28 4,844 T8 32W Lamps 34 4,844 5.8 $1 $0 $2 28 0.0 0.0 83% 1 5,500 80% 100% 100%
Low Wattage CFL Plug In Type PL 25W CFL 31 4,844 PL 40W CFL 50 4,844 5.8 $4 $0 $10 91 0.0 0.0 83% 1 10 80% 100% 100%
Integrated 25W Ceramic Metal Halide Ceramic Metal Halide 31 4,844 Incandescent 94 4,844 15.0 $25 $0 $57 304 0.1 0.1 83% 1 15 80% 100% 100%
Ceramic Metal Halide <=150W Ceramic Metal Halide 65 4,844 Incandescent 229 4,844 15.0 $50 $0 $141 792 0.2 0.2 83% 1 50 80% 100% 100%
Ceramic Metal Halide 151-250W Ceramic Metal Halide 286 4,844 Incandescent 460 4,844 15.0 $80 $0 $248 845 0.2 0.2 83% 1 50 80% 100% 100%
Ceramic Metal Halide 251W- Ceramic Metal Halide 494 4,844 Metal Halide 896 4,844 15.0 $100 $0 $292 1,952 0.4 0.4 83% 1 20 80% 100% 100%
2L F54T5HO 4' 54W, high efficiency 1.0 ballast
factor
High Efficiency Fluorescent T8
or T5 Systems104 8,760
150W or 175W High Intensity
Discharge197 8,760 15.0 $85 $0 $335 812 0.1 0.1 94% 1 10 80% 100% 100%
T8 25W and 28W Lamps T8 25W and 28W Lamps 23 8,760 T8 32W Lamps 27 8,760 6.0 $1 $0 $2 36 0.0 0.0 94% 1 300 80% 100% 100%
LED Interior Lamp < 5W LED lamp 5 4,844Incandescent or Halogen
lamp58 4,844 8.0 $7 $6 $34 253 0.1 0.0 83% 1 1,600 80% 100% 100%
LED Interior Lamp 6W - 10W LED lamp 8 4,844Incandescent or Halogen
lamp51 4,844 8.0 $12 $5 $40 206 0.0 0.0 83% 1 1,200 80% 100% 100%
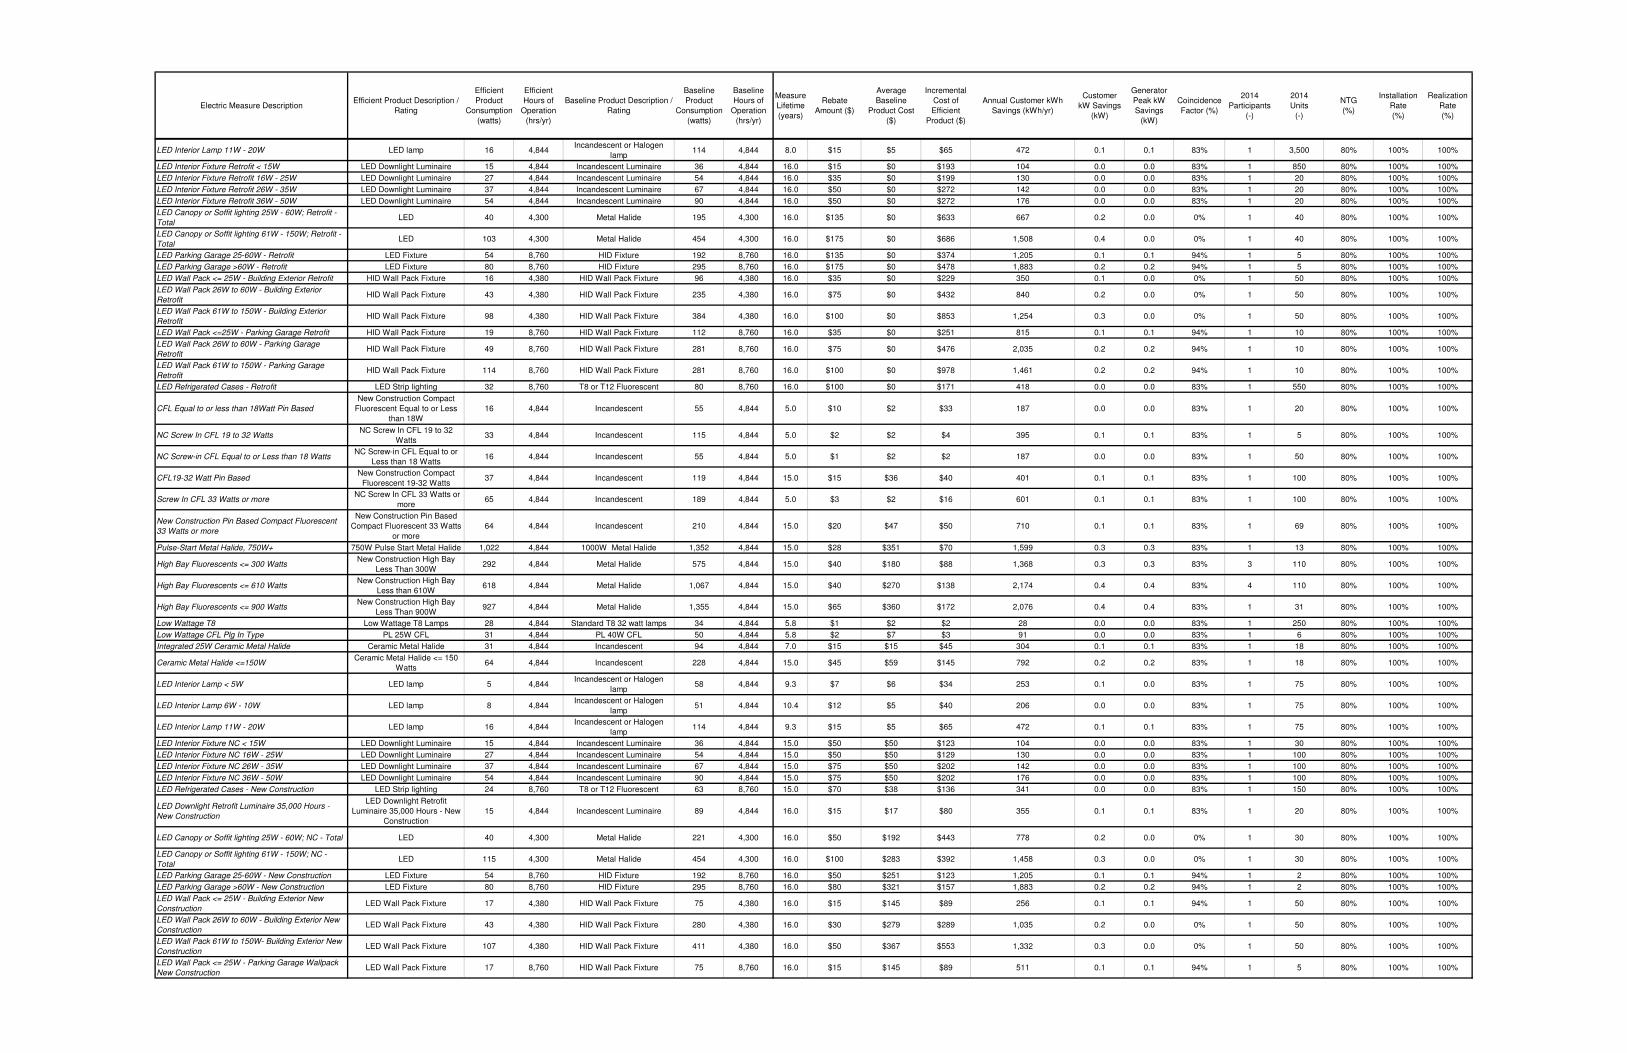
Electric Measure DescriptionEfficient Product Description /
Rating
Efficient
Product
Consumption
(watts)
Efficient
Hours of
Operation
(hrs/yr)
Baseline Product Description /
Rating
Baseline
Product
Consumption
(watts)
Baseline
Hours of
Operation
(hrs/yr)
Measure
Lifetime
(years)
Rebate
Amount ($)
Average
Baseline
Product Cost
($)
Incremental
Cost of
Efficient
Product ($)
Annual Customer kWh
Savings (kWh/yr)
Customer
kW Savings
(kW)
Generator
Peak kW
Savings
(kW)
Coincidence
Factor (%)
2014
Participants
(-)
2014
Units
(-)
NTG
(%)
Installation
Rate
(%)
Realization
Rate
(%)
LED Interior Lamp 11W - 20W LED lamp 16 4,844Incandescent or Halogen
lamp114 4,844 8.0 $15 $5 $65 472 0.1 0.1 83% 1 3,500 80% 100% 100%
LED Interior Fixture Retrofit < 15W LED Downlight Luminaire 15 4,844 Incandescent Luminaire 36 4,844 16.0 $15 $0 $193 104 0.0 0.0 83% 1 850 80% 100% 100%
LED Interior Fixture Retrofit 16W - 25W LED Downlight Luminaire 27 4,844 Incandescent Luminaire 54 4,844 16.0 $35 $0 $199 130 0.0 0.0 83% 1 20 80% 100% 100%
LED Interior Fixture Retrofit 26W - 35W LED Downlight Luminaire 37 4,844 Incandescent Luminaire 67 4,844 16.0 $50 $0 $272 142 0.0 0.0 83% 1 20 80% 100% 100%
LED Interior Fixture Retrofit 36W - 50W LED Downlight Luminaire 54 4,844 Incandescent Luminaire 90 4,844 16.0 $50 $0 $272 176 0.0 0.0 83% 1 20 80% 100% 100%
LED Canopy or Soffit lighting 25W - 60W; Retrofit -
TotalLED 40 4,300 Metal Halide 195 4,300 16.0 $135 $0 $633 667 0.2 0.0 0% 1 40 80% 100% 100%
LED Canopy or Soffit lighting 61W - 150W; Retrofit -
TotalLED 103 4,300 Metal Halide 454 4,300 16.0 $175 $0 $686 1,508 0.4 0.0 0% 1 40 80% 100% 100%
LED Parking Garage 25-60W - Retrofit LED Fixture 54 8,760 HID Fixture 192 8,760 16.0 $135 $0 $374 1,205 0.1 0.1 94% 1 5 80% 100% 100%
LED Parking Garage >60W - Retrofit LED Fixture 80 8,760 HID Fixture 295 8,760 16.0 $175 $0 $478 1,883 0.2 0.2 94% 1 5 80% 100% 100%
LED Wall Pack <= 25W - Building Exterior Retrofit HID Wall Pack Fixture 16 4,380 HID Wall Pack Fixture 96 4,380 16.0 $35 $0 $229 350 0.1 0.0 0% 1 50 80% 100% 100%
LED Wall Pack 26W to 60W - Building Exterior
RetrofitHID Wall Pack Fixture 43 4,380 HID Wall Pack Fixture 235 4,380 16.0 $75 $0 $432 840 0.2 0.0 0% 1 50 80% 100% 100%
LED Wall Pack 61W to 150W - Building Exterior
RetrofitHID Wall Pack Fixture 98 4,380 HID Wall Pack Fixture 384 4,380 16.0 $100 $0 $853 1,254 0.3 0.0 0% 1 50 80% 100% 100%
LED Wall Pack <=25W - Parking Garage Retrofit HID Wall Pack Fixture 19 8,760 HID Wall Pack Fixture 112 8,760 16.0 $35 $0 $251 815 0.1 0.1 94% 1 10 80% 100% 100%
LED Wall Pack 26W to 60W - Parking Garage
RetrofitHID Wall Pack Fixture 49 8,760 HID Wall Pack Fixture 281 8,760 16.0 $75 $0 $476 2,035 0.2 0.2 94% 1 10 80% 100% 100%
LED Wall Pack 61W to 150W - Parking Garage
RetrofitHID Wall Pack Fixture 114 8,760 HID Wall Pack Fixture 281 8,760 16.0 $100 $0 $978 1,461 0.2 0.2 94% 1 10 80% 100% 100%
LED Refrigerated Cases - Retrofit LED Strip lighting 32 8,760 T8 or T12 Fluorescent 80 8,760 16.0 $100 $0 $171 418 0.0 0.0 83% 1 550 80% 100% 100%
CFL Equal to or less than 18Watt Pin Based
New Construction Compact
Fluorescent Equal to or Less
than 18W
16 4,844 Incandescent 55 4,844 5.0 $10 $2 $33 187 0.0 0.0 83% 1 20 80% 100% 100%
NC Screw In CFL 19 to 32 WattsNC Screw In CFL 19 to 32
Watts33 4,844 Incandescent 115 4,844 5.0 $2 $2 $4 395 0.1 0.1 83% 1 5 80% 100% 100%
NC Screw-in CFL Equal to or Less than 18 WattsNC Screw-in CFL Equal to or
Less than 18 Watts16 4,844 Incandescent 55 4,844 5.0 $1 $2 $2 187 0.0 0.0 83% 1 50 80% 100% 100%
CFL19-32 Watt Pin BasedNew Construction Compact
Fluorescent 19-32 Watts37 4,844 Incandescent 119 4,844 15.0 $15 $36 $40 401 0.1 0.1 83% 1 100 80% 100% 100%
Screw In CFL 33 Watts or more NC Screw In CFL 33 Watts or
more65 4,844 Incandescent 189 4,844 5.0 $3 $2 $16 601 0.1 0.1 83% 1 100 80% 100% 100%
New Construction Pin Based Compact Fluorescent
33 Watts or more
New Construction Pin Based
Compact Fluorescent 33 Watts
or more
64 4,844 Incandescent 210 4,844 15.0 $20 $47 $50 710 0.1 0.1 83% 1 69 80% 100% 100%
Pulse-Start Metal Halide, 750W+ 750W Pulse Start Metal Halide 1,022 4,844 1000W Metal Halide 1,352 4,844 15.0 $28 $351 $70 1,599 0.3 0.3 83% 1 13 80% 100% 100%
High Bay Fluorescents <= 300 WattsNew Construction High Bay
Less Than 300W292 4,844 Metal Halide 575 4,844 15.0 $40 $180 $88 1,368 0.3 0.3 83% 3 110 80% 100% 100%
High Bay Fluorescents <= 610 WattsNew Construction High Bay
Less than 610W618 4,844 Metal Halide 1,067 4,844 15.0 $40 $270 $138 2,174 0.4 0.4 83% 4 110 80% 100% 100%
High Bay Fluorescents <= 900 WattsNew Construction High Bay
Less Than 900W927 4,844 Metal Halide 1,355 4,844 15.0 $65 $360 $172 2,076 0.4 0.4 83% 1 31 80% 100% 100%
Low Wattage T8 Low Wattage T8 Lamps 28 4,844 Standard T8 32 watt lamps 34 4,844 5.8 $1 $2 $2 28 0.0 0.0 83% 1 250 80% 100% 100%
Low Wattage CFL Plg In Type PL 25W CFL 31 4,844 PL 40W CFL 50 4,844 5.8 $2 $7 $3 91 0.0 0.0 83% 1 6 80% 100% 100%
Integrated 25W Ceramic Metal Halide Ceramic Metal Halide 31 4,844 Incandescent 94 4,844 7.0 $15 $15 $45 304 0.1 0.1 83% 1 18 80% 100% 100%
Ceramic Metal Halide <=150WCeramic Metal Halide <= 150
Watts64 4,844 Incandescent 228 4,844 15.0 $45 $59 $145 792 0.2 0.2 83% 1 18 80% 100% 100%
LED Interior Lamp < 5W LED lamp 5 4,844Incandescent or Halogen
lamp58 4,844 9.3 $7 $6 $34 253 0.1 0.0 83% 1 75 80% 100% 100%
LED Interior Lamp 6W - 10W LED lamp 8 4,844Incandescent or Halogen
lamp51 4,844 10.4 $12 $5 $40 206 0.0 0.0 83% 1 75 80% 100% 100%
LED Interior Lamp 11W - 20W LED lamp 16 4,844Incandescent or Halogen
lamp114 4,844 9.3 $15 $5 $65 472 0.1 0.1 83% 1 75 80% 100% 100%
LED Interior Fixture NC < 15W LED Downlight Luminaire 15 4,844 Incandescent Luminaire 36 4,844 15.0 $50 $50 $123 104 0.0 0.0 83% 1 30 80% 100% 100%
LED Interior Fixture NC 16W - 25W LED Downlight Luminaire 27 4,844 Incandescent Luminaire 54 4,844 15.0 $50 $50 $129 130 0.0 0.0 83% 1 100 80% 100% 100%
LED Interior Fixture NC 26W - 35W LED Downlight Luminaire 37 4,844 Incandescent Luminaire 67 4,844 15.0 $75 $50 $202 142 0.0 0.0 83% 1 100 80% 100% 100%
LED Interior Fixture NC 36W - 50W LED Downlight Luminaire 54 4,844 Incandescent Luminaire 90 4,844 15.0 $75 $50 $202 176 0.0 0.0 83% 1 100 80% 100% 100%
LED Refrigerated Cases - New Construction LED Strip lighting 24 8,760 T8 or T12 Fluorescent 63 8,760 15.0 $70 $38 $136 341 0.0 0.0 83% 1 150 80% 100% 100%
LED Downlight Retrofit Luminaire 35,000 Hours -
New Construction
LED Downlight Retrofit
Luminaire 35,000 Hours - New
Construction
15 4,844 Incandescent Luminaire 89 4,844 16.0 $15 $17 $80 355 0.1 0.1 83% 1 20 80% 100% 100%
LED Canopy or Soffit lighting 25W - 60W; NC - Total LED 40 4,300 Metal Halide 221 4,300 16.0 $50 $192 $443 778 0.2 0.0 0% 1 30 80% 100% 100%
LED Canopy or Soffit lighting 61W - 150W; NC -
TotalLED 115 4,300 Metal Halide 454 4,300 16.0 $100 $283 $392 1,458 0.3 0.0 0% 1 30 80% 100% 100%
LED Parking Garage 25-60W - New Construction LED Fixture 54 8,760 HID Fixture 192 8,760 16.0 $50 $251 $123 1,205 0.1 0.1 94% 1 2 80% 100% 100%
LED Parking Garage >60W - New Construction LED Fixture 80 8,760 HID Fixture 295 8,760 16.0 $80 $321 $157 1,883 0.2 0.2 94% 1 2 80% 100% 100%
LED Wall Pack <= 25W - Building Exterior New
ConstructionLED Wall Pack Fixture 17 4,380 HID Wall Pack Fixture 75 4,380 16.0 $15 $145 $89 256 0.1 0.1 94% 1 50 80% 100% 100%
LED Wall Pack 26W to 60W - Building Exterior New
ConstructionLED Wall Pack Fixture 43 4,380 HID Wall Pack Fixture 280 4,380 16.0 $30 $279 $289 1,035 0.2 0.0 0% 1 50 80% 100% 100%
LED Wall Pack 61W to 150W- Building Exterior New
ConstructionLED Wall Pack Fixture 107 4,380 HID Wall Pack Fixture 411 4,380 16.0 $50 $367 $553 1,332 0.3 0.0 0% 1 50 80% 100% 100%
LED Wall Pack <= 25W - Parking Garage Wallpack
New ConstructionLED Wall Pack Fixture 17 8,760 HID Wall Pack Fixture 75 8,760 16.0 $15 $145 $89 511 0.1 0.1 94% 1 5 80% 100% 100%
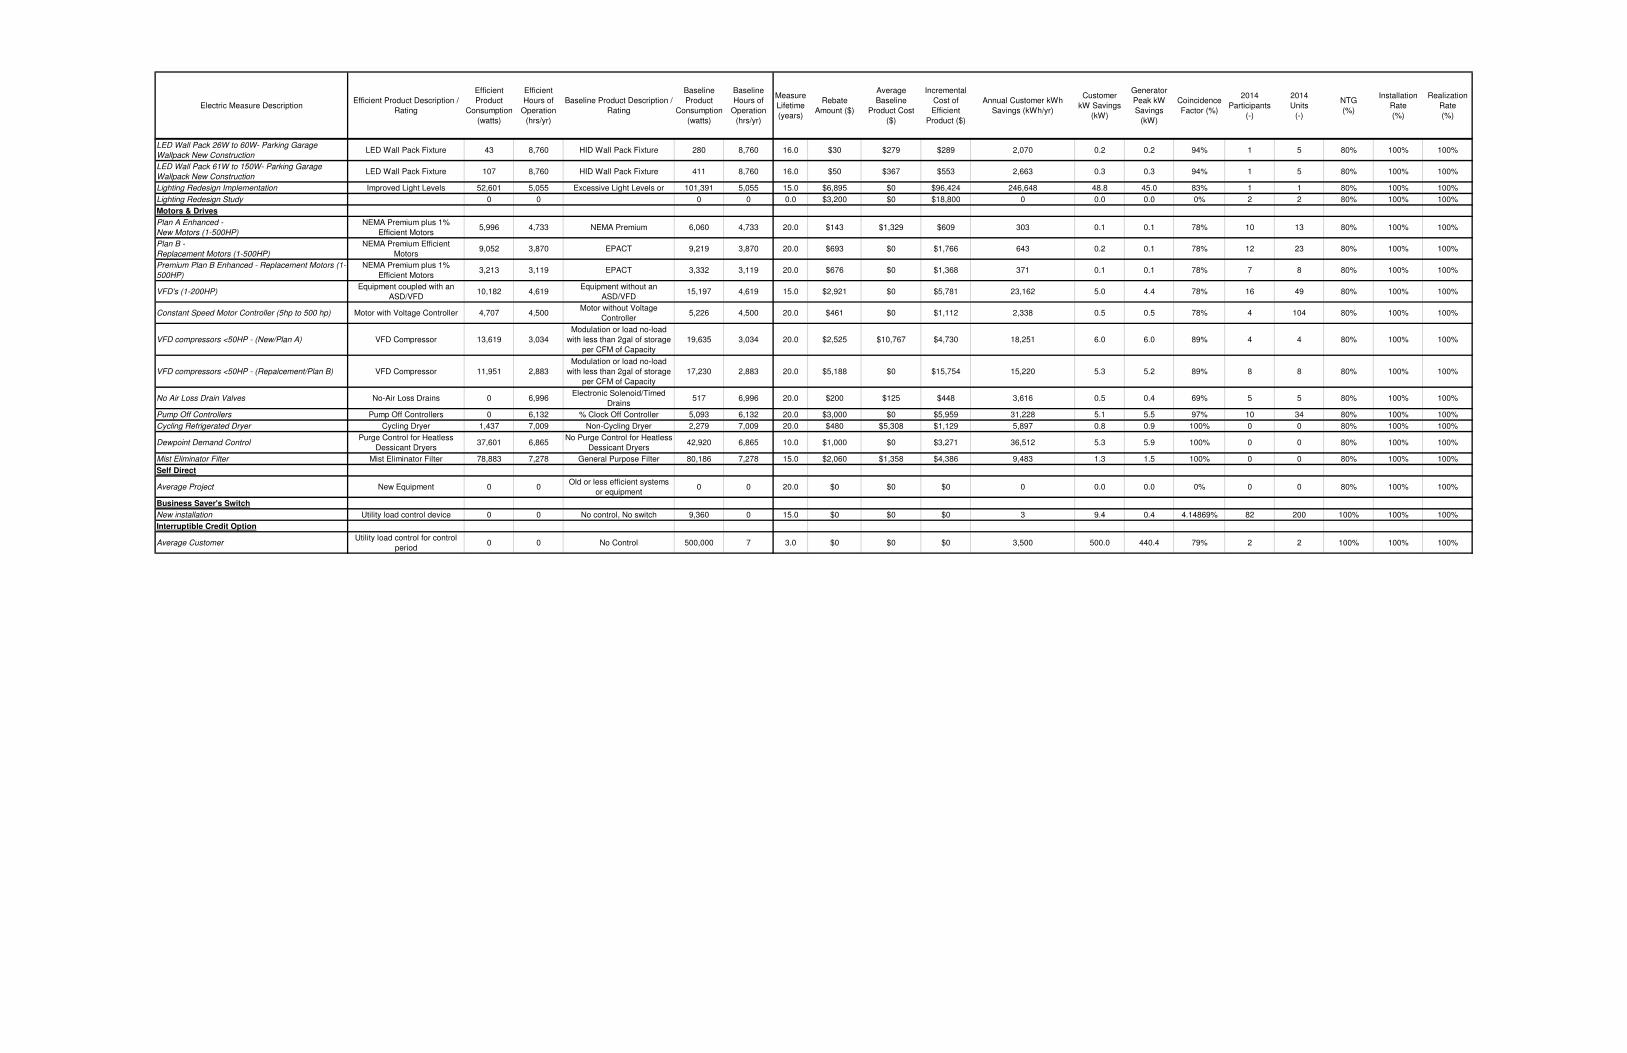
Electric Measure DescriptionEfficient Product Description /
Rating
Efficient
Product
Consumption
(watts)
Efficient
Hours of
Operation
(hrs/yr)
Baseline Product Description /
Rating
Baseline
Product
Consumption
(watts)
Baseline
Hours of
Operation
(hrs/yr)
Measure
Lifetime
(years)
Rebate
Amount ($)
Average
Baseline
Product Cost
($)
Incremental
Cost of
Efficient
Product ($)
Annual Customer kWh
Savings (kWh/yr)
Customer
kW Savings
(kW)
Generator
Peak kW
Savings
(kW)
Coincidence
Factor (%)
2014
Participants
(-)
2014
Units
(-)
NTG
(%)
Installation
Rate
(%)
Realization
Rate
(%)
LED Wall Pack 26W to 60W- Parking Garage
Wallpack New ConstructionLED Wall Pack Fixture 43 8,760 HID Wall Pack Fixture 280 8,760 16.0 $30 $279 $289 2,070 0.2 0.2 94% 1 5 80% 100% 100%
LED Wall Pack 61W to 150W- Parking Garage
Wallpack New ConstructionLED Wall Pack Fixture 107 8,760 HID Wall Pack Fixture 411 8,760 16.0 $50 $367 $553 2,663 0.3 0.3 94% 1 5 80% 100% 100%
Lighting Redesign Implementation Improved Light Levels 52,601 5,055 Excessive Light Levels or 101,391 5,055 15.0 $6,895 $0 $96,424 246,648 48.8 45.0 83% 1 1 80% 100% 100%
Lighting Redesign Study 0 0 0 0 0.0 $3,200 $0 $18,800 0 0.0 0.0 0% 2 2 80% 100% 100%
Motors & Drives 0 0 0 0 0.0 $0 $0 $0 0 0.0 0.0 0% 0 0 0% 0% 100%
Plan A Enhanced -
New Motors (1-500HP)
NEMA Premium plus 1%
Efficient Motors5,996 4,733 NEMA Premium 6,060 4,733 20.0 $143 $1,329 $609 303 0.1 0.1 78% 10 13 80% 100% 100%
Plan B -
Replacement Motors (1-500HP)
NEMA Premium Efficient
Motors9,052 3,870 EPACT 9,219 3,870 20.0 $693 $0 $1,766 643 0.2 0.1 78% 12 23 80% 100% 100%
Premium Plan B Enhanced - Replacement Motors (1-
500HP)
NEMA Premium plus 1%
Efficient Motors3,213 3,119 EPACT 3,332 3,119 20.0 $676 $0 $1,368 371 0.1 0.1 78% 7 8 80% 100% 100%
VFD's (1-200HP)Equipment coupled with an
ASD/VFD10,182 4,619
Equipment without an
ASD/VFD15,197 4,619 15.0 $2,921 $0 $5,781 23,162 5.0 4.4 78% 16 49 80% 100% 100%
Constant Speed Motor Controller (5hp to 500 hp) Motor with Voltage Controller 4,707 4,500Motor without Voltage
Controller5,226 4,500 20.0 $461 $0 $1,112 2,338 0.5 0.5 78% 4 104 80% 100% 100%
VFD compressors <50HP - (New/Plan A) VFD Compressor 13,619 3,034
Modulation or load no-load
with less than 2gal of storage
per CFM of Capacity
19,635 3,034 20.0 $2,525 $10,767 $4,730 18,251 6.0 6.0 89% 4 4 80% 100% 100%
VFD compressors <50HP - (Repalcement/Plan B) VFD Compressor 11,951 2,883
Modulation or load no-load
with less than 2gal of storage
per CFM of Capacity
17,230 2,883 20.0 $5,188 $0 $15,754 15,220 5.3 5.2 89% 8 8 80% 100% 100%
No Air Loss Drain Valves No-Air Loss Drains 0 6,996Electronic Solenoid/Timed
Drains517 6,996 20.0 $200 $125 $448 3,616 0.5 0.4 69% 5 5 80% 100% 100%
Pump Off Controllers Pump Off Controllers 0 6,132 % Clock Off Controller 5,093 6,132 20.0 $3,000 $0 $5,959 31,228 5.1 5.5 97% 10 34 80% 100% 100%
Cycling Refrigerated Dryer Cycling Dryer 1,437 7,009 Non-Cycling Dryer 2,279 7,009 20.0 $480 $5,308 $1,129 5,897 0.8 0.9 100% 0 0 80% 100% 100%
Dewpoint Demand ControlPurge Control for Heatless
Dessicant Dryers37,601 6,865
No Purge Control for Heatless
Dessicant Dryers42,920 6,865 10.0 $1,000 $0 $3,271 36,512 5.3 5.9 100% 0 0 80% 100% 100%
Mist Eliminator Filter Mist Eliminator Filter 78,883 7,278 General Purpose Filter 80,186 7,278 15.0 $2,060 $1,358 $4,386 9,483 1.3 1.5 100% 0 0 80% 100% 100%
Self Direct 0 0 0 0 0.0 $0 $0 $0 0 0.0 0.0 0% 0 0 0% 0% 100%
Average Project New Equipment 0 0Old or less efficient systems
or equipment0 0 20.0 $0 $0 $0 0 0.0 0.0 0% 0 0 80% 100% 100%
Business Saver's Switch 0 0 0 0 0.0 $0 $0 $0 0 0.0 0.0 0% 0 0 0% 0% 100%
New installation Utility load control device 0 0 No control, No switch 9,360 0 15.0 $0 $0 $0 3 9.4 0.4 4.14869% 82 200 100% 100% 100%
Interruptible Credit Option 0 0 0 0 0.0 $0 $0 $0 0 0.0 0.0 0% 0 0 0% 0% 100%
Average CustomerUtility load control for control
period0 0 No Control 500,000 7 3.0 $0 $0 $0 3,500 500.0 440.4 79% 2 2 100% 100% 100%