sovereign, bank, and insurance credit spreads ... · sovereign, bank and insurance credit. spreads:...
TRANSCRIPT
Sovereign, Bank and Insurance Credit Spreads:
Connectedness and System Networks
Monica Billio† , Dale Gray§, Andrew W. Lo¶, Mila Getmansky‡ ,
Robert C. Mertonkand Loriana Pelizzon
This Draft: April 29, 2013
Abstract
Macrofinancial risk has become increasingly important over time as global markets have be-come increasingly more connected. We apply several econometric measures of connectedness based on Granger-causality networks to the changes of sovereign risk of European countries and credit risk of ma jor European, U.S., and Japanese banks, brokerages, and insurance companies to investigate the evolution of these connections. Sovereign and credit risk are measured using the Merton Model (Contingent Claims Analysis) applied to risk-adjusted balance sheets, which calculates the sensitivity of the enterprise’s assets and liabilities to external “shocks.” We highlight connections among countries and institutions to quantifying the e§ects of asset-liability mismatches within and across countries and financial institutions.
Keywords: Sovereign and Credit Risk; Financial Institutions; Liquidity; Financial Crises; Contingent Pricing
JEL Classification: G13 and G2
We thank seminar participants at Consortium for Systemic Risk Analytics. We also thank Lorenzo Frattarolo and Roberto Panzica for excellent research assistance. We thank Inquire Europe and the MIT Laboratory for Financial Engineering for their financial support.
†Ca’ Foscari University of Venice, Department of Economics, Fondamenta San Giobbe 873, 30100 Venice, (39) 041 234—9170 (voice), (39) 041 234—9176 (fax), [email protected] (email).
‡Isenberg School of Management, University of Massachusetts, 121 Presidents Drive, Room 308C, Amherst, MA 01003, (413) 577—3308 (voice), (413) 545—3858 (fax), [email protected] (email).
§International Monetary Fund, 700 19th Street, N.W., Washington, D.C. 20431, (202) 623—6858 (voice), [email protected] (e-mail).
¶Charles E. & Susan T. Harris Professor, MIT Sloan School of Management, and Chief Investment Strategist, AlphaSimplex Group, LLC, 100 Main Street, E62—618, Cambridge, MA 02142—1347, (617) 253— 0920 (voice), [email protected] (email).
kMIT Sloan School of Management, 100 Main Street, E62—618, Cambridge, MA, 02142, (617) 258—6855 (voice), [email protected] (email). Ca’ Foscari University of Venice, Department of Economics, Fondamenta San Giobbe 873, 30100 Venice,
(39) 041 234—9164 (voice), (39) 041 234—9176 (fax), [email protected] (email).
1 Introduction
The risk of the banking and insurance system has become an important element in the
determination of sovereign risk and vice-versa. We apply several econometric measures
of connectedness based on Granger-causality networks to the changes of sovereign risk of
European countries and credit risk of ma jor European, U.S., and Japanese banks, brokerages,
and insurance companies. Sovereign risk is measured using Credit Derivative Swaps (CDS)
and credit risk is measured using the Merton Model (Contingent Claims Analysis) applied
to risk-adjusted balance sheet, which captures the sensitivity of the enterprise’s assets and
liabilities to external “shocks.”
The aim is to highlight connections (explicit and implicit, linear and non-linear) among
countries and financial institutions and quantify the e§ects of asset-liability mismatches
between countries and financial institutions.
The recent global financial crisis that began in 2007 reminds us about the importance
of including complex interactions, spillovers, and feedback relationships between financial
institutions and sovereigns in the analysis and modeling of financial crises and sovereign risk.
We examine how vulnerabilities can build up and suddenly erupt in a financial crisis with
potentially disastrous feedback e§ects for sovereign debt and economic growth. Traditional
macroeconomic analysis overlooks the importance of financial system risk, which makes it ill-
suited to examine interconnectedness and transmission mechanisms in response to common
shocks. Using contingent claims analysis (CCA) and network theory, we propose new ways
to measure and analyze financial system, sovereign, and credit risks.
So far, however, most policy e§orts have not focused in a comprehensive way on as-
sessing network externalities caused by the interconnectedness within financial institutions,
financial markets, and sovereign countries and their e§ect on systemic risk. In this regard,
the size, interconnectedness and complexity of individual financial institutions and its inter-
relationships with sovereign risk create vulnerabilities to systemic risk in the financial sector.
There should be more emphasis on the use of system-wide stress-testing approaches to eval-
uate vulnerabilities and potential impact of “destructive-feedback loops.”This paper aims to
cover this void and addresses these issues that are important to practitioners, academics,
and regulators.
The CCA analysis that delivers the “Fair Value CDS Spread” for banks and insurances
is based on balance-sheet, equity, and bond markets data. For the sovereigns, the assets of
the sovereign include foreign currency reserves, the net fiscal asset (defined as the present
value of taxes and revenues, including seigniorage, minus the present value of government
expenditures), and other public assets. The liabilities of the sovereigns include base money
1
and risky local currency and financial guarantees/contingent liabilities.
This paper is related to the growing literature on sovereign risk and in particular to the
following recent papers: Degryse, Elahi and Penas (2010), Longsta§, Pan, Pedersen, Single-
ton (2011), Acharya, Drechsler, and Schnabl (2011), and Kallestrup, Lando, and Murgoci
(2012). It is also related to the literature which uses contingent claims analysis to investi-
gate macrofinancial risk such as presented in Merton, Gray, Schweikhard, and Tsesmelidakis
(2012). Finally, it is related to the network literature applied to financial markets and
macroeconomics: Billio, Getmansky, Lo and Pelizzon (2012), Battiston, Delli Gatti, Galle-
gati, Greenwald and Stiglitz (2009), Acemoglu, Carvalho, Ozdaglar, Tahbaz-Salehi (2012),
and Acemoglu, Ozdaglar, Tahbaz-Salehi (2013).
The key distinguishing features of our paper are: measurement of network of connections
among sovereign risk and credit risk in financial and insurance institutions, large sample of
entities, and the ability to map the system of connections among all these institutions and
sovereigns.
The paper is organized as follows. In Section 2 we present the background that justifies
the investigation of interconnections between sovereign risk and financial institutions. In
Section 3 we present the Contingent Claims Analysis used to calculate ELR. In Section
4 we propose di§erent network measures. Section 5 presents main results, and Section 6
concludes.
2 Background: Feedback Loops
Existing methods of measuring financial stability have been heavily criticized by Cihak (2007)
and Segoviano and Goodhart (2009). These authors suggest that a good measure of systemic
stability has to incorporate two fundamental components: (i) the probability of individual
financial institution or country default and (ii) the probability and speed of possible shocks
spreading throughout the industry and countries. First, with the CCA method we compute
the probability of default for financial institutions and countries. Second, using Granger
causality network measures we are able to identify the speed of shock propagations and,
more importantly, we are able to assess network externalities, interconnectedness between
financial institutions, financial markets, and sovereign countries.
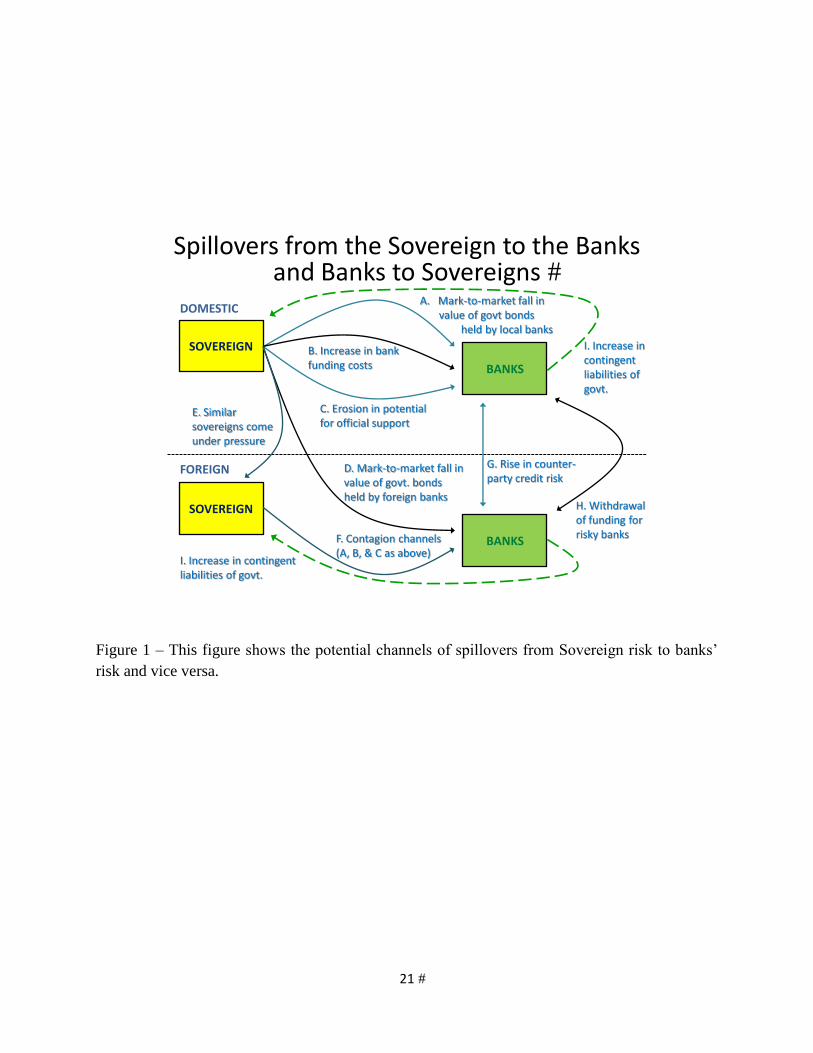
The propagation and feedback-loops that we have in mind can be represented by the
example reported in Figure (1).
2
INSERT Figure (1) here
Figure (1) represents a good example of how sovereign and credit risk are intimately
related. Consider banks in di§erent countries that often have credit interactions with each
other. A particular bank becoming weak has an impact on other banks, and in fact, banks
that do not even do business with the weakened bank may have their credit a§ected. How-
ever, it is common for banks in one country to hold the sovereign debt of another country.
Figure 1 illustrates that if that foreign country’s government debt declines in value, these
banks become weaker because they are writing guarantees on that debt. More interesting,
however, is the resulting interaction between the two sovereigns. The banks’ home country
is guaranteeing the banks, which means the decline in the foreign debt indirectly worsens the
home country’s position. Consequently, the decision to bail out a bank or sovereign a§ects
not only the sovereign and its own banks but also other sovereigns and foreign banks in a
significant way.
Moreover, as shown in Figure 1, the mark-to-market fall in the value of sovereign bonds
held by banks reduces bank assets. This can increase bank-funding costs, and if the sovereign
is distressed enough, the value of o¢cial support (guarantees) will be eroded. These have
knock-on e§ects, as shown. An adverse feedback loop ties sovereigns’ stresses to banking-
sector challenges.
How do we go about measuring this feedback loop e§ect? We need to examine the impact
of a change in credit risk on the interconnectedness and financial strength of di§erent entities.
The measure based on CCA and networks proposed in the next sections allow us to investigate
and analyze financial system interactions and systemic risk.
2.1 Contingent Claims Analysis
Contingent claims analysis is a proven approach to analyze and manage private-sector risk.
A contingent claim is any financial asset whose future payo§ depends on the value of another
asset. The prototypical contingent claim is an option — the right to buy or sell the underlying
asset at a specified exercise price by a certain expiration date. A call is an option to buy; a
put is an option to sell. Contingent claims analysis is a generalization of the option pricing
theory pioneered by Black-Scholes (1973) and Merton (1973). Option pricing methodology
has been applied to a wide variety of contingent claims. When applied to the analysis
and measurement of credit risk, contingent claims analysis is commonly called the “Merton
Model” (see Merton (1974, 1977, 1992, 1998)). It is based on three principles: (i) the
values of liabilities are derived from assets; (ii) assets follow a stochastic process; and, (iii)
3
liabilities have di§erent priority (i.e. senior and junior claims). Equity can be modeled as an
implicit call option and risk debt modeled as the default-free value of debt minus an implicit
put option. The Merton Model was first adapted and applied commercially by KMV (now
Moody’s KMV) and is now firmly established as the theoretical basis for several applied
models that are widely used in the investment industry to measure and evaluate credit risk
for corporate firms and financial institutions. Gray, Merton, and Bodie (2007) adapt the
Merton Model and apply it at the aggregate level to the sovereign balance sheet.
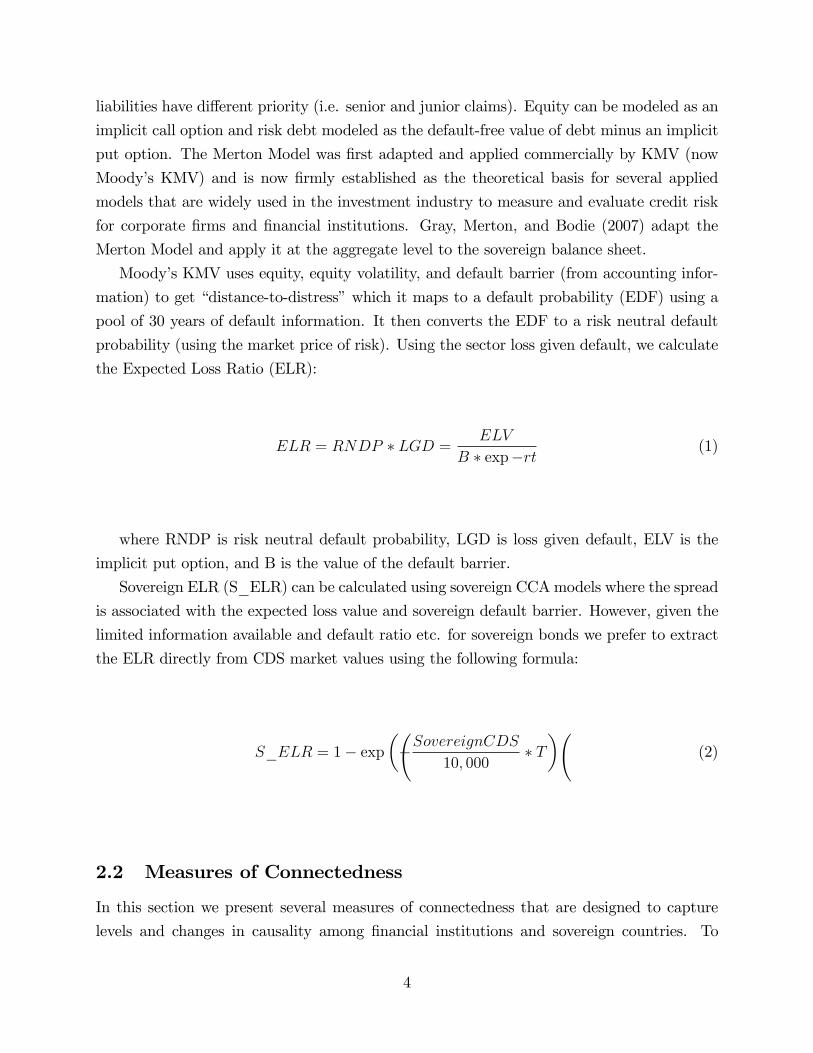
Moody’s KMV uses equity, equity volatility, and default barrier (from accounting infor-
mation) to get “distance-to-distress” which it maps to a default probability (EDF) using a
pool of 30 years of default information. It then converts the EDF to a risk neutral default
probability (using the market price of risk). Using the sector loss given default, we calculate
the Expected Loss Ratio (ELR):
ELV ELR = RN DP LGD = (1)
B exp rt
where RNDP is risk neutral default probability, LGD is loss given default, ELV is the
implicit put option, and B is the value of the default barrier.
Sovereign ELR (S_ELR) can be calculated using sovereign CCA models where the spread
is associated with the expected loss value and sovereign default barrier. However, given the
limited information available and default ratio etc. for sovereign bonds we prefer to extract
the ELR directly from CDS market values using the following formula:
SovereignC DS
S_ELR = 1 exp T (2)
10, 000
2.2 Measures of Connectedness
In this section we present several measures of connectedness that are designed to capture
levels and changes in causality among financial institutions and sovereign countries. To
4
identify connections we use pairwise linear Granger-causality tests to estimate the network
of statistically significant relations among financial institutions and countries.
Linear Granger Causality
To investigate the dynamic propagation of shocks to the system, it is important to mea-
sure not only the degree of connectedness between financial institutions and sovereigns, but
also the directionality of such relationships. To that end, we propose using Granger causality,
a statistical notion of causality based on the relative forecast power of two time series. Time
series j is said to “Granger-cause” time series i if past values of j contain information that
helps predict i above and beyond the information contained in past values of i alone. The
mathematical formulation of this test is based on linear regressions of Ri on Ri and Rt j .t+1 t
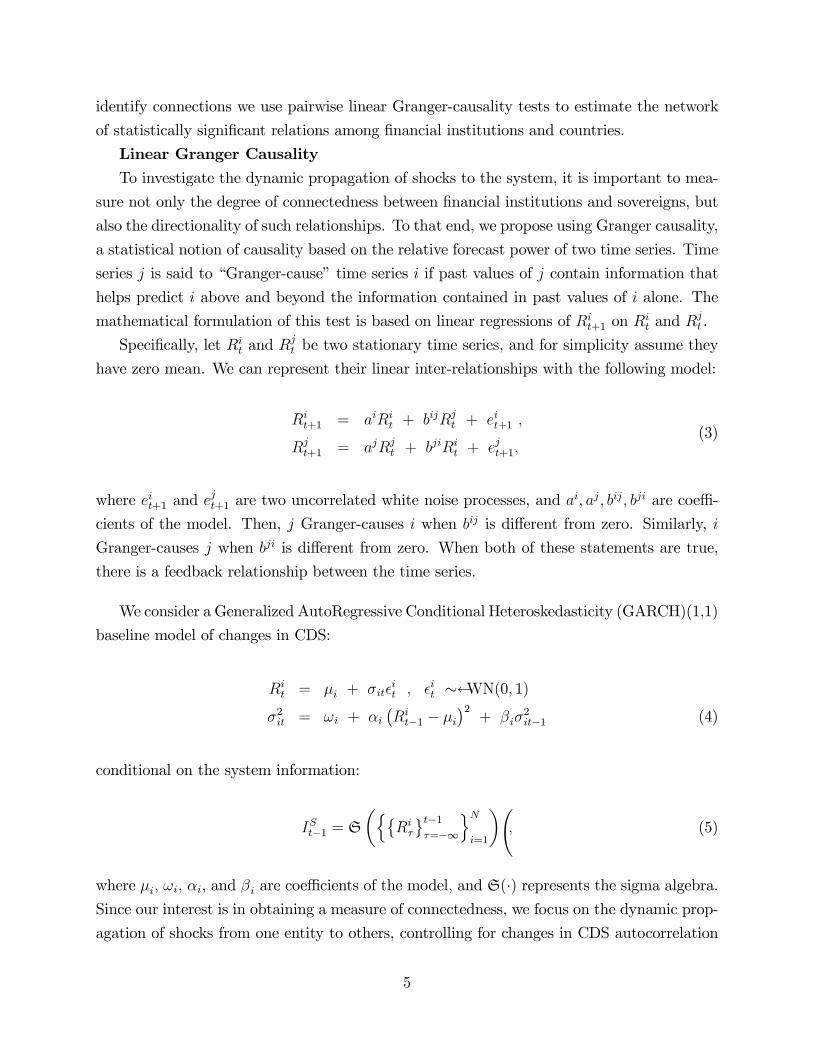
Specifically, let Rt i and Rt
j be two stationary time series, and for simplicity assume they
have zero mean. We can represent their linear inter-relationships with the following model:
Ri iRi bij Rj i = a + + et+1 t t t+1 , (3)
j j bjiRi jj RR = a + + et+1 t t t+1,
i j i j , bij , bjiwhere e and e are two uncorrelated white noise processes, and a , a are coe¢-t+1 t+1
cients of the model. Then, j Granger-causes i when bij is di§erent from zero. Similarly, i
Granger-causes j when bji is di§erent from zero. When both of these statements are true,
there is a feedback relationship between the time series.
We consider a Generalized AutoRegressive Conditional Heteroskedasticity (GARCH)(1,1)
baseline model of changes in CDS:
Rt i = µi + it
i t ,
i t WN(0, 1)
2 = !i + i Ri µi
2 + i
2 (4) it t1 it1
conditional on the system information:
t1 oN
IS
nRi = S , (5) t1 =1 i=1
where µi, !i, i, and i are coe¢cients of the model, and S(·) represents the sigma algebra. Since our interest is in obtaining a measure of connectedness, we focus on the dynamic prop-
agation of shocks from one entity to others, controlling for changes in CDS autocorrelation
5
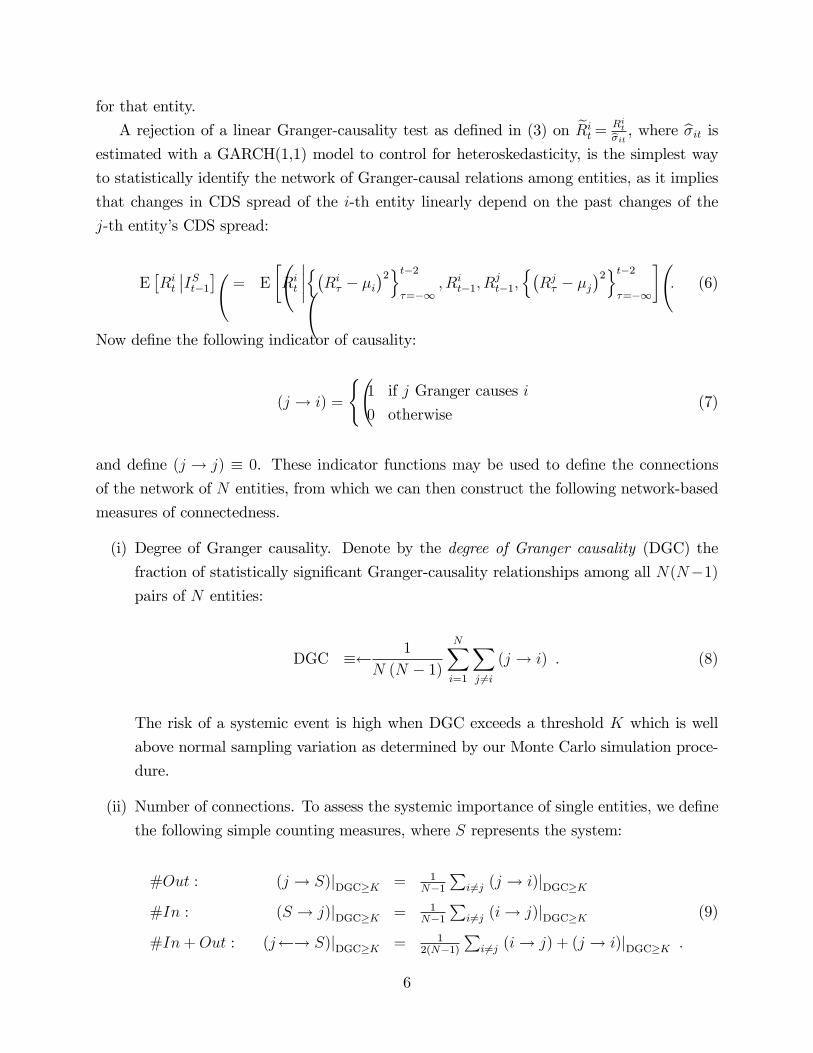
for that entity. tA rejection of a linear Granger-causality test as defined in (3) on Ret i = Ri
, where bit isbit estimated with a GARCH(1,1) model to control for heteroskedasticity, is the simplest way
to statistically identify the network of Granger-causal relations among entities, as it implies
that changes in CDS spread of the i-th entity linearly depend on the past changes of the
j-th entity’s CDS spread:
2ot2 2ot2
E Rt i ItS
1
= E Rt
i
nR i µi , Rt
i 1, Rt
j 1, nR j µj . (6)
=1 =1
Now define the following indicator of causality:
( 1 if j Granger causes i
(j ! i) = (7) 0 otherwise
and define (j ! j) 0. These indicator functions may be used to define the connections
of the network of N entities, from which we can then construct the following network-based
measures of connectedness.
(i) Degree of Granger causality. Denote by the degree of Granger causality (DGC) the
fraction of statistically significant Granger-causality relationships among all N(N1) pairs of N entities:
N1
DGC XX
(j ! i) . (8) N (N 1)
i=1 j=6 i
The risk of a systemic event is high when DGC exceeds a threshold K which is well
above normal sampling variation as determined by our Monte Carlo simulation proce-
dure.
(ii) Number of connections. To assess the systemic importance of single entities, we define
the following simple counting measures, where S represents the system:
1#Out : (j ! S)| = P
(j ! i)|DGCK N1 i6=j DGCK
1#In : (S ! j)| = P
(i ! j)| (9) DGCK N1 i6=j DGCK
1#In + Out : (j ! S)| = P
(i ! j) + (j ! i)| .DGCK 2(N1) i6 DGCK=j
6
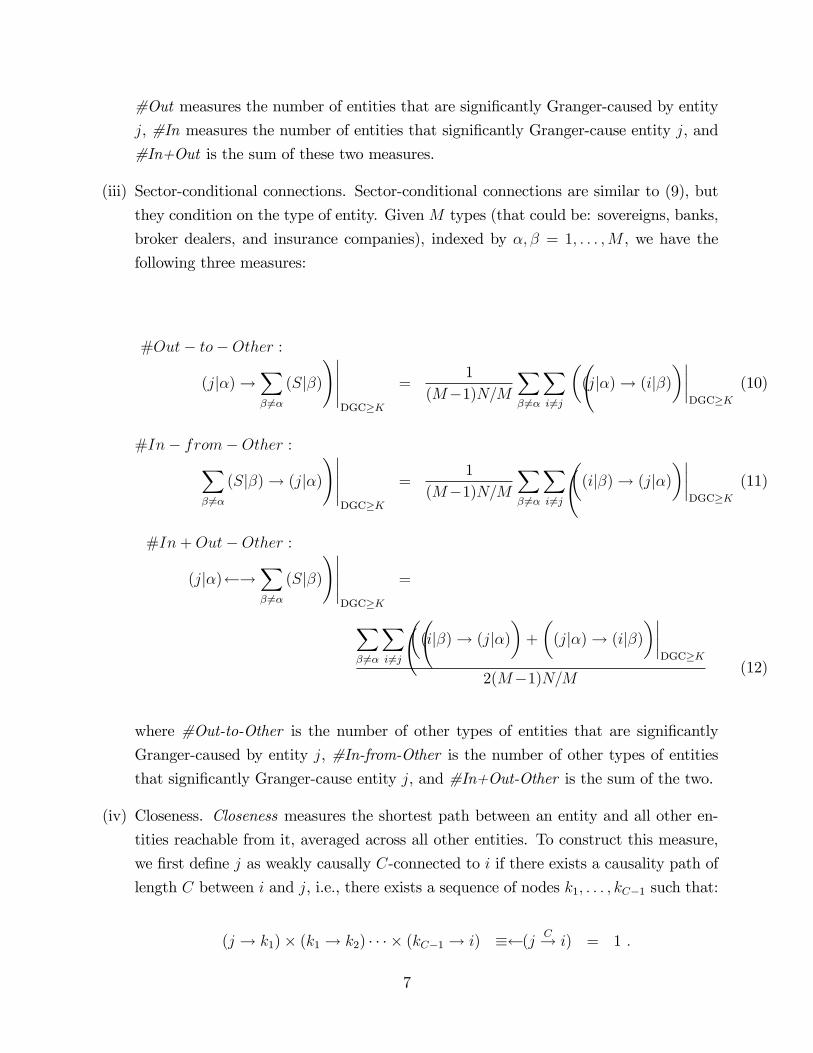
#Out measures the number of entities that are significantly Granger-caused by entity
j, #In measures the number of entities that significantly Granger-cause entity j, and
#In+Out is the sum of these two measures.
(iii) Sector-conditional connections. Sector-conditional connections are similar to (9), but
they condition on the type of entity. Given M types (that could be: sovereigns, banks,
broker dealers, and insurance companies), indexed by , = 1, . . . , M , we have the
following three measures:
#Out to Other : XX
(j|) !X
(S|) = 1
(j|) ! (i|) (10)
(M 1)N/M 6 = i6= 6 =j
!DGCK
DGCK
#In from Other :
1 X
(S|) ! (j|) = XX
(i|) ! (j|) (11) (M 1)N/M
6
!DGCK = i6
DGCK= 6 =j
#In + Out Other :
(j|) !X
(S|) = 6=
!DGCK
XX (i|) ! (j|) + (j|) ! (i|)
6 i6
DGCK= =j
(12) 2(M 1)N/M
where #Out-to-Other is the number of other types of entities that are significantly
Granger-caused by entity j, #In-from-Other is the number of other types of entities
that significantly Granger-cause entity j, and #In+Out-Other is the sum of the two.
(iv) Closeness. Closeness measures the shortest path between an entity and all other en-
tities reachable from it, averaged across all other entities. To construct this measure,
we first define j as weakly causally C-connected to i if there exists a causality path of
length C between i and j, i.e., there exists a sequence of nodes k1, . . . , kC1 such that:
C(j ! k1) (k1 ! k2) · · · (kC1 ! i) (j ! i) = 1 .
7
Denote by Cji the length of the shortest C-connection between j to i:
C
Cji min C 2 [1, N1] : (j ! i) = 1 , (13)
C
Cwhere we set Cji = N1 if (j ! i)=0 for all C2 [1, N1]. The closeness measure for
entity j is then defined as:
1 CCjS| =
XCji(j ! i) .DGCK N 1
DGCK
i6=j
(v) Eigenvector centrality. The eigenvector centrality measures the importance of an entity
in a network by assigning relative scores to entities based on how connected they are
to the rest of the network. First, define the adjacency matrix A as the matrix with
elements:
[A]ji = (j ! i) . (14)
The eigenvector centrality measure is the eigenvector v of the adjacency matrix asso-
ciated with eigenvalue 1, i.e., in matrix form:
Av = v .
Equivalently, the eigenvector centrality of j can be written as the sum of the eigenvector
centralities of institutions caused by j:
N
vj|DGCK = X
[A] vi|DGCK .ji i=1
If the adjacency matrix has non-negative entries, a unique solution is guaranteed to
exist by the Perron-Frobenius theorem.
Network measures described above applied to the “Fair Value CDS” spreads allow us
to capture changes in correlation and causality between financial institutions and sovereign
countries. Billio, Getmansky, Lo, and Pelizzon (2012) use PCA and linear and non-linear
8
Granger-causality tests to estimate connectedness measures for banks, insurance companies,
hedge funds, and brokers using asset returns. Using contingent claims analysis (CCA) and
network theory we propose new ways to measure and analyze the system of connections
among sovereigns and credit risks of individual financial institutions.
The new approach that we propose will allow practitioners and policy makers to focus
in a comprehensive way on assessing network externalities caused by the interconnectedness
between financial institutions, financial markets, and sovereign countries and their e§ect on
systemic risk. Our approach allows us to highlight the size, interconnectedness, and com-
plexity of individual financial institutions and their inter-relationships with sovereign risk,
and to access whether this creates vulnerabilities to the system. We also aim to emphasize
the importance of the use of system-wide stress-testing approaches to evaluate vulnerabilities
and potential impact of “destructive-feedback loops”. The issues systemic risk and financial
stability are very important to practitioners, academics, and regulators.
3 Data
The pricing data for the sovereign credit default swaps used in this study are obtained from
Bloomberg which collects CDS market quotation data from industry sources. We consider the
5-years dollar denominated CDS of European countries, U.S. and Japan. We use 5-year CDS
because they are the most liquid. We consider 17 Sovereigns: 10 EMU (Austria, Belgium,
Germany, Spain, France, Greece, Ireland, Italy, Netherland, Portugal), 4 EU (Denmark,
Sweeden, UK, Norway), Switzerland (CH), U.S. and Japan (JA).
Moody’s KMV provided us the ELR for 63 Banks (34 EMU, 11 EU, 2 CH, 12 US, 4 JA)
and 39 Insurance Companies (9 EMU, 6 EU, 16 US, 2 CH and 5 CA). The data sample
ranges from January 2001 till March 2012.
INSERT Table (1) HERE
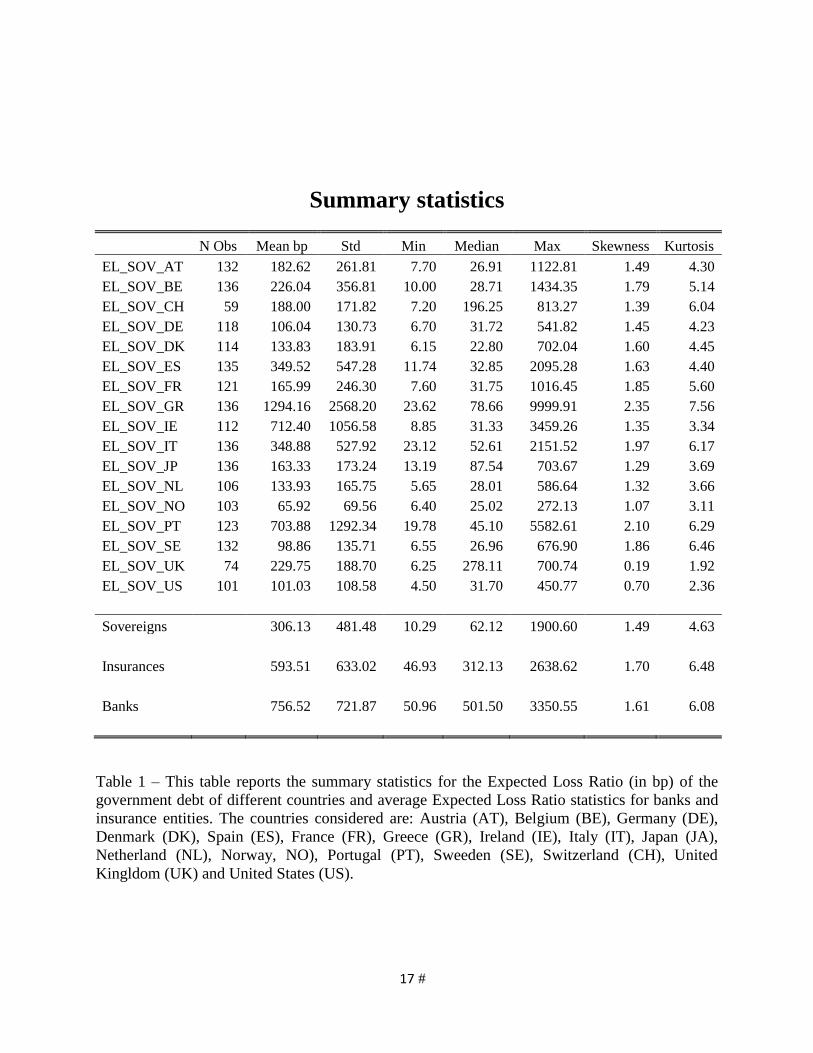
Table 1 shows that on average expected losses of sovereigns are lower than those of
insurances and banks, however, for most of the peripheral European countries this is not the
case. For the sample considered, the variability of the expected losses is quite large and the
distribution, as expected is not normal.
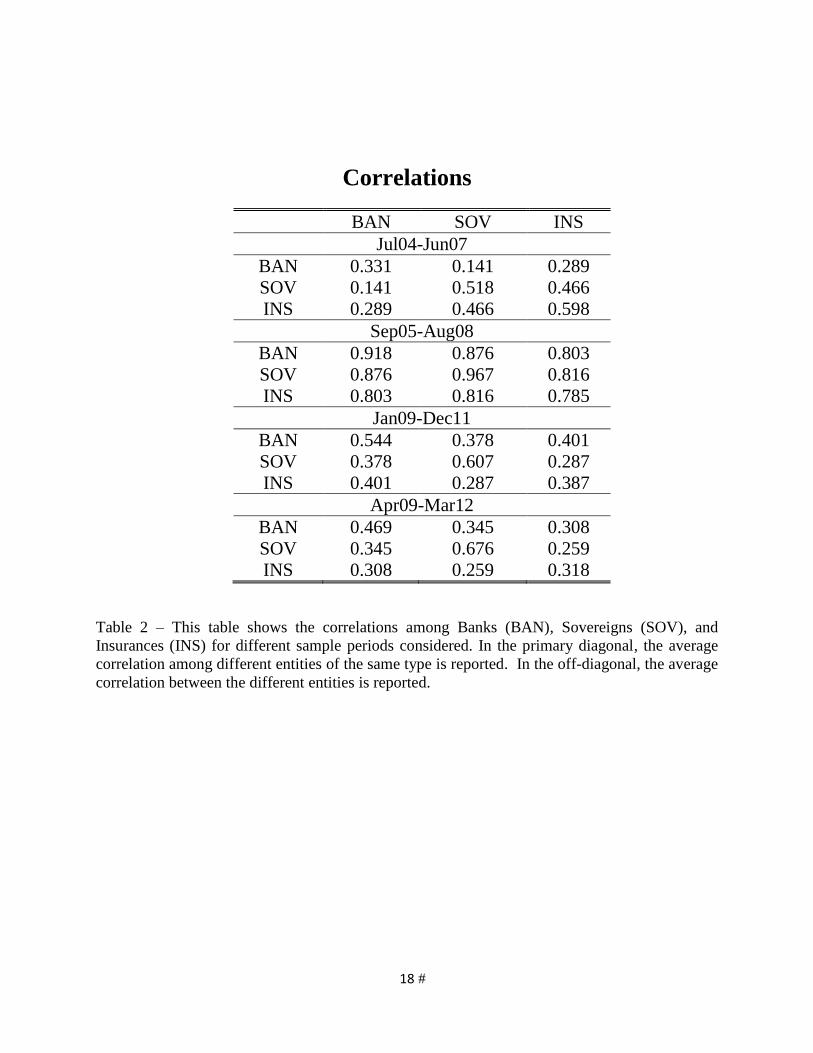
We have also investigated correlations between countries and di§erent financial insti-
tutions for four di§erent time periods: (July 2004—June 2007 is a period before the global
9
financial crisis), (September 2005—August 2008 encompasses the global financial crisis), (Jan-
uary 2009—December 2011 and April 2009—March 2012 capture the period of the European
sovereign crisis). Results are reported in Table 2.
INSERT Table (2) HERE
As Table 2 shows, correlations between banks, insurances, and sovereigns have on average
increased a lot from the pre-crisis sample (July 2004—June 2007). It is interesting that
during the European Sovereign crisis (period of April 2009—March 2012), the correlation
of sovereigns with banks and insurance companies, as well as average correlation between
sovereigns is lower compared to the global financial crisis in the period of September 2005—
August 2008. This aspect will be investigated more deeply by looking at correlations and
relationships between peripheral European countries and the network representation of the
system of sovereigns and financial entities.
4 Results
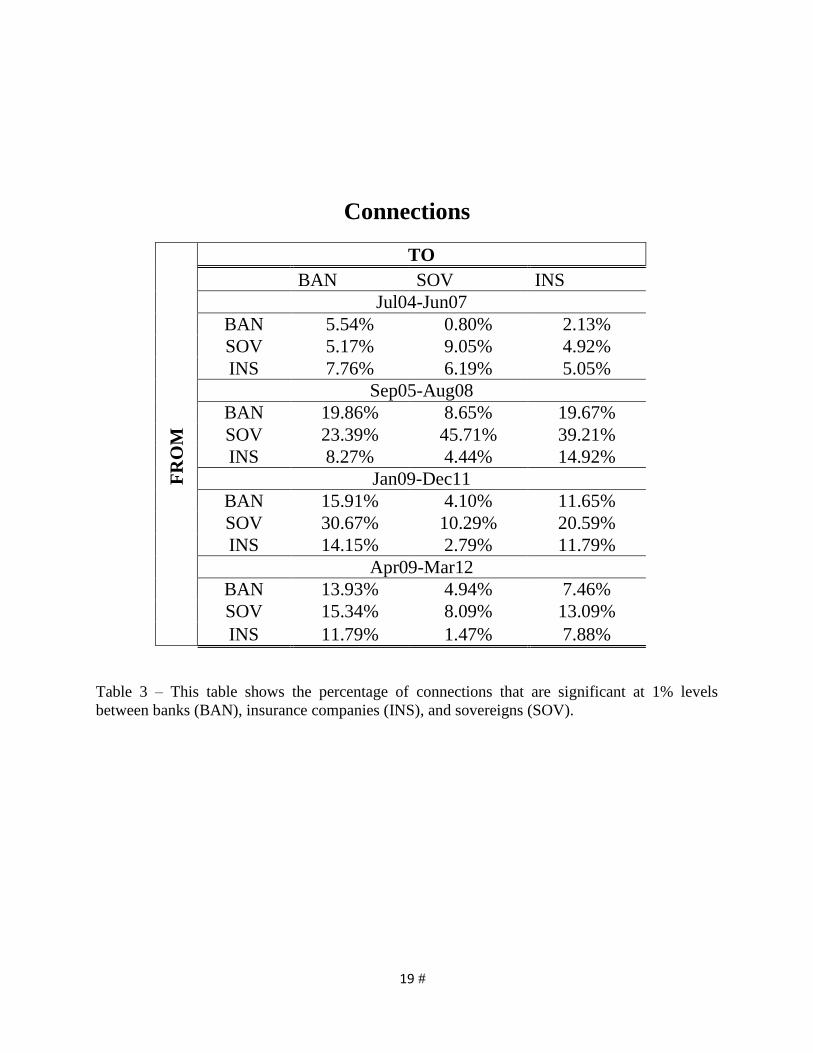
We further calculate network measures developed in Section 2.2. In Table 3 we tabulate the
percentage of causal connections between banks, sovereigns, and insurance companies that
are significant at 1% for the same time periods as considered in Table 2: (July 2004—June 2007
is a period before the global financial crisis), (September 2005—August 2008 encompasses the
global financial crisis), (January 2009—December 2011 and April 2009—March 2012 capture
the period of the European sovereign crisis).
INSERT Table (3) HERE
Table 3 shows that the interconnections are not symmetric. Sovereigns on average a§ect
banks, insurance companies, and other sovereigns more than banks and insurance companies
a§ect sovereigns. Specifically given sovereigns experience high expected loss ratio, they are
more likely to a§ect other sovereigns, banks, and insurance companies’ expected loss ratio
compared to being a§ected by these entities. This relationship is consistent across di§erent
time periods used (Table 3). Moreover, banks are playing a relevant role in a§ecting other
entities mostly during the global financial crisis of 2007—2008, but their role is largely reduced
after this period. During the global financial crisis, sovereigns largely Granger cause banks
(23.39%), insurance companies (39.21%), with other sovereigns having the largest e§ect
10
(45.71%). Even though the percentage of significant connections continued to be large during
the European Sovereign crisis, the magnitude changed, now with sovereigns being a§ected the
least by other sovereigns (10.29%), and banks (30.67%) and insurance companies (20.59%)
being largely a§ected by sovereigns. However, not all sovereign behaves in the same way and
a more holistic view need to be performed.
Figure 2 illustrates the connectedness between sovereigns, banks, and insurance compa-
nies prior to the global financial crisis of 2008—2009 Crisis, July 2004—June 2007. Using Ex-
pected Loss Ratio (ELR) of sovereigns, banks, and insurance companies this figures provides
a network diagram of linear Granger-causality relationships that are statistically significant
at the 1% level. We suggest to the reader to focus on the density of the mass and the colors
of the lines in Figure 1, not the detailed print. Banks are depicted in red, insurance com-
panies are in blue, and sovereigns are in black. The density of the lines represents all the
connections; thicker lines represent more significant connections among entities. As Figure
2 shows, there are some connections but they are quite sparse and rare.
INSERT Figure (2) HERE
INSERT Figure (3) HERE
Figure 3 illustrates the connectedness of the same set of banks, insurance companies, and
sovereigns just after the most intense period of the crisis, April 2009—March 2012. Figure
4 reveals much greater density–connectedness–everywhere. Note that this illustration is
not a reflection of how much business or transactions the entities do with each other; rather,
it shows connectedness related solely to their impact on the credit of one another. Second,
banks (red lines) and sovereigns (black lines) are more noticeable and have a greater reach
across the globe than in Figure 1. In short, the post-2008—2009 Crisis environment has a
much greater intensity of connectedness in terms of credit sensitivities than beforehand. This
is not per se a negative aspect, however it is indicating that ELR and therefore implicitly
the probability of defaults of the entities included in our analysis are more connected. Is it
indicating the system is more vulnerable? Potentially yes, because it is more connected and
therefore could be more fragile. For sure this indicates that these entities are much more
connected.
The extent to which sovereign risk is linked to banks and insurances varies through time
and across countries. Figure 4 reports the percentage of significant connections at the 1%
levels that the Grager causality analysis has highlighted (over a total of 1734 potential con-
nections from sovereign to the financial institutions and the same number from financial
11
institutions to sovereign). In the first part of the sample connections are largely from finan-
cial institutions like banks and insurances to sovereigns and in the second part, i.e. form
2009 sovereign stated to play a significant role and the number of connections for sovereign
to financial institutions are larger than vice versa. This suggests that risks embedded in
Sovereign cannot be readily isolated from the risk of the financial system and that a holistic
approach to both sectors is required.
INSERT Figure (4) HERE
We concentrate our analysis on GIIPS countries, i.e. Greece, Ireland, Italy, Portugal
and Spain, considered the most problematic countries in the Euro area. Figure 5 reports
the measure of eigenvector centrality of these five countries. We could observe that these
countries shows a level of eigenvector centrality largely larger of the average of this measure
for the 119 entities we considered well before the recent period well recognized as the Euro
crisis period starting in 2010. Figure 5 shows also that there has been an attempt to isolate
these potential e§ects of the crises of these countries on the other entities considered but in
the initial months of 2012 (before the Greece default) these di§erent countries do started to
become largely connected with the other entities considered in our sample.
INSERT Figure (5) HERE
To show the net e§ect of GIIPS countries we calculate the di§erence among the number
of significant connections from and to these countries. Figure 6 reports this dynamic and
shows that in the initial part of the sample considered they are largely receiving risk, so they
are a§ected by the risk of the increase of ELR of the other entities in the sample. In the
second part of the sample we have that their ELR is inducing an increase of the ELR of the
other entities rather than vice versa.
INSERT Figure (6) HERE
To provide an idea of the level of connections among the di§erent entities, in Figure
7, we represent the network as it appears before the financial crisis of 2007-2009. A first
observation is that the three di§erent entities: sovereign (Black), insurances (Blue) are highly
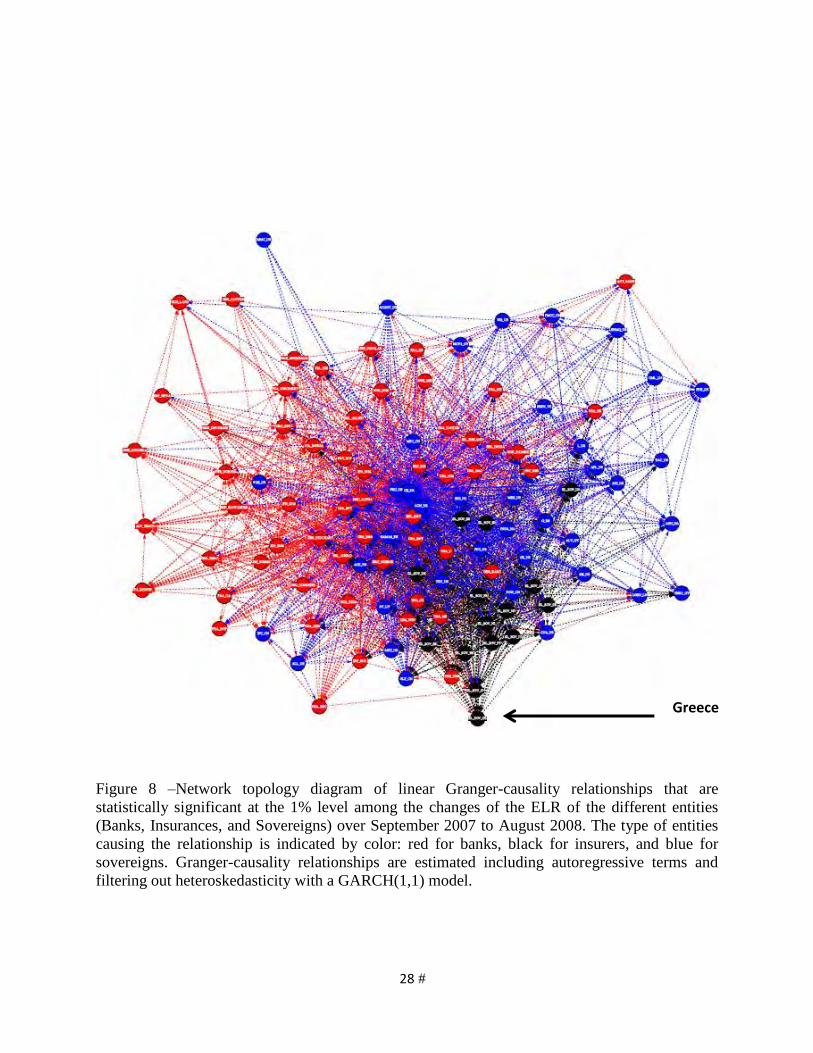
interrelated with their own categories. The pictures changes largely already at the beginning
of the financial crisis, already in August 2008 (and also before) banks and insurances become
12
to be largely connected among each others and sovereign becomes largely connected and more
central than before as Figure 8 shows. This indicates that sovereign risk shows up well before
the European Sovereign crisis of 2010-2012 if ELR measures are used. In particular, Figure 8
illustrates the connectedness of Greece in August 2008. Again, these are all the connections
with other sovereigns, with insurance companies, and with banks. Clearly, Greece was fairly
connected and the other European peripheral countries started to be central.
INSERT Figure (7) HERE
INSERT Figure (8) HERE
INSERT Figure (9) HERE
INSERT Figure (10) HERE
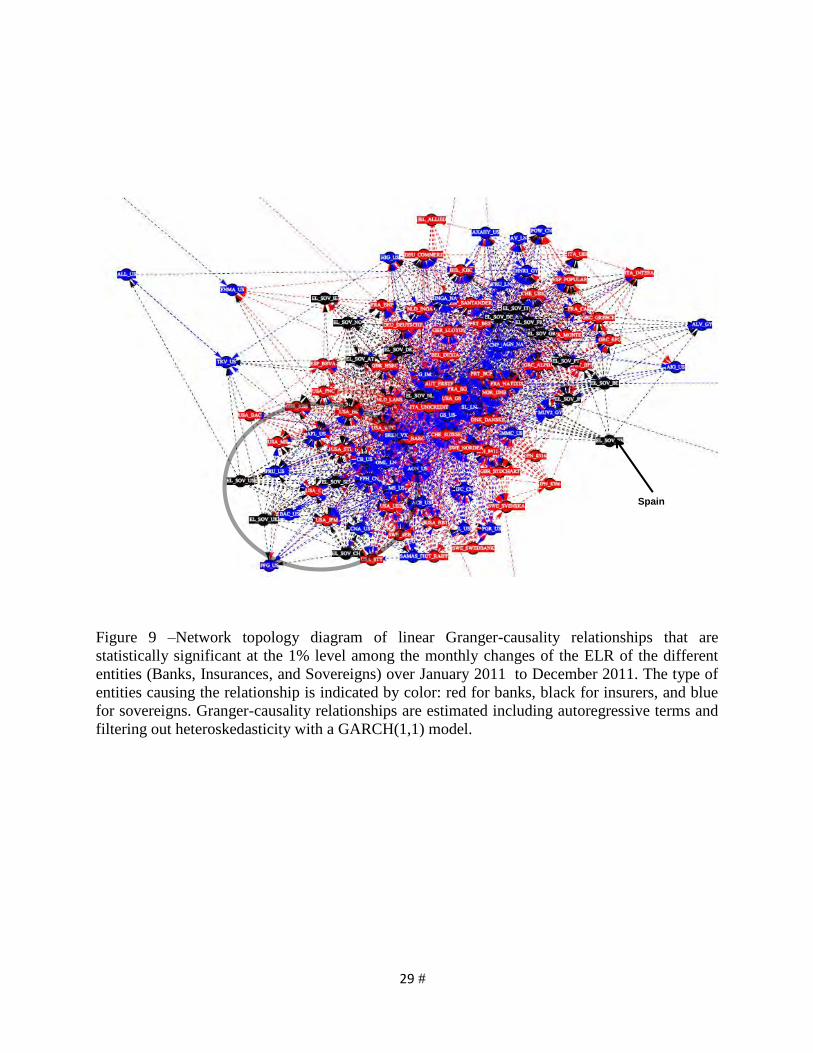
The centrality of the other problematic European countries like Spain and Italy appears
to be relevant in 2011. Figure 9 shows the relevant role of Spain as source of risk for the
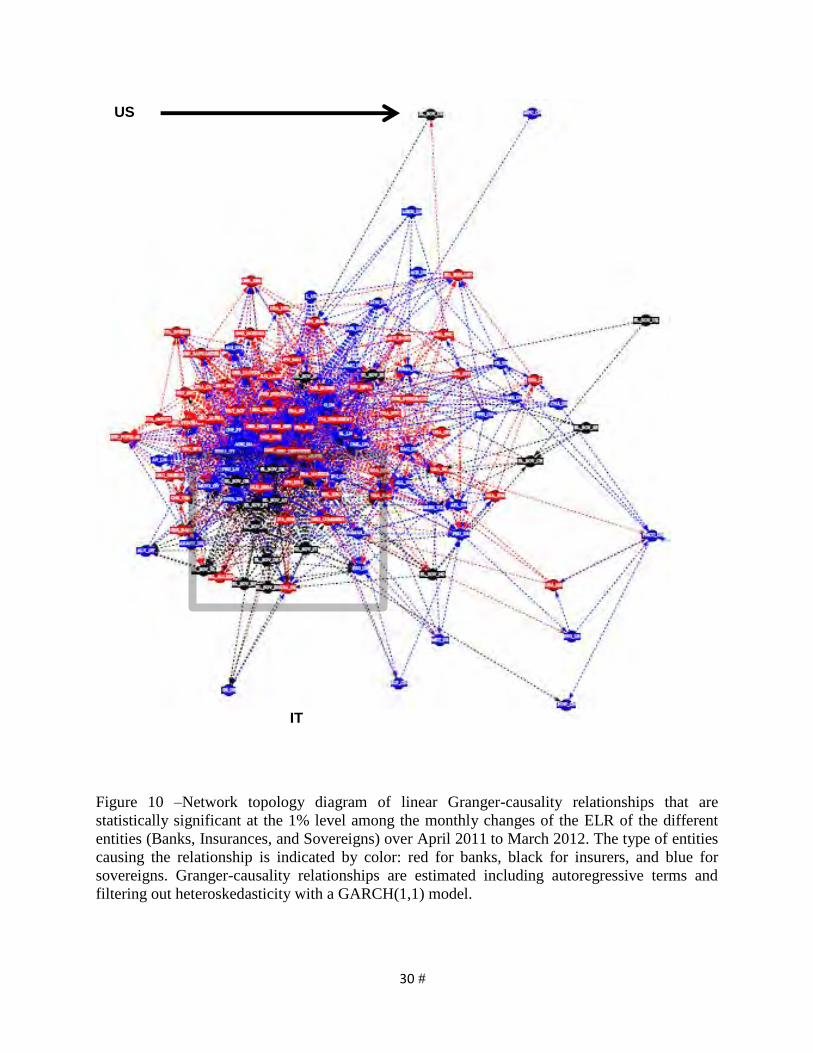
other Sovereign ELR as well as for banks and insurances. Figure 10 shows the centrality of
Italy at the time when Greece defaults. Note that the data reveal that in March 2012, the
United States had very little connectedness with any of the banks or sovereigns in Europe.
So, although the United States is a ma jor player in the financial system, it had very little
connectedness, either influencing or being influenced by the credit risk changes in institutions
or other sovereigns. In contrast, Italy at that time was highly connected. How does the degree
of connectedness between the di§erent types of entities vary over time? Our data suggest
that it varies quite substantially over time for the three di§erent network connections (i.e.,
banks to sovereigns, sovereigns to banks, and sovereigns to sovereigns). As in our earlier
demonstration of the nonlinear nature of the risk exposures of credit, these dynamic changes
in risk exposures would be expected in response to changing asset values and volatilities,
either up or down.
Certainly, one should be cautious in taking these measures of connectedness as actual
paths of causality among sovereigns and institutions on which revised investment decisions
or corrective policy might be considered. Instead these maps of connectedness should be
viewed as raising questions about what is going in the system which might not otherwise
be transparent. Subsequent investigation using other information sources and models would
then inform what, if any, steps should be taken.
13
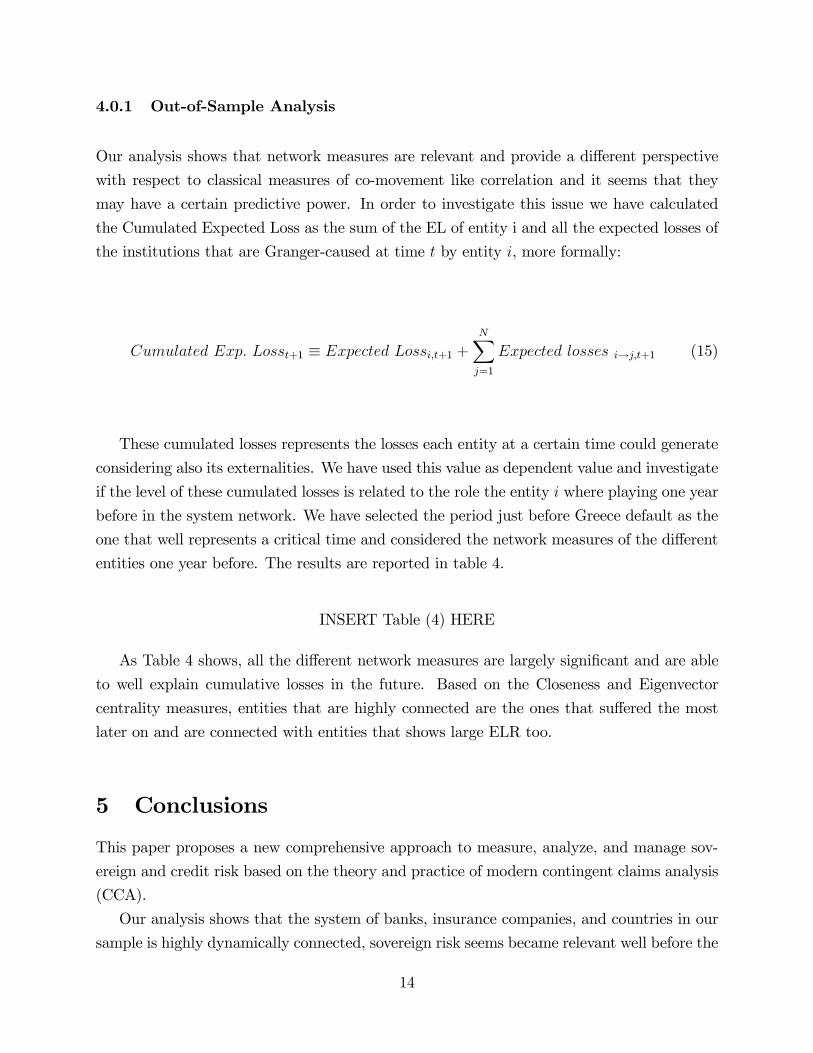
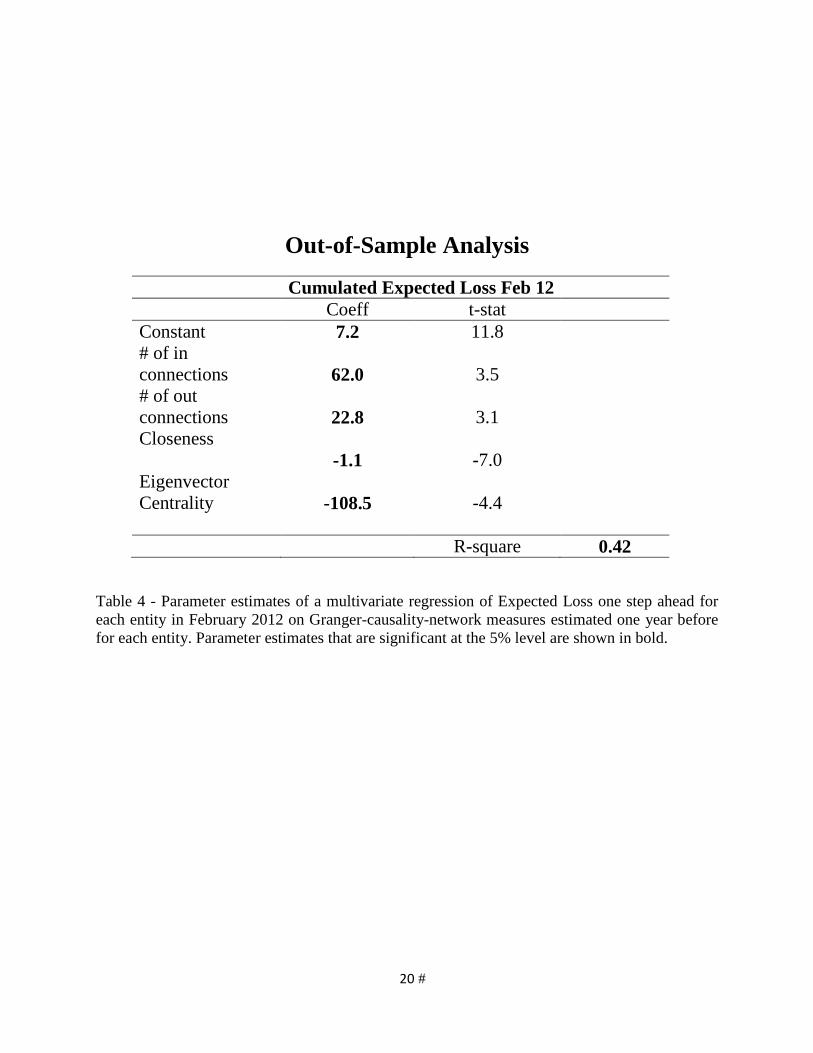
4.0.1 Out-of-Sample Analysis
Our analysis shows that network measures are relevant and provide a di§erent perspective
with respect to classical measures of co-movement like correlation and it seems that they
may have a certain predictive power. In order to investigate this issue we have calculated
the Cumulated Expected Loss as the sum of the EL of entity i and all the expected losses of
the institutions that are Granger-caused at time t by entity i, more formally:
N
Cumulated Exp. Losst+1 Expected Lossi,t+1 + X
Expected losses i!j,t+1 (15) j=1
These cumulated losses represents the losses each entity at a certain time could generate
considering also its externalities. We have used this value as dependent value and investigate
if the level of these cumulated losses is related to the role the entity i where playing one year
before in the system network. We have selected the period just before Greece default as the
one that well represents a critical time and considered the network measures of the di§erent
entities one year before. The results are reported in table 4.
INSERT Table (4) HERE
As Table 4 shows, all the di§erent network measures are largely significant and are able
to well explain cumulative losses in the future. Based on the Closeness and Eigenvector
centrality measures, entities that are highly connected are the ones that su§ered the most
later on and are connected with entities that shows large ELR too.
5 Conclusions
This paper proposes a new comprehensive approach to measure, analyze, and manage sov-
ereign and credit risk based on the theory and practice of modern contingent claims analysis
(CCA).
Our analysis shows that the system of banks, insurance companies, and countries in our
sample is highly dynamically connected, sovereign risk seems became relevant well before the
14

European Sovereign crisis of 2010—2012 and that network measures allow for early warnings
and assessment of the system complexity.
This framework can be used for the analysis of shocks, spillovers, and tradeo§s among
policy alternatives. We leave to further researches the investigation of the connections that
should be reduced so that the system would be less vulnerable.
6 References
Acemoglu D., V. M. Carvalho, A. Ozdaglar, A. Tahbaz-Salehi (2012), “The Network Origins of
Aggregate Fluctuations”, Econometrica, 80(5), pp. 1977-2016.
Acemoglu D., A. Ozdaglar, A. Tahbaz-Salehi (2013), Systemic Risk and Stability in Financial
Networks, MIT WP
Acharya, V., I. Drechsler, and P. Schnabl, 2011, “A Pyrrhic Victory? Bank Bailouts and Sovereign
Credit Risk.” NBER Working Paper No. 17136 .
Battiston, S., Delli Gatti, D., Gallegati, M., Greenwald, B. C., Stiglitz, J.E., 2009. Liasons
dangereuses: increasing connectivity, risk sharing, and systemic risk. Unpublished working
paper. NBER Working Paper No. 15611.
Billio, M., Getmansky, M., Lo, A.W., and L. Pelizzon, 2012, “Econometric Measures of Con-
nectedness and Systemic Risk in the Finance and Insurance Sectors,” Journal of Financial
Economics 104, 535—559.
Black, F. and M. Scholes, 1973, “The Pricing of Options and Corporate Liabilities,” Journal of
Political Economy 81, May-June, 637—654.
Degryse, H., M. A. Elahi, and M. F. Penas, 2010, “Cross-Border Exposures and Financial Conta-
gion,” International Review of Finance 10, 2, 209—240.
Gray, D. F., Merton R. C. and Z. Bodie, 2007, “Contingent Claims Approach to Measuring and
Managing Sovereign Credit Risk,” Journal of Investment Management 5, 4, 5—28.
Kallestrup R., D. Lando, and A. Murgoci, 2012, “Financial sector linkages and the dynamics of
sovereign and bank credit spreads,” Copenhagen WP.
Longsta§, F., J. Pan, L. H. Pedersen, and K. Singleton, 2011, “How Sovereign is Sovereign Credit
Risk?” American Economic Journal: Macroeconomics 3, 2, 75—103.
15
KMV Corporation, 1999, “Modeling Default Risk,” Moody’s KMV.
Merton, R.C., 1973, “Theory of Rational Option Pricing,” Bell Journal of Economics and Man-
agement Science 4, Spring, 141—183.
Merton, R.C., 1974, “On the Pricing of Corporate Debt: The Risk Structure of Interest Rates,”
Journal of Finance 29, 449—470.
Merton, R.C., 1992, Continuous-Time Finance. Oxford, U.K.: Basil Blackwell, (Rev.ed.).
Merton, R.C., 1998, “Applications of Option-Pricing Theory: Twenty-Five Years Later,” Ameri-
can Economic Review June, 323—349.
Muirhead, R. J., 1982. Aspects of Multivariate Statistical Theory. John Wiley & Sons, New York.
Schweikhard, F. A. and Z. Tsesmelidakis, The Impact of Government Interventions on CDS and
Equity Markets, 2012 (2010), University of Oxford, the Oxford-Man Institute and Saïd Busi-
ness School.
16
Summary statistics
N Obs Mean bp Std Min Median Max Skewness Kurtosis EL_SOV_AT 132 182.62 261.81 7.70 26.91 1122.81 1.49 4.30 EL_SOV_BE 136 226.04 356.81 10.00 28.71 1434.35 1.79 5.14 EL_SOV_CH 59 188.00 171.82 7.20 196.25 813.27 1.39 6.04 EL_SOV_DE 118 106.04 130.73 6.70 31.72 541.82 1.45 4.23 EL_SOV_DK 114 133.83 183.91 6.15 22.80 702.04 1.60 4.45 EL_SOV_ES 135 349.52 547.28 11.74 32.85 2095.28 1.63 4.40 EL_SOV_FR 121 165.99 246.30 7.60 31.75 1016.45 1.85 5.60 EL_SOV_GR 136 1294.16 2568.20 23.62 78.66 9999.91 2.35 7.56 EL_SOV_IE 112 712.40 1056.58 8.85 31.33 3459.26 1.35 3.34 EL_SOV_IT 136 348.88 527.92 23.12 52.61 2151.52 1.97 6.17 EL_SOV_JP 136 163.33 173.24 13.19 87.54 703.67 1.29 3.69 EL_SOV_NL 106 133.93 165.75 5.65 28.01 586.64 1.32 3.66 EL_SOV_NO 103 65.92 69.56 6.40 25.02 272.13 1.07 3.11 EL_SOV_PT 123 703.88 1292.34 19.78 45.10 5582.61 2.10 6.29 EL_SOV_SE 132 98.86 135.71 6.55 26.96 676.90 1.86 6.46 EL_SOV_UK 74 229.75 188.70 6.25 278.11 700.74 0.19 1.92 EL_SOV_US 101 101.03 108.58 4.50 31.70 450.77 0.70 2.36
Sovereigns 306.13 481.48 10.29 62.12 1900.60 1.49 4.63
Insurances 593.51 633.02 46.93 312.13 2638.62 1.70 6.48
Banks 756.52 721.87 50.96 501.50 3350.55 1.61 6.08
Table 1 – This table reports the summary statistics for the Expected Loss Ratio (in bp) of the government debt of different countries and average Expected Loss Ratio statistics for banks and insurance entities. The countries considered are: Austria (AT), Belgium (BE), Germany (DE), Denmark (DK), Spain (ES), France (FR), Greece (GR), Ireland (IE), Italy (IT), Japan (JA), Netherland (NL), Norway, NO), Portugal (PT), Sweeden (SE), Switzerland (CH), United Kingldom (UK) and United States (US).
17#
Correlations
BAN SOV INS Jul04-Jun07
BAN 0.331 0.141 0.289 SOV 0.141 0.518 0.466 INS 0.289 0.466 0.598
Sep05-Aug08 BAN 0.918 0.876 0.803 SOV 0.876 0.967 0.816 INS 0.803 0.816 0.785
Jan09-Dec11 BAN 0.544 0.378 0.401 SOV 0.378 0.607 0.287 INS 0.401 0.287 0.387
Apr09-Mar12 BAN 0.469 0.345 0.308 SOV 0.345 0.676 0.259 INS 0.308 0.259 0.318
Table 2 – This table shows the correlations among Banks (BAN), Sovereigns (SOV), and Insurances (INS) for different sample periods considered. In the primary diagonal, the average correlation among different entities of the same type is reported. In the off-diagonal, the average correlation between the different entities is reported.
18#
Connections
FRO
M
TO BAN SOV INS
Jul04-Jun07 BAN SOV INS
5.54% 0.80% 5.17% 9.05% 7.76% 6.19%
2.13% 4.92% 5.05%
Sep05-Aug08 BAN SOV INS
19.86% 8.65% 23.39% 45.71% 8.27% 4.44%
19.67% 39.21% 14.92%
Jan09-Dec11 BAN SOV INS
15.91% 4.10% 30.67% 10.29% 14.15% 2.79%
11.65% 20.59% 11.79%
Apr09-Mar12 BAN SOV INS
13.93% 4.94% 15.34% 8.09% 11.79% 1.47%
7.46% 13.09% 7.88%
Table 3 – This table shows the percentage of connections that are significant at 1% levels between banks (BAN), insurance companies (INS), and sovereigns (SOV).
19#
Out-of-Sample Analysis Cumulated Expected Loss Feb 12
Constant # of in connections # of out connections Closeness
Eigenvector Centrality
Coeff 7.2
62.0
22.8
-1.1
-108.5
t-stat 11.8
3.5
3.1
-7.0
-4.4
R-square 0.42
Table 4 - Parameter estimates of a multivariate regression of Expected Loss one step ahead for each entity in February 2012 on Granger-causality-network measures estimated one year before for each entity. Parameter estimates that are significant at the 5% level are shown in bold.
20#
Spillovers from the Sovereign to the Banks and Banks to Sovereigns#
DOMESTIC
FOREIGN
SOVEREIGN
BANKS
SOVEREIGN
A. Mark-to-market fall in
value of govt bonds
held by local banks
C. Erosion in potential
for official support
D. Mark-to-market fall in
value of govt. bonds
held by foreign banks
E. Similar
sovereigns come
under pressure
F. Contagion channels
(A, B, & C as above)
G. Rise in counter-
party credit risk
H. Withdrawal
of funding for
risky banks BANKS
B. Increase in bank
funding costs
I. Increase in
contingent
liabilities of
govt.
I. Increase in contingent
liabilities of govt.
Figure 1 – This figure shows the potential channels of spillovers from Sovereign risk to banks’ risk and vice versa.
21#
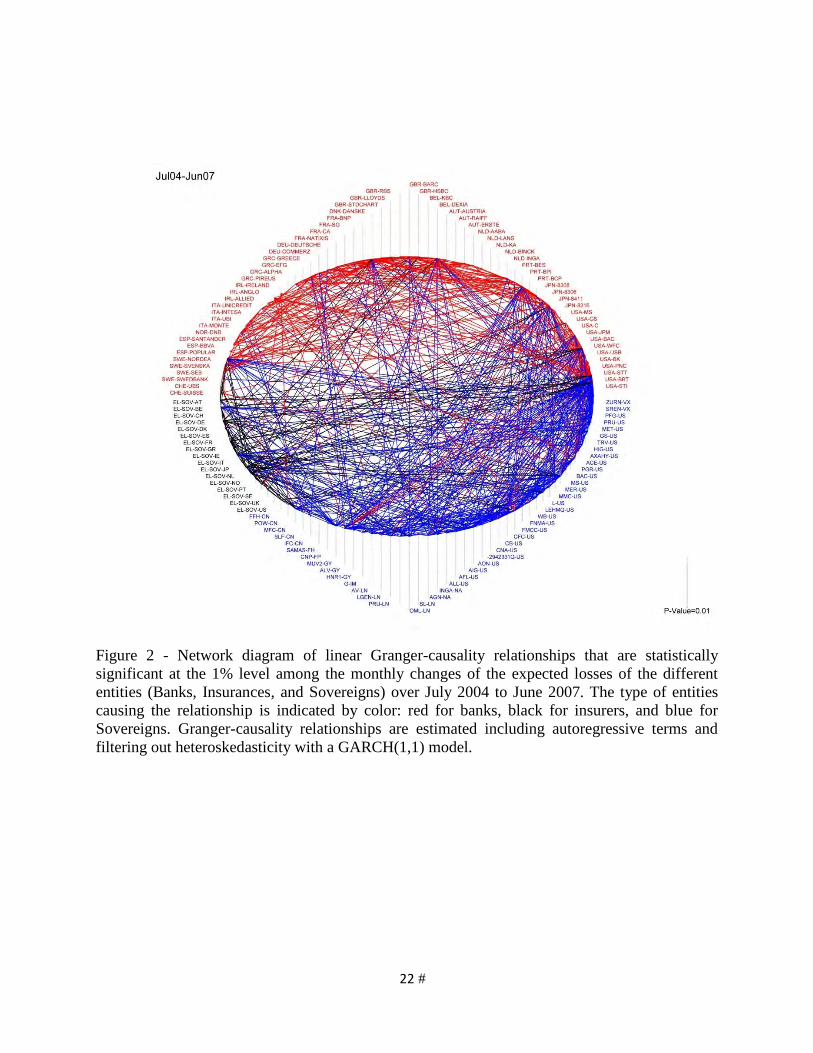
Figure 2 - Network diagram of linear Granger-causality relationships that are statistically significant at the 1% level among the monthly changes of the expected losses of the different entities (Banks, Insurances, and Sovereigns) over July 2004 to June 2007. The type of entities causing the relationship is indicated by color: red for banks, black for insurers, and blue for Sovereigns. Granger-causality relationships are estimated including autoregressive terms and filtering out heteroskedasticity with a GARCH(1,1) model.
22#
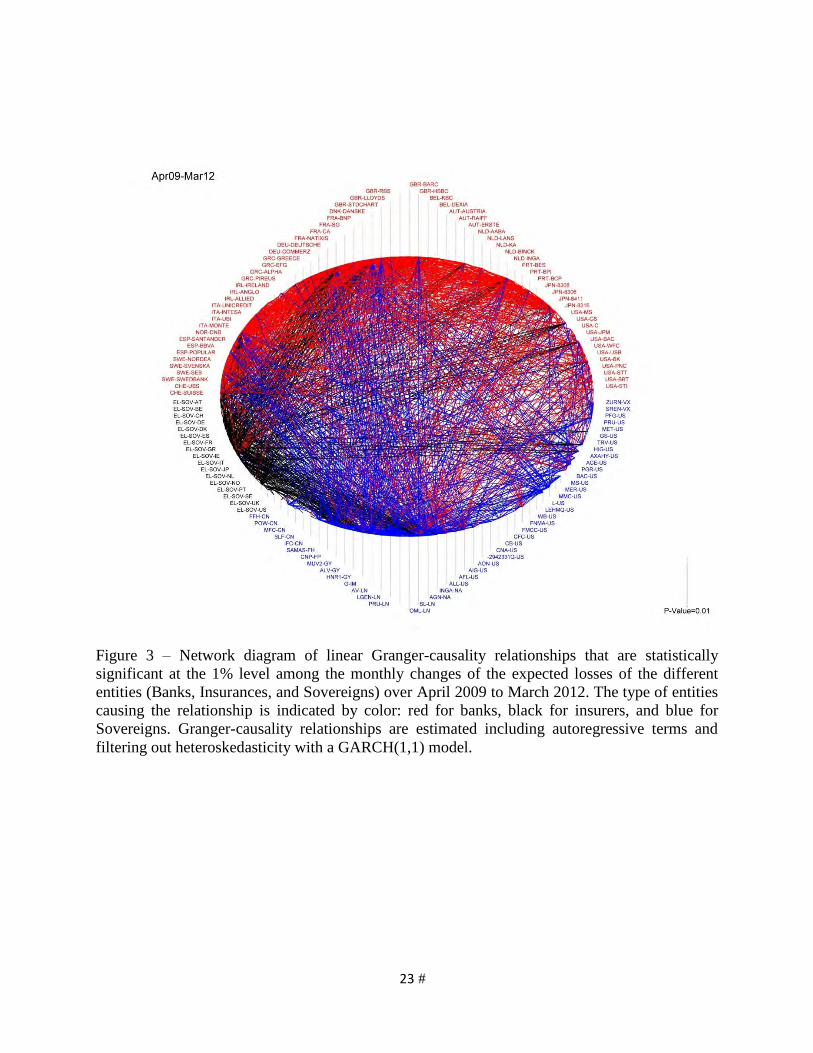
Figure 3 – Network diagram of linear Granger-causality relationships that are statistically significant at the 1% level among the monthly changes of the expected losses of the different entities (Banks, Insurances, and Sovereigns) over April 2009 to March 2012. The type of entities causing the relationship is indicated by color: red for banks, black for insurers, and blue for Sovereigns. Granger-causality relationships are estimated including autoregressive terms and filtering out heteroskedasticity with a GARCH(1,1) model.
23#
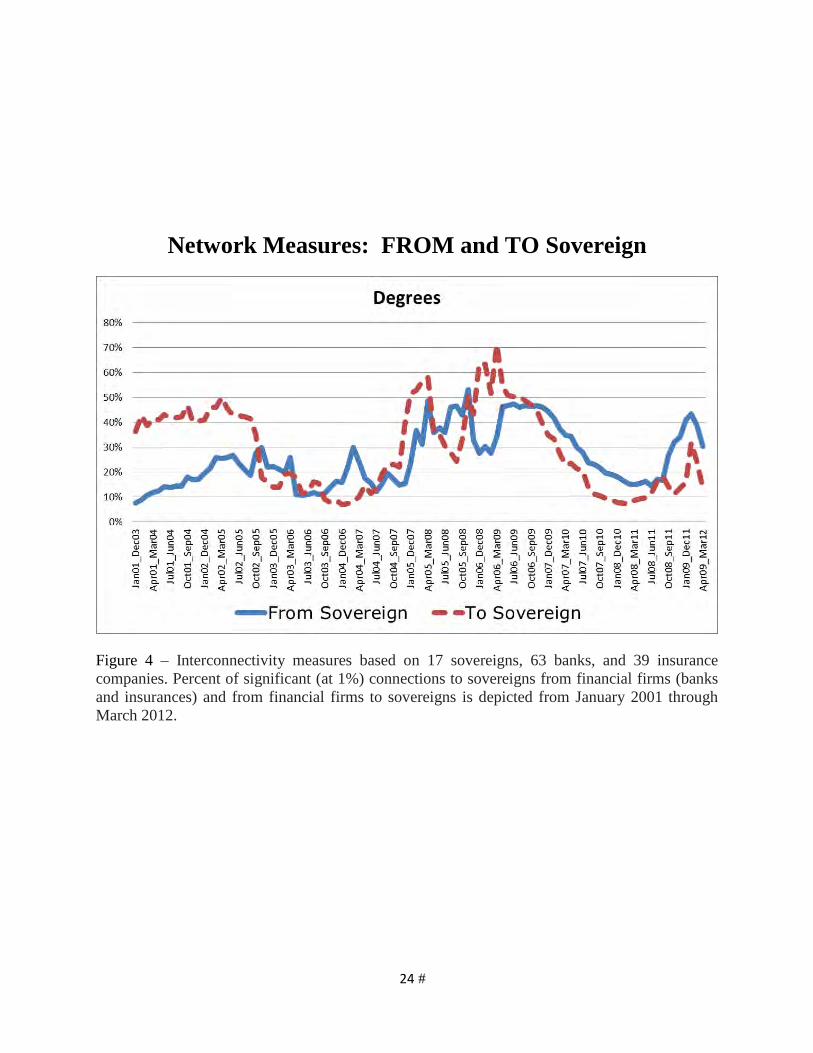
Network Measures: FROM and TO Sovereign
Figure 4 – Interconnectivity measures based on 17 sovereigns, 63 banks, and 39 insurance companies. Percent of significant (at 1%) connections to sovereigns from financial firms (banks and insurances) and from financial firms to sovereigns is depicted from January 2001 through March 2012.
24#
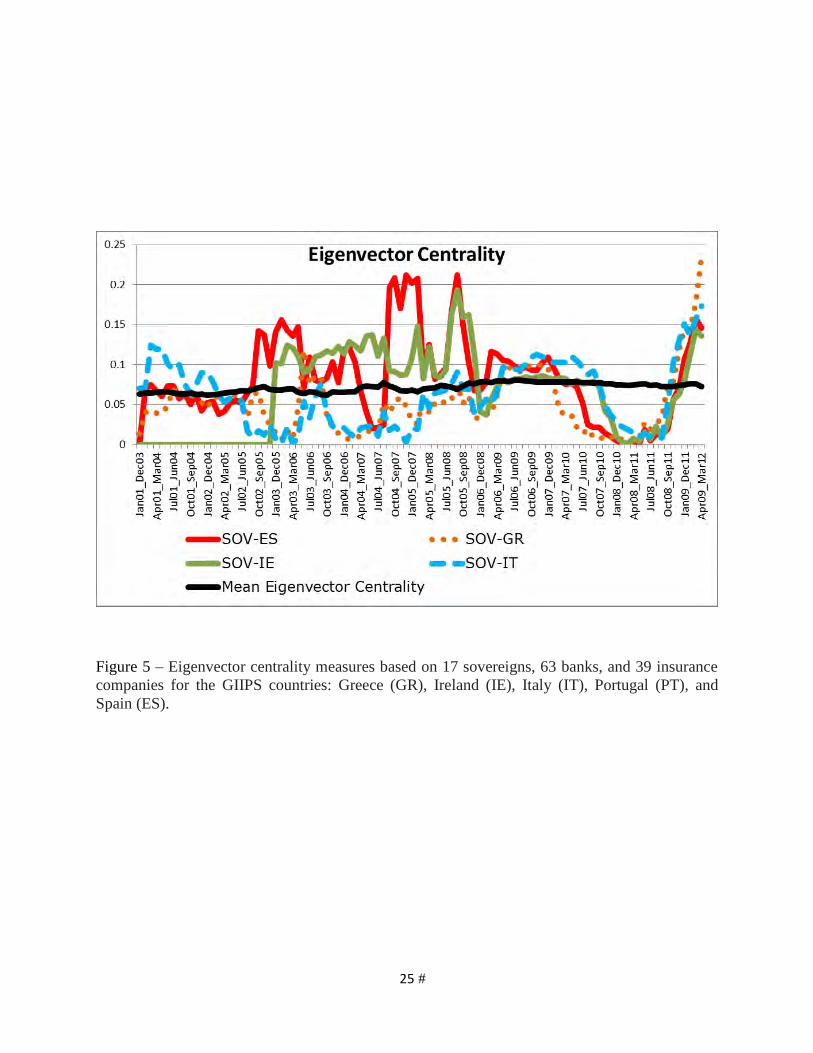
Figure 5 – Eigenvector centrality measures based on 17 sovereigns, 63 banks, and 39 insurance companies for the GIIPS countries: Greece (GR), Ireland (IE), Italy (IT), Portugal (PT), and Spain (ES).
25#
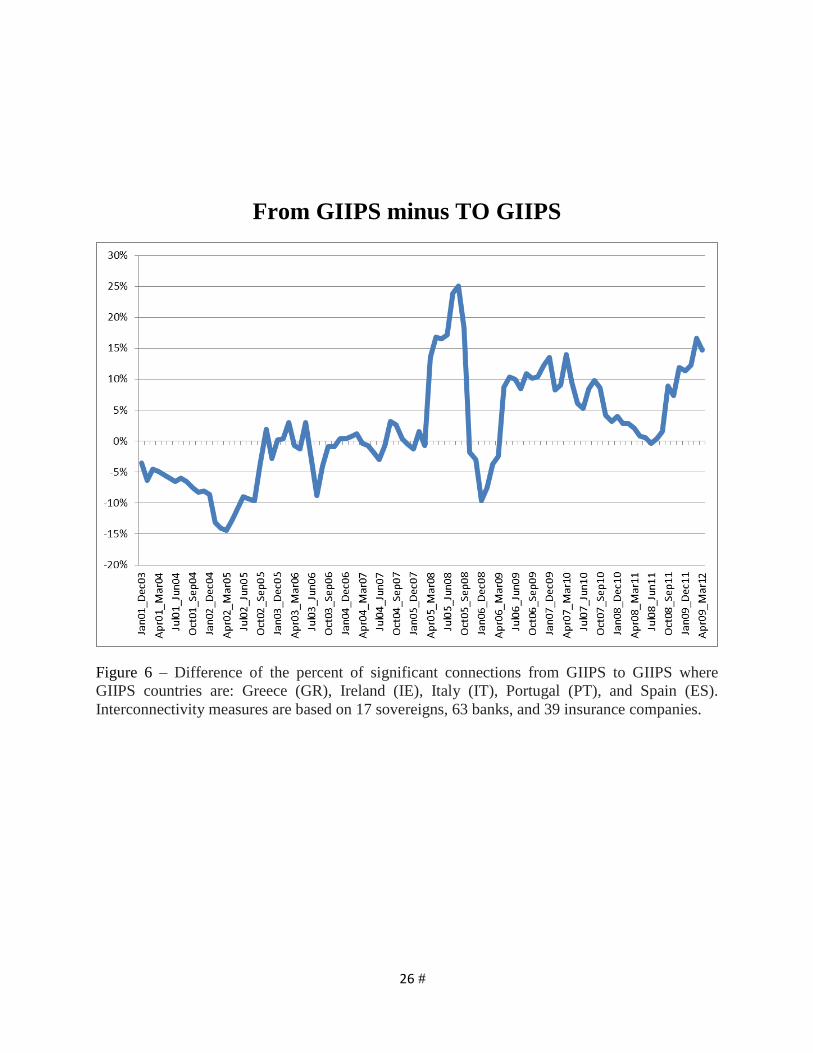
From GIIPS minus TO GIIPS
Figure 6 – Difference of the percent of significant connections from GIIPS to GIIPS where GIIPS countries are: Greece (GR), Ireland (IE), Italy (IT), Portugal (PT), and Spain (ES). Interconnectivity measures are based on 17 sovereigns, 63 banks, and 39 insurance companies.
26#
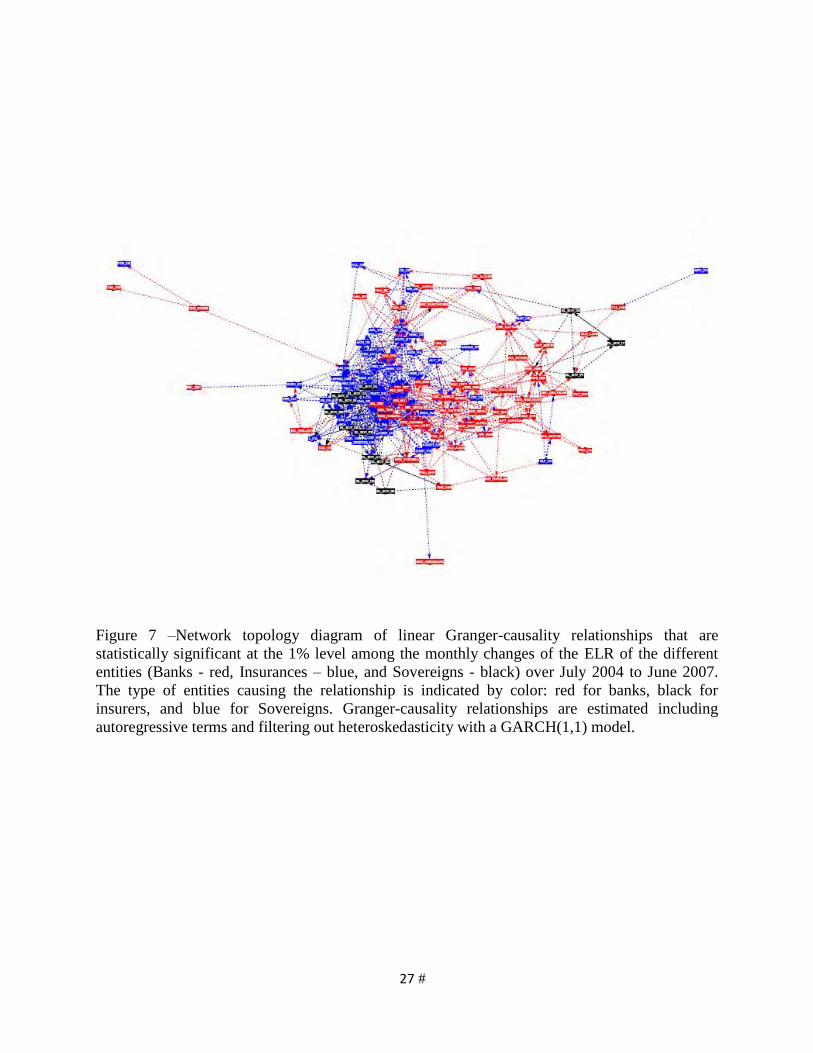
Figure 7 –Network topology diagram of linear Granger-causality relationships that are statistically significant at the 1% level among the monthly changes of the ELR of the different entities (Banks - red, Insurances – blue, and Sovereigns - black) over July 2004 to June 2007. The type of entities causing the relationship is indicated by color: red for banks, black for insurers, and blue for Sovereigns. Granger-causality relationships are estimated including autoregressive terms and filtering out heteroskedasticity with a GARCH(1,1) model.
27#
Greece
Figure 8 –Network topology diagram of linear Granger-causality relationships that are statistically significant at the 1% level among the changes of the ELR of the different entities (Banks, Insurances, and Sovereigns) over September 2007 to August 2008. The type of entities causing the relationship is indicated by color: red for banks, black for insurers, and blue for sovereigns. Granger-causality relationships are estimated including autoregressive terms and filtering out heteroskedasticity with a GARCH(1,1) model.
28#
Spain
Figure 9 –Network topology diagram of linear Granger-causality relationships that are statistically significant at the 1% level among the monthly changes of the ELR of the different entities (Banks, Insurances, and Sovereigns) over January 2011 to December 2011. The type of entities causing the relationship is indicated by color: red for banks, black for insurers, and blue for sovereigns. Granger-causality relationships are estimated including autoregressive terms and filtering out heteroskedasticity with a GARCH(1,1) model.
29#
US
IT
Figure 10 –Network topology diagram of linear Granger-causality relationships that are statistically significant at the 1% level among the monthly changes of the ELR of the different entities (Banks, Insurances, and Sovereigns) over April 2011 to March 2012. The type of entities causing the relationship is indicated by color: red for banks, black for insurers, and blue for sovereigns. Granger-causality relationships are estimated including autoregressive terms and filtering out heteroskedasticity with a GARCH(1,1) model.
30#