sovereign risk and deposit dynamics: evidence …wp/16/145 sovereign risk and deposit dynamics:...
TRANSCRIPT

WP/16/145
Sovereign Risk and Deposit Dynamics: Evidence from Europe
by David A. Grigorian and Vlad Manole
IMF Working Papers describe research in progress by the author(s) and are published to elicit comments and to encourage debate. The views expressed in IMF Working Papers are those of the author(s) and do not necessarily represent the views of the IMF, its Executive Board, or IMF management.

© 2016 International Monetary Fund WP/16/145
IMF Working Paper
Monetary and Capital Markets Department
Sovereign Risk and Deposit Dynamics: Evidence from Europe 1
Prepared by David Grigorian and Vlad Manole
Authorized for distribution by Marina Moretti
July 2016
Abstract
The unprecedented expansion of sovereign balance sheets since the global financial crisis has given a new meaning to the term sovereign risk. Developments in Europe since early 2010 presented new challenges for the functioning of private banks in an environment of heightened sovereign risk. This paper uses an innovative way of measuring the perception of sovereign risk and its impact on deposit dynamics during 2006–11. Using an extension of a common market discipline framework, it shows that exposure to sovereign risk may have limited the ability of banks in Europe to attract deposits. The results are robust to inclusion of conventional measures of bank performance and the sector-wide holdings of foreign sovereign debt.
JEL Classification Numbers: E44, G21, and G28
Keywords: Sovereign risk, market discipline, bank deposits, European crisis
Author’s E-Mail Address: [email protected] and [email protected]
1 David A. Grigorian, Monetary and Capital Markets Department, International Monetary Fund, and Vlad Manole, Department of Economics, Rutgers University. We would like to thank Stijn Claessens, Lucyna Gornicka, Inci Ötker, Michael Papaioannou, Alvaro Piris, Miguel Savastano, and Mariana Spatareanu for helpful comments, and Kay Chung and Gabriel Presciuttini for outstanding research assistance. The remaining errors are their own.
IMF Working Papers describe research in progress by the author(s) and are published to elicit comments and to encourage debate. The views expressed in IMF Working Papers are those of the author(s) and do not necessarily represent the views of the IMF, its Executive Board, or IMF management.
3
Content Page
Abstract ......................................................................................................................................2
I. Introduction and Motivation ...................................................................................................4
II. Literature Review ..................................................................................................................8
III. Empirical Estimation .........................................................................................................10
IV. Conclusion .........................................................................................................................17
Figures 1. Evolution of Total Bank Deposits in Select Euro Area Countries, 2008–12 .........................52. Total Net Borrowing Needs of the Public Sector as of 2010 .................................................6
Tables 1. Outstanding Stock of Government Guarantees ......................................................................72. Summary Statistics...............................................................................................................113. Fixed Effects Regressions, 2006–11 ....................................................................................144. Robustness Tests ..................................................................................................................16
Appendices I. Description of DEA Methodology and Choice of Inputs/Outputs .......................................21 II. Average Data Envelopment Analysis Indices by Country and Year ..................................23III. Country Classifications ......................................................................................................24
References……………………………………………………………………………………18
4
I. INTRODUCTION AND MOTIVATION
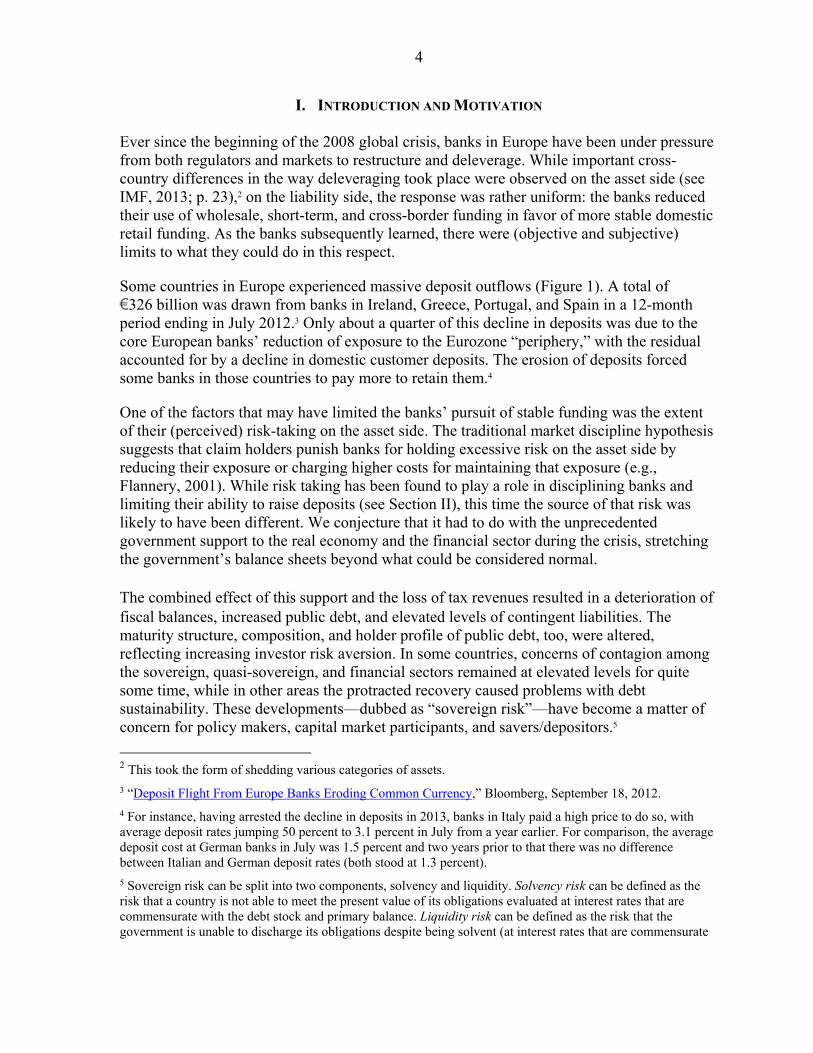
Ever since the beginning of the 2008 global crisis, banks in Europe have been under pressure from both regulators and markets to restructure and deleverage. While important cross-country differences in the way deleveraging took place were observed on the asset side (see IMF, 2013; p. 23),2 on the liability side, the response was rather uniform: the banks reduced their use of wholesale, short-term, and cross-border funding in favor of more stable domestic retail funding. As the banks subsequently learned, there were (objective and subjective) limits to what they could do in this respect.
Some countries in Europe experienced massive deposit outflows (Figure 1). A total of €326 billion was drawn from banks in Ireland, Greece, Portugal, and Spain in a 12-month period ending in July 2012.3 Only about a quarter of this decline in deposits was due to the core European banks’ reduction of exposure to the Eurozone “periphery,” with the residual accounted for by a decline in domestic customer deposits. The erosion of deposits forced some banks in those countries to pay more to retain them.4
One of the factors that may have limited the banks’ pursuit of stable funding was the extent of their (perceived) risk-taking on the asset side. The traditional market discipline hypothesis suggests that claim holders punish banks for holding excessive risk on the asset side by reducing their exposure or charging higher costs for maintaining that exposure (e.g., Flannery, 2001). While risk taking has been found to play a role in disciplining banks and limiting their ability to raise deposits (see Section II), this time the source of that risk was likely to have been different. We conjecture that it had to do with the unprecedented government support to the real economy and the financial sector during the crisis, stretching the government’s balance sheets beyond what could be considered normal. The combined effect of this support and the loss of tax revenues resulted in a deterioration of fiscal balances, increased public debt, and elevated levels of contingent liabilities. The maturity structure, composition, and holder profile of public debt, too, were altered, reflecting increasing investor risk aversion. In some countries, concerns of contagion among the sovereign, quasi-sovereign, and financial sectors remained at elevated levels for quite some time, while in other areas the protracted recovery caused problems with debt sustainability. These developments—dubbed as “sovereign risk”—have become a matter of concern for policy makers, capital market participants, and savers/depositors.5
2 This took the form of shedding various categories of assets.
3 “Deposit Flight From Europe Banks Eroding Common Currency,” Bloomberg, September 18, 2012.
4 For instance, having arrested the decline in deposits in 2013, banks in Italy paid a high price to do so, with average deposit rates jumping 50 percent to 3.1 percent in July from a year earlier. For comparison, the average deposit cost at German banks in July was 1.5 percent and two years prior to that there was no difference between Italian and German deposit rates (both stood at 1.3 percent).
5 Sovereign risk can be split into two components, solvency and liquidity. Solvency risk can be defined as the risk that a country is not able to meet the present value of its obligations evaluated at interest rates that are commensurate with the debt stock and primary balance. Liquidity risk can be defined as the risk that the government is unable to discharge its obligations despite being solvent (at interest rates that are commensurate

5
Source: IMF, International Financial Statistics. Note: For Spain, the series includes deposits created as a result of securitizations and of affiliates issuing preference shares and other financial instruments.
with the debt stock and primary balance) due to lack of liquidity. The conventional measures of sovereign risk are more narrowly focused on the probability of a sovereign government defaulting on its debt obligations. A wider construct, where core fiscal variables are complemented with elements reflecting (i) broader balance sheet developments; (ii) debt portfolio structure; (iii) investor base and cross-border linkages; and (iv) financial assets of a country would have been more meaningful, given recent developments, but are yet to be integrated fully into the standard risk-assessment tools.
Figure 1. Evolution of Total Bank Deposits in Select Euro Area Countries , 2008-12 (in billions of Euro)
39004000410042004300440045004600470048004900
2008
M1
2008
M4
2008
M7
2008
M10
2009
M1
2009
M4
2009
M7
2009
M10
2010
M1
2010
M4
2010
M7
2010
M10
2011
M1
2011
M4
2011
M7
2011
M10
2012
M1
2012
M4
2012
M7
2012
M10
France
4700
4800
4900
5000
5100
5200
5300
5400
5500
5600
2008
M1
2008
M4
2008
M7
2008
M10
2009
M1
2009
M4
2009
M7
2009
M10
2010
M1
2010
M4
2010
M7
2010
M10
2011
M1
2011
M4
2011
M7
2011
M10
2012
M1
2012
M4
2012
M7
2012
M10
Germany
300
320
340
360
380
400
420
440
460
480
2008
M1
2008
M4
2008
M7
2008
M10
2009
M1
2009
M4
2009
M7
2009
M10
2010
M1
2010
M4
2010
M7
2010
M10
2011
M1
2011
M4
2011
M7
2011
M10
2012
M1
2012
M4
2012
M7
2012
M10
Greece
400
500
600
700
800
900
1000
1100
1200
2008
M1
2008
M4
2008
M7
2008
M10
2009
M1
2009
M4
2009
M7
2009
M10
2010
M1
2010
M4
2010
M7
2010
M10
2011
M1
2011
M4
2011
M7
2011
M10
2012
M1
2012
M4
2012
M7
2012
M10
Ireland
2000
2100
2200
2300
2400
2500
2600
2700
2008
M1
2008
M4
2008
M7
2008
M10
2009
M1
2009
M4
2009
M7
2009
M10
2010
M1
2010
M4
2010
M7
2010
M10
2011
M1
2011
M4
2011
M7
2011
M10
2012
M1
2012
M4
2012
M7
2012
M10
Spain
300
320
340
360
380
400
420
440
2008
M1
2008
M4
2008
M7
2008
M10
2009
M1
2009
M4
2009
M7
2009
M10
2010
M1
2010
M4
2010
M7
2010
M10
2011
M1
2011
M4
2011
M7
2011
M10
2012
M1
2012
M4
2012
M7
2012
M10
Portugal
6
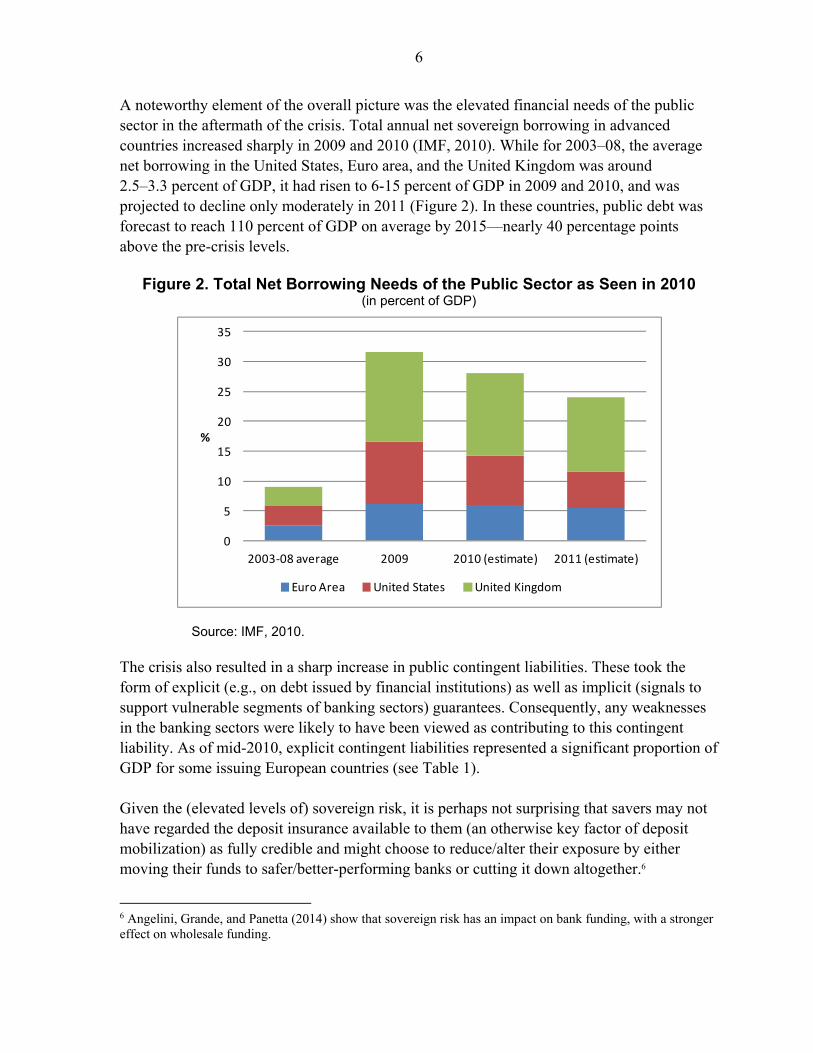
A noteworthy element of the overall picture was the elevated financial needs of the public sector in the aftermath of the crisis. Total annual net sovereign borrowing in advanced countries increased sharply in 2009 and 2010 (IMF, 2010). While for 2003–08, the average net borrowing in the United States, Euro area, and the United Kingdom was around 2.5–3.3 percent of GDP, it had risen to 6-15 percent of GDP in 2009 and 2010, and was projected to decline only moderately in 2011 (Figure 2). In these countries, public debt was forecast to reach 110 percent of GDP on average by 2015—nearly 40 percentage points above the pre-crisis levels.
Figure 2. Total Net Borrowing Needs of the Public Sector as Seen in 2010 (in percent of GDP)
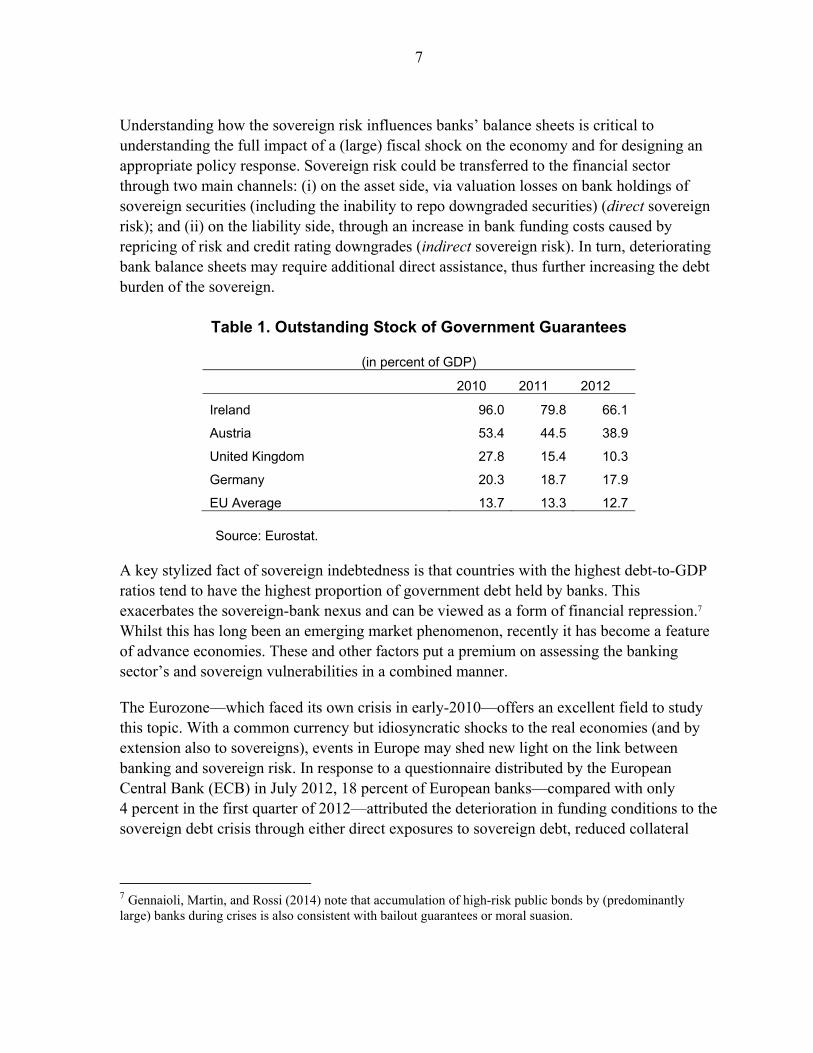
Source: IMF, 2010. The crisis also resulted in a sharp increase in public contingent liabilities. These took the form of explicit (e.g., on debt issued by financial institutions) as well as implicit (signals to support vulnerable segments of banking sectors) guarantees. Consequently, any weaknesses in the banking sectors were likely to have been viewed as contributing to this contingent liability. As of mid-2010, explicit contingent liabilities represented a significant proportion of GDP for some issuing European countries (see Table 1). Given the (elevated levels of) sovereign risk, it is perhaps not surprising that savers may not have regarded the deposit insurance available to them (an otherwise key factor of deposit mobilization) as fully credible and might choose to reduce/alter their exposure by either moving their funds to safer/better-performing banks or cutting it down altogether.6
6 Angelini, Grande, and Panetta (2014) show that sovereign risk has an impact on bank funding, with a stronger effect on wholesale funding.
0
5
10
15
20
25
30
35
2003-08 average 2009 2010 (estimate) 2011 (estimate)
%
Euro Area United States United Kingdom
7
Understanding how the sovereign risk influences banks’ balance sheets is critical to understanding the full impact of a (large) fiscal shock on the economy and for designing an appropriate policy response. Sovereign risk could be transferred to the financial sector through two main channels: (i) on the asset side, via valuation losses on bank holdings of sovereign securities (including the inability to repo downgraded securities) (direct sovereign risk); and (ii) on the liability side, through an increase in bank funding costs caused by repricing of risk and credit rating downgrades (indirect sovereign risk). In turn, deteriorating bank balance sheets may require additional direct assistance, thus further increasing the debt burden of the sovereign.
Table 1. Outstanding Stock of Government Guarantees
(in percent of GDP)
2010 2011 2012
Ireland 96.0 79.8 66.1
Austria 53.4 44.5 38.9
United Kingdom 27.8 15.4 10.3
Germany 20.3 18.7 17.9
EU Average 13.7 13.3 12.7 Source: Eurostat.
A key stylized fact of sovereign indebtedness is that countries with the highest debt-to-GDP ratios tend to have the highest proportion of government debt held by banks. This exacerbates the sovereign-bank nexus and can be viewed as a form of financial repression.7 Whilst this has long been an emerging market phenomenon, recently it has become a feature of advance economies. These and other factors put a premium on assessing the banking sector’s and sovereign vulnerabilities in a combined manner.
The Eurozone—which faced its own crisis in early-2010—offers an excellent field to study this topic. With a common currency but idiosyncratic shocks to the real economies (and by extension also to sovereigns), events in Europe may shed new light on the link between banking and sovereign risk. In response to a questionnaire distributed by the European Central Bank (ECB) in July 2012, 18 percent of European banks—compared with only 4 percent in the first quarter of 2012—attributed the deterioration in funding conditions to the sovereign debt crisis through either direct exposures to sovereign debt, reduced collateral
7 Gennaioli, Martin, and Rossi (2014) note that accumulation of high-risk public bonds by (predominantly large) banks during crises is also consistent with bailout guarantees or moral suasion.

8
value of government bonds, or other effects (ECB, 2012; Box 2).8 The paper zooms in on the link between the sovereign risk and liability side of the individual banks’ balance sheet in 29 European countries during 2006–11. The bulk of the research was conducted in the height of the crisis (in 2012 and 2013) using bank-level data that were available at that time (through end-2011). This timing also broadly coincided with a more active role played by the ECB in supporting the crisis-stricken Eurozone countries and may therefore warrant a separate treatment.
The main question asked in the paper is how sovereign risk affects the willingness of depositors to maintain deposits in a particular bank (rather than withdraw) given heightened sovereign risk conditions in their respective jurisdictions. Using a bank-level indicator that controls for endogeneity between sovereigns and banks, we expect ceteris paribus consumer deposits to be negatively affected by a bank’s perceived exposure to sovereign risk. The remainder of the paper is structured in the following way. Section II offers a brief survey of the relevant literature. Section III discusses the main features of the econometric model, data, and empirical estimates. Finally, Section IV concludes.
II. LITERATURE REVIEW
Market discipline can be seen as the ability of stakeholders of a bank—bank depositors, bond holders, and shareholders—to influence the behavior of the bank. In certain institutional frameworks, stakeholders will perform (costly) monitoring of bank activity to protect their interests and their reaction may provide useful signal to banking supervisors and the markets about riskiness of the bank.
A large number of papers found support for the link between the riskiness of banks and depositors’ actions. Confronted with higher risk, the depositors may—as the hypothesis goes—withdraw their deposits or demand higher interest rate on their holdings. Park and Peristiani (1998) used data on U.S. thrifts between 1987 and 1991 and found that riskier thrifts faced declining deposits and had to pay higher interest rates to retain them. Similar results were obtained by Goldberg and Hudgins (2002) using a larger time frame. In developing countries, Martinez Peria and Schmukler (2001) used data from Argentina, Chile, and Mexico to show that depositors punished high-risk banks by requiring higher interest rates or reducing their exposure to them.
Other studies analyzed the behavior of bondholders (especially of subordinated debt holders) in response to banks’ risk-taking. An early survey of empirical literature argues in favor of the existence of market discipline for large, traded U.S. financial institutions (Flannery, 1998). Using data from 1993–98, Morgan and Stiroh (2001) found that banks with higher risk levels face higher bond spreads. Similar results on the effectiveness of subordinated debt
8 The same effect was reported to have abated slightly in some segments in the first quarter of 2013 (ECB, 2013), as the sovereign crisis was contained.

9
providing information on the issuing banks’ financial conditions were presented by Jagtiani and Lemiex (2001) and DeYoung et al. (2001). Evanoff, Jagtiani, and Nakata (2011) survey the literature on the role of subordinated debt on market discipline and argue that a mandatory sub-debt program may significantly improve market discipline.
Market discipline can be a useful tool for bank supervision confronted with increasingly complex bank organizations and higher costs. Bernanke (2007) proposed a hybrid approach to keep banking system safe, by combining the regulatory oversight of the industry with market discipline. Kwan (2002) and Krainer and Lopez (2002) uses stock market data to measure the bank’s level of risk. They argue in favor of using stock data to study market discipline and suggest that doing so may improve the quality of bank supervision.
Studies also looked at the role of deposit insurance on market discipline. Demirgüç-Kunt and Huizinga (2004) used data for 30 developed and developing countries between 1990 and 1997 to show that deposit insurance affects make interest rates for deposits less sensitive to bank’s risk. A cross-country study by Nier and Baumann (2006) on 729 banks from 32 countries found that implicit government guarantees weakens market discipline while the significant use of uninsured funds and more informational disclosure from banks strengthened market discipline. For the current study, we do not control for deposit insurance because of: (1) relatively minor difference in deposit insurance coverage across countries in Europe and (2) relative ineffectiveness of deposit insurance in a systemic crisis.
A number of recent papers analyze the impact of holding of sovereign debt on bank performance in the context of European sovereign debt crisis. Angeloni and Wolff (2012) find that banks’ stock market performance was affected by exposure to Greek debt holdings (July to October 2011) or Italian and Irish sovereign debt (October to December 2011) while holding Spanish sovereign debt had less of an impact. Acharya et al. (2014) use the holdings of sovereign debt by banks to build a measure of banks dependence of stressed euro-area economies. They find that banks with high dependence on those economies reduce the volume of loans to the firms, therefore negatively affecting their employment growth, level of investment and sale growth. Similarly, Popov and van Horen (2013) show that European bank’s holdings of impaired foreign sovereign debt has impacted their lending.

10
III. EMPIRICAL ESTIMATION
A. Modeling and Measurement
Consistent with the market discipline literature, we employ the following reduced-form equation to assess whether sovereign risk has implications for banks’ deposits:
tjitjitjitjitji ControlsiskSovereignRePerformancDeposits ,,,,3,,2,,1,, (1)
where, tjiDeposits ,, is change in deposits in the bank i operating in country j between two
periods (t and t-1), jiePerformanc , a composite measure of bank performance (see below),
jiiskSovereignR , is a measure of bank’s exposure to sovereign risk, and jiControls , is a vector
of bank- and country-specific control variables (market share, unemployment, and inflation).
Conventional measures of sovereign risk are imperfect and do not cover elements discussed earlier. The closest proxy used in the literature is the holdings of sovereign treasury securities. However, this measure has a drawback in that it measures the net as opposed to the gross effect of sovereign holdings. The latter also offers liquidity services to banks (and its stakeholders) and should therefore, in principle, be viewed as positive. Practically, however, netting out this effect would be very difficult. Furthermore, most data services do not provide disaggregated data on by-country holdings of banks’ sovereign portfolios. Lumping together holdings of all (i.e., own and other countries’) government securities will mask the relative riskiness of the underlying sovereigns and may bias the results. However, the most important constraint in this case (i.e., when the behavior of depositors is being studied) is that most depositors are not very sophisticated and do not have access to data on banks’ holdings of sovereign securities and, by extension, also of their sovereign risk exposure. We experiment with an innovative proxy for sovereign risk. We use Factiva news service—which collects information from 32,000 news and information sources in 28 languages from nearly every country in the world—to construct a measure of (perception of) sovereign risk. The underlying assumption for doing so is that mainstream media reports about banks and their conditions are more readily available to depositors than bank-specific financial data.9 We further assume that the frequency of media references about a particular subject is correlated with how deep/serious/widespread the subject matter is. With this in mind, we used Factiva archive search engine to count the number of times that the terms “sovereign risk” or “government debt” were used in the same news article with the
9 Di Cesare et al. (2012) use Google search engine to measure the frequency of searches for the terms “euro break-up” as a proxy for the concern about a possible break-up of the euro area.
11
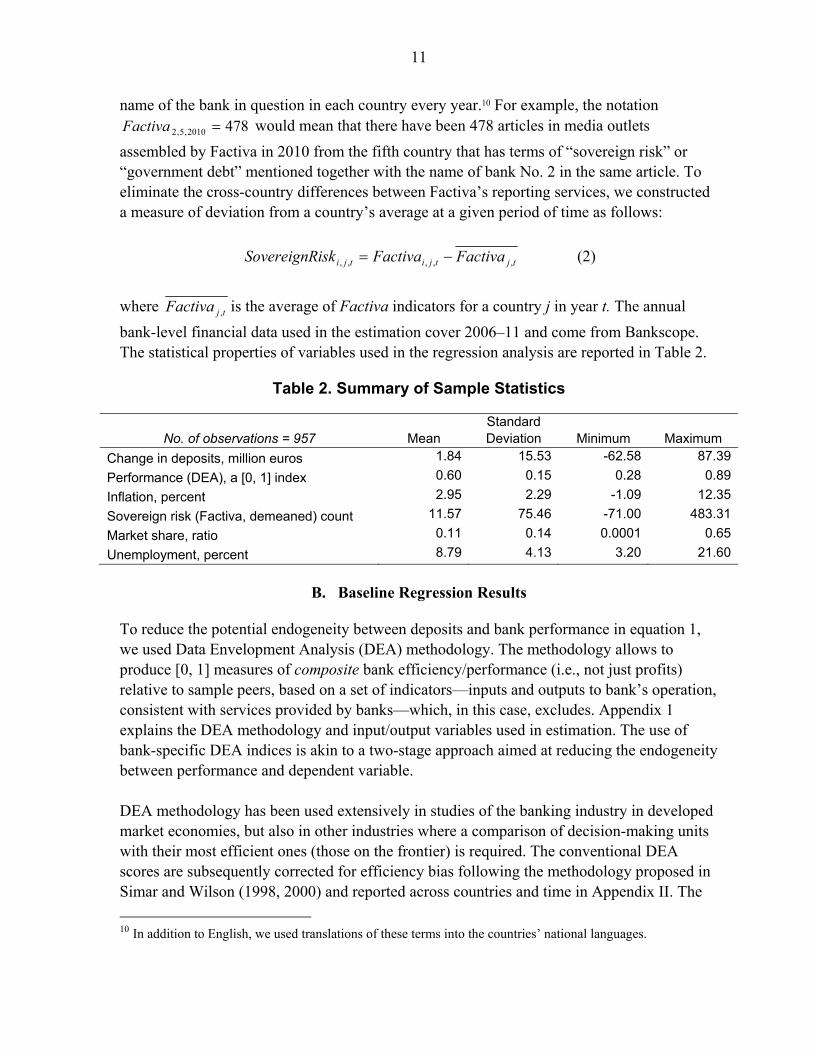
name of the bank in question in each country every year.10 For example, the notation 4782010,5,2 Factiva would mean that there have been 478 articles in media outlets
assembled by Factiva in 2010 from the fifth country that has terms of “sovereign risk” or “government debt” mentioned together with the name of bank No. 2 in the same article. To eliminate the cross-country differences between Factiva’s reporting services, we constructed a measure of deviation from a country’s average at a given period of time as follows:
tjtjitji FactivaFactivaiskSovereignR ,,,,, (2)
where tjFactiva , is the average of Factiva indicators for a country j in year t. The annual
bank-level financial data used in the estimation cover 2006–11 and come from Bankscope. The statistical properties of variables used in the regression analysis are reported in Table 2.
Table 2. Summary of Sample Statistics
No. of observations = 957 Mean Standard Deviation Minimum Maximum
Change in deposits, million euros 1.84 15.53 -62.58 87.39
Performance (DEA), a [0, 1] index 0.60 0.15 0.28 0.89
Inflation, percent 2.95 2.29 -1.09 12.35
Sovereign risk (Factiva, demeaned) count 11.57 75.46 -71.00 483.31
Market share, ratio 0.11 0.14 0.0001 0.65
Unemployment, percent 8.79 4.13 3.20 21.60
B. Baseline Regression Results
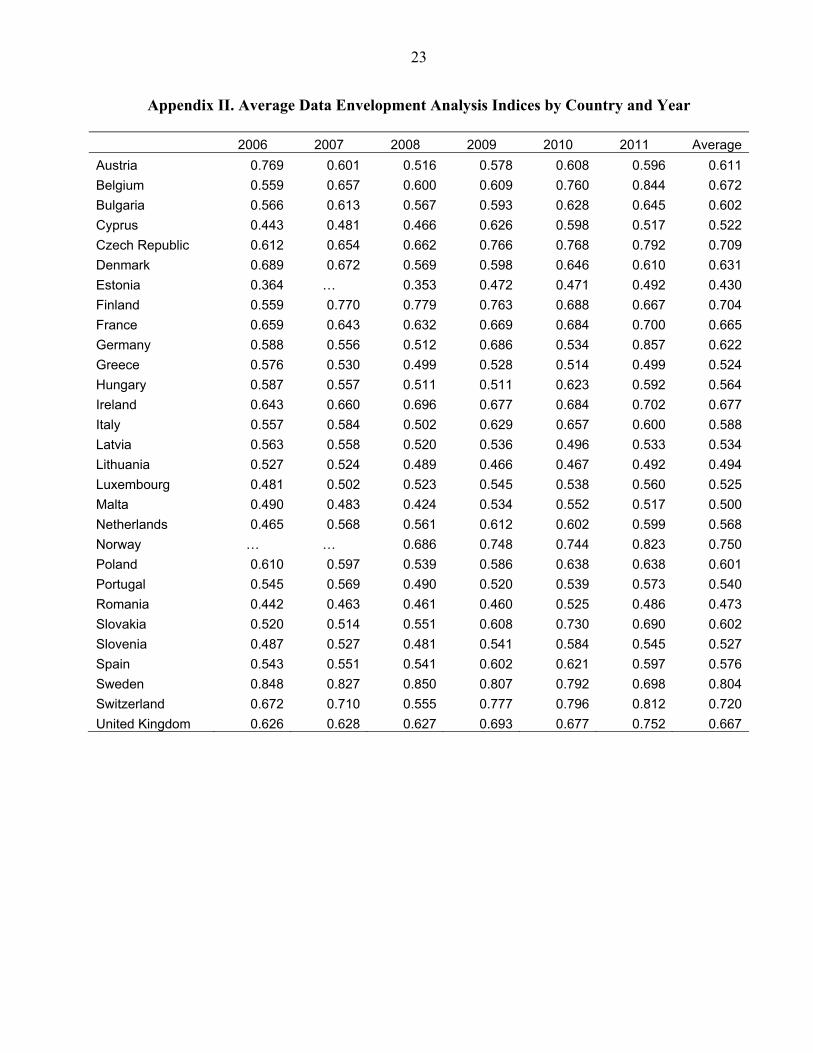
To reduce the potential endogeneity between deposits and bank performance in equation 1, we used Data Envelopment Analysis (DEA) methodology. The methodology allows to produce [0, 1] measures of composite bank efficiency/performance (i.e., not just profits) relative to sample peers, based on a set of indicators—inputs and outputs to bank’s operation, consistent with services provided by banks—which, in this case, excludes. Appendix 1 explains the DEA methodology and input/output variables used in estimation. The use of bank-specific DEA indices is akin to a two-stage approach aimed at reducing the endogeneity between performance and dependent variable. DEA methodology has been used extensively in studies of the banking industry in developed market economies, but also in other industries where a comparison of decision-making units with their most efficient ones (those on the frontier) is required. The conventional DEA scores are subsequently corrected for efficiency bias following the methodology proposed in Simar and Wilson (1998, 2000) and reported across countries and time in Appendix II. The
10 In addition to English, we used translations of these terms into the countries’ national languages.
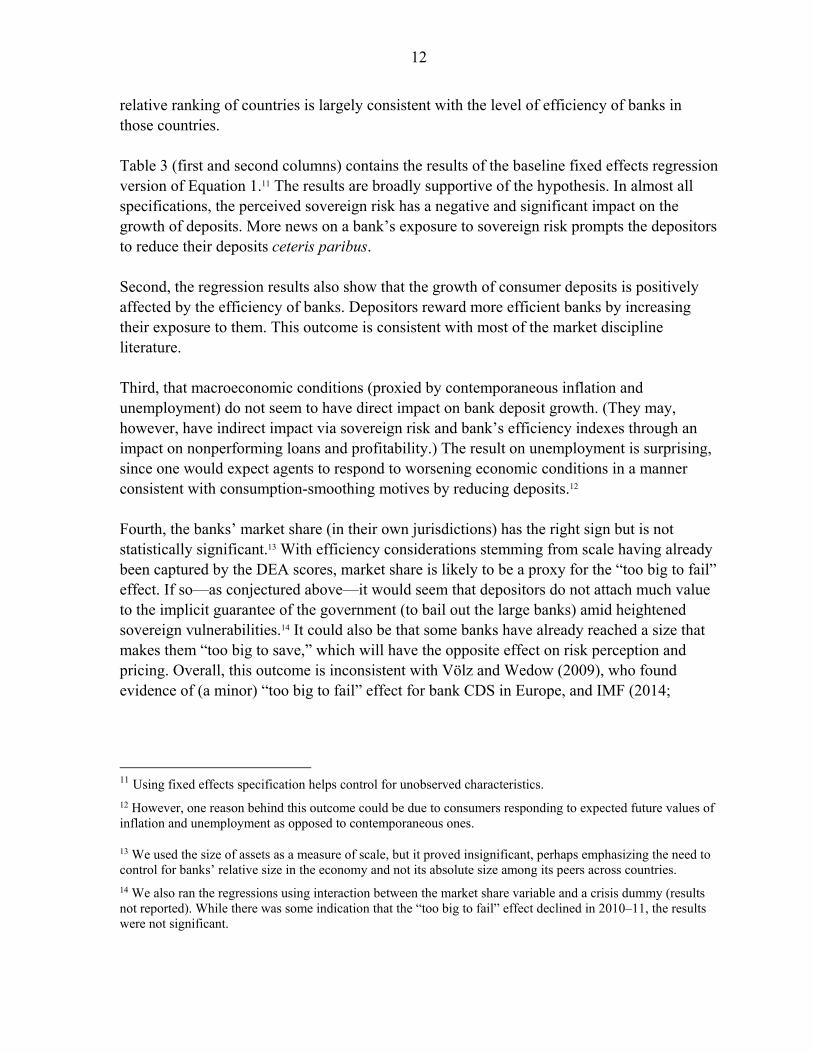
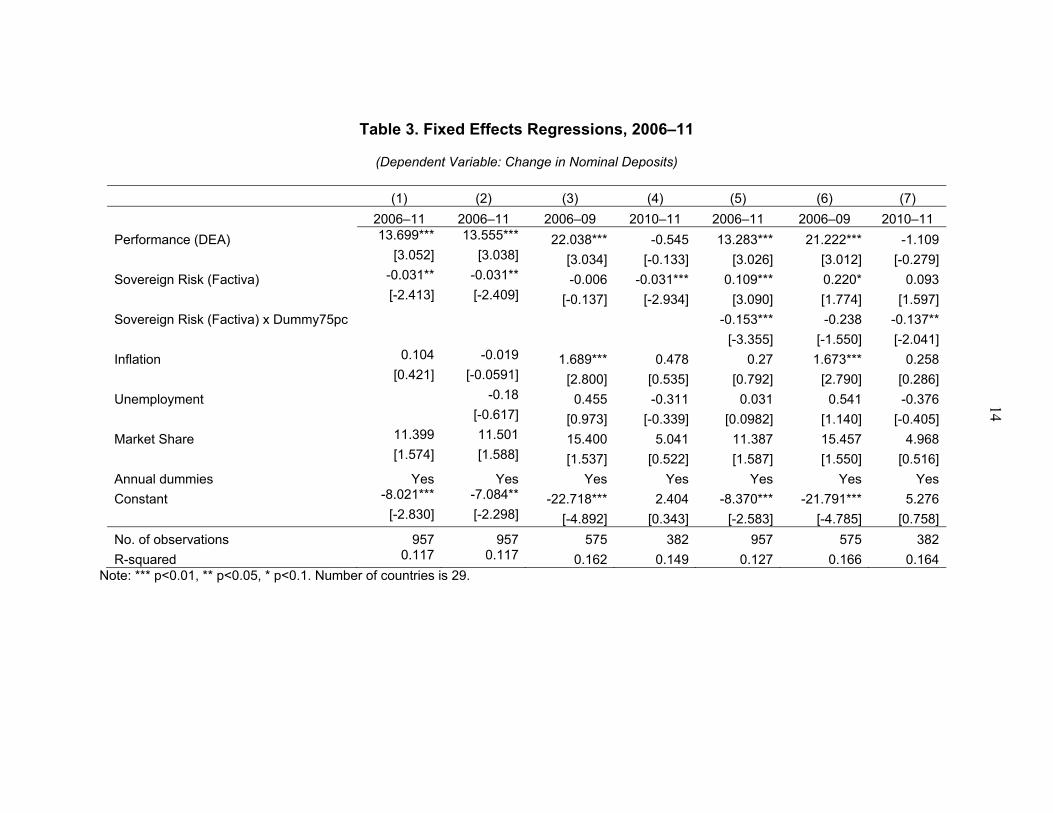
12
relative ranking of countries is largely consistent with the level of efficiency of banks in those countries. Table 3 (first and second columns) contains the results of the baseline fixed effects regression version of Equation 1.11 The results are broadly supportive of the hypothesis. In almost all specifications, the perceived sovereign risk has a negative and significant impact on the growth of deposits. More news on a bank’s exposure to sovereign risk prompts the depositors to reduce their deposits ceteris paribus. Second, the regression results also show that the growth of consumer deposits is positively affected by the efficiency of banks. Depositors reward more efficient banks by increasing their exposure to them. This outcome is consistent with most of the market discipline literature. Third, that macroeconomic conditions (proxied by contemporaneous inflation and unemployment) do not seem to have direct impact on bank deposit growth. (They may, however, have indirect impact via sovereign risk and bank’s efficiency indexes through an impact on nonperforming loans and profitability.) The result on unemployment is surprising, since one would expect agents to respond to worsening economic conditions in a manner consistent with consumption-smoothing motives by reducing deposits.12 Fourth, the banks’ market share (in their own jurisdictions) has the right sign but is not statistically significant.13 With efficiency considerations stemming from scale having already been captured by the DEA scores, market share is likely to be a proxy for the “too big to fail” effect. If so—as conjectured above—it would seem that depositors do not attach much value to the implicit guarantee of the government (to bail out the large banks) amid heightened sovereign vulnerabilities.14 It could also be that some banks have already reached a size that makes them “too big to save,” which will have the opposite effect on risk perception and pricing. Overall, this outcome is inconsistent with Völz and Wedow (2009), who found evidence of (a minor) “too big to fail” effect for bank CDS in Europe, and IMF (2014;
11 Using fixed effects specification helps control for unobserved characteristics. 12 However, one reason behind this outcome could be due to consumers responding to expected future values of inflation and unemployment as opposed to contemporaneous ones.
13 We used the size of assets as a measure of scale, but it proved insignificant, perhaps emphasizing the need to control for banks’ relative size in the economy and not its absolute size among its peers across countries.
14 We also ran the regressions using interaction between the market share variable and a crisis dummy (results not reported). While there was some indication that the “too big to fail” effect declined in 2010–11, the results were not significant.

13
Figure 3.8), which reports a (slight) decline in implicit “too big to fail” subsidies to Euro area banks during 2006–11.15
To gauge the role of various indicators in the bank’s ability to collect deposits before the crisis compared to during the crisis period, we estimated the regressions for two time periods: 2006–09 and 2010–11 (Table 3, columns 3 and 4). The results reveal some interesting difference across the two periods. Specifically, the results show that before the crisis: (1) performance was positive and significantly related to deposit growth; (2) while sovereign risk was not seen as an important factor, the rate of inflation also was positively and significantly related to deposit growth. In contrast, in the two years during the crisis: (1) the impact of bank performance on deposits vanishes; (2) perception of sovereign exposure/risk becomes an important (negative) predictor of deposit behavior;16 and (3) inflation no longer matters. Finally, we account for potential non-linearity in the impact of sovereign risk on depositor behavior by controlling for degree of exposure to sovereign-related news. To this end, we constructed the variable Dummy75pc, which takes value of 1 if Sovereign Risk is in the upper quartile of its distribution for a given country and year and 0 otherwise. The regressions, where Dummy75pc is interacted with Sovereign Risk, are presented in column 5 of Table 3. The results suggest that banks that are seen as strongly exposed to sovereign-related developments may be at a higher risk of losing deposits. Running the regressions before and during crisis (columns 6 and 7, respectively) reveals interesting differences. Before crisis, irrespective of the amount of sovereign-related news (i.e., whether in the first three quantiles or the fourth quantile), the latter is associated with deposit accumulation. This could be due to the fact that in tranquil times any news of a bank’s association with sovereign might be interpreted as a positive rather than a negative sign. This effect practically disappears during the crisis for those in the first three quantiles (coefficient is statistically zero) and becomes negative for the banks in the fourth quantile of sovereign news distribution (coefficient equals -0.137 and is statistically significant).
15 Similarly, in the context of the United States, Ötker et al. (2011) showed that the cost advantange of large banks becomes visible only after the crisis.
16 CGFS (2011) finds a similar pattern for the impact of sovereign risk on bank’s bond spread in the time of crisis and before the crisis.
14
Table 3. Fixed Effects Regressions, 2006–11
(Dependent Variable: Change in Nominal Deposits)
(1) (2) (3) (4) (5) (6) (7)
2006–11 2006–11 2006–09 2010–11 2006–11 2006–09 2010–11
Performance (DEA) 13.699*** 13.555*** 22.038*** -0.545 13.283*** 21.222*** -1.109
[3.052] [3.038] [3.034] [-0.133] [3.026] [3.012] [-0.279]
Sovereign Risk (Factiva) -0.031** -0.031** -0.006 -0.031*** 0.109*** 0.220* 0.093
[-2.413] [-2.409] [-0.137] [-2.934] [3.090] [1.774] [1.597]
Sovereign Risk (Factiva) x Dummy75pc -0.153*** -0.238 -0.137**
[-3.355] [-1.550] [-2.041]
Inflation 0.104 -0.019 1.689*** 0.478 0.27 1.673*** 0.258
[0.421] [-0.0591] [2.800] [0.535] [0.792] [2.790] [0.286]
Unemployment -0.18 0.455 -0.311 0.031 0.541 -0.376
[-0.617] [0.973] [-0.339] [0.0982] [1.140] [-0.405]
Market Share 11.399 11.501 15.400 5.041 11.387 15.457 4.968
[1.574] [1.588] [1.537] [0.522] [1.587] [1.550] [0.516]
Annual dummies Yes Yes Yes Yes Yes Yes Yes
Constant -8.021*** -7.084** -22.718*** 2.404 -8.370*** -21.791*** 5.276
[-2.830] [-2.298] [-4.892] [0.343] [-2.583] [-4.785] [0.758]
No. of observations 957 957 575 382 957 575 382
R-squared 0.117 0.117 0.162 0.149 0.127 0.166 0.164 Note: *** p<0.01, ** p<0.05, * p<0.1. Number of countries is 29.

15
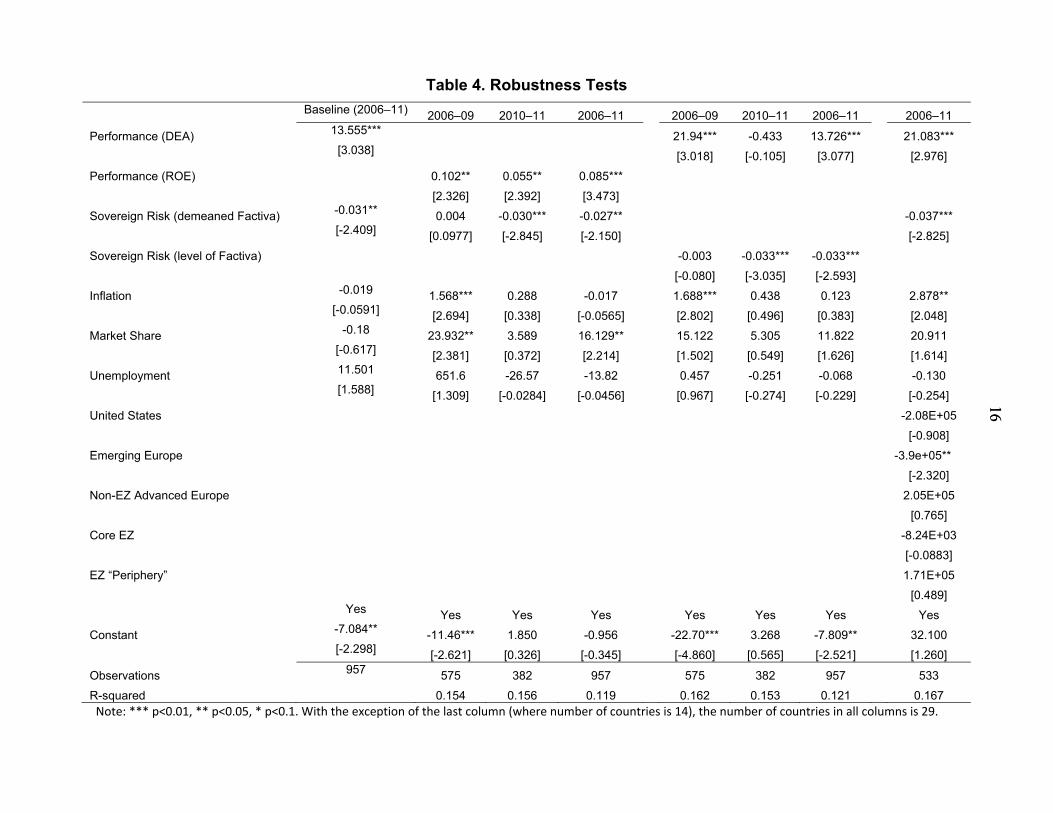
C. Robustness Tests To test for the robustness of the baseline results, we estimated many alternative specifications. First of all, we replaced DEA indicator with a more conventional measure of bank performance, Return on Equity (ROE). The results (reported in columns 2–4 of Table 4) are largely consistent with the baseline specification.17 In contract with the baseline regressions, however, the regression with ROE suggests the presence of a “too large to fail” effect: the coefficient on market share on change in deposits is positive and statistically significant.
Second, we reintroduced the country component in the Factiva variable (instead of taking it out per Equation 2). Doing so does not materially change the results (reported in columns 5–7 of Table 4).
Finally, we used data from Bank for International Settlements to control for exposure of the countries’ banking sector to various country groupings, such as, the United States, core Eurozone, peripheral Eurozone, emerging Europe, and non-Eurozone Advanced Europe (see Appendix III for the country classifications). The results (reported in final column of Table 4) do not change much.18 Interestingly, depositors distinguish between their banking sector’s exposures to the country groupings.19 While the coefficients on variables measuring exposure to sovereigns in the EZ “Periphery,” Emerging Europe, and the United States are all negative, only the coefficient on Emerging Europe is significant, perhaps suggesting an ordering of sorts between the country groupings where the Emerging Europe would be seen as the riskiest and Core Eurozone as well as Non-Eurozone Advanced Europe groupings are seen by the depositors as the least risky.
17 Results with Return on Assets (instead of DEA) are nearly identical and available from the authors upon request.
18 Adding country-specific interest rates (regressions not reported) did not change much, potentially because that information is likely to be contained in our measure of sovereign risk.
19 The additional variables (i.e., country groupings) in the last column are the nominal values of the home country banking sector’s exposure to the sovereigns in those country groupings.
16
16
Table 4. Robustness Tests
Baseline (2006–11) 2006–09 2010–11 2006–11 2006–09 2010–11 2006–11 2006–11
Performance (DEA) 13.555*** 21.94*** -0.433 13.726*** 21.083***
[3.038] [3.018] [-0.105] [3.077] [2.976]
Performance (ROE) 0.102** 0.055** 0.085***
[2.326] [2.392] [3.473]
Sovereign Risk (demeaned Factiva) -0.031** 0.004 -0.030*** -0.027** -0.037***
[-2.409] [0.0977] [-2.845] [-2.150] [-2.825]
Sovereign Risk (level of Factiva) -0.003 -0.033*** -0.033***
[-0.080] [-3.035] [-2.593]
Inflation -0.019 1.568*** 0.288 -0.017 1.688*** 0.438 0.123 2.878**
[-0.0591] [2.694] [0.338] [-0.0565] [2.802] [0.496] [0.383] [2.048]
Market Share -0.18 23.932** 3.589 16.129** 15.122 5.305 11.822 20.911
[-0.617] [2.381] [0.372] [2.214] [1.502] [0.549] [1.626] [1.614]
Unemployment 11.501 651.6 -26.57 -13.82 0.457 -0.251 -0.068 -0.130
[1.588] [1.309] [-0.0284] [-0.0456] [0.967] [-0.274] [-0.229] [-0.254]
United States -2.08E+05
[-0.908]
Emerging Europe -3.9e+05**
[-2.320]
Non-EZ Advanced Europe 2.05E+05
[0.765]
Core EZ -8.24E+03
[-0.0883]
EZ “Periphery” 1.71E+05
[0.489]
Yes Yes Yes Yes Yes Yes Yes Yes
Constant -7.084** -11.46*** 1.850 -0.956 -22.70*** 3.268 -7.809** 32.100
[-2.298] [-2.621] [0.326] [-0.345] [-4.860] [0.565] [-2.521] [1.260]
Observations 957 575 382 957 575 382 957 533
R-squared 0.154 0.156 0.119 0.162 0.153 0.121 0.167 Note: *** p<0.01, ** p<0.05, * p<0.1. With the exception of the last column (where number of countries is 14), the number of countries in all columns is 29.

17
IV. CONCLUSION The main question posed in the paper was whether depositors punish the banks for carrying too much sovereign risk. Our estimates based on data from 29 European countries from 2006–11 showed that the exposure of the banking sector to sovereign risk negatively affected the growth of consumer deposits over and above the impact of macroeconomic conditions. We conclude that (excessive) exposure to sovereign risk may have contributed to deposit outflows in Europe in the aftermath of the crisis. However, this relationship is nonlinear. While all banks seem to benefit from holdings of the sovereign bonds during tranquil times, banks that are in the news during crisis more often are punished by the depositors during the crisis. We also find that depositors pay closer attention to banks’ financial performance during tranquil times. During crisis times, the perceived risks become more important than financial performance in determining depositors’ choices. Finally, with the exception of one specification, we found no evidence of “too big to fail” effects from the depositors’ perspective. These findings suggest caution in evaluating the outlook for banks in Europe, which are projected to remain highly indebted for years to come. While policy measures to weaken the link between sovereign risk and deposit contraction include fiscal tightening, liability management exercises (aimed at reducing short-run gross borrowing needs), and loss-sharing mechanisms, knowing the nature and strength of this link can nevertheless be helpful inter alia for better understanding the pressures faced by banks. New regulations, which could encourage banks to hold more government debt (e.g., for liquidity purposes), should be introduced with care and their (undesirable) impact should, if possible, be mitigated. On the positive side, our results suggest that measures to improve bank efficiency may help boost depositor confidence and help stabilize deposits. In general, building sufficient buffers—both for banks (in the form of more capital and liquidity) and sovereigns (in the form of lower levels of debt and quasifiscal activity)—would be key to building resilience to fiscal and financial shocks and weakening the sovereign-bank nexus. Finally, to the extent that the observed negative link between sovereign risk and ability to collect deposits limits the banks’ ability to lend (as shown by Popov and van Horen (2013) and Acharya et al. (2014), among others), it strengthens the procyclical role played by the banks in the transmission of fiscal shocks in Europe. If so, this may call for a more explicit inclusion of banks in the traditional macro models to account for a full pass-through of the shocks to the real economy and to improve the accuracy of macroeconomic projections.
18
References Acharya, V. V., T. Eisert, C. Eufinger, and C. Hirsch (2014). “Real Effects of the Sovereign Debt Crisis in Europe: Evidence from Syndicated Loans.” mimeo, March. Available via: http://www.csef.it/IMG/pdf/eisert.pdf
Angelini, P., G. Grande, and F. Panetta (2014). The negative feedback loop between banks and sovereigns. Bank of Italy Occasional Paper No. 213.
Angeloni, C., and G. Wolff, (2012). “Are Banks Affected by their Holdings of Government Debt?” Bruegel Working Paper, 07.
Banker, R.D., A. Charnes and W.W. Cooper (1984). “Some Models for Estimating Technical and Scale Inefficiencies in Data Envelopment Analysis”. Management Science 30, pp. 1078–1092.
Berger A.N. and D.B. Humphrey (1997). “Efficiency of Financial Institutions: International Survey and Directions for Future Research”. European Journal of Operational Research 98, No 2, pp. 175–212.
Bernanke, B. S. (2007). “FRB: Speech, Bernanke—Financial Regulation and the Invisible Hand—April 11, 2007.” Federal Rerserve Board.
Committee on the Global Financial System (2011), “The Impact of Sovereign Credit Risk on Bank Funding Conditions,” CGFS paper No. 43.
Cooper, W.W., L.M. Seiford and K. Tone (2000). “Data Envelopment Analysis”, Kluwer Academic Publishers, Norwell, MA.
Demirgüç-Kunt, A., and H. Huizinga (2004). “Market Discipline and Deposit Insurance.” Journal of Monetary Economics 51, no. 2, pp. 375–399.
Di Cesare, A., G. Grande, M. Manna, and M. Taboga (2012). "Recent Estimates of Sovereign Risk Premia for Euro-area Countries,” Bank of Italy Occasional Paper No. 128.
DeYoung, R., M. Flannery, W. Lang, and S. Sorescu (2001). “The Information Content of Bank Exam Ratings and Subordinated Debt.” Journal of Money, Credit, and Banking 33, pp. 900–925.
European Central Bank (2013). Monthly Bulletin, May. Available via: http://www.ecb.int/pub/pdf/mobu/mb201305en.pdf.
———, (2012). Monthly Bulletin, August. Available via: http://www.ecb.europa.eu/pub/pdf/mobu/mb201208en.pdf
Evanoff, D. D., J. A. Jagtiani, and T. Nakata (2011). “Enhancing Market Discipline in Banking: The Role of Subordinated Debt in Financial Regulatory Reform.” Journal of Economics and Business 63, pp. 1–22.
19
Flannery, M. J. (2001). "The Faces of "Market Discipline"," Journal of Financial Services Research 20, pp.107–119.
Flannery, M. J. (1998). “Using Market Information in Prudential Bank Supervision: A Review of the U.S. Empirical Evidence.”Journal of Money, Credit and Banking 30, no. 3, August, pp. 273–305.
Gennaioli, N., A. Martin, and S. Rossi (2014). “Banks, Government Bonds, and Default: What do the Data Say?” IMF Working Paper No. 14/120, Washington, DC.
Grigorian, D. and V. Manole (2006). “Determinants of Commercial Bank Performance in Transition: An Application of Data Envelopment Analysis,” Comparative Economic Studies 48, September, pp. 497–522.
———, and V. Manole (2005). “A Cross-Country Non-Parametric Analysis of Bahrain's Banking Sector,” IMF Working Paper No. 05/117, Washington, DC.
Goldberg, G., and S. C. Hudgins (2002). “Depositor Discipline and Changing Strategies for Regulating Thrift.” Journal of Financial Economics 63, pp. 263–274.
International Monetary Fund (2014). “Global Financial Stability Report,” April; Washington, DC.
———, (2013). “Global Financial Stability Report,” April; Washington, DC.
———, (2010). “Global Financial Stability Report,” April; Washington, DC.
Jagtiani, J., and C. Lemieux (2001). “Market discipline prior to bank failure.” Journal of Economics and Business 53, pp. 313–324.
Krainer, J., and J. A. Lopez (2002). “Incorporating Equity Market Information into Supervisory Monitoring Models,” Working Paper, San Francisco: FRBSF.
Kwan, S. H. (2002). “The Promise and Limits of Market Discipline in Banking.” FRBSF Economic Letter, December, pp. 1–3.
Martinez Peria, M. S., and S. L. Schmukler (2001). “Do Depositors Punish Banks for Bad Behavior? Market Discipline, Deposit Insurance, and Banking Crises.” Journal of Finance 56, no. 3, pp. 1029–1051.
Morgan, D. P., and K. J. Stiroh (2001). “Market Discipline of Banks: The Asset Test.” Journal of Financial Services 20, no. 2/3, pp. 195–208.
Nier, E. and U. Baumann (2006). “Market discipline, disclosure and moral hazard in banking.” Journal of Financial Intermediation 15, pp. 332–361.

20
Ötker, İnci, Aditya Narain, Anna Ilyina, and Jay Surti (2011). "The Too-Important-to-Fail Conundrum: Impossible to Ignore and Difficult to Resolve," IMF Staff Discussion Note 11/12.
Park, S., and P. Peristiani (1998). “Market discipline by thrift depositors.” Journal of Money, Credit and Banking 30, no. 3, pp. 347–364.
Popov, A. and N. van Horen (2013). “The Impact of Sovereign Debt Exposure on bank Lending: Evidence from the European Debt Crisis,” DBN Working Paper No. 382. Seiford, L.M. (1996). “Data Envelopment Analysis: The Evolution of the State of the Art,” Journal of Productivity Analysis 7, pp. 99–137.
Simar, L., and P.W. Wilson (2000). "Statistical Inference in Nonparametric Frontier Models: The State of the Art," Journal of Productivity Analysis 13 (1), pp. 49–78. Simar, L., and P.W. Wilson (1998). “Sensitivity Analysis of Efficiency Scores: How to Bootstrap in Nonparametric Frontier Models,” Management Science 44 (1), pp. 49–61. Völz, M. and M. Wedow (2009). “Does Banks’ Size Distort Market Prices? Evidence for Too-big-to-fail in the CDS Market,” Deutsche Bundesbank Discussion Paper 06/09.

21
Appendix I. Description of DEA Methodology and Choice of Inputs/Outputs
Data Envelopment Analysis (DEA) is used extensively in the literature to evaluate productivity and performance of banks. It is a non-parametric method that allows one to account for a wide range of functions performed by the banks. The method compares relative performance of banks by building a frontier comprised of the most efficient banks and focusing on how close other banks are to this frontier. Thus this method provides a measure of relative efficiency. The approach was first implemented by Charnes, Cooper, and Rhodes (1978), who used a linear-programming method to identify the efficient decision-making units and coined the method DEA.20 DEA has since been used extensively in studies of the banking industry in developed and developing market economies.21
To arrive at basic specification of a linear-programming model underlying the DEA, K inputs and M outputs are assumed for every bank. For the ith bank the inputs and outputs are represented by vectors ix and iy respectively. For each bank the method aims to obtain a
measure of the ratio of all outputs over all inputs, such as iiii xvyu '' / , where iu and iv are
vectors of weights. To select the optimal weights, the following linear programming problem is typically proposed:
Mm
Kk
Nji
vu
xv
yuts
xv
yu
imik
ji
ji
ii
ii
vu imik
,...2,1
,...2,1
,...2,1,
0,
1'
'..
'
'max
,
(A-1)
Using the duality property of this linear programming problem, Charnes, Cooper, and Rhodes (1978) derive an equivalent envelopment form as:
0
0
0..
min,
in
iii
ii
i
Xx
Yyts
(A-2)
20 Their method is based on the assumption that the production units have constant returns to scale. Banker, Charnes, and Cooper (1984) later relaxed the assumption and proposed a model with variable returns to scale. Theoretical extensions of these methods and empirical applications are discussed in Seiford (1996) and Cooper, Seiford, and Tone (2000).
21 See Berger and Humphrey (1997) for a detailed survey.

22
where is an )1( N vector of weights assigned to each observation; and [0, 1] a scalar,
is the efficiency score for the ith DMU.22 Essentially, i is an indicator of how close a bank is to the efficiency frontier, with i < 1 implying that the bank is inside the frontier (i.e., it is an inefficient bank), while i = 1 implying that the bank is on the frontier (i.e., it is an efficient bank). Due to a fewer number of constraints, the formulation presented in Equation 2 is typically used for computations.23 Following Grigorian and Manole (2006), we specify the following three inputs to the banking “production process”: labor, fixed assets, and interest expenditures. Doing so accounts for all three essential inputs to commercial bank operations: (1) personnel and management; (2) computer hardware and premises (which also captures the extensiveness of a bank’s branch network); and (3) leveraged funds, respectively. Next, we define the outputs as follows: (1) revenues (defined as the sum of interest and non-interest income); (2) net loans (defined as loans net of loss provisions); and (3) liquid assets (defined as sum of cash, balances with monetary authorities, and holdings of treasury bills). Holding output (however specified) and two other inputs constant, the lesser amount of the third input used in the “production” would imply higher efficiency. The results of DEA simulations for banks in 29 European countries using the above input-output combinations in application to 2006-11 annual data are reported in Appendix II below.
22 ],...,[ 1 NxxX is a )( NK input matrix with columns ix and ],...,[ 1 NyyY is an )( NM
output matrix with columns iy .
23 The efficiency indexes calculated in such a way are termed overall technical efficiency indexes and can subsequently be decomposed into pure technical and scale efficiency indexes, to help identify the source of inefficiency of each sample DMU.
23
Appendix II. Average Data Envelopment Analysis Indices by Country and Year
2006 2007 2008 2009 2010 2011 Average
Austria 0.769 0.601 0.516 0.578 0.608 0.596 0.611
Belgium 0.559 0.657 0.600 0.609 0.760 0.844 0.672
Bulgaria 0.566 0.613 0.567 0.593 0.628 0.645 0.602
Cyprus 0.443 0.481 0.466 0.626 0.598 0.517 0.522
Czech Republic 0.612 0.654 0.662 0.766 0.768 0.792 0.709
Denmark 0.689 0.672 0.569 0.598 0.646 0.610 0.631
Estonia 0.364 … 0.353 0.472 0.471 0.492 0.430
Finland 0.559 0.770 0.779 0.763 0.688 0.667 0.704
France 0.659 0.643 0.632 0.669 0.684 0.700 0.665
Germany 0.588 0.556 0.512 0.686 0.534 0.857 0.622
Greece 0.576 0.530 0.499 0.528 0.514 0.499 0.524
Hungary 0.587 0.557 0.511 0.511 0.623 0.592 0.564
Ireland 0.643 0.660 0.696 0.677 0.684 0.702 0.677
Italy 0.557 0.584 0.502 0.629 0.657 0.600 0.588
Latvia 0.563 0.558 0.520 0.536 0.496 0.533 0.534
Lithuania 0.527 0.524 0.489 0.466 0.467 0.492 0.494
Luxembourg 0.481 0.502 0.523 0.545 0.538 0.560 0.525
Malta 0.490 0.483 0.424 0.534 0.552 0.517 0.500
Netherlands 0.465 0.568 0.561 0.612 0.602 0.599 0.568
Norway … … 0.686 0.748 0.744 0.823 0.750
Poland 0.610 0.597 0.539 0.586 0.638 0.638 0.601
Portugal 0.545 0.569 0.490 0.520 0.539 0.573 0.540
Romania 0.442 0.463 0.461 0.460 0.525 0.486 0.473
Slovakia 0.520 0.514 0.551 0.608 0.730 0.690 0.602
Slovenia 0.487 0.527 0.481 0.541 0.584 0.545 0.527
Spain 0.543 0.551 0.541 0.602 0.621 0.597 0.576
Sweden 0.848 0.827 0.850 0.807 0.792 0.698 0.804
Switzerland 0.672 0.710 0.555 0.777 0.796 0.812 0.720
United Kingdom 0.626 0.628 0.627 0.693 0.677 0.752 0.667

24
Appendix III. Country Classifications
EU 27 EZ 17 EZ “Periphery” Core EZ Emerging Europe
Non-EZ Advanced Europe
Austria Austria Austria
Belgium Belgium Belgium
Bulgaria Bulgaria
Cyprus Cyprus Cyprus
Czech Republic Czech Republic
Denmark Denmark
Estonia Estonia Estonia
Finland Finland Finland
France France France
Germany Germany Germany
Greece Greece Greece
Hungary Hungary
Ireland Ireland Ireland
Italy Italy Italy
Latvia Latvia
Lithuania Lithuania
Luxembourg Luxembourg Luxembourg
Malta Malta Malta
Netherlands Netherlands Netherlands
Poland Poland
Portugal Portugal Portugal
Romania Romania
Slovakia Slovakia Slovakia
Slovenia Slovenia Slovenia
Spain Spain Spain
Sweden Sweden
United Kingdom United Kingdom
Norway
Switzerland