sox2 cooperates with inflammation-mediated stat3 activation … · 2013-11-10 · sox2 cooperates...
TRANSCRIPT
Cell Stem Cell, Volume 12
Supplemental Information
Sox2 Cooperates with Inflammation-Mediated Stat3
Activation in the Malignant Transformation
of Foregut Basal Progenitor Cells
Kuancan Liu, Ming Jiang, Yun Lu, Hao Chen, Jun Sun, Shaoping Wu, Wei-Yao Ku, Hiroshi
Nakagawa, Yoshiaki Kita, Shoji Natsugoe, Jeffrey H. Peters, Anil Rustgi, Mark W. Onaitis, Amy
Kiernan, Xiaoxin Chen, and Jianwen Que
Supplemental Inventory
Figure S1 is related to Figures 1 and 2.
Figure S2 is related to Figure 4.
Figure S3 is related to Figure 5.
Figure S4 is related to Figure 6.
Figure S5 is related to Figure 7.
Table S1 is related to Figure 3.
Tables S2, S3, and S4 are related to Figure 4.
Tables S5 and S6 are related to Figure 7.
Supplemental Experimental Procedures
Supplemental Figures
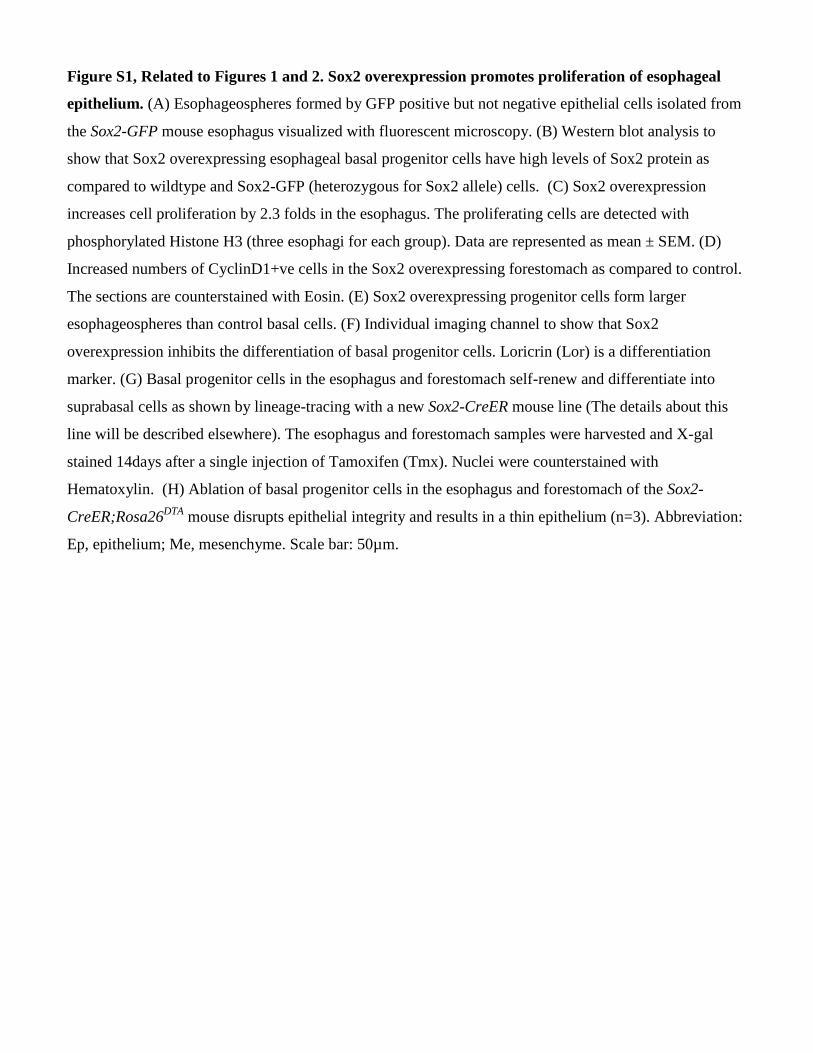
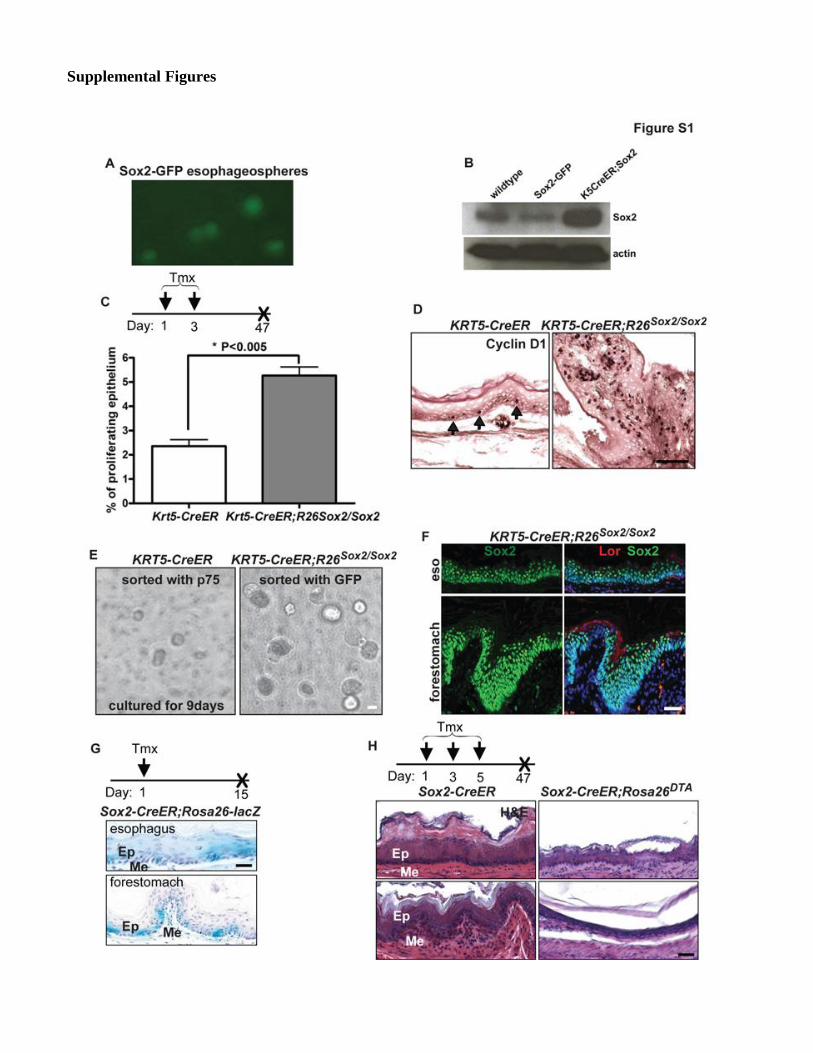
Figure S1, Related to Figures 1 and 2. Sox2 overexpression promotes proliferation of esophageal
epithelium. (A) Esophageospheres formed by GFP positive but not negative epithelial cells isolated from
the Sox2-GFP mouse esophagus visualized with fluorescent microscopy. (B) Western blot analysis to
show that Sox2 overexpressing esophageal basal progenitor cells have high levels of Sox2 protein as
compared to wildtype and Sox2-GFP (heterozygous for Sox2 allele) cells. (C) Sox2 overexpression
increases cell proliferation by 2.3 folds in the esophagus. The proliferating cells are detected with
phosphorylated Histone H3 (three esophagi for each group). Data are represented as mean ± SEM. (D)
Increased numbers of CyclinD1+ve cells in the Sox2 overexpressing forestomach as compared to control.
The sections are counterstained with Eosin. (E) Sox2 overexpressing progenitor cells form larger
esophageospheres than control basal cells. (F) Individual imaging channel to show that Sox2
overexpression inhibits the differentiation of basal progenitor cells. Loricrin (Lor) is a differentiation
marker. (G) Basal progenitor cells in the esophagus and forestomach self-renew and differentiate into
suprabasal cells as shown by lineage-tracing with a new Sox2-CreER mouse line (The details about this
line will be described elsewhere). The esophagus and forestomach samples were harvested and X-gal
stained 14days after a single injection of Tamoxifen (Tmx). Nuclei were counterstained with
Hematoxylin. (H) Ablation of basal progenitor cells in the esophagus and forestomach of the Sox2-
CreER;Rosa26DTA
mouse disrupts epithelial integrity and results in a thin epithelium (n=3). Abbreviation:
Ep, epithelium; Me, mesenchyme. Scale bar: 50µm.
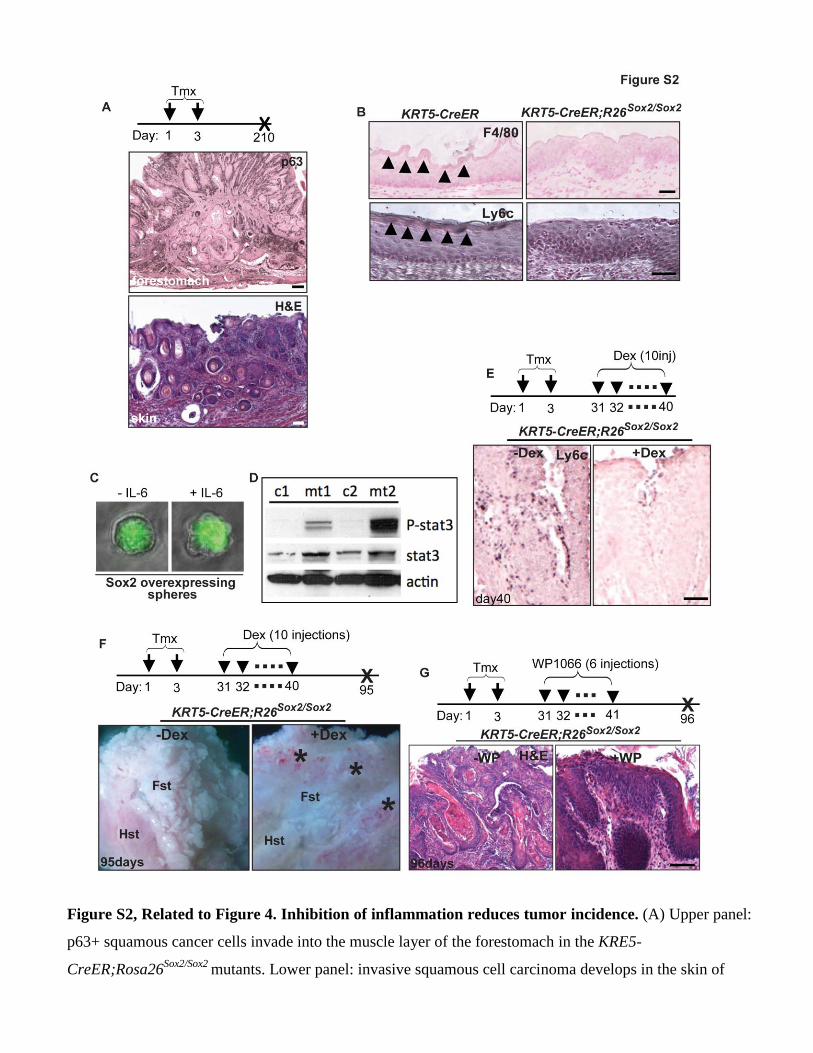
Figure S2, Related to Figure 4. Inhibition of inflammation reduces tumor incidence. (A) Upper panel:
p63+ squamous cancer cells invade into the muscle layer of the forestomach in the KRE5-
CreER;Rosa26Sox2/Sox2
mutants. Lower panel: invasive squamous cell carcinoma develops in the skin of
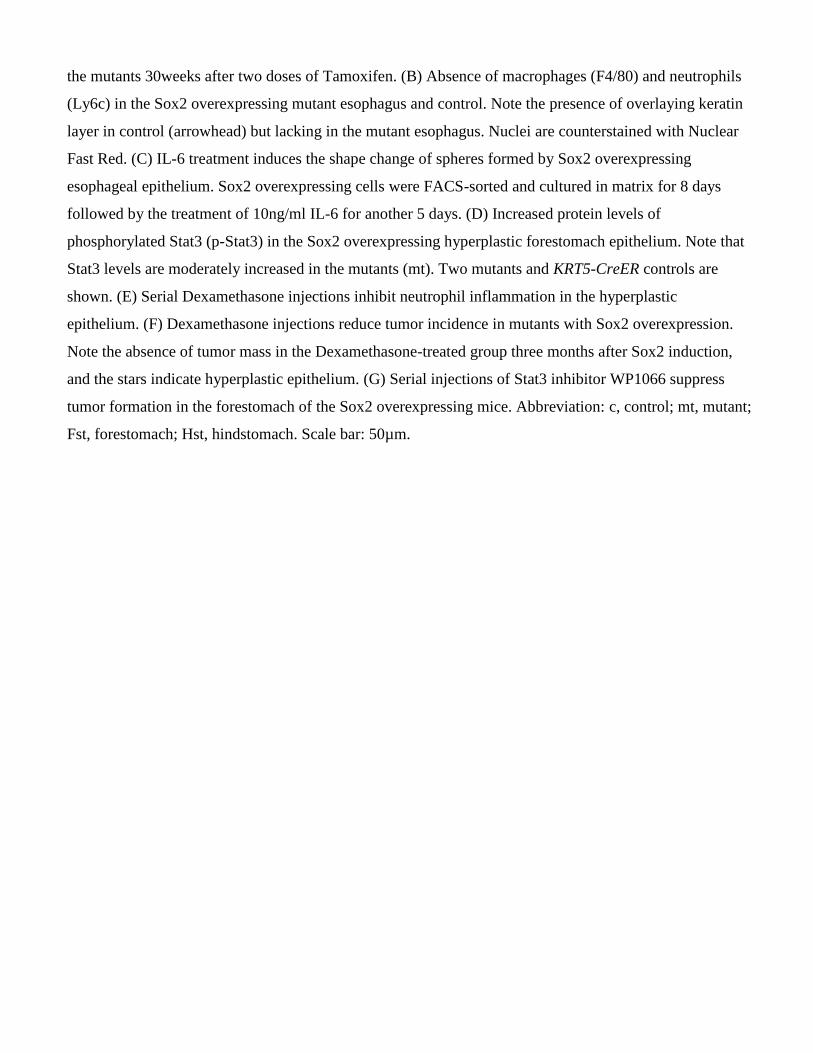
the mutants 30weeks after two doses of Tamoxifen. (B) Absence of macrophages (F4/80) and neutrophils
(Ly6c) in the Sox2 overexpressing mutant esophagus and control. Note the presence of overlaying keratin
layer in control (arrowhead) but lacking in the mutant esophagus. Nuclei are counterstained with Nuclear
Fast Red. (C) IL-6 treatment induces the shape change of spheres formed by Sox2 overexpressing
esophageal epithelium. Sox2 overexpressing cells were FACS-sorted and cultured in matrix for 8 days
followed by the treatment of 10ng/ml IL-6 for another 5 days. (D) Increased protein levels of
phosphorylated Stat3 (p-Stat3) in the Sox2 overexpressing hyperplastic forestomach epithelium. Note that
Stat3 levels are moderately increased in the mutants (mt). Two mutants and KRT5-CreER controls are
shown. (E) Serial Dexamethasone injections inhibit neutrophil inflammation in the hyperplastic
epithelium. (F) Dexamethasone injections reduce tumor incidence in mutants with Sox2 overexpression.
Note the absence of tumor mass in the Dexamethasone-treated group three months after Sox2 induction,
and the stars indicate hyperplastic epithelium. (G) Serial injections of Stat3 inhibitor WP1066 suppress
tumor formation in the forestomach of the Sox2 overexpressing mice. Abbreviation: c, control; mt, mutant;
Fst, forestomach; Hst, hindstomach. Scale bar: 50µm.
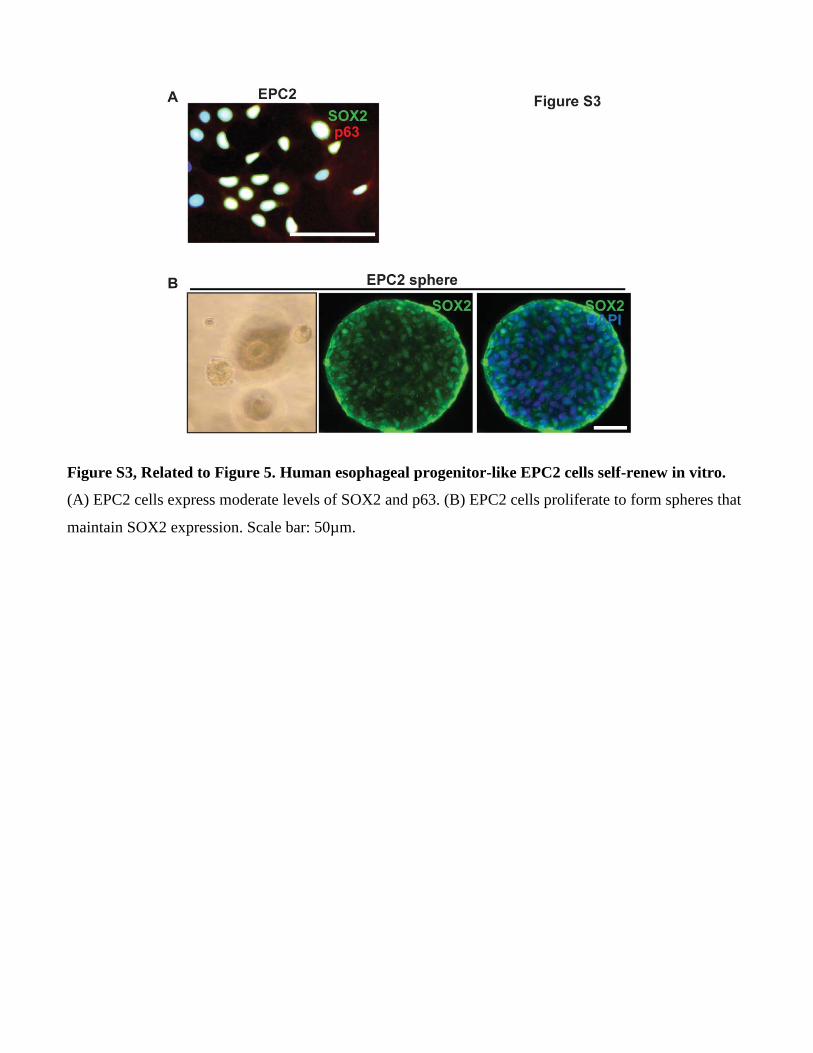
Figure S3, Related to Figure 5. Human esophageal progenitor-like EPC2 cells self-renew in vitro.
(A) EPC2 cells express moderate levels of SOX2 and p63. (B) EPC2 cells proliferate to form spheres that
maintain SOX2 expression. Scale bar: 50µm.
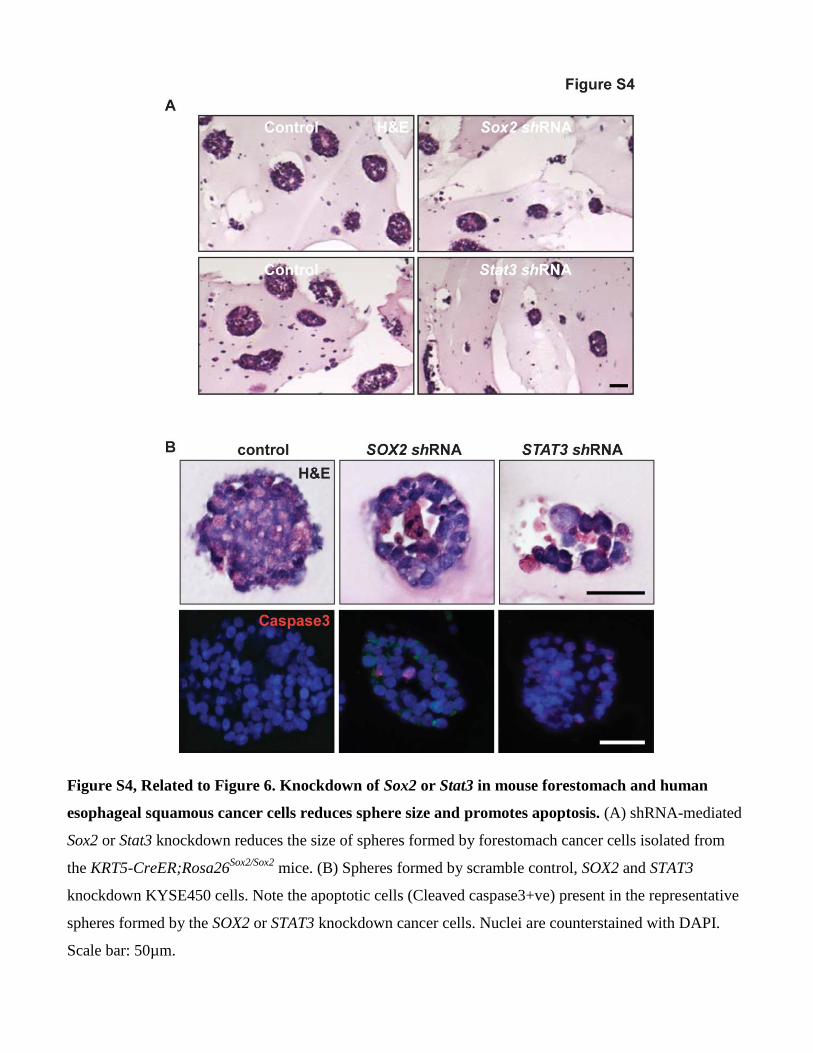
Figure S4, Related to Figure 6. Knockdown of Sox2 or Stat3 in mouse forestomach and human
esophageal squamous cancer cells reduces sphere size and promotes apoptosis. (A) shRNA-mediated
Sox2 or Stat3 knockdown reduces the size of spheres formed by forestomach cancer cells isolated from
the KRT5-CreER;Rosa26Sox2/Sox2
mice. (B) Spheres formed by scramble control, SOX2 and STAT3
knockdown KYSE450 cells. Note the apoptotic cells (Cleaved caspase3+ve) present in the representative
spheres formed by the SOX2 or STAT3 knockdown cancer cells. Nuclei are counterstained with DAPI.
Scale bar: 50µm.
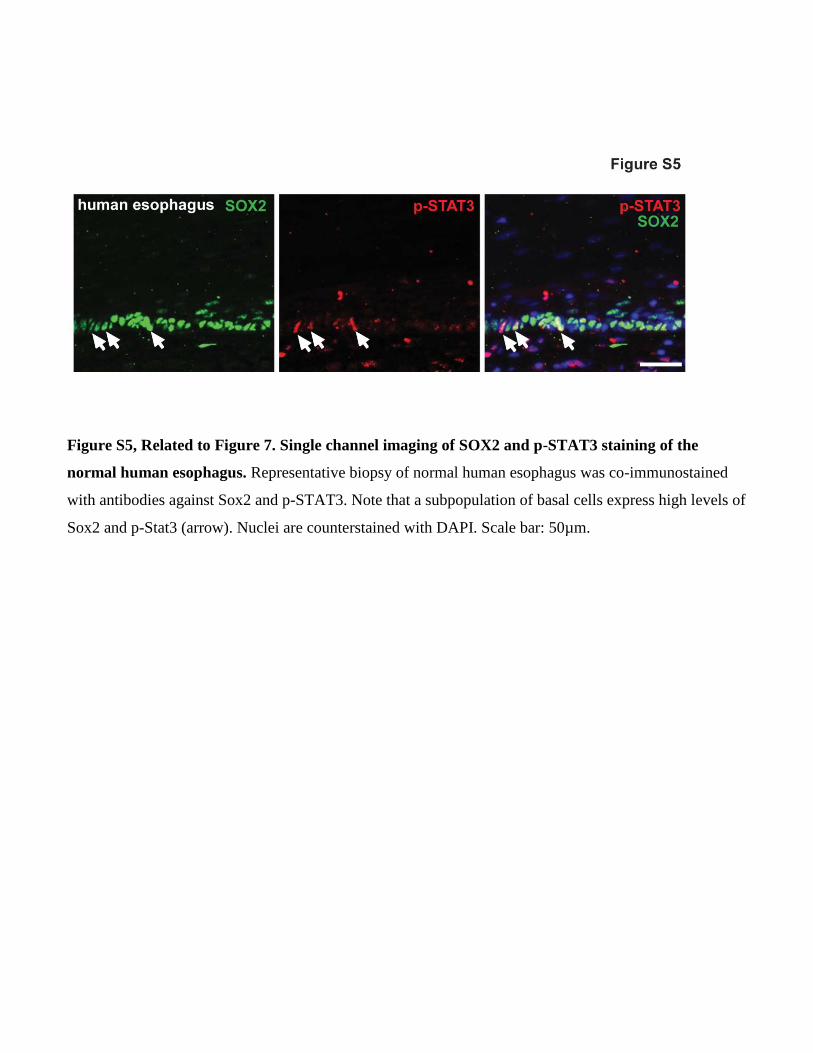
Figure S5, Related to Figure 7. Single channel imaging of SOX2 and p-STAT3 staining of the
normal human esophagus. Representative biopsy of normal human esophagus was co-immunostained
with antibodies against Sox2 and p-STAT3. Note that a subpopulation of basal cells express high levels of
Sox2 and p-Stat3 (arrow). Nuclei are counterstained with DAPI. Scale bar: 50µm.
Supplemental Tables
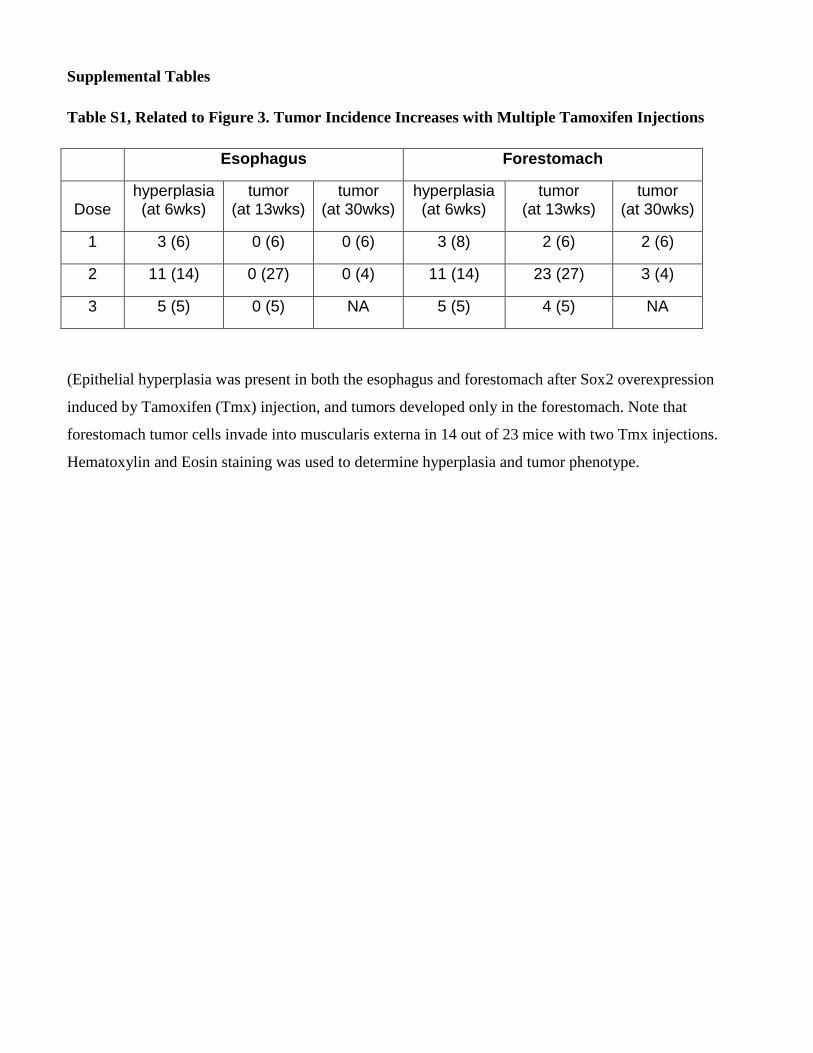
Table S1, Related to Figure 3. Tumor Incidence Increases with Multiple Tamoxifen Injections
Esophagus Forestomach
Dose hyperplasia (at 6wks)
tumor (at 13wks)
tumor (at 30wks)
hyperplasia (at 6wks)
tumor (at 13wks)
tumor (at 30wks)
1 3 (6) 0 (6) 0 (6) 3 (8) 2 (6) 2 (6)
2 11 (14) 0 (27) 0 (4) 11 (14) 23 (27) 3 (4)
3 5 (5) 0 (5) NA 5 (5) 4 (5) NA
(Epithelial hyperplasia was present in both the esophagus and forestomach after Sox2 overexpression
induced by Tamoxifen (Tmx) injection, and tumors developed only in the forestomach. Note that
forestomach tumor cells invade into muscularis externa in 14 out of 23 mice with two Tmx injections.
Hematoxylin and Eosin staining was used to determine hyperplasia and tumor phenotype.
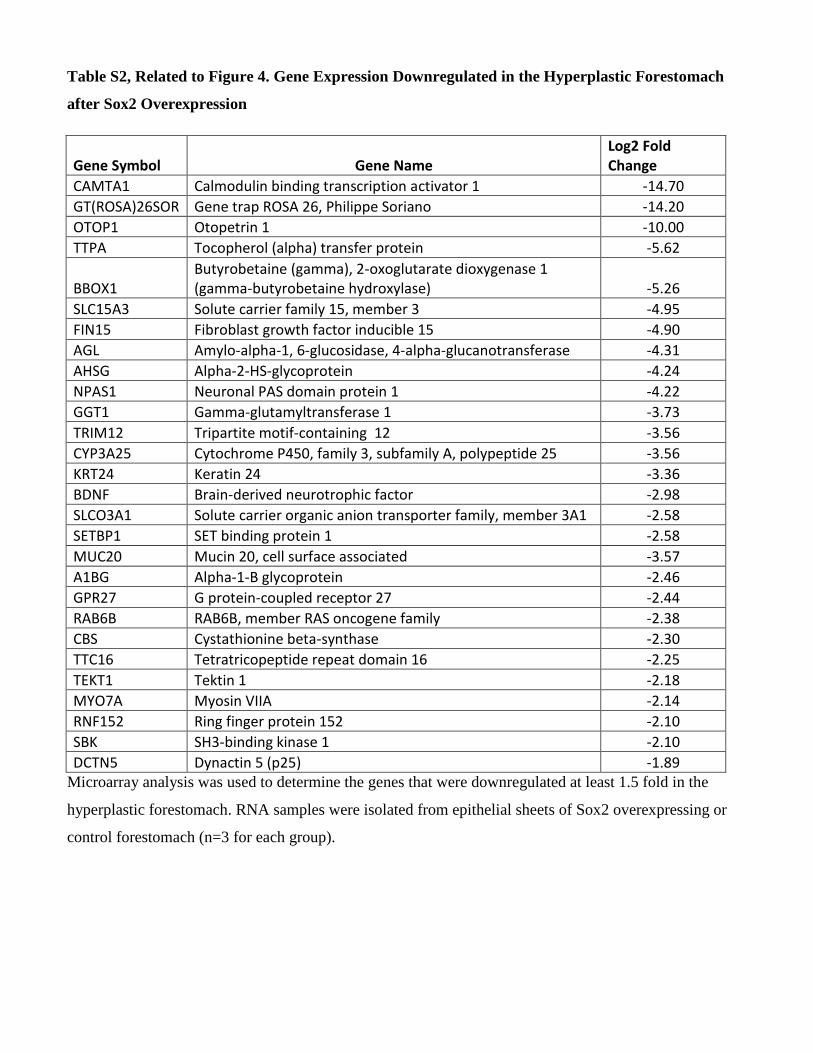
Table S2, Related to Figure 4. Gene Expression Downregulated in the Hyperplastic Forestomach
after Sox2 Overexpression
Gene Symbol Gene Name Log2 Fold Change
CAMTA1 Calmodulin binding transcription activator 1 -14.70
GT(ROSA)26SOR Gene trap ROSA 26, Philippe Soriano -14.20
OTOP1 Otopetrin 1 -10.00
TTPA Tocopherol (alpha) transfer protein -5.62
BBOX1 Butyrobetaine (gamma), 2-oxoglutarate dioxygenase 1 (gamma-butyrobetaine hydroxylase) -5.26
SLC15A3 Solute carrier family 15, member 3 -4.95
FIN15 Fibroblast growth factor inducible 15 -4.90
AGL Amylo-alpha-1, 6-glucosidase, 4-alpha-glucanotransferase -4.31
AHSG Alpha-2-HS-glycoprotein -4.24
NPAS1 Neuronal PAS domain protein 1 -4.22
GGT1 Gamma-glutamyltransferase 1 -3.73
TRIM12 Tripartite motif-containing 12 -3.56
CYP3A25 Cytochrome P450, family 3, subfamily A, polypeptide 25 -3.56
KRT24 Keratin 24 -3.36
BDNF Brain-derived neurotrophic factor -2.98
SLCO3A1 Solute carrier organic anion transporter family, member 3A1 -2.58
SETBP1 SET binding protein 1 -2.58
MUC20 Mucin 20, cell surface associated -3.57
A1BG Alpha-1-B glycoprotein -2.46
GPR27 G protein-coupled receptor 27 -2.44
RAB6B RAB6B, member RAS oncogene family -2.38
CBS Cystathionine beta-synthase -2.30
TTC16 Tetratricopeptide repeat domain 16 -2.25
TEKT1 Tektin 1 -2.18
MYO7A Myosin VIIA -2.14
RNF152 Ring finger protein 152 -2.10
SBK SH3-binding kinase 1 -2.10
DCTN5 Dynactin 5 (p25) -1.89 Microarray analysis was used to determine the genes that were downregulated at least 1.5 fold in the
hyperplastic forestomach. RNA samples were isolated from epithelial sheets of Sox2 overexpressing or
control forestomach (n=3 for each group).
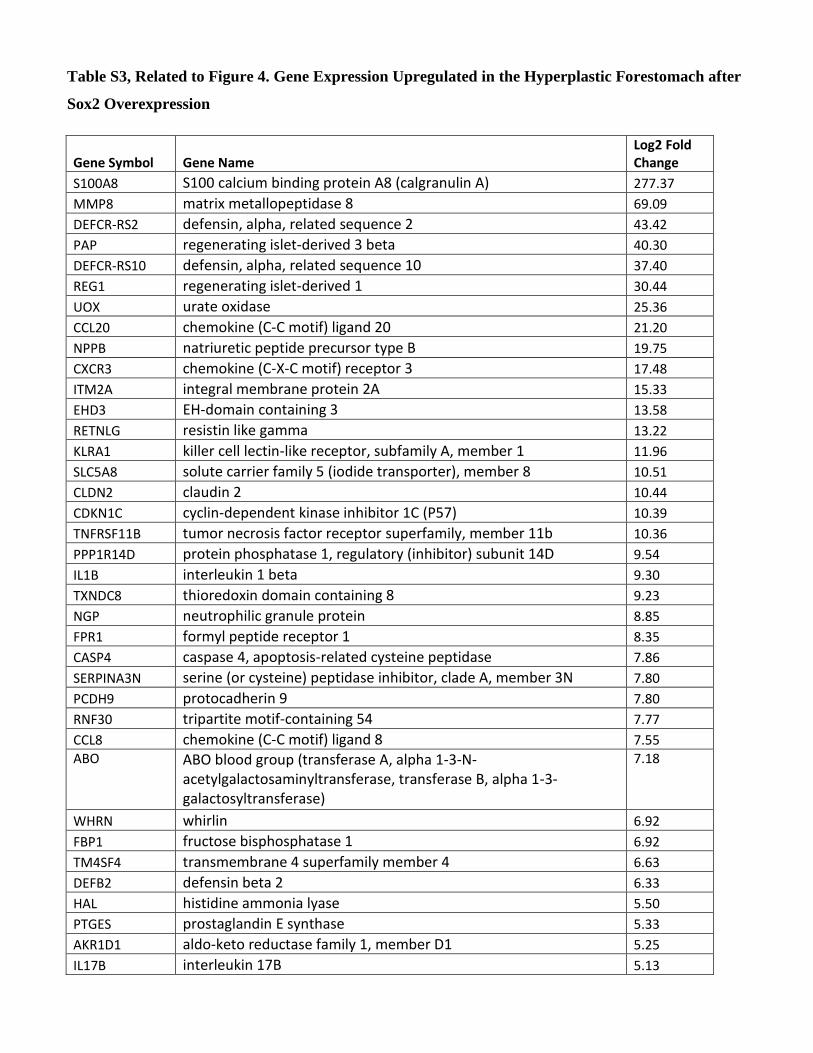
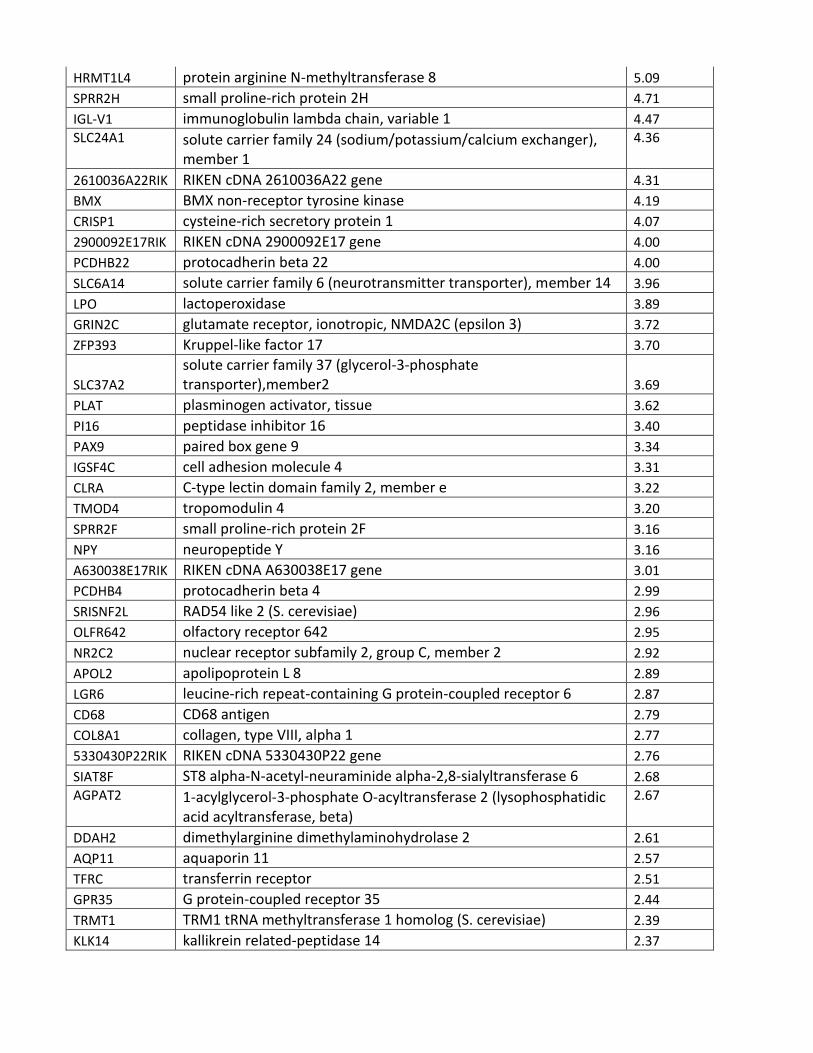
Table S3, Related to Figure 4. Gene Expression Upregulated in the Hyperplastic Forestomach after
Sox2 Overexpression
Gene Symbol Gene Name Log2 Fold Change
S100A8 S100 calcium binding protein A8 (calgranulin A) 277.37
MMP8 matrix metallopeptidase 8 69.09
DEFCR-RS2 defensin, alpha, related sequence 2 43.42
PAP regenerating islet-derived 3 beta 40.30
DEFCR-RS10 defensin, alpha, related sequence 10 37.40
REG1 regenerating islet-derived 1 30.44
UOX urate oxidase 25.36
CCL20 chemokine (C-C motif) ligand 20 21.20
NPPB natriuretic peptide precursor type B 19.75
CXCR3 chemokine (C-X-C motif) receptor 3 17.48
ITM2A integral membrane protein 2A 15.33
EHD3 EH-domain containing 3 13.58
RETNLG resistin like gamma 13.22
KLRA1 killer cell lectin-like receptor, subfamily A, member 1 11.96
SLC5A8 solute carrier family 5 (iodide transporter), member 8 10.51
CLDN2 claudin 2 10.44
CDKN1C cyclin-dependent kinase inhibitor 1C (P57) 10.39
TNFRSF11B tumor necrosis factor receptor superfamily, member 11b 10.36
PPP1R14D protein phosphatase 1, regulatory (inhibitor) subunit 14D 9.54
IL1B interleukin 1 beta 9.30
TXNDC8 thioredoxin domain containing 8 9.23
NGP neutrophilic granule protein 8.85
FPR1 formyl peptide receptor 1 8.35
CASP4 caspase 4, apoptosis-related cysteine peptidase 7.86
SERPINA3N serine (or cysteine) peptidase inhibitor, clade A, member 3N 7.80
PCDH9 protocadherin 9 7.80
RNF30 tripartite motif-containing 54 7.77
CCL8 chemokine (C-C motif) ligand 8 7.55
ABO ABO blood group (transferase A, alpha 1-3-N-acetylgalactosaminyltransferase, transferase B, alpha 1-3-galactosyltransferase)
7.18
WHRN whirlin 6.92
FBP1 fructose bisphosphatase 1 6.92
TM4SF4 transmembrane 4 superfamily member 4 6.63
DEFB2 defensin beta 2 6.33
HAL histidine ammonia lyase 5.50
PTGES prostaglandin E synthase 5.33
AKR1D1 aldo-keto reductase family 1, member D1 5.25
IL17B interleukin 17B 5.13
HRMT1L4 protein arginine N-methyltransferase 8 5.09
SPRR2H small proline-rich protein 2H 4.71
IGL-V1 immunoglobulin lambda chain, variable 1 4.47
SLC24A1 solute carrier family 24 (sodium/potassium/calcium exchanger), member 1
4.36
2610036A22RIK RIKEN cDNA 2610036A22 gene 4.31
BMX BMX non-receptor tyrosine kinase 4.19
CRISP1 cysteine-rich secretory protein 1 4.07
2900092E17RIK RIKEN cDNA 2900092E17 gene 4.00
PCDHB22 protocadherin beta 22 4.00
SLC6A14 solute carrier family 6 (neurotransmitter transporter), member 14 3.96
LPO lactoperoxidase 3.89
GRIN2C glutamate receptor, ionotropic, NMDA2C (epsilon 3) 3.72
ZFP393 Kruppel-like factor 17 3.70
SLC37A2
solute carrier family 37 (glycerol-3-phosphate transporter),member2 3.69
PLAT plasminogen activator, tissue 3.62
PI16 peptidase inhibitor 16 3.40
PAX9 paired box gene 9 3.34
IGSF4C cell adhesion molecule 4 3.31
CLRA C-type lectin domain family 2, member e 3.22
TMOD4 tropomodulin 4 3.20
SPRR2F small proline-rich protein 2F 3.16
NPY neuropeptide Y 3.16
A630038E17RIK RIKEN cDNA A630038E17 gene 3.01
PCDHB4 protocadherin beta 4 2.99
SRISNF2L RAD54 like 2 (S. cerevisiae) 2.96
OLFR642 olfactory receptor 642 2.95
NR2C2 nuclear receptor subfamily 2, group C, member 2 2.92
APOL2 apolipoprotein L 8 2.89
LGR6 leucine-rich repeat-containing G protein-coupled receptor 6 2.87
CD68 CD68 antigen 2.79
COL8A1 collagen, type VIII, alpha 1 2.77
5330430P22RIK RIKEN cDNA 5330430P22 gene 2.76
SIAT8F ST8 alpha-N-acetyl-neuraminide alpha-2,8-sialyltransferase 6 2.68
AGPAT2 1-acylglycerol-3-phosphate O-acyltransferase 2 (lysophosphatidic acid acyltransferase, beta)
2.67
DDAH2 dimethylarginine dimethylaminohydrolase 2 2.61
AQP11 aquaporin 11 2.57
TFRC transferrin receptor 2.51
GPR35 G protein-coupled receptor 35 2.44
TRMT1 TRM1 tRNA methyltransferase 1 homolog (S. cerevisiae) 2.39
KLK14 kallikrein related-peptidase 14 2.37
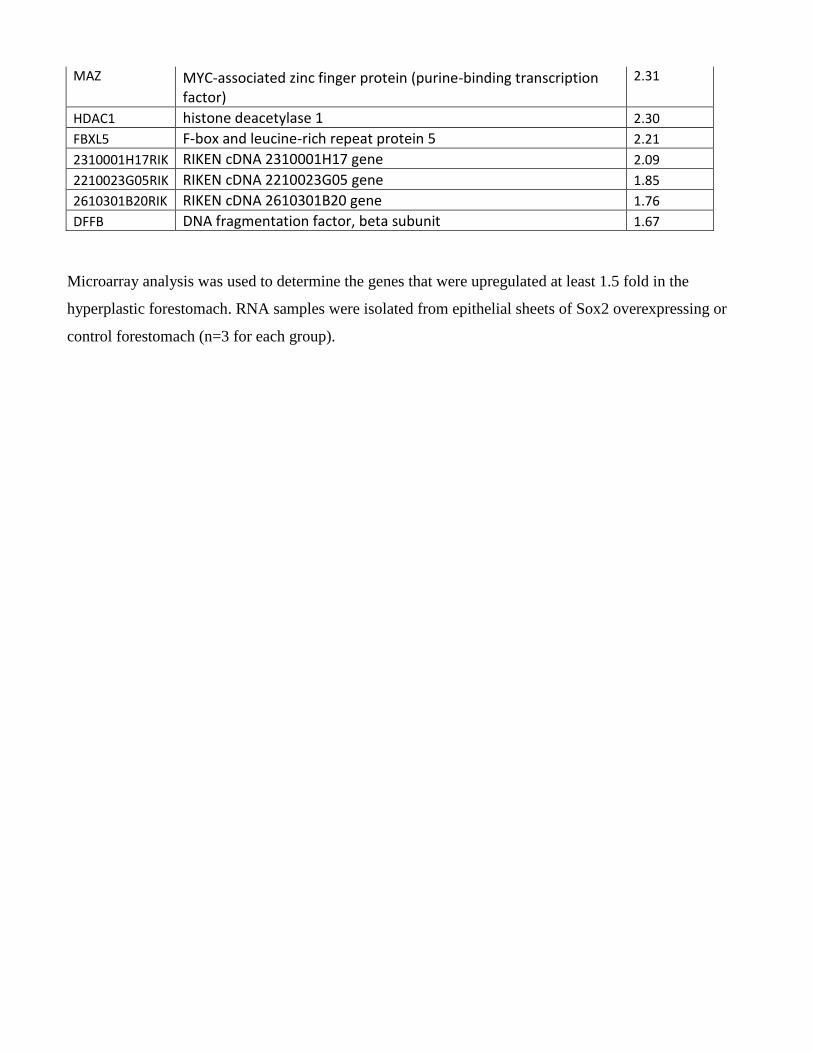
MAZ MYC-associated zinc finger protein (purine-binding transcription factor)
2.31
HDAC1 histone deacetylase 1 2.30
FBXL5 F-box and leucine-rich repeat protein 5 2.21
2310001H17RIK RIKEN cDNA 2310001H17 gene 2.09
2210023G05RIK RIKEN cDNA 2210023G05 gene 1.85
2610301B20RIK RIKEN cDNA 2610301B20 gene 1.76
DFFB DNA fragmentation factor, beta subunit 1.67
Microarray analysis was used to determine the genes that were upregulated at least 1.5 fold in the
hyperplastic forestomach. RNA samples were isolated from epithelial sheets of Sox2 overexpressing or
control forestomach (n=3 for each group).
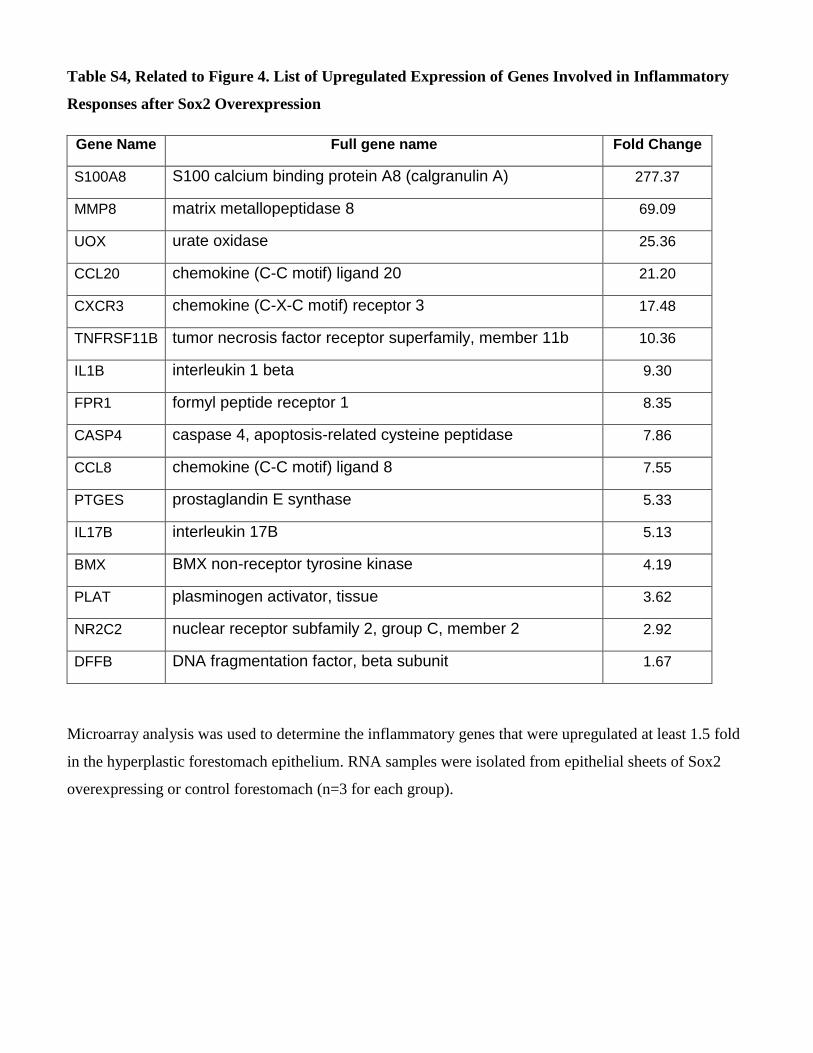
Table S4, Related to Figure 4. List of Upregulated Expression of Genes Involved in Inflammatory
Responses after Sox2 Overexpression
Gene Name Full gene name Fold Change
S100A8 S100 calcium binding protein A8 (calgranulin A) 277.37
MMP8 matrix metallopeptidase 8 69.09
UOX urate oxidase 25.36
CCL20 chemokine (C-C motif) ligand 20 21.20
CXCR3 chemokine (C-X-C motif) receptor 3 17.48
TNFRSF11B tumor necrosis factor receptor superfamily, member 11b 10.36
IL1B interleukin 1 beta 9.30
FPR1 formyl peptide receptor 1 8.35
CASP4 caspase 4, apoptosis-related cysteine peptidase 7.86
CCL8 chemokine (C-C motif) ligand 8 7.55
PTGES prostaglandin E synthase 5.33
IL17B interleukin 17B 5.13
BMX BMX non-receptor tyrosine kinase 4.19
PLAT plasminogen activator, tissue 3.62
NR2C2 nuclear receptor subfamily 2, group C, member 2 2.92
DFFB DNA fragmentation factor, beta subunit 1.67
Microarray analysis was used to determine the inflammatory genes that were upregulated at least 1.5 fold
in the hyperplastic forestomach epithelium. RNA samples were isolated from epithelial sheets of Sox2
overexpressing or control forestomach (n=3 for each group).
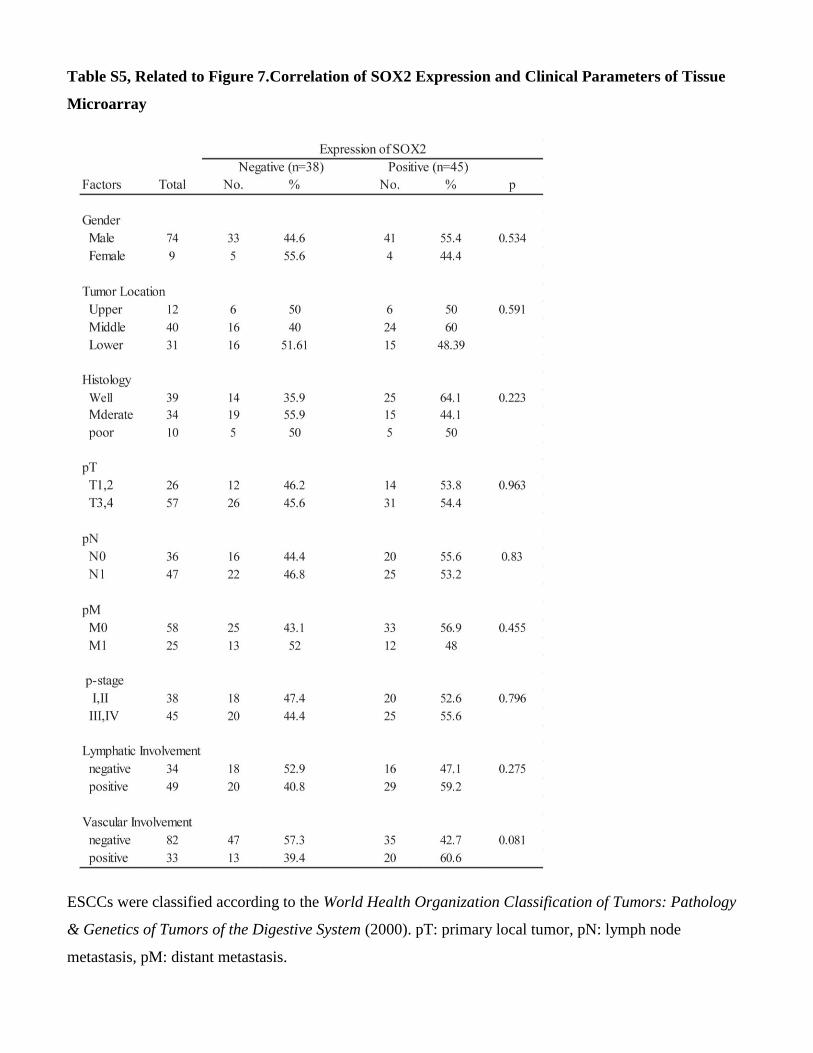
Table S5, Related to Figure 7.Correlation of SOX2 Expression and Clinical Parameters of Tissue
Microarray
ESCCs were classified according to the World Health Organization Classification of Tumors: Pathology
& Genetics of Tumors of the Digestive System (2000). pT: primary local tumor, pN: lymph node
metastasis, pM: distant metastasis.
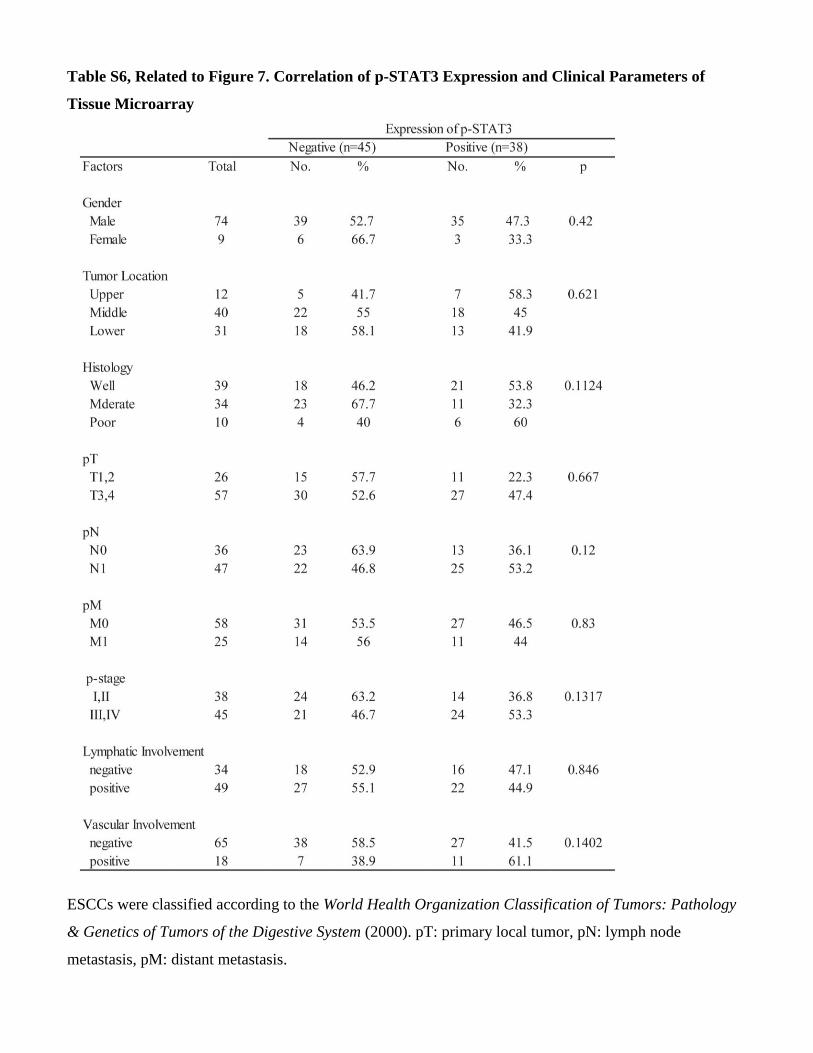
Table S6, Related to Figure 7. Correlation of p-STAT3 Expression and Clinical Parameters of
Tissue Microarray
ESCCs were classified according to the World Health Organization Classification of Tumors: Pathology
& Genetics of Tumors of the Digestive System (2000). pT: primary local tumor, pN: lymph node
metastasis, pM: distant metastasis.
Supplemental Experimental Procedures
Mice
The C57BL/6, Rosa26DTA
(Gt(ROSA)26Sortm1(DTA)Lky
), Rosa26-LacZ (Gt(Rosa)26Sortm1Sor
) and
NOD/SCID gamma (NSG) mice were purchased from The Jackson Laboratory. The Sox2-GFP, the
transgenic KRT5-CreERT2
and the conditional Rosa26CAG-loxp-stop-loxp-Sox2-IRES-Egfp
lines have been described
before and are maintained in C57BL/6 and 129SvEv mixed background (Lu et al., 2010; Que et al., 2007;
Rock et al., 2009). The Sox2-CreER mouse line is maintained in C57BL/6 and 129SvEv mixed
background, and the detail for this mouse line will be described elsewhere (Kiernan A). For lineage-
tracing in the adult esophagus and forestomach, 7~10 week-old mice heterozygous Sox2-CreER or
hemizygous KRT5-CreER and homozygous for Rosa26R-LacZ were injected i.p. once (0.1mg/g body
weight) or four times (every other day with 0.25 mg/g body weight) with Tamoxifen in Mazola corn oil
(ACH Food Companies). To activate Sox2 overexpression in the KRT5-CreER;Rosa26Sox2/Sox2
mutants
Tamoxifen was injected every other day with 0.25mg/g body weight 1-4 times. To ablate basal cells in
the Sox2-CreER;Rosa26DTA
mutants Tamoxifen was injected every other day with 0.25mg/g body weight
for three times. To suppress inflammatory reaction 10 mg/kg/day Dexamethasone or PBS (control) was
injected intraperitoneally for consecutive 10 days, and the first injection is administrated at 4 weeks after
Sox2 overexpression. Similarly, DMSO (control) or Stat3 inhibitor WP1066 (STAT3 Inhibitor III, 50 mM
stock, Calbiochem) diluted with [DMSO + polyethylene glycol (20:80)] was injected intraperitoneally
(40mg/kg) every other day until six doses had been given as previously described (Iwamaru et al., 2007).
Mice were then sacrificed 2 or 55 days after the final injection, and the esophagi and forestomach were
harvested for histology analysis. KRT5-CreER mice injected with Tamoxifen were included as controls
for all experiments. All the mice were maintained in the University’s animal facility according to
institutional guidelines. All mouse experiments were conducted in accordance with procedures approved
by the Institutional Animal Care and Use Committee.
Tissue Preparation and Immunostaining
The esophagi and stomach were dissected in PBS and fixed in 4% paraformaldehyde in PBS overnight at
4°C. After dehydration they were embedded in paraffin for sectioning and immunohistochemistry. The
pathological changes in the esophagus and forestomach were evaluated by two pathologists. The
antibodies used for immunohistochemistry include: anti-p63 (1:500, mouse monoclonal, Santa Cruz clone
4A4), anti-Sox2 (1:500, rabbit polyclonal, Chemicon AB5603), anti-Krt5 (1:100; rabbit polyclonal,
Covance), anti-Krt14 (1:200; rabbit polyclonal, Covance), anti-Loricrin (1:500, rabbit polyclonal, kindly
provided by Dr. Terry Lechler, Duke University Medical Center), anti-phosphorylated Histone H3 (1:500,
rat monoclonal, Sigma HTA28), anti-Ki67 (1:500, mouse monoclonal, Vector Labs), anti-cleaved
caspase3 (1:500, rabbit polyclonal, Abcam), anti-GFP (1:1000, chicken polyclonal, Aves Labs), anti-
mouse p75 (1:100, rabbit polyclonal, Abcam), anti-human p75 (1:100, mouse monoclonal, Millipore),
anti-Ly6c (1:250, rabbit polyclonal, Abcam), anti-IL-6 (1:100, rabbit polyclonal, Abcam), anti-F4/80
(1:200, rat monoclonal, Abcam ab6640), anti-pStat3 (Tyr705) (1:100, rabbit polyclonal, Cell signaling),
anti-smooth muscle actin (1:500, mouse monoclonal, Sigma). The secondary antibodies were either
fluorescence or DAB-conjugated, and pictures were taken with a Leica SP1 confocal microscope. For
whole-mount X-gal staining, the esophagus and forestomach were fixed in 4% paraformaldehyde for 30
min followed by X-gal staining overnight at 37ºC. The X-gal stained samples were then dehydrated with
isopropanol and embedded in paraffin for sectioning as previously described (Chen et al., 2012;
Rodriguez et al., 2010).
Genetic Perturbation of Gene Expression
Lentiviral vectors containing Sox2 and Stat3 shRNA sequences were obtained from the RNAi Consortium
(TRC) (http://www.broadinstitute.org/rnai/trc, distributed by Open Biosystems) and Dr. Adam Bass at the
Department of Medicine, Harvard Medical School and Sox2 shRNA was validated previously (Bass et al.,
2009). For shRNA targeting mouse or human STAT3, four clones targeting different sequences were
analyzed for efficiency through Western blot, including shRNA against GFP as a control. Forestomach
tumor or KYSE450 cells were plated in 6-well plates and infected on the following day with 1µl of
lentivirus with 8µg/ml polybrene, and 1ug/ml Puromycin was added 24hr after infection. Six days after
infection, the cells were harvested and then replated onto 6-well plate or coverslip in 24-well plate for
testing the effect of knockdown on proliferation. For immunostaining with proliferation marker
phosphorylated Histone H3, cells were grown on a coverslip for two days, fixed in 4%PFA for 15 min at
room temperature, and then processed for staining. For cell counting experiment, cells were harvested
from 6-well plate one, two or three days after replating and counted with hemocytometer. Stat3C
(Bromberg et al., 1999) and Sox2-IRES-GFP which was cut from Rosa26-CAG-Sox2-IRES-GFP were
cloned into the pCDH lentiviral vector. EPC2 cells infected with Stat3C and Sox2-IRES-GFP containing
virus were selected with Puromycin and GFP expression, respectively. EPC2 cells containing Sox2-IRES-
GFP were infected with Stat3C virus to generate cells co-expressing Sox2 and Stat3C. For the generation
of mouse esophageal basal progenitor cells co-expressing Sox2 and Stat3C, GFP+ve progenitor cells were
first isolated and FACs sorted from the esophagi of the KRT5-CreER;Rosa26Sox2/Sox2
mice after four
doses of Tamoxifen, and then infected with Stat3C lentivirus, followed by drug selection with Puromycin.

RNA Isolation and Microarray Analysis
Microarray and data analysis were performed by the Genomics Core Facility, Lineberger Comprehensive
Cancer Center, University of North Carolina at Chapel Hill. Epithelial cells were harvested from the
hyperplastic forestomach of three adult KRT5-CreER;Rosa26Sox2/Sox2
mutants and three controls four
weeks after two Tamoxifen injections, and total RNA was extracted with TRIzol (Invitrogen) and
purified with RNeasy Mini kit (Qiagen) and quality checked with a 2100 Bioanalyzer (Agilent
Technologies). Labeled RNA (125ng per sample) was hybridized to Agilent two-channel mouse 4x44k
microarrays chips per manufacturer’s standard protocol (Agilent Technology). After hybridization, the
arrays were scanned and analyzed by an Axon GenePix 4000B scanner and Gene Pix Pro 5.0 software,
respectively (Axon Instruments; Foster City, CA). Gene expression values were quantified by log base 2
ratio of red channel intensity (mean) and green channel intensity (mean), followed by Lowess
normalization to remove the intensity-dependent dye bias. The raw data were deposited in the Gene
Expression Omnibus of the National Center for Biotechnology Information (accession number GSE
37857). Array data were extracted on the probe level. For probes spotted multiple times, the mean
expression value was computed and retained. All probe sequences were BLAST against the Agilent
annotation of gene symbol. When multiple probes were targeted on the same gene (with the same gene
symbol), these data were collapsed onto the gene symbol, and mean values were computed as the gene
expression value. Differentially expressed genes were generated with the excel add-in software “SAM”
developed at Stanford University (Tusher et al., 2001) with the cutoff of median number of false positives
less than 1. The upregulated genes (>1.5 fold) after Sox2 overexpression were analyzed with Ingenuity
Pathway Analysis (Ingenuity Systems Inc) following the manufacturer’s instructions, and the list of genes
involved in inflammatory responses was generated.
Reverse Transcription and Real-time PCR
RNA reverse transcription was performed with using the iScript cDNA synthesis kit (Bio-Rad, Hercules,
CA) according to the manufacturer's instructions. The RT-cDNA reaction products were subjected to
quantitative real-time PCR using the MyiQ single-color real-time PCR detection system (Bio-Rad) and iQ
SYBR green supermix (Bio-Rad). All expression levels were normalized to β-actin levels of the same
sample. Percent expression was calculated as the ratio of the normalized value of each sample to that of
the corresponding control. All real-time PCR reactions were performed in triplicate. PCR primers were
designed using Lasergene Core Suite (DNASTAR, Inc.), and the sequences are as following, mouse
Interleukin 1β (IL-1β): 5’-GCAACTGTTCCTGAACTCAACT-3’ and 5’-AT
CTTTTGGGGTCCGTCAACT-3’; IL-6: 5’-CTGCAAGAGACTTCCATCCAG -3’ and 5’-
AGTGGTATAGACAGGTCTGTTGG-3’; β-actin 5’-TGTT ACCAACTGGGACGACA-3’ and 5’-
CTGGGTCATCTTTTCACGGT -3’.
Western Blot Analysis
Basal progenitor cells isolated from the esophagus and forestomach of the Sox2 overexpressing
(GFP+ve), Sox2-GFP (GFP+ve) and wildtype (p75+ve) mice were FACS-sorted and lysed on ice in lysis
reagent (C2978; Sigma) supplemented with 1:100 protease inhibitor cocktail (P8340; Sigma). Similarly,
protein was extracted from isolated forestomach epithelial sheets or KYSE450 cells. Samples containing
20ug protein were denatured and proteins separated on 12% SDS-polyacrylamide gel followed by
immunoblotting. Primary antibodies were Sox2 (1:2000, Chemicon), Stat3 and p-Stat3 (1:3000, Cell
signaling) and ß-actin (1:2000, Abcam), and the blots were processed as previously described (Que et al.,
2007).
Xenograft Assays
To assess whether Sox2 and Stat3C overexpressing mouse esophageal basal progenitor cells and human
EPC2 cells can form tumor, 1x10⁶ cells were injected into the immunodeficient NSG mice (n=3). Same
number of cells with either Sox2 or Stat3C overexpression alone were injected as controls. Five weeks
later the mice were sacrificed for tumor assessment. The experiments have been repeated once. In
addition, tumor formation with KYSE450 cell line was assessed by sub-cutaneous injection of 1x10⁴ cells
into NSG mice. Prior to inoculation, shRNA-mediated knockdown of SOX2, STAT3 or both was
performed in these cells followed by treatment with Puromycin for 6 days (6 injections for each group).
KYSE450 cells infected with virus containing scramble vectors serve as controls. Tumors were harvested
and weighed four weeks post-injection. Similarly, tumor formation using Sox2 or Stat3 knockdown
forestomach tumor cells isolated from the KRT5-CreER;Rosa26Sox2/Sox2
mice was assessed by sub-
cutaneous injection of 1x10⁶ cells (6 injections for each group).
Human Tissue Microarray (TMA)
The TMA was provided by Drs. Shoji Natsugoe and Yoshiaki Kita at the Department of Digestive
Surgery in Kagoshima University, Japan. TMA was created using 83-matched paraffin blocks from de-
identified patients with primary ESCC and adjacent normal esophageal tissues (with Institutional Review
Board exempt status for the TMA due to the de-identification). TMA was evaluated for SOX2 and p-
STAT3 expression by co-immunostaining. Scoring of SOX2 and p-STAT3 was based upon a quantitative
evaluation of expression using a scale from 0 to 2 (0=absent, 1=mild-moderate, 2=high). The statistical
analysis of group differences was performed using the χ2 test. Overall survival curves were plotted
according to the Kaplan-Meier method, with the log-lank test applied for comparisons. p< 0.05 was
considered statistically significant. All statistical analyses were performed using JMPTM for Windows
(Version 5.0.1, SAS Institute Inc, Cary, NC, USA).
Supplemental References
Bass, A. J., Watanabe, H., Mermel, C. H., Yu, S., Perner, S., Verhaak, R. G., Kim, S. Y., Wardwell, L.,
Tamayo, P., Gat-Viks, I., et al. (2009). SOX2 is an amplified lineage-survival oncogene in lung and
esophageal squamous cell carcinomas. Nat Genet 41, 1238-1242.
Bromberg, J. F., Wrzeszczynska, M. H., Devgan, G., Zhao, Y., Pestell, R. G., Albanese, C., and Darnell,
J. E., Jr. (1999). Stat3 as an oncogene. Cell 98, 295-303.
Chen, H., Li, J., Li, H., Hu, Y., Tevebaugh, W., Yamamoto, M., Que, J., and Chen, X. (2012). Transcript
Profiling Identifies Dynamic Gene Expression Patterns and an Important Role for Nrf2/Keap1 Pathway in
the Developing Mouse Esophagus. PLoS One 7, e36504.
Iwamaru, A., Szymanski, S., Iwado, E., Aoki, H., Yokoyama, T., Fokt, I., Hess, K., Conrad, C., Madden,
T., Sawaya, R., et al. (2007). A novel inhibitor of the STAT3 pathway induces apoptosis in malignant
glioma cells both in vitro and in vivo. Oncogene 26, 2435-2444.
Lu, Y., Futtner, C., Rock, J. R., Xu, X., Whitworth, W., Hogan, B. L., and Onaitis, M. W. (2010).
Evidence that SOX2 overexpression is oncogenic in the lung. PLoS One 5, e11022.
Que, J., Okubo, T., Goldenring, J. R., Nam, K. T., Kurotani, R., Morrisey, E. E., Taranova, O., Pevny, L.
H., and Hogan, B. L. (2007). Multiple dose-dependent roles for Sox2 in the patterning and differentiation
of anterior foregut endoderm. Development 134, 2521-2531.
Rock, J. R., Onaitis, M. W., Rawlins, E. L., Lu, Y., Clark, C. P., Xue, Y., Randell, S. H., and Hogan, B. L.
(2009). Basal cells as stem cells of the mouse trachea and human airway epithelium. Proc Natl Acad Sci
U S A 106, 12771-12775.
Rodriguez, P., Da Silva, S., Oxburgh, L., Wang, F., Hogan, B. L., and Que, J. (2010). BMP signaling in
the development of the mouse esophagus and forestomach. Development 137, 4171-4176.
Tusher, V. G., Tibshirani, R., and Chu, G. (2001). Significance analysis of microarrays applied to the
ionizing radiation response. Proc Natl Acad Sci U S A 98, 5116-5121.