sp energy networks (spen)...1.1 sp energy networks (spen) has a strong focus on customer 2. and...
TRANSCRIPT
Environmental Discretionary Reward Scheme 3
2.7AnnexSP Energy Networks 2015–2023 Business Plan
Written evidence to the
Scottish Affairs Committee
SP Energy Networks
February 2012
1
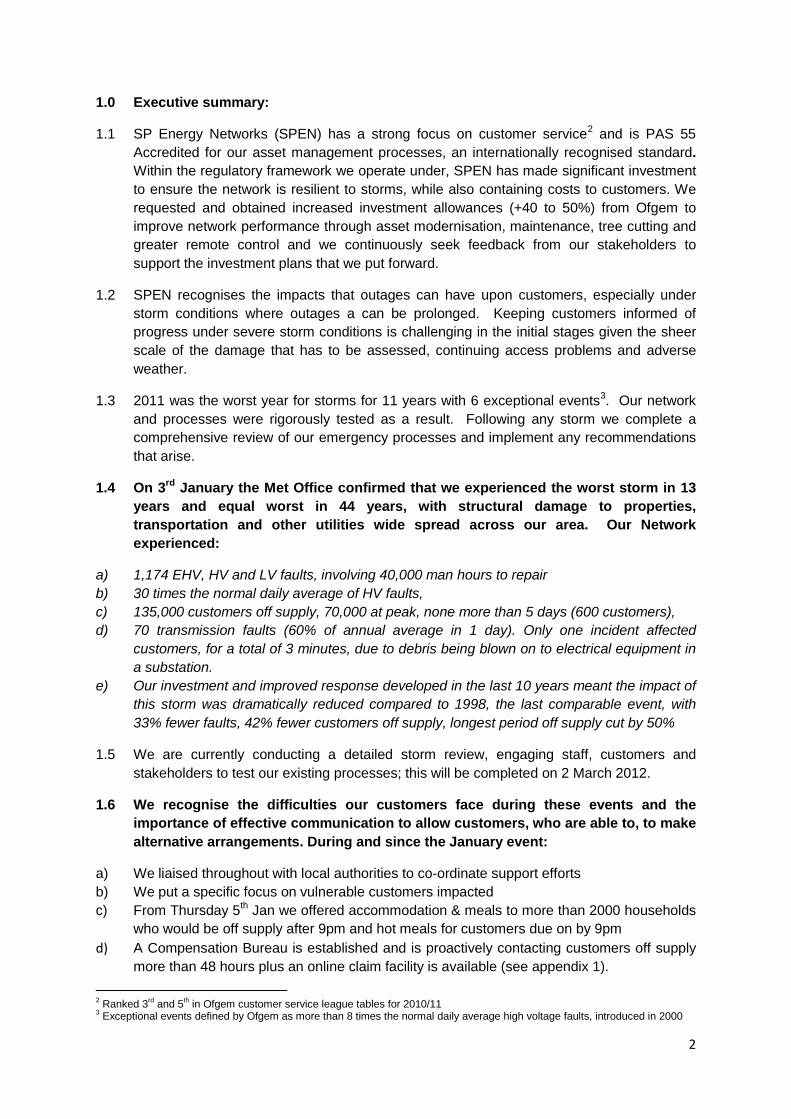
Written Evidence to Scottish Affairs Committee - 2nd February 2012
SP Energy Networks (SPEN)
SP Transmission (SPT), SP Distribution (SPD), SP Manweb (SPM)
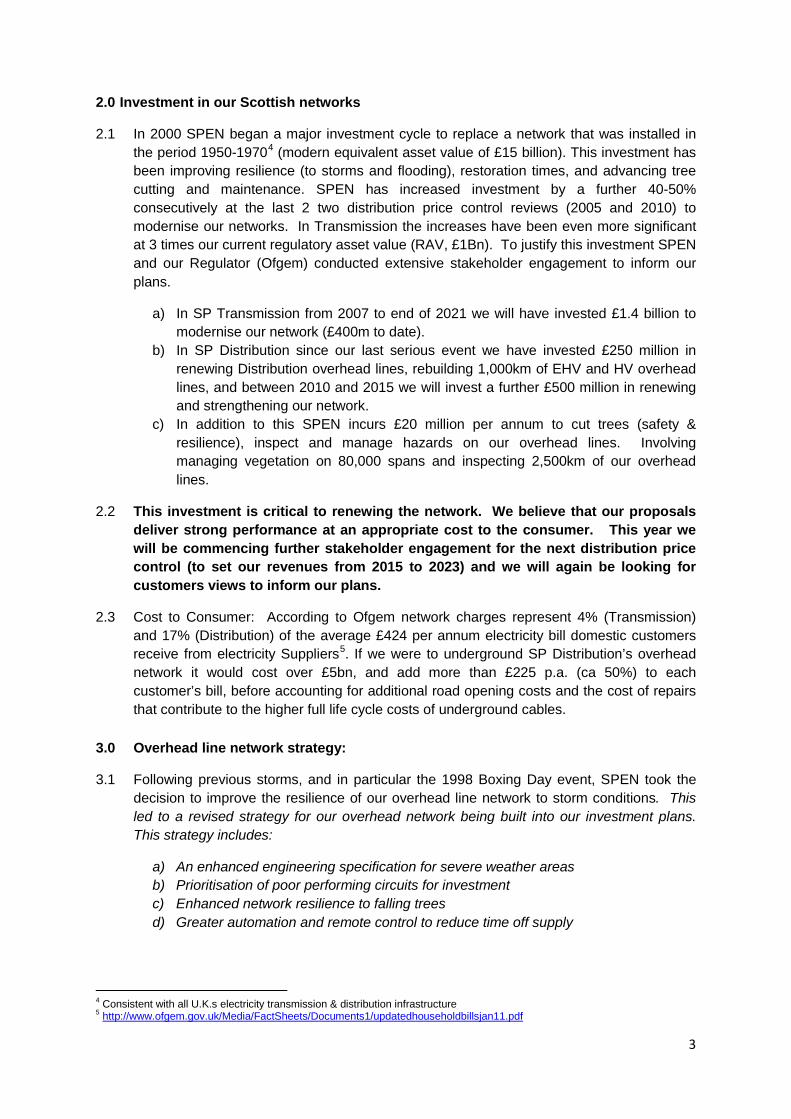
Network & Fault Statistics from Typical Year1
1 NAFIRS (National Fault and Interruptions Reporting Scheme) reports for 2008/09. Transmission - 132kV/275kV/400kV, Distribution – 33kV Extra High Voltage (EHV), 11kV High Voltage (HV), and 415v/230v Low Voltage (LV)
SP Distribution SP Transmission 132 /275/400 kV network length km - 4100 132/275/400 kV network underground - 132/275/400 kV network faults per annum - 123 132/275/400 kV network faults per 100 km per annum - 3.0
EHV network length km 5,700 - EHV network underground (%) 53% - EHV network faults per annum 296 - EHV network faults per 100 km per annum 5.2 - EHV overhead network affected by trees(%) 10%
HV network length km 27,000 - HV network underground (%) 47% - HV network faults per annum 2,547 - HV network faults per 100 km per annum 9.4 - HV overhead network affected by trees (%) 10%
LV network length km 30,900 - LV network underground (%) 86% - LV network faults per annum 9,699 - LV network faults per 100 km per annum 31.4 - LV overhead network affected by trees (%) 33%
Total Network length km 63,600 4,100
2
1.0 Executive summary:
1.1 SP Energy Networks (SPEN) has a strong focus on customer service2 and is PAS 55 Accredited for our asset management processes, an internationally recognised standard. Within the regulatory framework we operate under, SPEN has made significant investment to ensure the network is resilient to storms, while also containing costs to customers. We requested and obtained increased investment allowances (+40 to 50%) from Ofgem to improve network performance through asset modernisation, maintenance, tree cutting and greater remote control and we continuously seek feedback from our stakeholders to support the investment plans that we put forward.
1.2 SPEN recognises the impacts that outages can have upon customers, especially under storm conditions where outages a can be prolonged. Keeping customers informed of progress under severe storm conditions is challenging in the initial stages given the sheer scale of the damage that has to be assessed, continuing access problems and adverse weather.
1.3 2011 was the worst year for storms for 11 years with 6 exceptional events3. Our network and processes were rigorously tested as a result. Following any storm we complete a comprehensive review of our emergency processes and implement any recommendations that arise.
1.4 On 3rd January the Met Office confirmed that we experienced the worst storm in 13 years and equal worst in 44 years, with structural damage to properties, transportation and other utilities wide spread across our area. Our Network experienced:
a) 1,174 EHV, HV and LV faults, involving 40,000 man hours to repair b) 30 times the normal daily average of HV faults, c) 135,000 customers off supply, 70,000 at peak, none more than 5 days (600 customers), d) 70 transmission faults (60% of annual average in 1 day). Only one incident affected
customers, for a total of 3 minutes, due to debris being blown on to electrical equipment in a substation.
e) Our investment and improved response developed in the last 10 years meant the impact of this storm was dramatically reduced compared to 1998, the last comparable event, with 33% fewer faults, 42% fewer customers off supply, longest period off supply cut by 50%
1.5 We are currently conducting a detailed storm review, engaging staff, customers and stakeholders to test our existing processes; this will be completed on 2 March 2012.
1.6 We recognise the difficulties our customers face during these events and the importance of effective communication to allow customers, who are able to, to make alternative arrangements. During and since the January event:
a) We liaised throughout with local authorities to co-ordinate support efforts b) We put a specific focus on vulnerable customers impacted c) From Thursday 5th Jan we offered accommodation & meals to more than 2000 households
who would be off supply after 9pm and hot meals for customers due on by 9pm d) A Compensation Bureau is established and is proactively contacting customers off supply
more than 48 hours plus an online claim facility is available (see appendix 1).
2 Ranked 3rd and 5th in Ofgem customer service league tables for 2010/11 3 Exceptional events defined by Ofgem as more than 8 times the normal daily average high voltage faults, introduced in 2000
3
2.0 Investment in our Scottish networks
2.1 In 2000 SPEN began a major investment cycle to replace a network that was installed in the period 1950-19704 (modern equivalent asset value of £15 billion). This investment has been improving resilience (to storms and flooding), restoration times, and advancing tree cutting and maintenance. SPEN has increased investment by a further 40-50% consecutively at the last 2 two distribution price control reviews (2005 and 2010) to modernise our networks. In Transmission the increases have been even more significant at 3 times our current regulatory asset value (RAV, £1Bn). To justify this investment SPEN and our Regulator (Ofgem) conducted extensive stakeholder engagement to inform our plans.
a) In SP Transmission from 2007 to end of 2021 we will have invested £1.4 billion to modernise our network (£400m to date).
b) In SP Distribution since our last serious event we have invested £250 million in renewing Distribution overhead lines, rebuilding 1,000km of EHV and HV overhead lines, and between 2010 and 2015 we will invest a further £500 million in renewing and strengthening our network.
c) In addition to this SPEN incurs £20 million per annum to cut trees (safety & resilience), inspect and manage hazards on our overhead lines. Involving managing vegetation on 80,000 spans and inspecting 2,500km of our overhead lines.
2.2 This investment is critical to renewing the network. We believe that our proposals deliver strong performance at an appropriate cost to the consumer. This year we will be commencing further stakeholder engagement for the next distribution price control (to set our revenues from 2015 to 2023) and we will again be looking for customers views to inform our plans.
2.3 Cost to Consumer: According to Ofgem network charges represent 4% (Transmission) and 17% (Distribution) of the average £424 per annum electricity bill domestic customers receive from electricity Suppliers5. If we were to underground SP Distribution’s overhead network it would cost over £5bn, and add more than £225 p.a. (ca 50%) to each customer’s bill, before accounting for additional road opening costs and the cost of repairs that contribute to the higher full life cycle costs of underground cables.
3.0 Overhead line network strategy:
3.1 Following previous storms, and in particular the 1998 Boxing Day event, SPEN took the decision to improve the resilience of our overhead line network to storm conditions. This led to a revised strategy for our overhead network being built into our investment plans. This strategy includes:
a) An enhanced engineering specification for severe weather areas b) Prioritisation of poor performing circuits for investment c) Enhanced network resilience to falling trees d) Greater automation and remote control to reduce time off supply
4 Consistent with all U.K.s electricity transmission & distribution infrastructure 5 http://www.ofgem.gov.uk/Media/FactSheets/Documents1/updatedhouseholdbillsjan11.pdf
4
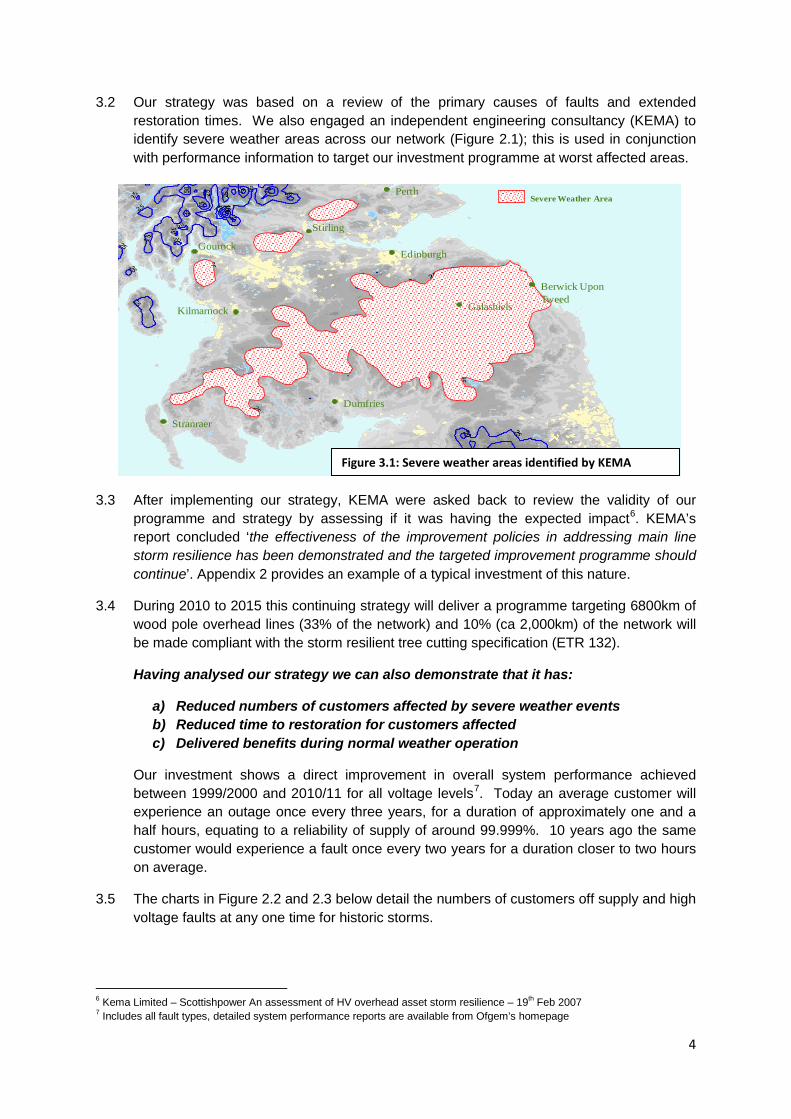
3.2 Our strategy was based on a review of the primary causes of faults and extended restoration times. We also engaged an independent engineering consultancy (KEMA) to identify severe weather areas across our network (Figure 2.1); this is used in conjunction with performance information to target our investment programme at worst affected areas.
3.3 After implementing our strategy, KEMA were asked back to review the validity of our programme and strategy by assessing if it was having the expected impact6. KEMA’s report concluded ‘the effectiveness of the improvement policies in addressing main line storm resilience has been demonstrated and the targeted improvement programme should continue’. Appendix 2 provides an example of a typical investment of this nature.
3.4 During 2010 to 2015 this continuing strategy will deliver a programme targeting 6800km of wood pole overhead lines (33% of the network) and 10% (ca 2,000km) of the network will be made compliant with the storm resilient tree cutting specification (ETR 132).
Having analysed our strategy we can also demonstrate that it has:
a) Reduced numbers of customers affected by severe weather events b) Reduced time to restoration for customers affected c) Delivered benefits during normal weather operation
Our investment shows a direct improvement in overall system performance achieved between 1999/2000 and 2010/11 for all voltage levels7. Today an average customer will experience an outage once every three years, for a duration of approximately one and a half hours, equating to a reliability of supply of around 99.999%. 10 years ago the same customer would experience a fault once every two years for a duration closer to two hours on average.
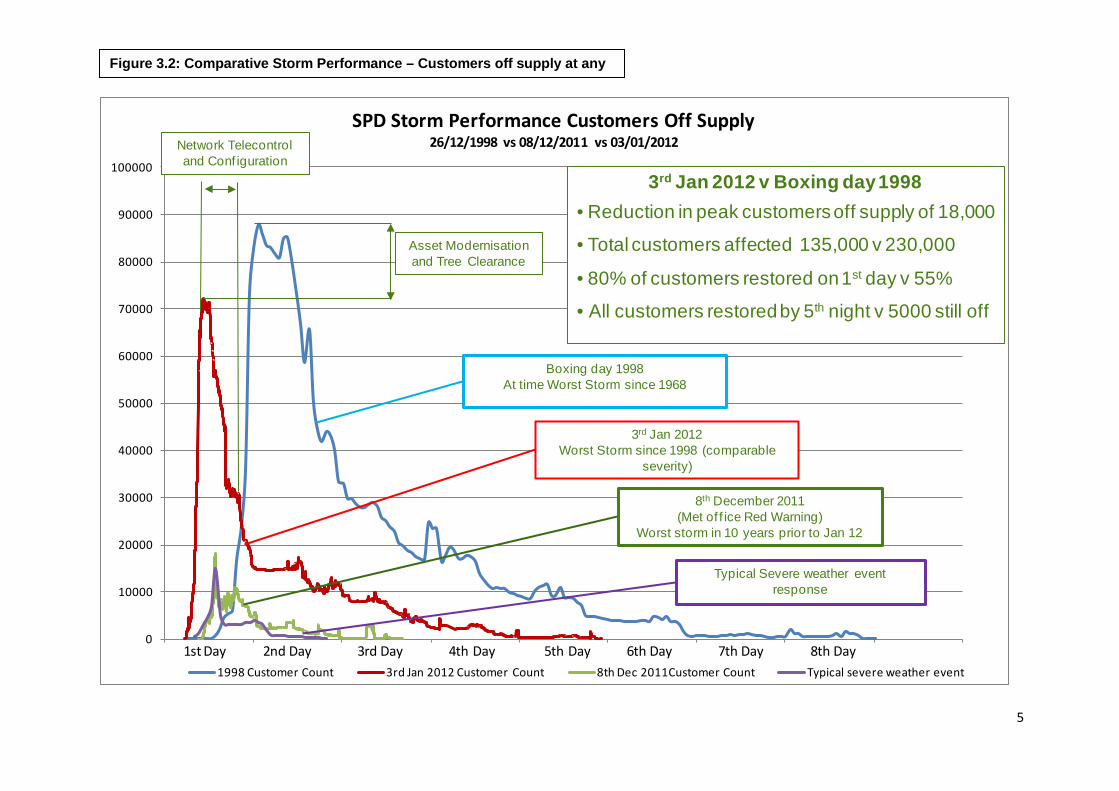
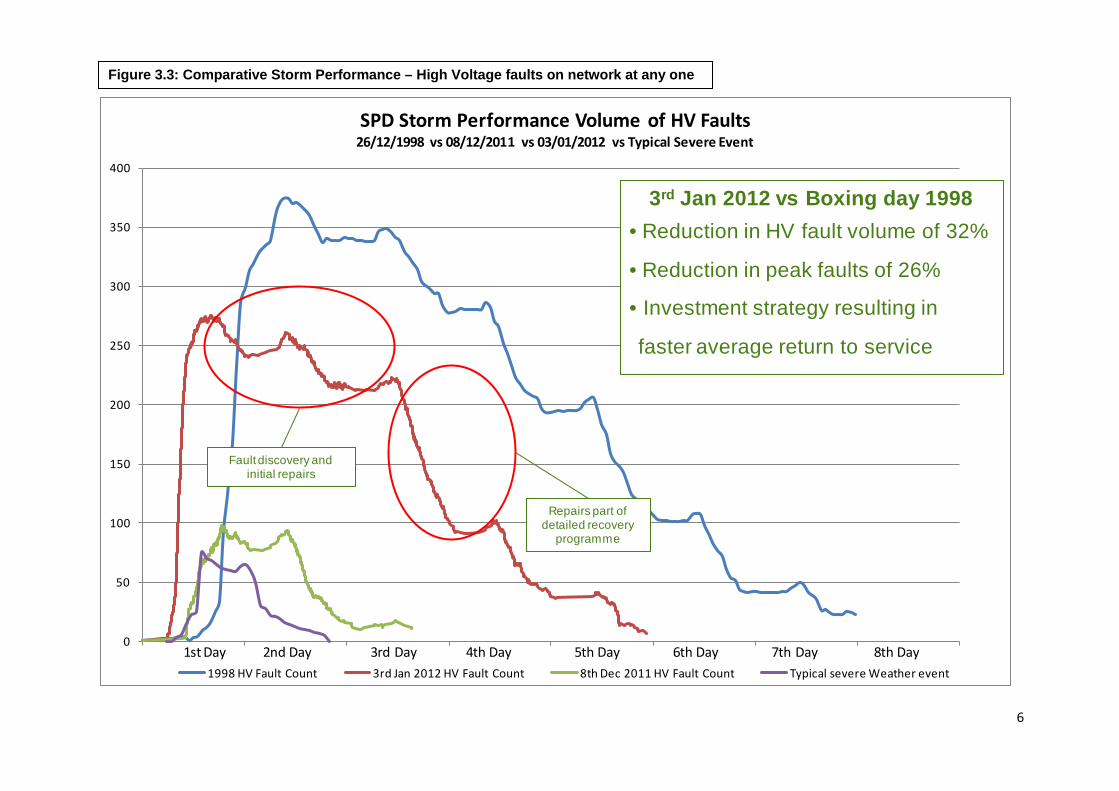
3.5 The charts in Figure 2.2 and 2.3 below detail the numbers of customers off supply and high voltage faults at any one time for historic storms.
6 Kema Limited – Scottishpower An assessment of HV overhead asset storm resilience – 19th Feb 2007 7 Includes all fault types, detailed system performance reports are available from Ofgem’s homepage
Kilmarnock
Gourock
Stirling
Perth
Edinburgh
Berwick Upon Tweed
Galashiels
Dumfries
Stranraer
Severe Weather Area
Figure 3.1: Severe weather areas identified by KEMA
5
0
10000
20000
30000
40000
50000
60000
70000
80000
90000
100000
SPD Storm Performance Customers Off Supply26/12/1998 vs 08/12/2011 vs 03/01/2012
1998 Customer Count 3rd Jan 2012 Customer Count 8th Dec 2011Customer Count Typical severe weather event
1st Day 2nd Day 3rd Day 4th Day 5th Day 6th Day 7th Day 8th Day
Asset Modernisation and Tree Clearance
Network Telecontroland Conf iguration
Boxing day 1998At time Worst Storm since 1968
3rd Jan 2012 Worst Storm since 1998 (comparable
severity)
8th December 2011 (Met of f ice Red Warning)
Worst storm in 10 years prior to Jan 12
3rd Jan 2012 v Boxing day 1998• Reduction in peak customers off supply of 18,000
• Total customers affected 135,000 v 230,000
• 80% of customers restored on 1st day v 55%
• All customers restored by 5th night v 5000 still off
Typical Severe weather event response
Figure 3.2: Comparative Storm Performance – Customers off supply at any
6
0
50
100
150
200
250
300
350
400
SPD Storm Performance Volume of HV Faults 26/12/1998 vs 08/12/2011 vs 03/01/2012 vs Typical Severe Event
1998 HV Fault Count 3rd Jan 2012 HV Fault Count 8th Dec 2011 HV Fault Count Typical severe Weather event
1st Day 2nd Day 3rd Day 4th Day 5th Day 6th Day 7th Day 8th Day
Fault discovery and initial repairs
Repairs part of detailed recovery
programme
3rd Jan 2012 vs Boxing day 1998• Reduction in HV fault volume of 32%
• Reduction in peak faults of 26%
• Investment strategy resulting in
faster average return to service
Figure 3.3: Comparative Storm Performance – High Voltage faults on network at any one
7
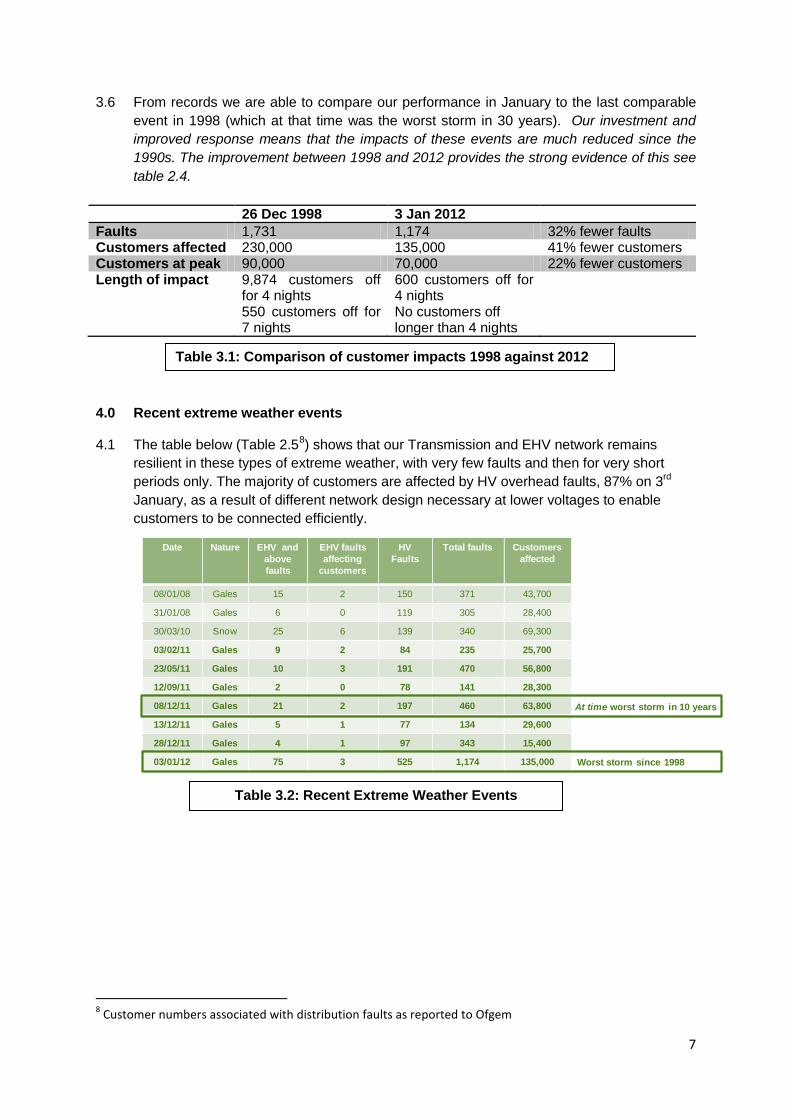
3.6 From records we are able to compare our performance in January to the last comparable event in 1998 (which at that time was the worst storm in 30 years). Our investment and improved response means that the impacts of these events are much reduced since the 1990s. The improvement between 1998 and 2012 provides the strong evidence of this see table 2.4.
4.0 Recent extreme weather events
4.1 The table below (Table 2.58) shows that our Transmission and EHV network remains resilient in these types of extreme weather, with very few faults and then for very short periods only. The majority of customers are affected by HV overhead faults, 87% on 3rd January, as a result of different network design necessary at lower voltages to enable customers to be connected efficiently.
8 Customer numbers associated with distribution faults as reported to Ofgem
Date Nature EHV and above faults
EHV faults affecting
customers
HV Faults
Total faults Customers affected
08/01/08 Gales 15 2 150 371 43,700
31/01/08 Gales 6 0 119 305 28,400
30/03/10 Snow 25 6 139 340 69,300
03/02/11 Gales 9 2 84 235 25,700
23/05/11 Gales 10 3 191 470 56,800
12/09/11 Gales 2 0 78 141 28,300
08/12/11 Gales 21 2 197 460 63,800
13/12/11 Gales 5 1 77 134 29,600
28/12/11 Gales 4 1 97 343 15,400
03/01/12 Gales 75 3 525 1,174 135,000 Worst storm since 1998
At time worst storm in 10 years
26 Dec 1998 3 Jan 2012 Faults 1,731 1,174 32% fewer faults Customers affected 230,000 135,000 41% fewer customers Customers at peak 90,000 70,000 22% fewer customers Length of impact 9,874 customers off
for 4 nights 550 customers off for 7 nights
600 customers off for 4 nights No customers off longer than 4 nights
Table 3.2: Recent Extreme Weather Events
Table 3.1: Comparison of customer impacts 1998 against 2012
8
5.0 Emergency Procedures and Severe Weather Event Management
5.1 In addition to our investment programmes SPEN has focussed on ensuring that when severe weather events occur, our emergency procedures deliver an effective response. Emergency procedures are initiated when severe weather is forecast and our key staff hold clearly defined emergency roles.
5.2 Our advance preparations for severe weather includes the activities listed below, each of which will be escalated dependent on the probability, severity and locality of the weather forecast:
a) Declare alert level as early warning of storms, b) Cancel planned work to maximise resource availability and network security, c) Increased resources, internal and contracting staff d) Head office Emergency Action Centre (EAC) co-ordinates efforts across company,
sourcing additional resources and communicating with external stakeholders, e) 6 Zone EACs to manage local repair efforts and reporting, f) We also perform storm simulations and post storm reviews to test processes and
practice
5.3 When an event occurs we look to optimise restoration of supplies as follows:
a) Network switching to restore supplies without repair work. b) Assess network damage and prioritise repair efforts to restore supplies to maximum
number of customers in minimum time. c) It is our experience that as storm recovery progresses the work to repair individual
faults typically does not reduce but the number of customers restored by each repair decreases.
5.4 Although the worst of the weather may have passed from the customers perception, under storm conditions it is also common that the weather conditions hinder our repair and restoration efforts for a number of reasons ranging from access to the fact that the weather conditions our staff are working in can continue to be challenging, especially when they have been working long shifts.
6.0 Management of the 3rd Jan 2012 event
6.1 Following the amber alert issued by the Met Office, SPEN mobilised 350 field staff and opened its central control Emergency Action Centre (EAC) at head office at 0830. At 08:14am the Met Office changed its weather warning from amber to red9. SPEN responded quickly and:
a) Increased mobilised field staff to 850 b) Brought in additional contractors & teams from network companies in England,
Wales and Ireland c) Local EACs across all zones were opened and were liaising with our central EAC
- Ayrshire, Central & Fife, Dumfries, Edinburgh & Borders, Glasgow, Lanarkshire d) Engaged non operational staff in damage assessment, e) Engaged Helicopters to carry out post storm assessment (2,500km of lines
patrolled)
9 Defined by Met office http://www.metoffice.gov.uk/weather/uk/advice/
9
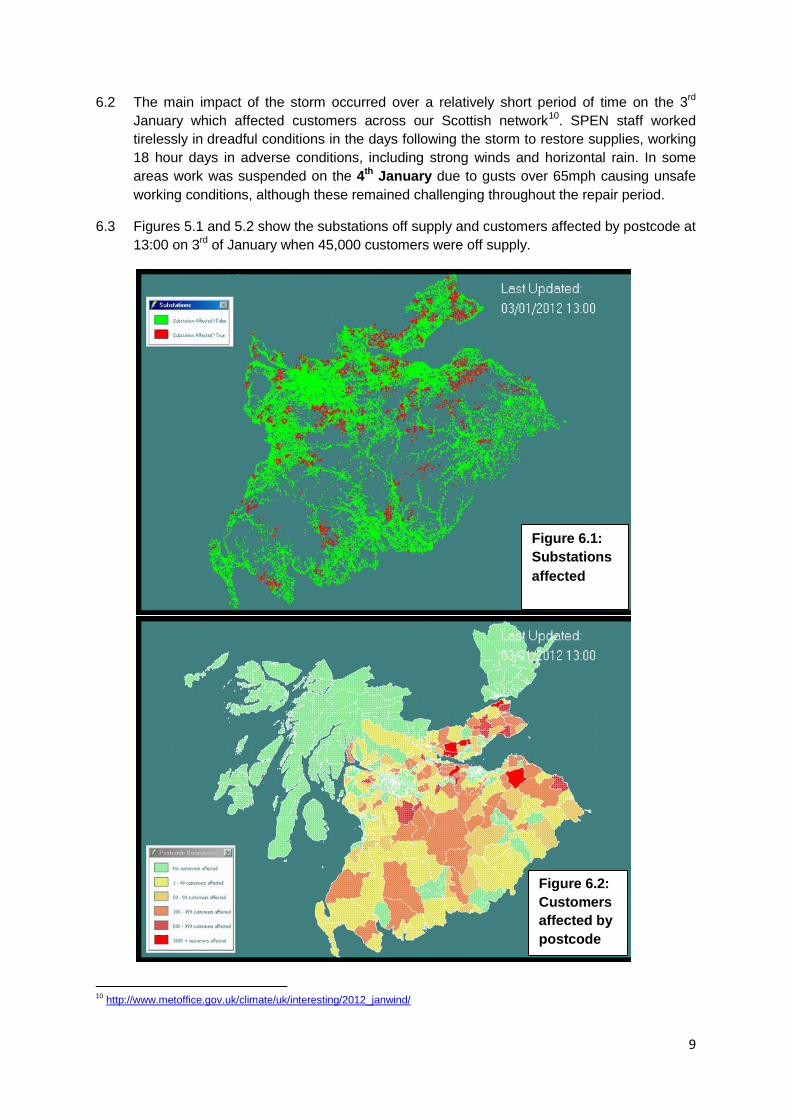
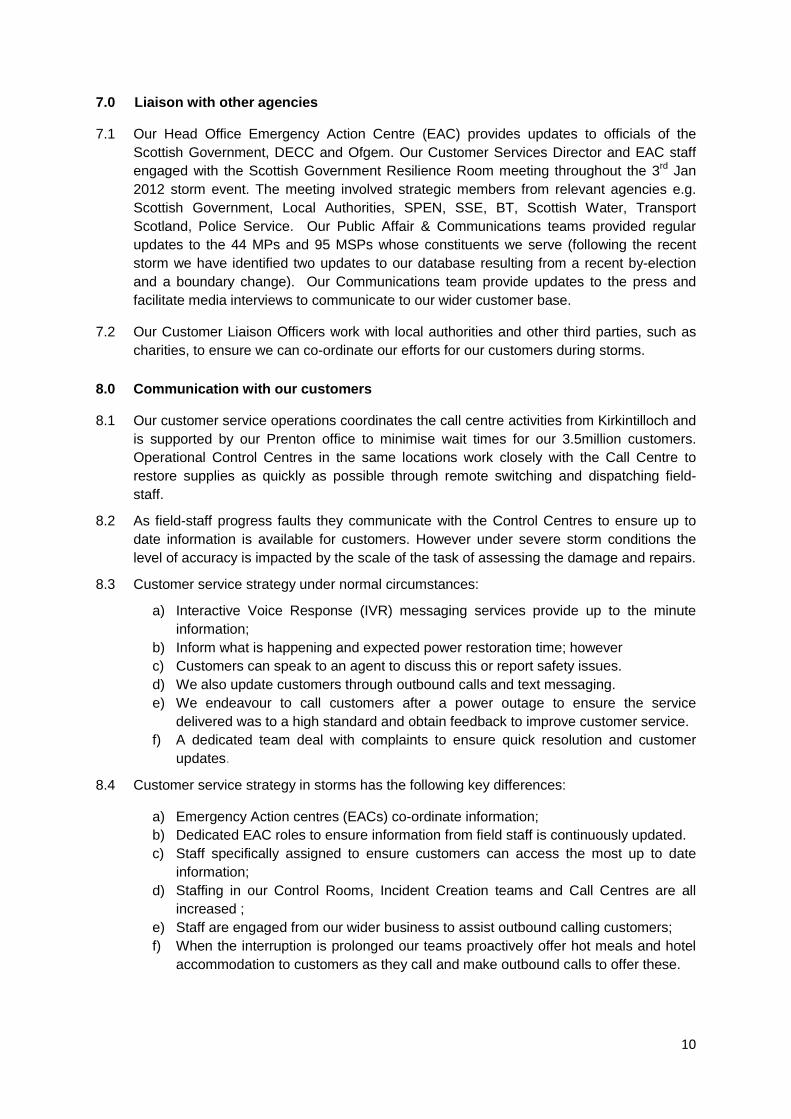
6.2 The main impact of the storm occurred over a relatively short period of time on the 3rd January which affected customers across our Scottish network10. SPEN staff worked tirelessly in dreadful conditions in the days following the storm to restore supplies, working 18 hour days in adverse conditions, including strong winds and horizontal rain. In some areas work was suspended on the 4th January due to gusts over 65mph causing unsafe working conditions, although these remained challenging throughout the repair period.
6.3 Figures 5.1 and 5.2 show the substations off supply and customers affected by postcode at 13:00 on 3rd of January when 45,000 customers were off supply.
10 http://www.metoffice.gov.uk/climate/uk/interesting/2012_janwind/
Figure 6.1: Substations affected
Figure 6.2: Customers affected by postcode
10
7.0 Liaison with other agencies
7.1 Our Head Office Emergency Action Centre (EAC) provides updates to officials of the Scottish Government, DECC and Ofgem. Our Customer Services Director and EAC staff engaged with the Scottish Government Resilience Room meeting throughout the 3rd Jan 2012 storm event. The meeting involved strategic members from relevant agencies e.g. Scottish Government, Local Authorities, SPEN, SSE, BT, Scottish Water, Transport Scotland, Police Service. Our Public Affair & Communications teams provided regular updates to the 44 MPs and 95 MSPs whose constituents we serve (following the recent storm we have identified two updates to our database resulting from a recent by-election and a boundary change). Our Communications team provide updates to the press and facilitate media interviews to communicate to our wider customer base.
7.2 Our Customer Liaison Officers work with local authorities and other third parties, such as charities, to ensure we can co-ordinate our efforts for our customers during storms.
8.0 Communication with our customers
8.1 Our customer service operations coordinates the call centre activities from Kirkintilloch and is supported by our Prenton office to minimise wait times for our 3.5million customers. Operational Control Centres in the same locations work closely with the Call Centre to restore supplies as quickly as possible through remote switching and dispatching field-staff.
8.2 As field-staff progress faults they communicate with the Control Centres to ensure up to date information is available for customers. However under severe storm conditions the level of accuracy is impacted by the scale of the task of assessing the damage and repairs.
8.3 Customer service strategy under normal circumstances:
a) Interactive Voice Response (IVR) messaging services provide up to the minute information;
b) Inform what is happening and expected power restoration time; however c) Customers can speak to an agent to discuss this or report safety issues. d) We also update customers through outbound calls and text messaging. e) We endeavour to call customers after a power outage to ensure the service
delivered was to a high standard and obtain feedback to improve customer service. f) A dedicated team deal with complaints to ensure quick resolution and customer
updates.
8.4 Customer service strategy in storms has the following key differences:
a) Emergency Action centres (EACs) co-ordinate information; b) Dedicated EAC roles to ensure information from field staff is continuously updated. c) Staff specifically assigned to ensure customers can access the most up to date
information; d) Staffing in our Control Rooms, Incident Creation teams and Call Centres are all
increased ; e) Staff are engaged from our wider business to assist outbound calling customers; f) When the interruption is prolonged our teams proactively offer hot meals and hotel
accommodation to customers as they call and make outbound calls to offer these.
11
8.5 Since April 2011 we have received:
a) 470,000 calls of which 89,000 (c.19%) were 3rd- 5th Jan b) Average 1,500 calls per day but 30,000 per day 3rd-5th Jan c) Normal call success rate 99.5% in average 6.2 seconds d) Recent storm 91.5% success rate in average 145 seconds
8.6 From Thursday 5th January we offered more than 2,000 households hotel accommodation and hot meals if they were going to remain off supply beyond 9pm, households expected to be on supply by 9pm were also offered payment for hot meals.
9.0 Services for Vulnerable Customers:
9.1 We have 126,000 vulnerable customers on our Priority Services Register. These customers are contacted as a priority, when affected by a supply interruption, in order to understand their specific needs and to arrange assistance for them if necessary. We proactively seek information from customers who contact our call centres to ensure we update and expand our register.
10.0 Customer Compensation
10.1 Every 5 years (moving to 8 years from 2015) our regulator Ofgem reviews our investment plans and provides revenue allowances to fund agreed levels of investment and operating costs, and puts in place mandatory compensation levels for customers. Ofgem conducts ‘willingness to pay’ research to inform these decisions. In December 2009 Ofgem concluded domestic customers should receive a £54 payment if they are off supply for more than 18 hours outside exceptional events11.
10.2 For Category 2 large exceptional events12, compensation is due to customers off supply for a continuous period of 48 hours.
10.3 Customers affected by the 3rd January storm will receive:
a) £27 for the first 48 hours, further £27 for each additional 12 hours, up to £216. b) In addition we are paying for hot meals and hotels for worst affected households. c) Additional compensation for vulnerable customers who required specialist care on
an individual basis.
10.4 The rules implemented by Ofgem require that customers claim this compensation, however we are contacting customers pro-actively to advise them of their entitlement and confirm payment details. We have set up a dedicated storm bureau to manage this process for our customers (see appendix 1)
11 Defined by Ofgem as causing > 8 times daily average number of high voltage faults 12 Defined by Ofgem as causing >13 times daily average number of high voltage faults
12
11.0 Conclusions
11.1 SPEN is committed to delivering significant levels of investment to accommodate the demands of all our connected customers.
11.2 We have been focussing on continuously improving our network resilience and operational response in the face of emergencies since the 1990s.
11.3 We take seriously our obligations to our customers and the difficulties they face during prolonged outages and seek to learn from every event that affects us. These ‘lessons learnt’ also feature in our price review submissions.
11.4 We welcome the opportunity to provide evidence to the Scottish Affairs Select Committee.
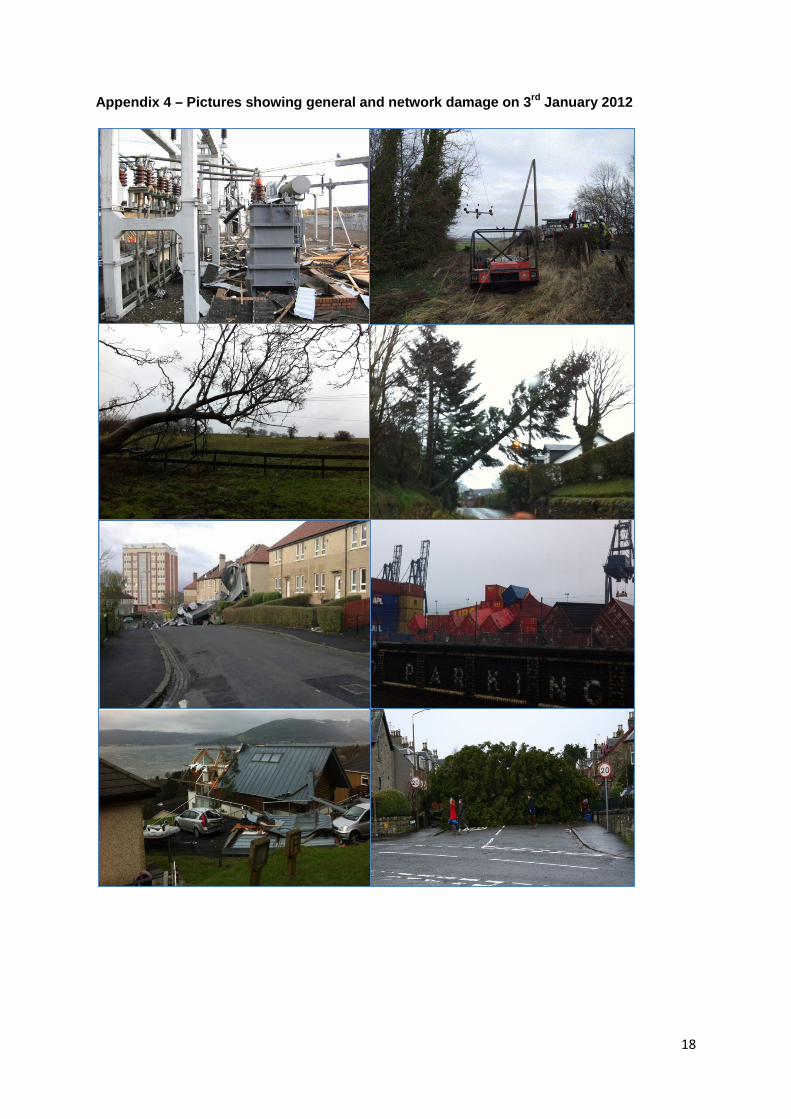
11.5 Finally, in appendix 4 we have included pictures of both the general damage the storm caused and pictures of the specific dame caused to our network.

13
Appendix Index:
Appendix 1 – Dedicated Storm bureau
Appendix 2 – Example of investment strategy
Appendix 3 – Tree cutting for Safety and Tree Clearance for Storm Resilience
Appendix 4 – Pictures showing general and network damage on 3rd January 2012

14
Appendix 1 – Dedicated Storm bureau
a) Storm bureau operational from 23rd January and all staff made aware. b) Updates on www.scottishpower.com and www.spenergynetworks.co.uk c) Storm Database created within customer contact tracking system to track and report
claims. d) Letters issued proactively (including follow up) to clarify details for cheque payment. e) Dedicated telephone number (0800 027 7016) set up for 3 weeks to deal with these
enquiries (Mon-Fri 0830-1645) f) Online claims form live until 7th April. With full instructions and dedicated mail box.
15
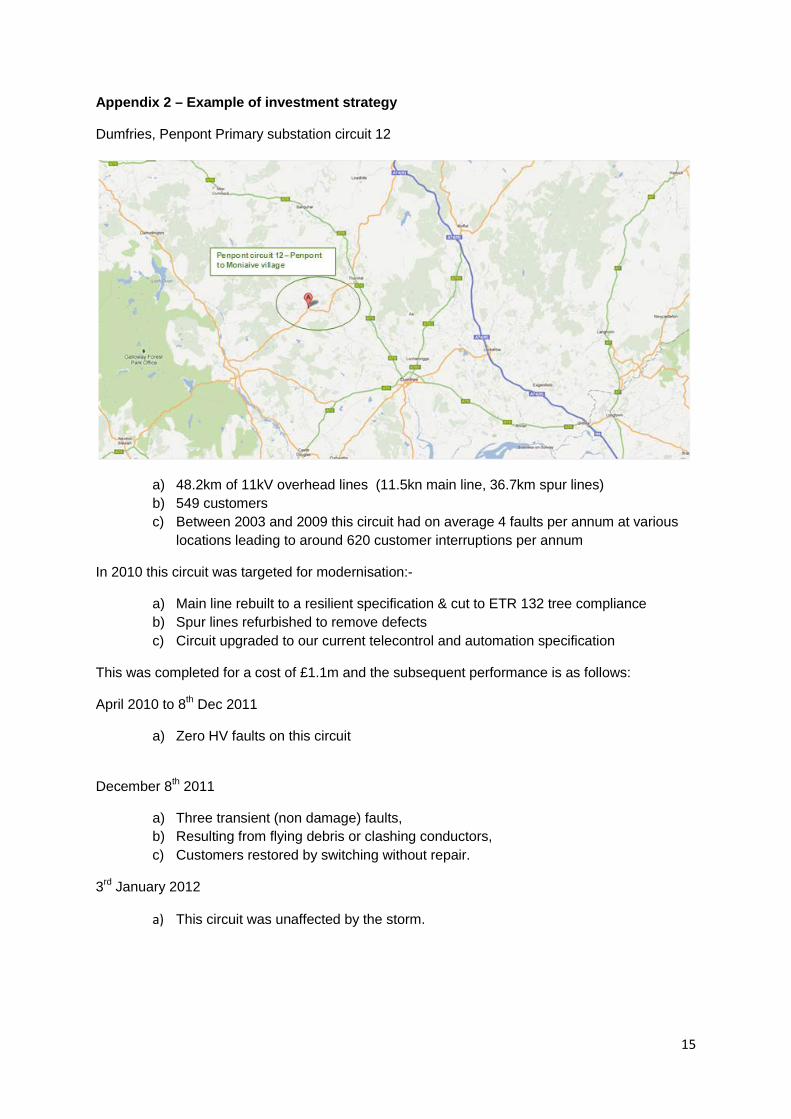
Appendix 2 – Example of investment strategy
Dumfries, Penpont Primary substation circuit 12
a) 48.2km of 11kV overhead lines (11.5kn main line, 36.7km spur lines) b) 549 customers c) Between 2003 and 2009 this circuit had on average 4 faults per annum at various
locations leading to around 620 customer interruptions per annum
In 2010 this circuit was targeted for modernisation:-
a) Main line rebuilt to a resilient specification & cut to ETR 132 tree compliance b) Spur lines refurbished to remove defects c) Circuit upgraded to our current telecontrol and automation specification
This was completed for a cost of £1.1m and the subsequent performance is as follows:
April 2010 to 8th Dec 2011
a) Zero HV faults on this circuit
December 8th 2011
a) Three transient (non damage) faults, b) Resulting from flying debris or clashing conductors, c) Customers restored by switching without repair.
3rd January 2012
a) This circuit was unaffected by the storm.
16
Appendix 3 – Tree cutting for Safety and Tree Clearance for Storm Resilience
SPEN carries out tree cutting activities for two different purposes which are laid down in the ELECTRICITY SAFETY, QUALITY AND CONTINUITY (AMENDMENT) REGULATIONS 2006:
• Tree cutting for safety • Tree clearance for network resilience
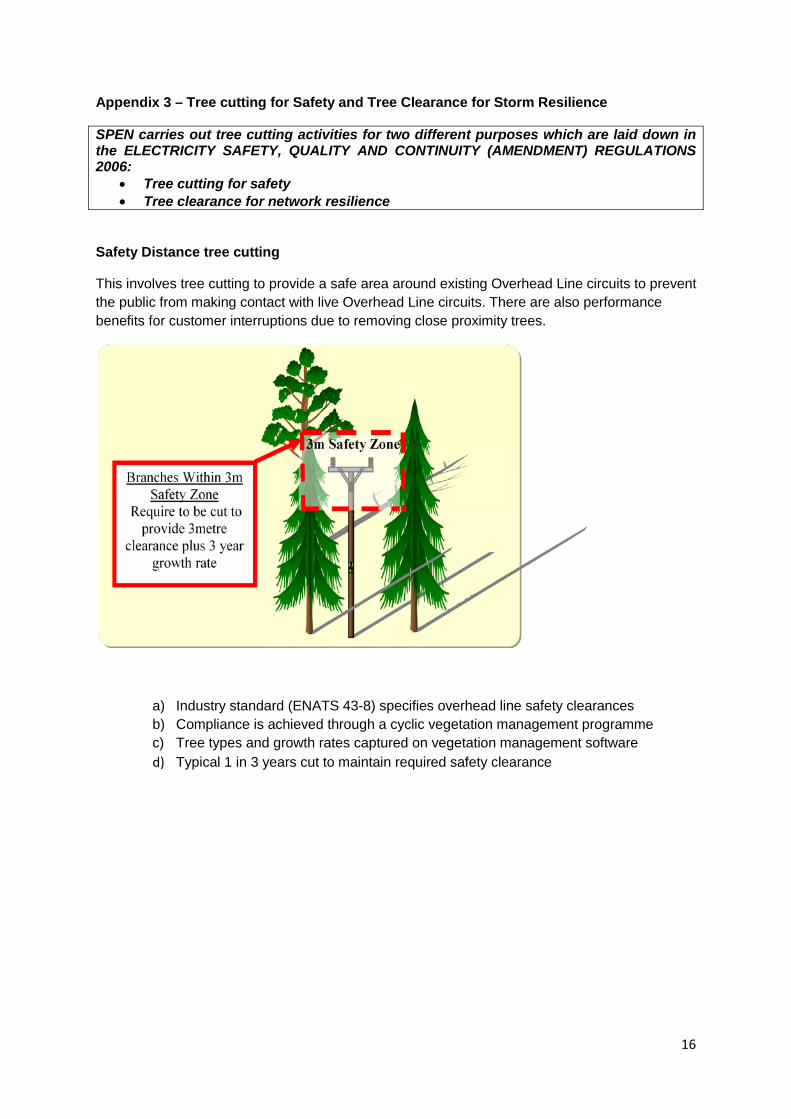
Safety Distance tree cutting
This involves tree cutting to provide a safe area around existing Overhead Line circuits to prevent the public from making contact with live Overhead Line circuits. There are also performance benefits for customer interruptions due to removing close proximity trees.
a) Industry standard (ENATS 43-8) specifies overhead line safety clearances b) Compliance is achieved through a cyclic vegetation management programme c) Tree types and growth rates captured on vegetation management software d) Typical 1 in 3 years cut to maintain required safety clearance
17
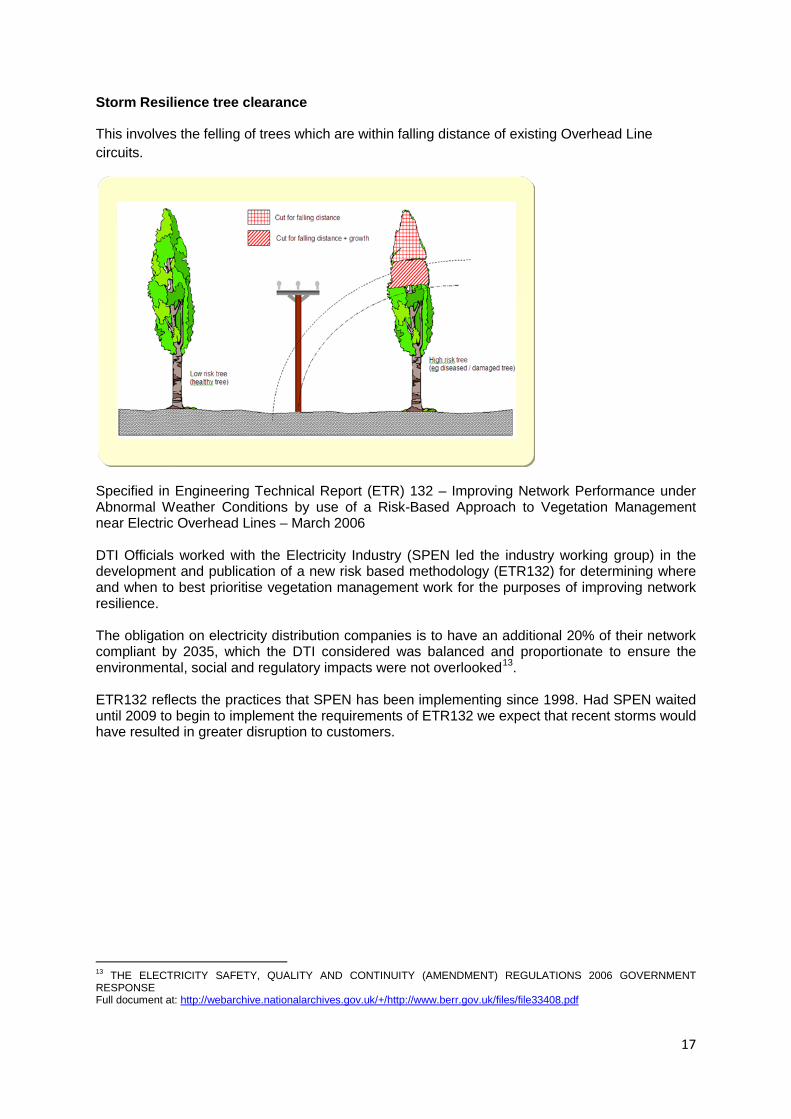
Storm Resilience tree clearance
This involves the felling of trees which are within falling distance of existing Overhead Line circuits.
Specified in Engineering Technical Report (ETR) 132 – Improving Network Performance under Abnormal Weather Conditions by use of a Risk-Based Approach to Vegetation Management near Electric Overhead Lines – March 2006 DTI Officials worked with the Electricity Industry (SPEN led the industry working group) in the development and publication of a new risk based methodology (ETR132) for determining where and when to best prioritise vegetation management work for the purposes of improving network resilience. The obligation on electricity distribution companies is to have an additional 20% of their network compliant by 2035, which the DTI considered was balanced and proportionate to ensure the environmental, social and regulatory impacts were not overlooked13. ETR132 reflects the practices that SPEN has been implementing since 1998. Had SPEN waited until 2009 to begin to implement the requirements of ETR132 we expect that recent storms would have resulted in greater disruption to customers.
13 THE ELECTRICITY SAFETY, QUALITY AND CONTINUITY (AMENDMENT) REGULATIONS 2006 GOVERNMENT RESPONSE Full document at: http://webarchive.nationalarchives.gov.uk/+/http://www.berr.gov.uk/files/file33408.pdf
18
Appendix 4 – Pictures showing general and network damage on 3rd January 2012