spa result update cdi m jain irrigation ai gst...
TRANSCRIPT
Edelweiss Research is also available on www.edelresearch.com, Bloomberg EDEL <GO>, Thomson First Call, Reuters and Factset.
Edelweiss Securities Limited
Jain Irrigation (JISL) reported muted Q1FY18 numbers with revenue growing only 1% YoY to INR 16.8bn as all segments reported flat growth or declined impacted by GST-related destocking and deferment. While standalone hi-tech agri revenue grew only 4% YoY to INR4.7bn, consolidated plastic division declined 5% YoY and agro processing declined 12% YoY on lower pick up by major customers like Coke India. EBITDA margin was flat at 14%. On the debt front, excluding the US acquisition (INR3.2bn), net debt fell by INR0.7bn YoY. While management has maintained guidance, we prune FY18 EBITDA growth estimate to 20% (JISL’s guidance: 25% YoY growth) and revise FY18/19E EPS down 9/4% to factor in challenges in H1FY18 due to GST in all of the company’s major segments. Maintain ‘BUY’ with revised TP of INR137 (INR142 earlier).
Q1FY18: Key highlights
1) Hi-tech agri input segment: Standalone revenue grew only 4.4% YoY to INR4.7bn
spearheaded by tissue culture (up 30% YoY) and exports (up 103% YoY) driven by
shipments to Africa. However, project business was impacted by GST (down 47% YoY).
The segment’s consolidated revenue grew 12.4% YoY. The recent acquisition in US also
contributed ~INR1.1bn (USD17.8mn). Excluding this, subsidiary revenue fell 12% YoY;,
impacted by currency and order execution delay 2) Agro processing division: Revenue
declined ~12.3% because of lower pick up by Coke India due to proposed GST rollout
and also due to INR appreciation; 3) Plastic division: Consolidated revenue declined
~4.8% primarily on account of sluggish demand (reduction in inventories with dealers)
due to proposed GST rollout in India. However, plastic sheet business grew ~16.8%,
predominantly in the US market; 4) net debt increased by ~INR4.5bn QoQ on account
of the US acquisition (INR3.2bn) and seasonal requirement in agro processing business.
Excluding the impact of the acquisition, net debt fell by INR0.7bn YoY.
Outlook and valuations: GST dents performance; maintain ‘BUY’
While management has maintained its guidance despite muted Q1FY18 performance,
we have lowered our FY18E EBITDA growth to 20% and revised FY18/19E EPS down
9/4% to factor in challenges in H1FY18 due to GST in all of the company’s major
segments. We value JISL based on 15x FY19E EPS, yielding revised target price of
INR137 (INR142 earlier). We maintain ‘BUY’.
RESULT UPDATE
JAIN IRRIGATION GST dampener; guidance maintained
EDELWEISS RATINGS
Absolute Rating BUY
Investment Characteristics Growth
MARKET DATA (R: JAIR.BO, B: JI IN)
CMP : INR 95
Target Price : INR 137
52-week range (INR) : 120 / 76
Share in issue (mn) : 460.2
M cap (INR bn/USD mn) : 45 / 700
Avg. Daily Vol. BSE/NSE (‘000) : 6,082.8
SHARE HOLDING PATTERN (%)
Current Q4FY17 Q3FY17
Promoters *
30.7 30.7 30.7
MF's, FI's & BKs 7.3 5.9 5.4
FII's 41.5 42.0 42.7
Others 20.5 21.4 21.3
* Promoters pledged shares (% of share in issue)
: 2.9
PRICE PERFORMANCE (%)
BSE Midcap Index
Stock Stock over
Index
1 month 0.6 (10.1) (10.7)
3 months 1.6 (4.1) (5.7)
12 months 19.8 21.7 1.9
Rohan Gupta +91 22 4040 7416
Nihal Mahesh Jham +91 22 6623 3352
In
dia
Mid
cap
s
India Equity Research| Midcap Agri
August 16, 2017
Financials (Consolidated) (INR mn)
Year to March Q1FY18 Q1FY17 % change Q4FY17 % change FY16 FY17 FY18E
Net revenues 16,812 16,601 1.3 22,316 (24.7) 63,222 67,698 81,999
EBITDA 2,343 2,377 (1.4) 3,452 (32.1) 8,183 9,402 11,320
Adjusted PAT 443 585 (24.2) 771 (42.5) 484 1,695 3,671
Adj. EPS (INR) 0.9 1.2 (24.7) 1.6 (42.5) 0.9 3.1 6.3
Diluted P/E (x) 32.1 14.4 10.4
EV/EBITDA (x) 8.5 7.0 5.8
ROAE (%) 4.2 9.1 10.9
Midcap Agri
2 Edelweiss Securities Limited
Q1FY18 Concall highlights:
Q1FY18:
Higher depreciation on revaluation on assets due to IND-AS. Employee expenses were
higher due to increments last year, which were from July of last year.
In other expenses, freight jumped by INR70mn, repairs by INR40mn, dealer commission
by INR60mn and debtor provisioning by INR60mn
Domestic MIS sales were good in Rajasthan and Gujarat, but Maharashtra, AP and
Karnataka were muted. Expects to recover this by H2FY18.
GST:
Pipe 18% (neutral).
Agro processing 12% (neutral).
GST on MIS has come in higher than before at 18%. While 12% will be neutral rate, JISL
and industry are trying for 5-6% rate. This will lead to a pricing increase as of now.
MIS:
Sugarcane opportunity:
o Positive impact of sugar business will flow only come from Q3/Q4 once sugar
planting starts.
o JISL has majority market share in Maharashtra.
o It also has good relations with the farming community. This is likely to drive the
retail business in Maharashtra.
o JISL does not need capacity addition to service this demand.
o If these installations starts by late October-early November, it could be a INR2-3bn
opportunity.
o Typically, sugarcane has been 1/3rd of the retail MIS business.
o In terms of working capital investment, the model for this will be similar to cash
and carry.
o This business in a short time requires significant capacity. Also, needs good
relations with sugarcane inspectors, factory etc. Only 2-3 companies have been
able to execute this earlier.
Exports to Tanzania are part of a large project there. Even in ensuing quarters, JISL
expects exports to remain strong.
International MIS:
o 2 businesses, one in Israel and one in US.
o During Q1FY18, Israel currency became strong versus a basket of currencies.
o This led to 2.0-2.5% currency impact.
o This was a reasonably ordinary quarter for the international MIS business.
o For the balance year, JISL expects the currency impact to wane. Also, some
projects will hit the revenue booking threshold.
Jain Irrigation
3 Edelweiss Securities Limited
o Is building 10% organic revenue growth in the exports business. The US acquisition
will be over and above that.
Guided range of EBITDA margin in MIS is 20-22%.
Debt:
Continues to focus on balance sheet. Looking at debt: EBITDA of 3x by end of this year.
Most of the FCF generation happens only in Q2.
Currently, the company has adequate level of USD earning for its USD related debt
liabilities.
In Q4FY17, company had positive cash flow post WC. In Q1FY18, cash flow generation
will be negative.
Expects interest cost/rate to come down by Q3FY18.
Food processing business:
Export growth was strong, but domestic business was impacted by GST.
Some orders have been postponed. Therefore, JISL remains confident of 20% revenue
growth.
Onion growth was sharp, but overall food was muted.
The company is looking at investing in spices. It will start contributing from Q4FY18.
JISL is planning enter the orange juice concentrate market. Will start investment from
H2FY18.
On the retail front, has more than 100,000 retail stores, distributors in each state, has
tie-ups with 8 large modern retail formats.
Global level EBITDA in the food business has been around 13%.
Others:
Solar business
o Solar water pumps used in agriculture. Captured in MIS business. It has been doing
well in this segment. JISL is looking at 40% growth.
o There is a possibility in the future of this business going retail as prices are coming
down and farmers may be able to afford.
o JISL is not focusing on solar panels and street lights.
Guidance:
Looking at 25% EBITDA growth in FY18.
o MIS: >60%, followed by food & pipe business.
Looking at capex of INR3bn. IN1bn is maintenance capex. This excludes the acquisition
payment.
Midcap Agri
4 Edelweiss Securities Limited
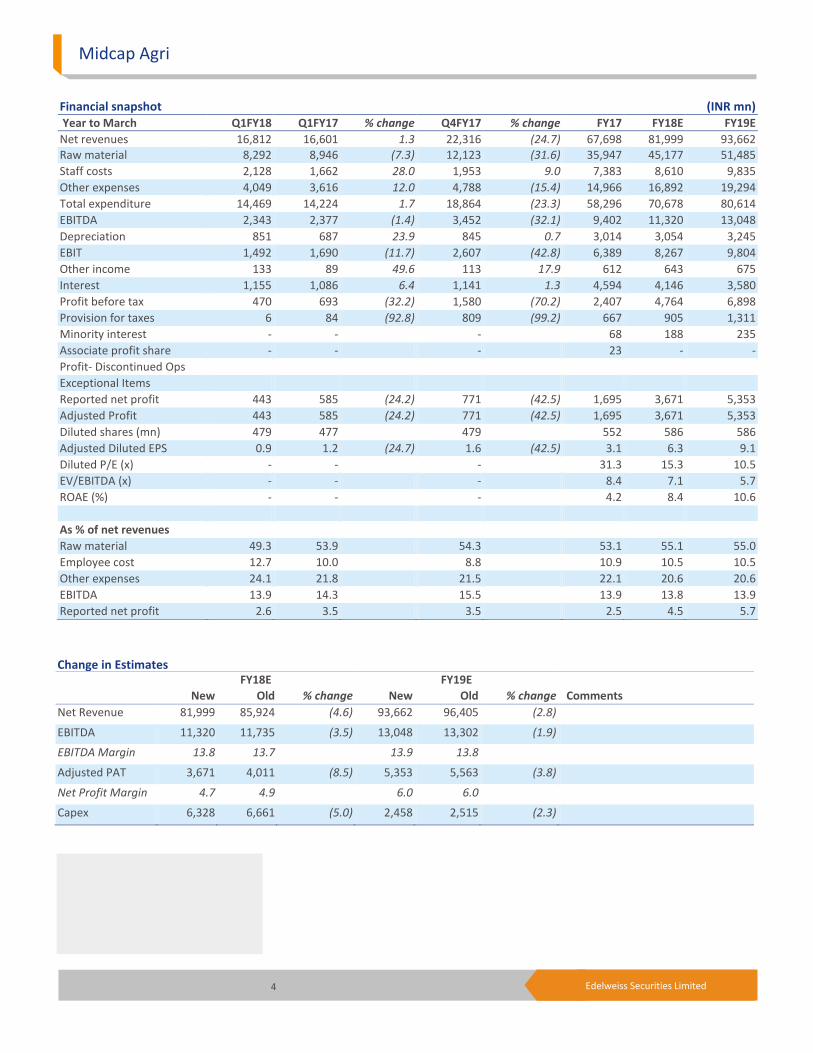
Financial snapshot (INR mn) Year to March Q1FY18 Q1FY17 % change Q4FY17 % change FY17 FY18E FY19E
Net revenues 16,812 16,601 1.3 22,316 (24.7) 67,698 81,999 93,662 Raw material 8,292 8,946 (7.3) 12,123 (31.6) 35,947 45,177 51,485
Staff costs 2,128 1,662 28.0 1,953 9.0 7,383 8,610 9,835
Other expenses 4,049 3,616 12.0 4,788 (15.4) 14,966 16,892 19,294
Total expenditure 14,469 14,224 1.7 18,864 (23.3) 58,296 70,678 80,614
EBITDA 2,343 2,377 (1.4) 3,452 (32.1) 9,402 11,320 13,048
Depreciation 851 687 23.9 845 0.7 3,014 3,054 3,245
EBIT 1,492 1,690 (11.7) 2,607 (42.8) 6,389 8,267 9,804
Other income 133 89 49.6 113 17.9 612 643 675
Interest 1,155 1,086 6.4 1,141 1.3 4,594 4,146 3,580
Profit before tax 470 693 (32.2) 1,580 (70.2) 2,407 4,764 6,898
Provision for taxes 6 84 (92.8) 809 (99.2) 667 905 1,311
Minority interest - - - 68 188 235
Associate profit share - - - 23 - -
Profit- Discontinued Ops
Exceptional Items
Reported net profit 443 585 (24.2) 771 (42.5) 1,695 3,671 5,353
Adjusted Profit 443 585 (24.2) 771 (42.5) 1,695 3,671 5,353
Diluted shares (mn) 479 477 479 552 586 586
Adjusted Diluted EPS 0.9 1.2 (24.7) 1.6 (42.5) 3.1 6.3 9.1
Diluted P/E (x) - - - 31.3 15.3 10.5
EV/EBITDA (x) - - - 8.4 7.1 5.7
ROAE (%) - - - 4.2 8.4 10.6
As % of net revenues
Raw material 49.3 53.9 54.3 53.1 55.1 55.0
Employee cost 12.7 10.0 8.8 10.9 10.5 10.5
Other expenses 24.1 21.8 21.5 22.1 20.6 20.6
EBITDA 13.9 14.3 15.5 13.9 13.8 13.9
Reported net profit 2.6 3.5 3.5 2.5 4.5 5.7
Change in Estimates
FY18E FY19E
New Old % change New Old % change Comments
Net Revenue 81,999 85,924 (4.6) 93,662 96,405 (2.8)
EBITDA 11,320 11,735 (3.5) 13,048 13,302 (1.9)
EBITDA Margin 13.8 13.7 13.9 13.8
Adjusted PAT 3,671 4,011 (8.5) 5,353 5,563 (3.8)
Net Profit Margin 4.7 4.9 6.0 6.0
Capex 6,328 6,661 (5.0) 2,458 2,515 (2.3)
Jain Irrigation
5 Edelweiss Securities Limited
Company Description
Established in 1986, Jain Irrigation Systems (JISL) is currently the world’s second largest and
India’s largest micro irrigation company. It has four major business divisions—micro
irrigation systems (MIS), piping systems, agro processing, and plastic sheets. Apart from
these, it also derives a minor portion of revenues from tissue culture, hybrid & grafted
plants, and solar devices. In FY12, at a consolidated level, MIS revenue share was at 54%,
piping products at 20%, agro processed products at 17%, plastic sheets at 4% and others at
5%. JISL has a global presence in more than 100 countries with a robust dealer and
distribution network; it has 24 plants and employs over 6,000 people. JISL has been named
by Standard & Poor’s in May 2007 as one of the eight Indian companies expected to emerge
as challengers to the world’s leading companies.
Investment Theme
India is likely to have an an opportunity of ~INR 450 bn under micro irrigation over the next
six to seven years. JISL stands to gain the most, being the market leader in this space.
Standalone sales of JISL’s MIS segment have posted a CAGR of 56% during 2005-12. While
JISL is currently sacrificing some growth to rationalise their high receivables in MIS, we
expect JISL to get multiple re-rating from the point when it shows improvement in working
capital cycle by lowering the receivables and commencing the proposed NBFC.
Key Risks
Withdrawal of subsidies for micro irrigation is a key risk that could cause JISL’s growth rates
to slow down drastically.
Poor monsoon, seasonality and cyclical nature of agriculture could impact the company’s
agro-processing division by hitting the availability as well as prices of agro commodities.
Though poor monsoon is unlikely to impact MIS in the short term, in case of recurring
monsoon failure, the segment’s growth may slow down.
Competition from the unorganized sector as well as supply from China may impact the MIS
business. However, only from the context of manufacturing MIS systems, it is a low entry
barrier business, and competencies needed to manage the inherent issues of weather,
dealing with government, small holdings by Indian farmers etc., limit the scope of most
players in the Indian MIS market.
Most of JISL’s activities are working capital intensive, which may constrain the company
from achieving targeted growth.
USD/INR volatility may impact export revenues as well as margins. As the company is having
high D/E, interest rate tightening may impact profitability.
Midcap Agri
6 Edelweiss Securities Limited
Financial Statements
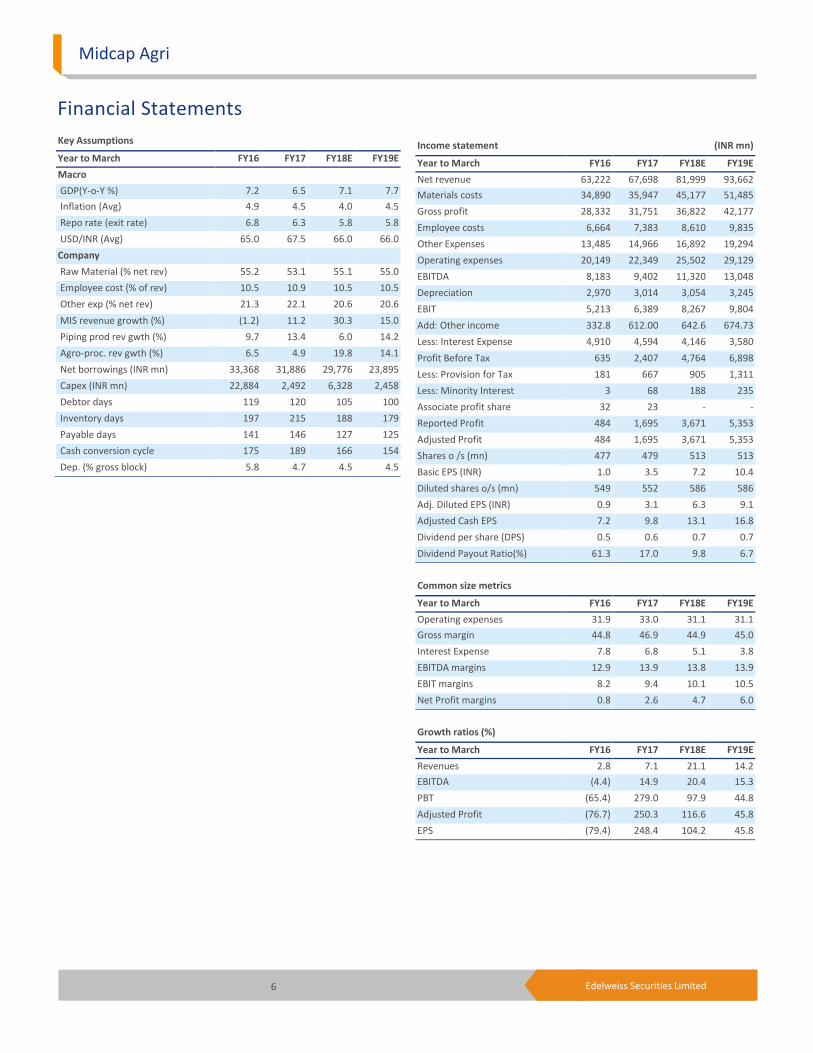
Income statement (INR mn)
Year to March FY16 FY17 FY18E FY19E
Net revenue 63,222 67,698 81,999 93,662
Materials costs 34,890 35,947 45,177 51,485
Gross profit 28,332 31,751 36,822 42,177
Employee costs 6,664 7,383 8,610 9,835
Other Expenses 13,485 14,966 16,892 19,294
Operating expenses 20,149 22,349 25,502 29,129
EBITDA 8,183 9,402 11,320 13,048
Depreciation 2,970 3,014 3,054 3,245
EBIT 5,213 6,389 8,267 9,804
Add: Other income 332.8 612.00 642.6 674.73
Less: Interest Expense 4,910 4,594 4,146 3,580
Profit Before Tax 635 2,407 4,764 6,898
Less: Provision for Tax 181 667 905 1,311
Less: Minority Interest 3 68 188 235
Associate profit share 32 23 - -
Reported Profit 484 1,695 3,671 5,353
Adjusted Profit 484 1,695 3,671 5,353
Shares o /s (mn) 477 479 513 513
Basic EPS (INR) 1.0 3.5 7.2 10.4
Diluted shares o/s (mn) 549 552 586 586
Adj. Diluted EPS (INR) 0.9 3.1 6.3 9.1
Adjusted Cash EPS 7.2 9.8 13.1 16.8
Dividend per share (DPS) 0.5 0.6 0.7 0.7
Dividend Payout Ratio(%) 61.3 17.0 9.8 6.7
Common size metrics
Year to March FY16 FY17 FY18E FY19E
Operating expenses 31.9 33.0 31.1 31.1
Gross margin 44.8 46.9 44.9 45.0
Interest Expense 7.8 6.8 5.1 3.8
EBITDA margins 12.9 13.9 13.8 13.9
EBIT margins 8.2 9.4 10.1 10.5
Net Profit margins 0.8 2.6 4.7 6.0
Growth ratios (%)
Year to March FY16 FY17 FY18E FY19E
Revenues 2.8 7.1 21.1 14.2
EBITDA (4.4) 14.9 20.4 15.3
PBT (65.4) 279.0 97.9 44.8
Adjusted Profit (76.7) 250.3 116.6 45.8
EPS (79.4) 248.4 104.2 45.8
Key Assumptions
Year to March FY16 FY17 FY18E FY19E
Macro
GDP(Y-o-Y %) 7.2 6.5 7.1 7.7
Inflation (Avg) 4.9 4.5 4.0 4.5
Repo rate (exit rate) 6.8 6.3 5.8 5.8
USD/INR (Avg) 65.0 67.5 66.0 66.0
Company
Raw Material (% net rev) 55.2 53.1 55.1 55.0
Employee cost (% of rev) 10.5 10.9 10.5 10.5
Other exp (% net rev) 21.3 22.1 20.6 20.6
MIS revenue growth (%) (1.2) 11.2 30.3 15.0
Piping prod rev gwth (%) 9.7 13.4 6.0 14.2
Agro-proc. rev gwth (%) 6.5 4.9 19.8 14.1
Net borrowings (INR mn) 33,368 31,886 29,776 23,895
Capex (INR mn) 22,884 2,492 6,328 2,458
Debtor days 119 120 105 100
Inventory days 197 215 188 179
Payable days 141 146 127 125
Cash conversion cycle 175 189 166 154
Dep. (% gross block) 5.8 4.7 4.5 4.5
Jain Irrigation
7 Edelweiss Securities Limited
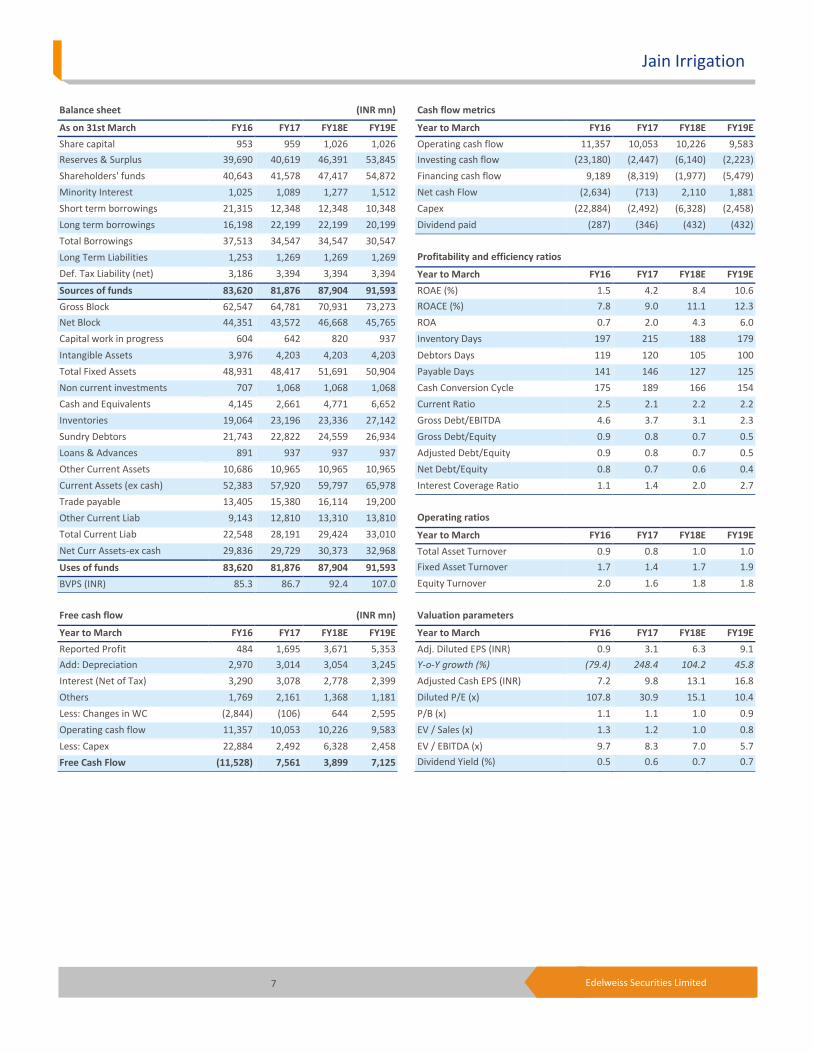
Cash flow metrics
Year to March FY16 FY17 FY18E FY19E
Operating cash flow 11,357 10,053 10,226 9,583
Investing cash flow (23,180) (2,447) (6,140) (2,223)
Financing cash flow 9,189 (8,319) (1,977) (5,479)
Net cash Flow (2,634) (713) 2,110 1,881
Capex (22,884) (2,492) (6,328) (2,458)
Dividend paid (287) (346) (432) (432)
Profitability and efficiency ratios
Year to March FY16 FY17 FY18E FY19E
ROAE (%) 1.5 4.2 8.4 10.6
ROACE (%) 7.8 9.0 11.1 12.3
ROA 0.7 2.0 4.3 6.0
Inventory Days 197 215 188 179
Debtors Days 119 120 105 100
Payable Days 141 146 127 125
Cash Conversion Cycle 175 189 166 154
Current Ratio 2.5 2.1 2.2 2.2
Gross Debt/EBITDA 4.6 3.7 3.1 2.3
Gross Debt/Equity 0.9 0.8 0.7 0.5
Adjusted Debt/Equity 0.9 0.8 0.7 0.5
Net Debt/Equity 0.8 0.7 0.6 0.4
Interest Coverage Ratio 1.1 1.4 2.0 2.7
Operating ratios
Year to March FY16 FY17 FY18E FY19E
Total Asset Turnover 0.9 0.8 1.0 1.0
Fixed Asset Turnover 1.7 1.4 1.7 1.9
Equity Turnover 2.0 1.6 1.8 1.8
Valuation parameters
Year to March FY16 FY17 FY18E FY19E
Adj. Diluted EPS (INR) 0.9 3.1 6.3 9.1
Y-o-Y growth (%) (79.4) 248.4 104.2 45.8
Adjusted Cash EPS (INR) 7.2 9.8 13.1 16.8
Diluted P/E (x) 107.8 30.9 15.1 10.4
P/B (x) 1.1 1.1 1.0 0.9
EV / Sales (x) 1.3 1.2 1.0 0.8
EV / EBITDA (x) 9.7 8.3 7.0 5.7
Dividend Yield (%) 0.5 0.6 0.7 0.7
Balance sheet (INR mn)
As on 31st March FY16 FY17 FY18E FY19E
Share capital 953 959 1,026 1,026
Reserves & Surplus 39,690 40,619 46,391 53,845
Shareholders' funds 40,643 41,578 47,417 54,872
Minority Interest 1,025 1,089 1,277 1,512
Short term borrowings 21,315 12,348 12,348 10,348
Long term borrowings 16,198 22,199 22,199 20,199
Total Borrowings 37,513 34,547 34,547 30,547
Long Term Liabilities 1,253 1,269 1,269 1,269
Def. Tax Liability (net) 3,186 3,394 3,394 3,394
Sources of funds 83,620 81,876 87,904 91,593
Gross Block 62,547 64,781 70,931 73,273
Net Block 44,351 43,572 46,668 45,765
Capital work in progress 604 642 820 937
Intangible Assets 3,976 4,203 4,203 4,203
Total Fixed Assets 48,931 48,417 51,691 50,904
Non current investments 707 1,068 1,068 1,068
Cash and Equivalents 4,145 2,661 4,771 6,652
Inventories 19,064 23,196 23,336 27,142
Sundry Debtors 21,743 22,822 24,559 26,934
Loans & Advances 891 937 937 937
Other Current Assets 10,686 10,965 10,965 10,965
Current Assets (ex cash) 52,383 57,920 59,797 65,978
Trade payable 13,405 15,380 16,114 19,200
Other Current Liab 9,143 12,810 13,310 13,810
Total Current Liab 22,548 28,191 29,424 33,010
Net Curr Assets-ex cash 29,836 29,729 30,373 32,968
Uses of funds 83,620 81,876 87,904 91,593
BVPS (INR) 85.3 86.7 92.4 107.0
Free cash flow (INR mn)
Year to March FY16 FY17 FY18E FY19E
Reported Profit 484 1,695 3,671 5,353
Add: Depreciation 2,970 3,014 3,054 3,245
Interest (Net of Tax) 3,290 3,078 2,778 2,399
Others 1,769 2,161 1,368 1,181
Less: Changes in WC (2,844) (106) 644 2,595
Operating cash flow 11,357 10,053 10,226 9,583
Less: Capex 22,884 2,492 6,328 2,458
Free Cash Flow (11,528) 7,561 3,899 7,125
Midcap Agri
8 Edelweiss Securities Limited
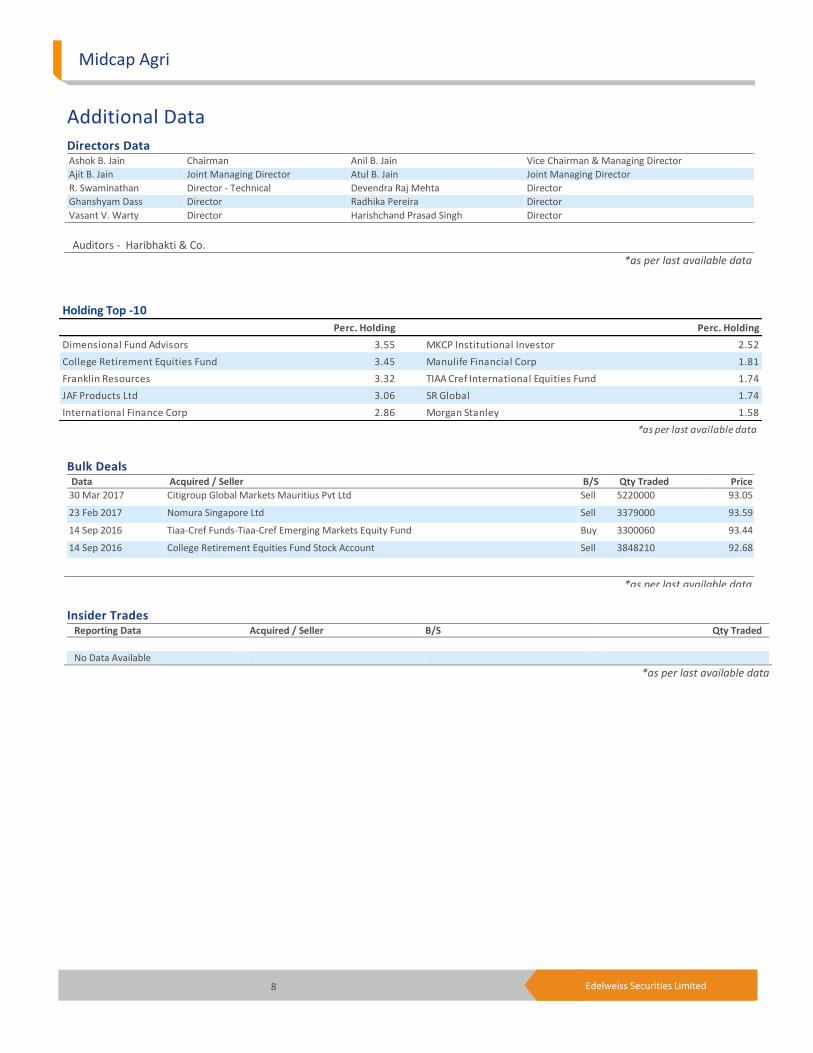
Holding Top -10
Perc. Holding Perc. Holding
Dimensional Fund Advisors 3.55 MKCP Institutional Investor 2.52
College Retirement Equities Fund 3.45 Manulife Financial Corp 1.81
Franklin Resources 3.32 TIAA Cref International Equities Fund 1.74
JAF Products Ltd 3.06 SR Global 1.74
International Finance Corp 2.86 Morgan Stanley 1.58
*as per last available data
Insider Trades Reporting Data Acquired / Seller B/S Qty Traded
No Data Available
*as per last available data
Bulk Deals Data Acquired / Seller B/S Qty Traded Price
30 Mar 2017 Citigroup Global Markets Mauritius Pvt Ltd Sell 5220000 93.05
23 Feb 2017 Nomura Singapore Ltd Sell 3379000 93.59
14 Sep 2016 Tiaa-Cref Funds-Tiaa-Cref Emerging Markets Equity Fund Buy 3300060 93.44
14 Sep 2016 College Retirement Equities Fund Stock Account Sell 3848210 92.68
*as per last available data
Additional Data
Directors Data Ashok B. Jain Chairman Anil B. Jain Vice Chairman & Managing Director
Ajit B. Jain Joint Managing Director Atul B. Jain Joint Managing Director
R. Swaminathan Director - Technical Devendra Raj Mehta Director
Ghanshyam Dass Director Radhika Pereira Director
Vasant V. Warty Director Harishchand Prasad Singh Director
Auditors - Haribhakti & Co.
*as per last available data
Jain Irrigation
9 Edelweiss Securities Limited
`
Edelweiss Securities Limited, Edelweiss House, off C.S.T. Road, Kalina, Mumbai – 400 098.
Board: (91-22) 4009 4400, Email: [email protected]
Aditya Narain
Head of Research
Coverage group(s) of stocks by primary analyst(s):
Bayer Cropscience, Dhanuka Agritech, Jain Irrigation, PI Industries, Rallis India, Sharda Cropchem, UPL
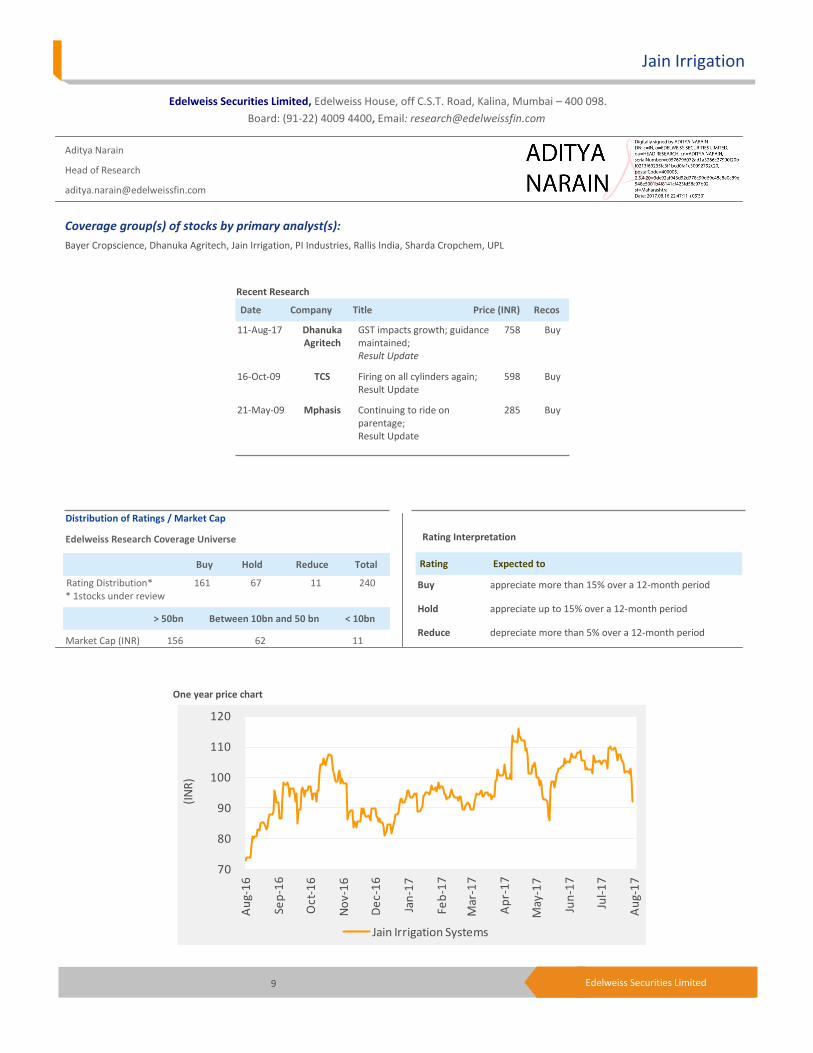
Distribution of Ratings / Market Cap
Edelweiss Research Coverage Universe
Rating Distribution* 161 67 11 240 * 1stocks under review
Market Cap (INR) 156 62 11
> 50bn Between 10bn and 50 bn < 10bn
Date Company Title Price (INR) Recos
Buy Hold Reduce Total
Recent Research
11-Aug-17 Dhanuka Agritech
GST impacts growth; guidance maintained; Result Update
758 Buy
16-Oct-09 TCS Firing on all cylinders again; Result Update
598 Buy
21-May-09 Mphasis Continuing to ride on parentage; Result Update
285 Buy
Rating Interpretation
Buy appreciate more than 15% over a 12-month period
Hold appreciate up to 15% over a 12-month period
Reduce depreciate more than 5% over a 12-month period
Rating Expected to
One year price chart
70
80
90
100
110
120
Au
g-1
6
Sep
-16
Oct
-16
No
v-1
6
De
c-1
6
Jan
-17
Feb
-17
Mar
-17
Ap
r-1
7
May
-17
Jun
-17
Jul-
17
Au
g-1
7
(IN
R)
Jain Irrigation Systems
Midcap Agri
10 Edelweiss Securities Limited
DISCLAIMER
Edelweiss Securities Limited (“ESL” or “Research Entity”) is regulated by the Securities and Exchange Board of India (“SEBI”) and is licensed to carry on the business of broking, depository services and related activities. The business of ESL and its Associates (list available on www.edelweissfin.com) are organized around five broad business groups – Credit including Housing and SME Finance, Commodities, Financial Markets, Asset Management and Life Insurance.
This Report has been prepared by Edelweiss Securities Limited in the capacity of a Research Analyst having SEBI Registration No.INH200000121 and distributed as per SEBI (Research Analysts) Regulations 2014. This report does not constitute an offer or solicitation for the purchase or sale of any financial instrument or as an official confirmation of any transaction. Securities as defined in clause (h) of section 2 of the Securities Contracts (Regulation) Act, 1956 includes Financial Instruments and Currency Derivatives. The information contained herein is from publicly available data or other sources believed to be reliable. This report is provided for assistance only and is not intended to be and must not alone be taken as the basis for an investment decision. The user assumes the entire risk of any use made of this information. Each recipient of this report should make such investigation as it deems necessary to arrive at an independent evaluation of an investment in Securities referred to in this document (including the merits and risks involved), and should consult his own advisors to determine the merits and risks of such investment. The investment discussed or views expressed may not be suitable for all investors.
This information is strictly confidential and is being furnished to you solely for your information. This information should not be reproduced or redistributed or passed on directly or indirectly in any form to any other person or published, copied, in whole or in part, for any purpose. This report is not directed or intended for distribution to, or use by, any person or entity who is a citizen or resident of or located in any locality, state, country or other jurisdiction, where such distribution, publication, availability or use would be contrary to law, regulation or which would subject ESL and associates / group companies to any registration or licensing requirements within such jurisdiction. The distribution of this report in certain jurisdictions may be restricted by law, and persons in whose possession this report comes, should observe, any such restrictions. The information given in this report is as of the date of this report and there can be no assurance that future results or events will be consistent with this information. This information is subject to change without any prior notice. ESL reserves the right to make modifications and alterations to this statement as may be required from time to time. ESL or any of its associates / group companies shall not be in any way responsible for any loss or damage that may arise to any person from any inadvertent error in the information contained in this report. ESL is committed to providing independent and transparent recommendation to its clients. Neither ESL nor any of its associates, group companies, directors, employees, agents or representatives shall be liable for any damages whether direct, indirect, special or consequential including loss of revenue or lost profits that may arise from or in connection with the use of the information. Our proprietary trading and investment businesses may make investment decisions that are inconsistent with the recommendations expressed herein. Past performance is not necessarily a guide to future performance .The disclosures of interest statements incorporated in this report are provided solely to enhance the transparency and should not be treated as endorsement of the views expressed in the report. The information provided in these reports remains, unless otherwise stated, the copyright of ESL. All layout, design, original artwork, concepts and other Intellectual Properties, remains the property and copyright of ESL and may not be used in any form or for any purpose whatsoever by any party without the express written permission of the copyright holders.
ESL shall not be liable for any delay or any other interruption which may occur in presenting the data due to any reason including network (Internet) reasons or snags in the system, break down of the system or any other equipment, server breakdown, maintenance shutdown, breakdown of communication services or inability of the ESL to present the data. In no event shall ESL be liable for any damages, including without limitation direct or indirect, special, incidental, or consequential damages, losses or expenses arising in connection with the data presented by the ESL through this report.
We offer our research services to clients as well as our prospects. Though this report is disseminated to all the customers simultaneously, not all customers may receive this report at the same time. We will not treat recipients as customers by virtue of their receiving this report.
ESL and its associates, officer, directors, and employees, research analyst (including relatives) worldwide may: (a) from time to time, have long or short positions in, and buy or sell the Securities, mentioned herein or (b) be engaged in any other transaction involving such Securities and earn brokerage or other compensation or act as a market maker in the financial instruments of the subject company/company(ies) discussed herein or act as advisor or lender/borrower to such company(ies) or have other potential/material conflict of interest with respect to any recommendation and related information and opinions at the time of publication of research report or at the time of public appearance. ESL may have proprietary long/short position in the above mentioned scrip(s) and therefore should be considered as interested. The views provided herein are general in nature and do not consider risk appetite or investment objective of any particular investor; readers are requested to take independent professional advice before investing. This should not be construed as invitation or solicitation to do business with ESL.
Jain Irrigation
11 Edelweiss Securities Limited
ESL or its associates may have received compensation from the subject company in the past 12 months. ESL or its associates may have managed or co-managed public offering of securities for the subject company in the past 12 months. ESL or its associates may have received compensation for investment banking or merchant banking or brokerage services from the subject company in the past 12 months. ESL or its associates may have received any compensation for products or services other than investment banking or merchant banking or brokerage services from the subject company in the past 12 months. ESL or its associates have not received any compensation or other benefits from the Subject Company or third party in connection with the research report. Research analyst or his/her relative or ESL’s associates may have financial interest in the subject company. ESL and/or its Group Companies, their Directors, affiliates and/or employees may have interests/ positions, financial or otherwise in the Securities/Currencies and other investment products mentioned in this report. ESL, its associates, research analyst and his/her relative may have other potential/material conflict of interest with respect to any recommendation and related information and opinions at the time of publication of research report or at the time of public appearance.
Participants in foreign exchange transactions may incur risks arising from several factors, including the following: ( i) exchange rates can be volatile and are subject to large fluctuations; ( ii) the value of currencies may be affected by numerous market factors, including world and national economic, political and regulatory events, events in equity and debt markets and changes in interest rates; and (iii) currencies may be subject to devaluation or government imposed exchange controls which could affect the value of the currency. Investors in securities such as ADRs and Currency Derivatives, whose values are affected by the currency of an underlying security, effectively assume currency risk.
Research analyst has served as an officer, director or employee of subject Company: No
ESL has financial interest in the subject companies: No
ESL’s Associates may have actual / beneficial ownership of 1% or more securities of the subject company at the end of the month immediately preceding the date of publication of research report.
Research analyst or his/her relative has actual/beneficial ownership of 1% or more securities of the subject company at the end of the month immediately preceding the date of publication of research report: No
ESL has actual/beneficial ownership of 1% or more securities of the subject company at the end of the month immediately preceding the date of publication of research report: No
Subject company may have been client during twelve months preceding the date of distribution of the research report.
There were no instances of non-compliance by ESL on any matter related to the capital markets, resulting in significant and material disciplinary action during the last three years except that ESL had submitted an offer of settlement with Securities and Exchange commission, USA (SEC) and the same has been accepted by SEC without admitting or denying the findings in relation to their charges of non registration as a broker dealer.
A graph of daily closing prices of the securities is also available at www.nseindia.com
Analyst Certification:
The analyst for this report certifies that all of the views expressed in this report accurately reflect his or her personal views about the subject company or companies and its or their securities, and no part of his or her compensation was, is or will be, directly or indirectly related to specific recommendations or views expressed in this report.
Additional Disclaimers
Disclaimer for U.S. Persons
This research report is a product of Edelweiss Securities Limited, which is the employer of the research analyst(s) who has prepared the research report. The research analyst(s) preparing the research report is/are resident outside the United States (U.S.) and are not associated persons of any U.S. regulated broker-dealer and therefore the analyst(s) is/are not subject to supervision by a U.S. broker-dealer, and is/are not required to satisfy the regulatory licensing requirements of FINRA or required to otherwise comply with U.S. rules or regulations regarding, among other things, communications with a subject company, public appearances and trading securities held by a research analyst account.
This report is intended for distribution by Edelweiss Securities Limited only to "Major Institutional Investors" as defined by Rule 15a-6(b)(4) of the U.S. Securities and Exchange Act, 1934 (the Exchange Act) and interpretations thereof by U.S. Securities and Exchange Commission (SEC) in reliance on Rule 15a 6(a)(2). If the recipient of this report is not a Major Institutional Investor as specified above, then it should not act upon this report and return the same to the sender. Further, this report may not be copied, duplicated and/or transmitted onward to any U.S. person, which is not the Major Institutional Investor.
Midcap Agri
12 Edelweiss Securities Limited
Access the entire repository of Edelweiss Research on www.edelresearch.com
In reliance on the exemption from registration provided by Rule 15a-6 of the Exchange Act and interpretations thereof by the SEC in order to conduct certain business with Major Institutional Investors, Edelweiss Securities Limited has entered into an agreement with a U.S. registered broker-dealer, Edelweiss Financial Services Inc. ("EFSI"). Transactions in securities discussed in this research report should be effected through Edelweiss Financial Services Inc. Disclaimer for U.K. Persons
The contents of this research report have not been approved by an authorised person within the meaning of the Financial Services and Markets Act 2000 ("FSMA"). In the United Kingdom, this research report is being distributed only to and is directed only at (a) persons who have professional experience in matters relating to investments falling within Article 19(5) of the FSMA (Financial Promotion) Order 2005 (the “Order”); (b) persons falling within Article 49(2)(a) to (d) of the Order (including high net worth companies and unincorporated associations); and (c) any other persons to whom it may otherwise lawfully be communicated (all such persons together being referred to as “relevant persons”). This research report must not be acted on or relied on by persons who are not relevant persons. Any investment or investment activity to which this research report relates is available only to relevant persons and will be engaged in only with relevant persons. Any person who is not a relevant person should not act or rely on this research report or any of its contents. This research report must not be distributed, published, reproduced or disclosed (in whole or in part) by recipients to any other person. Disclaimer for Canadian Persons
This research report is a product of Edelweiss Securities Limited ("ESL"), which is the employer of the research analysts who have prepared the research report. The research analysts preparing the research report are resident outside the Canada and are not associated persons of any Canadian registered adviser and/or dealer and, therefore, the analysts are not subject to supervision by a Canadian registered adviser and/or dealer, and are not required to satisfy the regulatory licensing requirements of the Ontario Securities Commission, other Canadian provincial securities regulators, the Investment Industry Regulatory Organization of Canada and are not required to otherwise comply with Canadian rules or regulations regarding, among other things, the research analysts' business or relationship with a subject company or trading of securities by a research analyst. This report is intended for distribution by ESL only to "Permitted Clients" (as defined in National Instrument 31-103 ("NI 31-103")) who are resident in the Province of Ontario, Canada (an "Ontario Permitted Client"). If the recipient of this report is not an Ontario Permitted Client, as specified above, then the recipient should not act upon this report and should return the report to the sender. Further, this report may not be copied, duplicated and/or transmitted onward to any Canadian person. ESL is relying on an exemption from the adviser and/or dealer registration requirements under NI 31-103 available to certain international advisers and/or dealers. Please be advised that (i) ESL is not registered in the Province of Ontario to trade in securities nor is it registered in the Province of Ontario to provide advice with respect to securities; (ii) ESL's head office or principal place of business is located in India; (iii) all or substantially all of ESL's assets may be situated outside of Canada; (iv) there may be difficulty enforcing legal rights against ESL because of the above; and (v) the name and address of the ESL's agent for service of process in the Province of Ontario is: Bamac Services Inc., 181 Bay Street, Suite 2100, Toronto, Ontario M5J 2T3 Canada. Disclaimer for Singapore Persons
In Singapore, this report is being distributed by Edelweiss Investment Advisors Private Limited ("EIAPL") (Co. Reg. No. 201016306H) which is a holder of a capital markets services license and an exempt financial adviser in Singapore and (ii) solely to persons who qualify as "institutional investors" or "accredited investors" as defined in section 4A(1) of the Securities and Futures Act, Chapter 289 of Singapore ("the SFA"). Pursuant to regulations 33, 34, 35 and 36 of the Financial Advisers Regulations ("FAR"), sections 25, 27 and 36 of the Financial Advisers Act, Chapter 110 of Singapore shall not apply to EIAPL when providing any financial advisory services to an accredited investor (as defined in regulation 36 of the FAR. Persons in Singapore should contact EIAPL in respect of any matter arising from, or in connection with this publication/communication. This report is not suitable for private investors.
Copyright 2009 Edelweiss Research (Edelweiss Securities Ltd). All rights reserved