space available: mountainside plaza -...
TRANSCRIPT

PROPERTY HIGHLIGHTS SITE PLAN / AVAILABILITY AERIAL CONTACT DEMOGRAPHICS
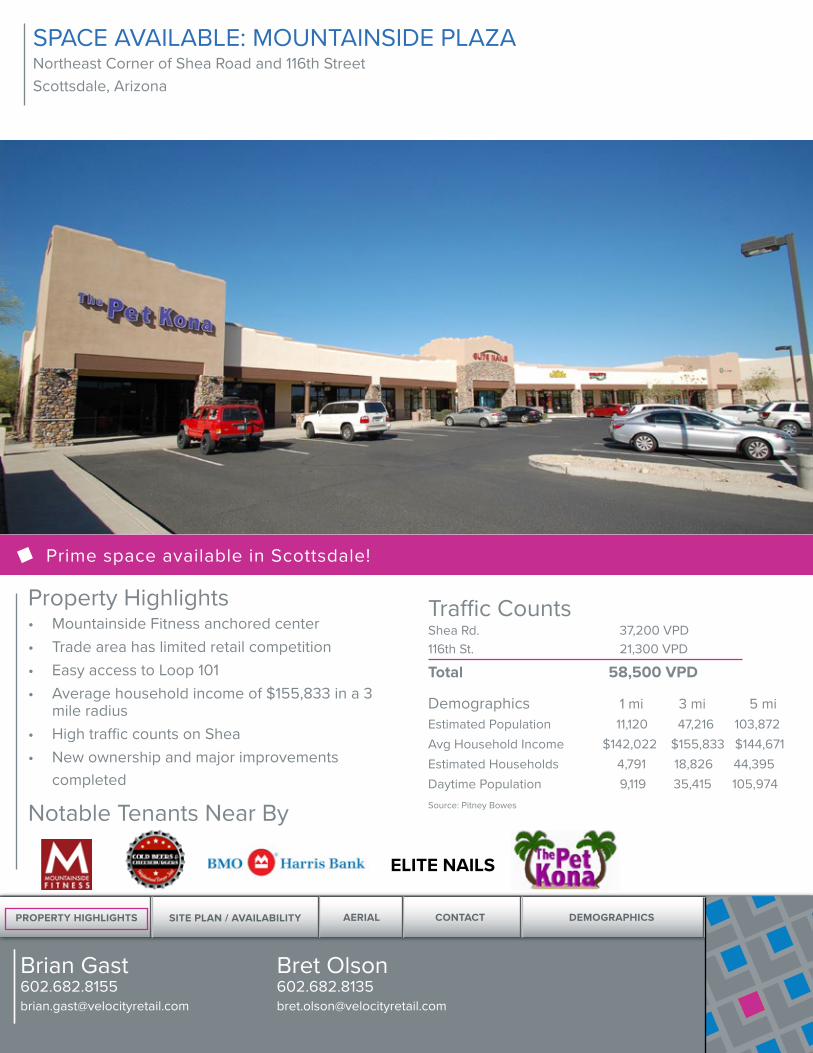
SPACE AVAILABLE:MOUNTAINSIDE PLAZANortheast Corner of Shea Road and 116th StreetScottsdale, Arizona
Brian [email protected]
Bret [email protected]
AGGRESIVE
LEASE RATES!
PROPERTY HIGHLIGHTS SITE PLAN / AVAILABILITY AERIAL CONTACT DEMOGRAPHICS
Property Highlights• Mountainside Fitness anchored center• Trade area has limited retail competition• Easy access to Loop 101• Average household income of $155,833 in a 3
mile radius• High traffic counts on Shea• New ownership and major improvements
completed
Notable Tenants Near By
Traffic CountsShea Rd. 37,200 VPD116th St. 21,300 VPD
Total 58,500 VPD
Demographics 1 mi 3 mi 5 miEstimated Population 11,120 47,216 103,872 Avg Household Income $142,022 $155,833 $144,671 Estimated Households 4,791 18,826 44,395 Daytime Population 9,119 35,415 105,974Source: Pitney Bowes
Prime space available in Scottsdale!
SPACE AVAILABLE: MOUNTAINSIDE PLAZANortheast Corner of Shea Road and 116th StreetScottsdale, Arizona
Brian [email protected]
Bret [email protected]
ELITE NAILS

PROPERTY HIGHLIGHTS SITE PLAN / AVAILABILITY AERIAL CONTACT DEMOGRAPHICS
Brian [email protected]
Bret [email protected]
SPACE AVAILABLE
Suite 145-150-155: 3,608 SFSuite 110-115: 2,414 SFSuite 133: 942 SF
Elite Nails
Refle
xolo
gy
Divisible: 1,400 SF
Divisible: 1,000 SF
Institute of
Muscle Therapies
PROPERTY HIGHLIGHTS SITE PLAN / AVAILABILITY AERIAL CONTACT DEMOGRAPHICS
Brian [email protected]
Bret [email protected]

PROPERTY HIGHLIGHTS SITE PLAN / AVAILABILITY AERIAL CONTACT DEMOGRAPHICS
Brian [email protected]
Bret [email protected]

PROPERTY HIGHLIGHTS SITE PLAN / AVAILABILITY AERIAL CONTACT DEMOGRAPHICS
2415 East Camelback Road, Suite 400Phoenix, Arizona 85016602.682.8100
Brian [email protected]
Bret [email protected]
The information contained in this brochure has been obtained from sources believed reliable. We have not verified the information, and make no guaran-tee, warranty or representation about it. Any financial projections, assumptions or estimates used are for example only and do not represent the current or future performance of the property. We recommend that you and/or your advisors conduct a complete analysis of the property and make your own deter-mination on the suitability of the property for your specific needs. Velocity Retail Group, LLC and the VRG logo are service marks of Velocity Retail Group, LLC. All other marks displayed in this document are the property of their respective owners.

PROPERTY HIGHLIGHTS SITE PLAN / AVAILABILITY AERIAL CONTACT DEMOGRAPHICS
Brian [email protected]
Bret [email protected]
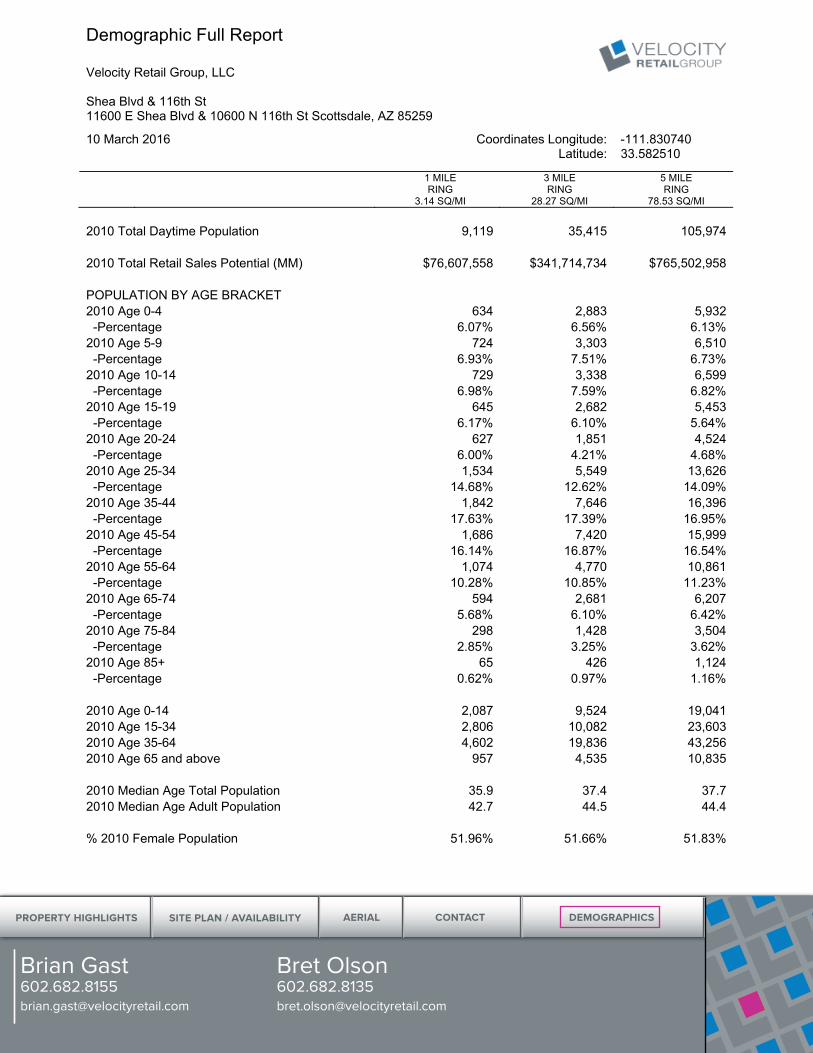
Demographic Full Report
Velocity Retail Group, LLC
Shea Blvd & 116th St 11600 E Shea Blvd & 10600 N 116th St Scottsdale, AZ 85259
10 March 2016 Coordinates Longitude: -111.830740 Latitude: 33.582510
1 MILE 3 MILE 5 MILE RING RING RING 3.14 SQ/MI 28.27 SQ/MI 78.53 SQ/MI
Data Source: Pitney Bowes Business Insight © 2010 Pitney Bowes Software Inc. All Rights Reserved. Page 1
POPULATION 1990 Total Pop. 4,365 18,352 42,066 2000 Total Pop. 8,981 36,848 82,220 -Percent Growth 1990-2000 106.94% 100.89% 95.55% 2010 Total Pop. 10,451 43,977 96,736 -Percent Growth 2000-2010 15.70% 19.28% 17.60% 2015 Total Pop. (Est.) 11,120 47,216 103,872 -Percent Growth 2010-2015 6.40% 7.37% 7.38% HOUSEHOLDS 1990 Total HHs 2,070 7,694 17,316 2000 Total HHs 3,946 14,811 34,895 -Percent HH Growth 1990-2000 90.63% 92.50% 101.52% 2010 Total HHs 4,471 17,372 40,631 -Percent HH Growth 2000-2010 13.30% 17.29% 16.44% 2015 Total HHs 4,791 18,826 44,395 -Percent HH Growth 2010-2015 7.16% 8.37% 9.26% 2010 Average Household Size 2.4 2.5 2.4 RACE IDENTIFICATION 2010 White Pop. 9,451 40,310 88,400 -Percentage 90.44% 91.66% 91.38% 2010 Black Pop. 251 733 1,544 -Percentage 2.40% 1.67% 1.60% 2010 American Indian/Alaska Native 78 244 547 -Percentage 0.75% 0.55% 0.57% 2010 Asian/Hawaiian/Pacific Islander 366 1,673 3,806 -Percentage 3.50% 3.80% 3.93% 2010 Other Population (Incl 2+ Races) 304 1,017 2,439 -Percentage 2.91% 2.31% 2.52% HISPANIC DATA (Not an Race Designation) 2010 Hispanic Population 715 2,348 5,331 -Percentage 6.84% 5.34% 5.51% 2010 Non-Hispanic Population 9,736 41,629 91,405 -Percentage 93.16% 94.66% 94.49% 2010 White Hispanic Population 505 1,751 3,810 -Percentage 4.83% 3.98% 3.94% 2010 White Non-Hispanic Population 8,946 38,559 84,590

PROPERTY HIGHLIGHTS SITE PLAN / AVAILABILITY AERIAL CONTACT DEMOGRAPHICS
Brian [email protected]
Bret [email protected]
Demographic Full Report
Velocity Retail Group, LLC
Shea Blvd & 116th St 11600 E Shea Blvd & 10600 N 116th St Scottsdale, AZ 85259
10 March 2016 Coordinates Longitude: -111.830740 Latitude: 33.582510
1 MILE 3 MILE 5 MILE RING RING RING 3.14 SQ/MI 28.27 SQ/MI 78.53 SQ/MI
Data Source: Pitney Bowes Business Insight © 2010 Pitney Bowes Software Inc. All Rights Reserved. Page 2
-Percentage 85.60% 87.68% 87.44% 2010 All Other Races Hispanic Population 210 598 1,521 -Percentage 2.01% 1.36% 1.57% 2010 All Other Races Non-Hispanic Population 790 3,070 6,815 -Percentage 7.56% 6.98% 7.04% 2010 Median Household Income $93,889 $112,780 $102,876 2010 Average Household Income $142,022 $155,833 $144,671 2010 Per Capita Income $60,758 $61,558 $60,765 HOUSEHOLD INCOME BRACKETS 2010 Household Income < $10,000 30 79 242 -Percentage 0.67% 0.45% 0.60% 2010 Household Income $10,000-$14,999 36 129 250 -Percentage 0.81% 0.74% 0.62% 2010 Household Income $15,000-$19,999 47 121 256 -Percentage 1.05% 0.70% 0.63% 2010 Household Income $20,000-$24,999 22 157 385 -Percentage 0.49% 0.90% 0.95% 2010 Household Income $25,000-$29,999 9 113 247 -Percentage 0.20% 0.65% 0.61% 2010 Household Income $30,000-$34,999 31 235 533 -Percentage 0.69% 1.35% 1.31% 2010 Household Income $35,000-$39,999 107 254 787 -Percentage 2.39% 1.46% 1.94% 2010 Household Income $40,000-$44,999 126 343 986 -Percentage 2.82% 1.97% 2.43% 2010 Household Income $45,000-$49,999 137 314 892 -Percentage 3.06% 1.81% 2.20% 2010 Household Income $50,000-$59,999 356 1,030 2,497 -Percentage 7.96% 5.93% 6.15% 2010 Household Income $60,000-$74,999 662 1,723 4,817 -Percentage 14.81% 9.92% 11.86% 2010 Household Income $75,000-$99,999 890 2,686 7,613 -Percentage 19.91% 15.46% 18.74% 2010 Household Income $100,000-$124,999 323 2,939 7,043 -Percentage 7.22% 16.92% 17.33% 2010 Household Income $125,000-$149,999 305 2,848 5,948 -Percentage 6.82% 16.39% 14.64%

PROPERTY HIGHLIGHTS SITE PLAN / AVAILABILITY AERIAL CONTACT DEMOGRAPHICS
Brian [email protected]
Bret [email protected]
Demographic Full Report
Velocity Retail Group, LLC
Shea Blvd & 116th St 11600 E Shea Blvd & 10600 N 116th St Scottsdale, AZ 85259
10 March 2016 Coordinates Longitude: -111.830740 Latitude: 33.582510
1 MILE 3 MILE 5 MILE RING RING RING 3.14 SQ/MI 28.27 SQ/MI 78.53 SQ/MI
Data Source: Pitney Bowes Business Insight © 2010 Pitney Bowes Software Inc. All Rights Reserved. Page 3
2010 Household Income $150,000-$199,999 422 1,991 3,875 -Percentage 9.44% 11.46% 9.54% 2010 Household Income $200,000-$249,999 296 819 1,407 -Percentage 6.62% 4.71% 3.46% 2010 Household Income $250,000-$499,999 543 1,356 2,434 -Percentage 12.14% 7.81% 5.99% 2010 Median Home Value $286,200 $269,663 $246,977 % 2010 Total Owner Occupied Housing Units 61.70% 71.99% 69.23% % 2010 Total Renter Occupied Housing Units 38.30% 28.01% 30.77% EDUCATION 2010 Total Educational Attainment Age 25+ 7,092 29,919 67,718 % 2010 High School Graduate (Incl Equivalency) 15.28% 13.44% 14.20% % 2010 Bachelor's Degree 32.48% 35.82% 35.05% % 2010 Master’s Degree 12.98% 13.43% 12.65% % 2010 Professional School Degree 3.02% 4.71% 4.38% % 2010 Doctorate Degree 1.51% 1.85% 2.13% (Education levels do not add to 100% since partial grade completions are not included.) EMPLOYMENT % 2010 White Collar Occupations 78.49% 83.78% 83.30% % 2010 Blue Collar Occupations 21.51% 16.22% 16.70% SELECTED EMPLOYMENT CATEGORIES % 2010 Management/Professional/Related 51.06% 52.96% 52.08% % 2010 Service Occupation 13.64% 10.18% 10.74% % 2010 Healthcare Support 1.45% 0.92% 1.04% % 2010 Sales/Office 27.45% 30.82% 31.22% % 2010 Office/Administrative Support 9.84% 10.40% 10.45% % 2010 Farming/Fishing/Forestry 0.00% 0.00% 0.03% % 2010 Construction/Extraction 2.68% 1.97% 1.96% % 2010 Installation/Maintenance/Repair 2.33% 1.30% 1.24% % 2010 Transportation/Material Moving 2.04% 1.88% 1.73% (Categories are not exclusive, and do not add to 100%)
PROPERTY HIGHLIGHTS SITE PLAN / AVAILABILITY AERIAL CONTACT DEMOGRAPHICS
Brian [email protected]
Bret [email protected]
Demographic Full Report
Velocity Retail Group, LLC
Shea Blvd & 116th St 11600 E Shea Blvd & 10600 N 116th St Scottsdale, AZ 85259
10 March 2016 Coordinates Longitude: -111.830740 Latitude: 33.582510
1 MILE 3 MILE 5 MILE RING RING RING 3.14 SQ/MI 28.27 SQ/MI 78.53 SQ/MI
Data Source: Pitney Bowes Business Insight © 2010 Pitney Bowes Software Inc. All Rights Reserved. Page 4
2010 Total Daytime Population 9,119 35,415 105,974 2010 Total Retail Sales Potential (MM) $76,607,558 $341,714,734 $765,502,958 POPULATION BY AGE BRACKET 2010 Age 0-4 634 2,883 5,932 -Percentage 6.07% 6.56% 6.13% 2010 Age 5-9 724 3,303 6,510 -Percentage 6.93% 7.51% 6.73% 2010 Age 10-14 729 3,338 6,599 -Percentage 6.98% 7.59% 6.82% 2010 Age 15-19 645 2,682 5,453 -Percentage 6.17% 6.10% 5.64% 2010 Age 20-24 627 1,851 4,524 -Percentage 6.00% 4.21% 4.68% 2010 Age 25-34 1,534 5,549 13,626 -Percentage 14.68% 12.62% 14.09% 2010 Age 35-44 1,842 7,646 16,396 -Percentage 17.63% 17.39% 16.95% 2010 Age 45-54 1,686 7,420 15,999 -Percentage 16.14% 16.87% 16.54% 2010 Age 55-64 1,074 4,770 10,861 -Percentage 10.28% 10.85% 11.23% 2010 Age 65-74 594 2,681 6,207 -Percentage 5.68% 6.10% 6.42% 2010 Age 75-84 298 1,428 3,504 -Percentage 2.85% 3.25% 3.62% 2010 Age 85+ 65 426 1,124 -Percentage 0.62% 0.97% 1.16% 2010 Age 0-14 2,087 9,524 19,041 2010 Age 15-34 2,806 10,082 23,603 2010 Age 35-64 4,602 19,836 43,256 2010 Age 65 and above 957 4,535 10,835 2010 Median Age Total Population 35.9 37.4 37.7 2010 Median Age Adult Population 42.7 44.5 44.4 % 2010 Female Population 51.96% 51.66% 51.83%