spacecraft and support function cost models for nasa … · spacecraft and support function cost...
TRANSCRIPT
1
Spacecraft and Support Function Cost Models for NASA PCEC
8/25/15
Shawn Hayes and Mark JacobsVictory Solutions MIPSS Team

22
OUTLINE
1. Introduction
2. Data Normalization
3. Project Management, Systems Engineering, Mission Assurance, and Integration & Test Model
4. S/C Subsystem Cost Model
5. Lessons Learned

3
PCEC Cost ModelingApproach & Current Progress
•Approacho Collect & Normalize a data set from projects with launch CADRe’so Explore estimating methodologies covering NASA WBS elements using
the normalized data set
•Current ProgressoData has been collected/normalized for 42 recently launched robotic
science spacecraft projects (unmanned)oA PCA-based estimating methodology has been developed for Project
Management (PM), Systems Engineering (SE), Mission Assurance (MA), and Integration & Test (I&T)
oA hybrid approach has been developed for Spacecraft Subsystems
•Improvements to these methodologies have been identified and are in progresso Enhanced methodologies, Additional missions, Validation with data
from recently launched missions

4
NASA Robotic Science MissionPCEC Costing Tool Enhancements
NAFCOM uses a mix of
approaches to capture
mission development
costs
SOCM is typically used
to estimate MO&DA
• Currently, PCEC includes Excel-based updates of NAFCOM12 relationships
• Future versions will include new models for all WBS elements, with multiple available approaches for some items
• An updated approach for estimating Project Support functions (PM/SE/MA/I&T) has been developed
• Preliminary PCEC S/C CERs recently completed

55
OUTLINE
1. Introduction
2. Data Normalization
3. Project Management, Systems Engineering, Mission Assurance, and Integration & Test Model
4. S/C Subsystem Cost Model
5. Lessons Learned

6
PCEC CADRe Data NormalizationPrimary Objective
•Provide a set of normalized cost data to support NASA cost modeling efforts and future versions of the PCECo Cover robotic science spacecraft projects (unmanned)o Contracting Fees/Burdens/Taxes, Contributions, Full Cost Accounting,
External Impacts, and other characteristics affect cost data from past missions in different ways
o For cost modeling, a data set reflecting a common set of assumptions is needed
•Other significant requirementso Provide mapping to the most current NASA
standard WBSo Provide visibility into the assumptions affecting
the normalized dataoBuild on the experience from NAFCOM and
resources in REDSTAR
7
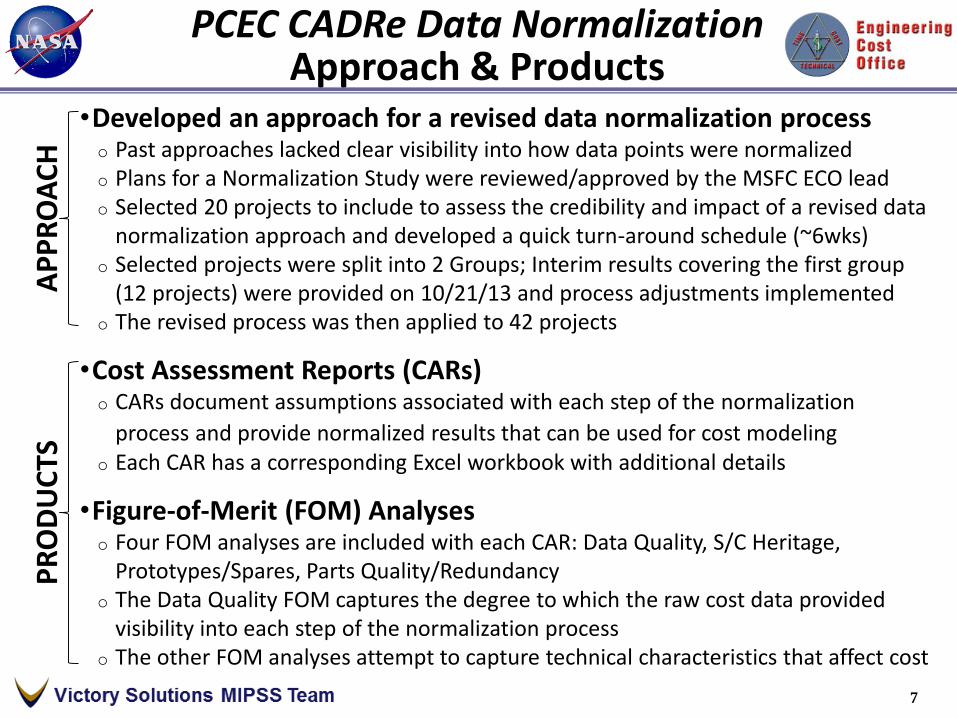
•Developed an approach for a revised data normalization processo Past approaches lacked clear visibility into how data points were normalizedo Plans for a Normalization Study were reviewed/approved by the MSFC ECO leado Selected 20 projects to include to assess the credibility and impact of a revised data
normalization approach and developed a quick turn-around schedule (~6wks)o Selected projects were split into 2 Groups; Interim results covering the first group
(12 projects) were provided on 10/21/13 and process adjustments implementedo The revised process was then applied to 42 projects
•Cost Assessment Reports (CARs)o CARs document assumptions associated with each step of the normalization
process and provide normalized results that can be used for cost modelingo Each CAR has a corresponding Excel workbook with additional details
•Figure-of-Merit (FOM) Analyseso Four FOM analyses are included with each CAR: Data Quality, S/C Heritage,
Prototypes/Spares, Parts Quality/Redundancyo The Data Quality FOM captures the degree to which the raw cost data provided
visibility into each step of the normalization processo The other FOM analyses attempt to capture technical characteristics that affect cost
PCEC CADRe Data NormalizationApproach & Products
AP
PR
OA
CH
PR
OD
UC
TS

8
Fee/Burden/Tax arrangements for major contracts vary by project
Full Cost Accounting changes add uncertainty/error
Schedules are continually changing at all WBS levels
Impact from Long Lead procurements can skew NRC/RC splits
PM/SE/MA/I&T is impacted by Contributed (uncosted) items
Changing NASA culture over past 10-20 years
Projects have varying approaches to parts quality, prototyping, etc.
Flight heritage significantly affects most cost elements
Costs are often affected by “External Impacts”
And More
PCEC CADRe Data NormalizationChallenges
• Many items complicate using the cost data for modeling and making fair comparisons between projects; Examples include:
9
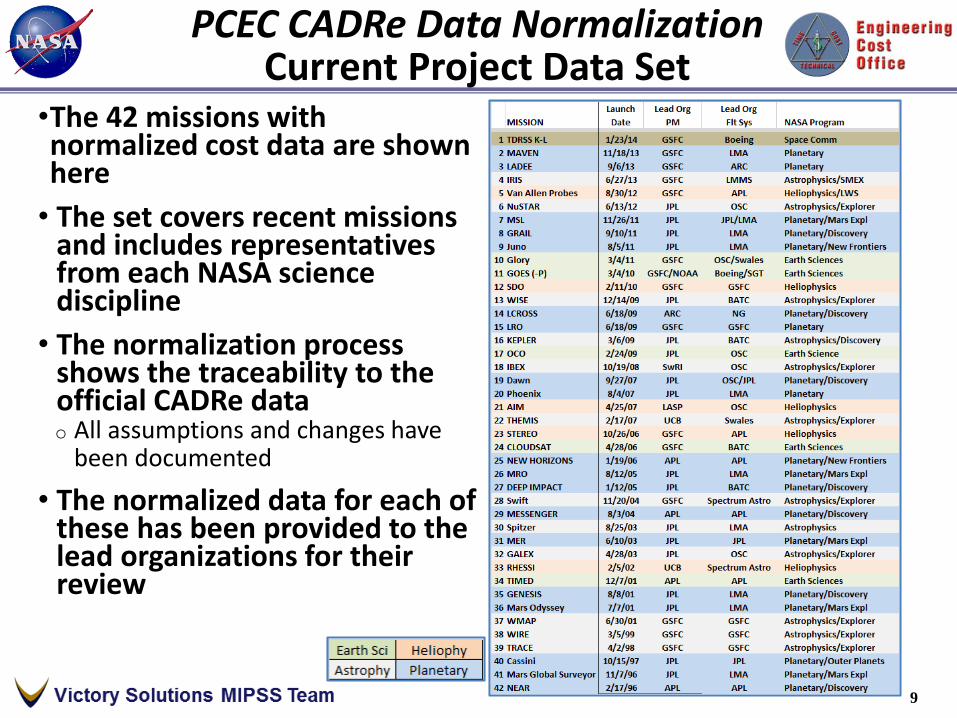
PCEC CADRe Data NormalizationCurrent Project Data Set
•The 42 missions with normalized cost data are shown here
• The set covers recent missions and includes representatives from each NASA science discipline
• The normalization process shows the traceability to the official CADRe datao All assumptions and changes have
been documented
• The normalized data for each of these has been provided to the lead organizations for their review
10
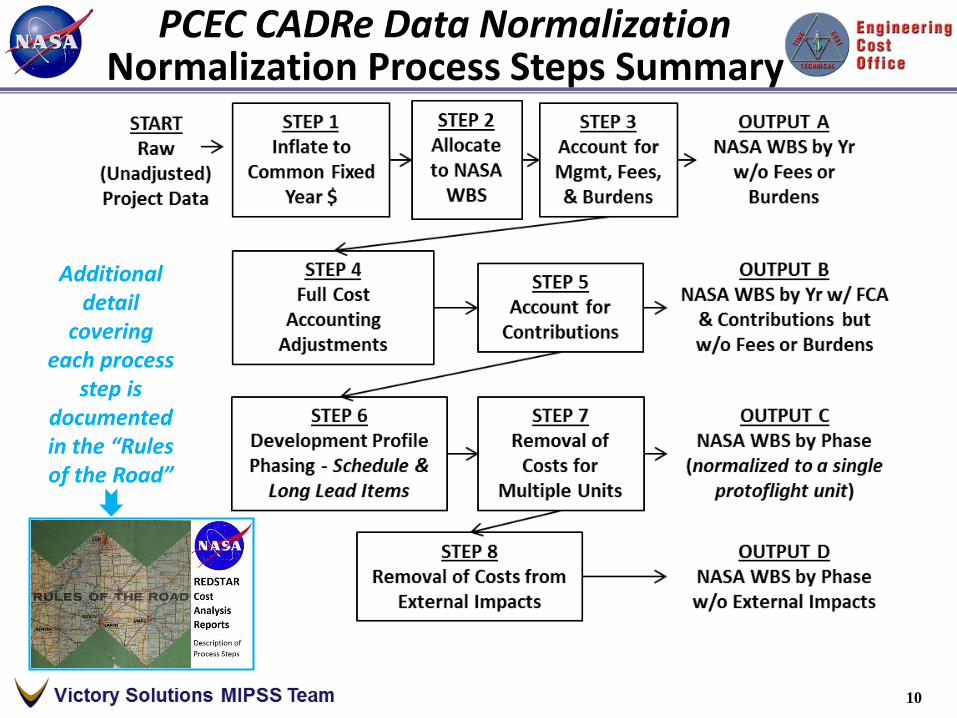
PCEC CADRe Data NormalizationNormalization Process Steps Summary
Additional detail
covering each process
step is documented in the “Rules of the Road”
1111
OUTLINE
1. Introduction
2. Data Normalization
3. Project Management, Systems Engineering, Mission Assurance, and Integration & Test Model
4. S/C Subsystem Cost Model
5. Lessons Learned

12
Objective: Develop an improved estimating methodology to capture Management, Systems Engineering, Mission
Assurance, and Integration & Test costs
Explore alternatives to the “wrap factor” approach
Cover robotic science spacecraft projects (unmanned)
Effort began with proof-of-concept rapid prototype development using an approach similar to what is used for
the NASA Space Operations Cost Model (SOCM)
2nd Modeling effort explored three alternatives:
Standard regression approach
Constructive, SOCM-like approach (relies on expert judgment)
Statistical approach using Principal Component Analysis (PCA)
PCEC PM-SE-MA-I&T ModelObjective & Approach

13
PCEC PM-SE-MA-I&T ModelRapid Prototype Inputs
• Individual input weightings are assigned for each WBS element (PM/SE/MA/I&T) in each phase (Design/Fab/I&T/Launch Ops)
Inp
uts
Use
d f
or
Rap
id P
roto
typ
e

14
PCEC PM-SE-MA-I&T ModelPrinciple Component Analysis Approach
1) A correlation matrix was generated to get a sense of the of the dependency between variables.
• Several of the variables appeared to be correlated, making PCA an attractive method to apply to the data set.
2) The principal components were determined using an algorithm developed in Python.
• The first 6 principal components which account for 85% of variance in the data set were selected and used to determine which of the 20 variables were most likely related to cost.
3) For each of the 21 data sets examined, 4 subsets of the 20 variables were run through a multiple regression routine to determine the new cost estimating relationships.
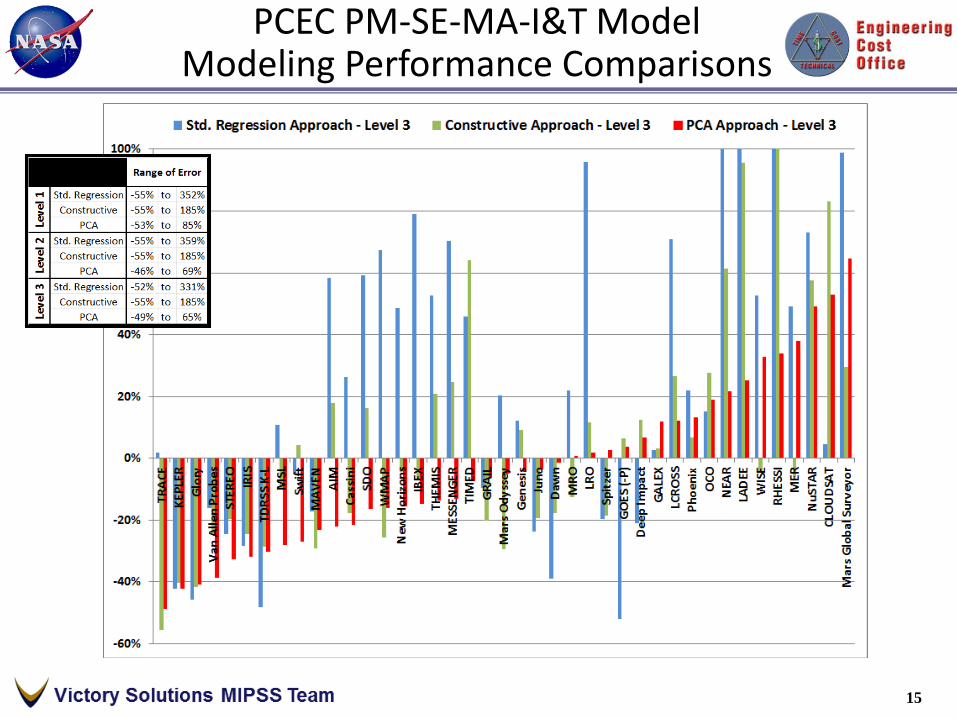
15
PCEC PM-SE-MA-I&T ModelModeling Performance Comparisons

16
PCEC PM-SE-MA-I&T ModelComparison to Wrap Factors, 1 of 2
SURFCOM = Support Function Cost Model

17
SURFCOM = Support Function Cost Model
PCEC PM-SE-MA-I&T ModelComparison to Wrap Factors, 2 of 2

18
• The PCEC Project Support Model combines Project Management, Systems Engineering, Mission Assurance and Integration & Test from WBS 1/2/3/5/6/10
• Development phases includeDesign, Fabrication, Integration& Test, and Launch Operations& Check-Out (L+30)
• The model’s PCA based algorithms used in this version include “Level 1” and “Level 2”• Level 1: Single CER for combined PM/SE/MA/I&T across all WBS
elements and phases
• Level 2: 4 separate CERS for each of the 4 functions
• Level 3: 16 CERs covering each of the 4 functions across each of the 4 development phases (not included due to significant variability by phase – totals similar to Level 2)
Project Support Allocations Between Project-Payload-S/C and Development Phases
• The basis for allocations between WBS 1/2/3/10 and WBS 5/6 and to the development phases are provided here, but these are treated as inputs in the current model version due to data variability at the lower levels

19
PM/SE/MA Distributions between Project, Payload, and S/C
• Data shown here is combined PM/SE/MA from WBS 1/2/3/5/6 from the normalized data• Splits are shown between
Project-level (WBS 1/2/3/10), Payload-level (WBS 5) and S/C (WBS 6)
• Since there is significant variability between Projects or Programs, database averages representing all missions shown are used
20
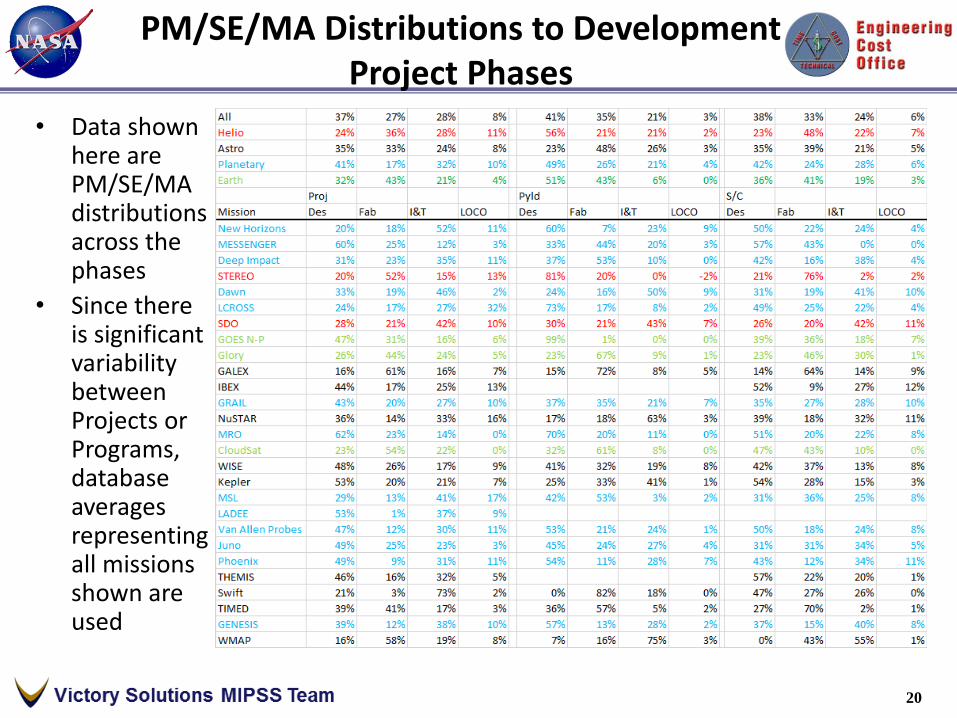
• Data shown here are PM/SE/MA distributions across the phases
• Since there is significant variability between Projects or Programs, database averages representing all missions shown are used
PM/SE/MA Distributions to Development Project Phases

21
• Data shown here are I&T distributions between Project-Payload-S/C (WBS 10/5/6) and across the development phases
• Since there is significant variability between Projects or Programs, database averages representing all missions shown are used
I&T Distributions between Project-Payload-S/C and Development Phases
22
• The database averages are approximate starting points and distributions used should represent the implementation approach• Reasonable levels for these functions should be included in WBS 5/6 based on
the scope of the Payload and S/C
• The remaining portion is defaulted to the Project-level (WBS 1/2/3/10)
• Phase distributions are also approximate starting points and should be assigned consistent with the implementation approach being modelled
PCEC PM-SE-MA-I&T ModelProject Support Allocation Notes

2323
OUTLINE
1. Introduction
2. Data Normalization
3. Project Management, Systems Engineering, Mission Assurance, and Integration & Test Model
4. S/C Subsystem Cost Model
5. Lessons Learned

2424
PCEC S/C MODEL
STARTING INPUT CANDIDATES
Includes > 100 inputs from NASA cost and other models
MISSION CANDIDATESIncludes 42 launch NASA robotic
Earth/space science projects;Cost data has been “normalized”
to facilitate use for modelling
1st screen based on data availability from the normalized data set (42 missions) = ~100 input candidates/mission
Principle Component Analysis•Uses PCA to reduce the input
set to the key drivers of cost differences• Regression analyses are
performed with the key inputs•Approximately 10-20 inputs
per S/C subsystem
Regression using Expert Judgment
•Uses PCA results and expert judgment to select key regression inputs•Approximately 10-20
inputs per subsystem
Hybrid Approaches•Uses regression to
develop initial estimates•Adjustment factors have
been developed to refine the estimate with additional inputs

2525
PCEC S/C MODEL – Initial Inputs
o Multiple information sources have been reviewed to generate the initial input candidate list, including mass & performance metrics from:
CADRe: Fields in Part B (technical)
Cost Models: Aerospace Corp SSCM & COBRA, PRICE Space Missions (update of SAIC/Chicago Cost Model), and NAFCOM
INPUT CANDIDATES

2626
PCEC S/C MODELStatistics Example
• These statistics represent regression results for Non-Recurring (NRC) and Recurring Costs (RC) after screening the inputs using PCA
• Generally, accuracy is reasonable for most subsystems
• Splitting near-Earth S/C (EO) from Planetary (PL) was explored for all subsystems but appears to mainly affect Communications– Communications is an example of a
subsystem that likely needs a revised candidate input set
• After an acceptable set of regression inputs is established, candidate inputs for adjustments can be identified
– Will leverage inputs not used in the regression with adjustments supported by analysis of residuals

2727
PCEC S/C MODELConstructive Adjustments
o Adjustment factors have been developed to apply to the Regression-based S/C Subsystem CER results
Different factor sets were tested to minimize errors & maximize the # of missions estimated within +/-40%
8 additional inputs are used -> System & Subsystem Heritage & Parts, Mission Class, Mission Type, Design & Fab times
All 8 additional inputs are the same as used for the PCEC PM-SE-MA-I&T model
o Costs and inputs for System-Level & Subsystem-Level Heritage & Parts have been taken from the Cost Analysis Reports (CADRe-derived) to derive comparisons
2828
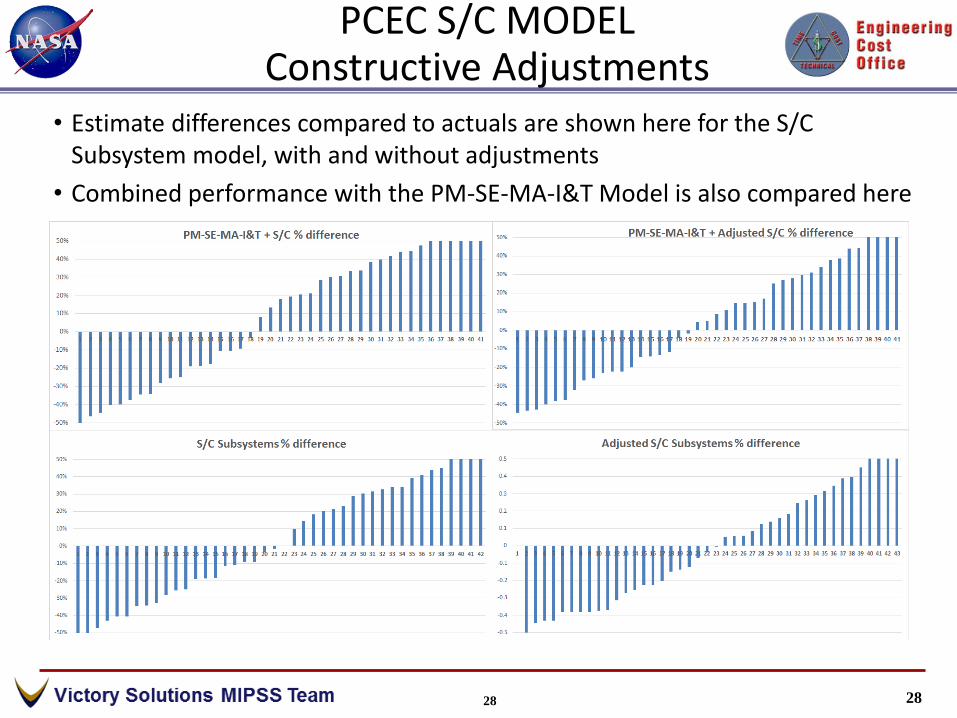
PCEC S/C MODELConstructive Adjustments
• Estimate differences compared to actuals are shown here for the S/C Subsystem model, with and without adjustments
• Combined performance with the PM-SE-MA-I&T Model is also compared here

2929
OUTLINE
1. Introduction
2. Data Normalization
3. Project Management, Systems Engineering, Mission Assurance, and Integration & Test Model
4. S/C Subsystem Cost Model
5. Lessons Learned

3030
NASA SPACE MISSIONS MODELLINGLESSONS LEARNED
• Principle Component Analysis (PCA) can help identify a manageable subset of potential costing inputs that are the main contributors to cost differences from a much larger candidate set
• A consistent approach for data normalization is essential; Programmatic differences between the projects can strongly influence official costs– PCEC normalization adjusts the data to a defined set of rules/procedures
• Do not trust regression results without a thorough sanity check– Often, “associative” instead of “causal” inputs can yield counter-intuitive results (that may
be misdirected); Best approach maximizes utilization of available “causal” inputs– It is important to understand reasons for outliers, which can lead to model enhancements
• A combination of PCA, regression, and constructive modelling approaches appears to offer many benefits over reliance on a single technique– Enhances flexibility to capture unique aspects associated with NASA robotic science missions– Adjustments to regression results need to be supported by data analysis
• Accuracy of technical and cost data should always be reviewed and questioned – differences often exist in assumptions behind different values for the same item from different sources