sparebank 1 nord-norge - mb.cision.commb.cision.com/main/5027/9325127/59706.pdf · purchase price...
TRANSCRIPT

SpareBank 1 Nord-Norge Preliminary accounts for 2009 – The Group
Very good result for the 4th quarter and for 2009 as a whole. The bank's financial strength is good.
Key figures (figures in parentheses refer to the same period 2008):
• Operating profit before tax after 4th quarter NOK 1,002 million (NOK 493 million).
• Return on equity after tax was 18.2 % (8.1 %).
• Earnings per equity certificate (parent bank): NOK 13.85 (NOK 4.09).
• Good underlying banking operations: result of core operations before loan losses amounted to NOK 708
million (NOK 760 million).
• Total contribution from the group's subsidiaries: NOK 8 million (- NOK 16 million).
• Net return on investment securities: NOK 479 million (- NOK 84 million).
• Profit contribution from SpareBank 1 Gruppen AS totals NOK 175 million (-NOK 151 million).
• Badwill taken to income in connection with acquisition of stake in BN Bank ASA: NOK 56 million.
Amortisation of net lesser value in connection with acquisition of BN Bank ASA: NOK 8 million.
Share of profit of BN Bank as at 4th quarter: NOK 28 million.
• Share of result of SpareBank 1 Boligkreditt: NOK 13 million.
• Net gain on bank's securities portfolio: NOK 118 million.
• Net gain on fixed interest portfolio (including related derivative trading): NOK 21 million.
• Income from other foreign exchange and financial derivatives and assets: NOK 36 million.
• Cost developments are in check, up NOK 1 million compared with 2008.
Cost ratio 45 % (59 %).
• Low losses on loans taking into account the macroeconomic situation: Net losses totalled NOK 185 million
(NOK 183 million).
• Total growth in lending last 12 months (incl. loans transferred to SpareBank 1 Boligkreditt): 4.0 % (8.0 %).
• Retail market: 8.4 % (incl. SpareBank 1 Boligkreditt).
• Corporate market: - 4.8 %.
• The accounts show a decline in lending over the last 12 months of 6.0% (+ 2.1 %).
• Growth in deposits the last 12 months: 0.9 % (7.9 %).
• Retail market: 5.7 %.
• Corporate market: - 15.1 %.
• Public sector marked: 20.2 %.
• Deposit-to-loan ratio: 72.4 % (67.4 %).
• The bank's capital strength is good and the core capital ratio (group) is 11.9% (9.1%). The total capital ratio is
14.3% (10.6%).
• Liquidity continues to be satisfactory.
• Proposed cash dividend to the equity certificate owners: NOK 6.75.
Introductory comments
The quarterly accounts are prepared in accordance with
International Financial Reporting Standards (IFRS),
including IAS 34 relating to interim account reporting.
IAS 1 – Presentation of Financial Statements – was
amended in 2009, and this results in several changes in the
presentation of the Income Statement and statement of
changes in equity. Items that are posted directly against
equity shall now also be presented in the income statement
as extended items. In the equity statement a distinction is
made between transactions between the owners and other
transactions.
IFRS calls for the use of different principles for
incorporation of subsidiaries and joint venture companies
between the parent company's accounts and the group
accounts. In the consolidated accounts, the equity method
is used, where the results of joint ventures are included in
the consolidated accounts based on the equity interest and
after taking into account the book values in the balance
sheets. The results of subsidiaries are consolidated. In
accordance with IFRS only the cost method shall be
applied in the parent company accounts. This results in the
book values of subsidiaries and joint ventures in the parent
bank's accounts being recorded at historic cost. In the
parent bank's accounts, only the annual dividends received
from these are shown.
Pursuant to the regulations issued by the Ministry of
Finance on 16 October 2008, permission was granted to
reclassify some securities in the trading portfolio from the
category "Fair value with value changes over the income
statement" to categories that are assessed at amortised cost.
The group resolved to make such reclassifications of much
of the interest-bearing portfolio held for trading as at 1
July 2008. Future assessments of these categories will be
at amortised costs with the help of the effective interest
method and taken to income as interest income over the
remaining life of the securities in question. The bank's
other holdings of certificates and bonds are classified as
"Fair value with value changes over the income
statement". To the extent that there is an active market for
the security in question, recorded market prices are used
when fixing fair values. For some parts of the portfolio
there are no recorded market values and the bank has
therefore used an alternative evaluation method pursuant
1/22

to IFRS 39 in order to ascertain a fair market value as at 31
December 2009 for the securities in question. This is
described in more detail in the principle note to the
accounts.
A consortium of SpareBank 1-banks acquired Glitnir Bank
ASA, now renamed BN Bank ASA in December 2008.
SpareBank 1 Nord-Norge then held 20 per cent of the
shares in BN Bank ASA. In this connection, SpareBank 1
Nord-Norge took to income badwill (negative goodwill)
amounting to NOK 415.4 million in its consolidated
accounts for 2008. An adjustment was made in the 4th
quarter of 2009 of original badwill, when a further NOK 9
million was taken to income.
In October 2009, SpareBank 1 Nord-Norge acquired a
further 3.5 per cent of the shares in BN Bank ASA and 3.5
per cent of the shares in SpareBank 1 Næringskreditt AS
from SpareBank 1 SMN. Subsequent to this the bank's
stake in these companies is 23.5 per cent. In connection
with the increase in the stake new badwill (negative
goodwill) was taken to income in the 4th
quarter of 2009 in
the amount of NOK 47 million.
In 2009 the difference between the bank's book value of
the share capital in BN Bank and the book value of the
equity in BN Bank's accounts is recorded (taken to
income). This is done by amortising the excess/shortfall of
purchase price over net assets value of balance sheet items
in accordance with agreed maturities for the individual
items. As at the 4th
quarter of 2009 a total of NOK 8
million has been taken to income as amortisation as a
result of last year's preliminary assessment now being
finally adopted, including the amortisation subsequent to
the bank increasing its stake in BN Bank.
Badwill is not recorded in the parent company's accounts.
Earnings development
As at the 4th
quarter of 2009, operating profit before tax
amounted to NOK 1,002 million. The corresponding profit
in 2008 was NOK 493 million. The group's core operations
(operations excluding net income from investment
securities) remain good, showing a profit before losses of
NOK 708 million, which is NOK 52 million lower than at
the end of the 4th
quarter of 2008.
The increase in the operating profit compared with the
preceding year is to a great extent due to the impact of
recording losses on securities last year as a consequence of
the global financial crisis.
In 2009, the group's return on equity after tax was 18.2 per
cent (8.1 per cent). For the parent bank, the return on
equity was 18.3 per cent (5.9 per cent) and earnings per
equity certificate in the parent bank were NOK 13.85
(NOK 4.09).
The tax charge is estimated at NOK 143 million.
The reasons for the NOK 509 million improvement in the
profit before tax, compared with 2008, are as follows:
• Reduction in net interest income -NOK 102 million
• Increase in net commission
income
NOK 44 million
• Increase in income from
investment securities NOK 563 million
• Increase in other operating
income
NOK 7 million
• Increase in costs - NOK 1 million
• Increase in net losses -NOK 2 million
For the 4th
quarter of 2009 seen in isolation, the operating
profit before tax was NOK 331 million compared with
NOK 118 million in the same period last year. As for the
result of the year as a whole, the improvement in the
quarter's result is primarily due to the higher contribution
from investment securities. Compared to the 3rd
quarter of
2009, there was also a significant improvement in income
from investment securities. Net interest income rose by
NOK 6 million from the 3rd
quarter of the year.
For the 4th
quarter seen in isolation, return on equity was
25.2 per cent.
Share of result of SpareBank 1 Gruppen
SpareBank 1 Gruppen's preliminary profit after tax at the
end of the 4th
quarter of 2009 amounts to NOK 881million.
SpareBank 1 Nord-Norge group's share of the profit, NOK
175 million, has been incorporated into the accounts. As
can be seen from the extended income statement, a
negative correction of the final result for 2009 was made in
the amount of NOK 10 million which has been recognised
directly against equity. Adjustments have also been made
to equity for the group's share of SpareBank 1 Gruppen's
estimate discrepancies regarding pension provisions for
2008. Reference is made to the statement of changes in
equity.
Subsidiaries
The group's subsidiaries made an aggregate contribution of
NOK 8 million as at the end of the 4th
quarter. Of this, the
result from SpareBank 1 Finans Nord-Norge amounted to
NOK 65 million kroner. The contribution from SpareBank
1 Invest was minus NOK 65 million kroner. This negative
result was mainly due to the write-down of a single
investment.
Reference is also made to the notes to the quarterly
accounts.
Proposed allocation of the profit The parent bank's profit after tax is divided between the
equity certificate owners and the bank's social capital in
accordance with the distribution of equity between these
groups of owners as at 1 January 2009.
In line with the bank's ownership policy (see separate
paragraph below) distribution is proposed paid in
cash/endowments to the groups of owners (equity
certificates and social capital) so that the owner groups'
shares of the bank's equity are maintained at the same level
as at 1 January 2009.
The main Board of Directors proposes that the Supervisory
Board declares a cash dividend of NOK 6.75 per equity
certificate, totalling NOK 121 million, and a provision to
the equalisation fund of NOK 127 million. Furthermore, it
proposes an allocation to the endowment fund of NOK 229
million.
2/22

The proposed allocation of the profit is therefore as
follows:
The parent bank's profit before tax NOK 718 million
Allocated to cash dividend NOK 121 million
Allocated to equalisation fund NOK 127 million
Total to equity certificate
owners (34.54 %) NOK 248 million
Allocated to payments for public benefits NOK160 million
Allocated to donations NOK 69 million
Allocated to savings banks fund NOK 241 million
Total to bank's social capital (65.46 %) NOK 470 million
Total allocations NOK 718 million
Dividend will be paid to those equity certificate owners
who are registered as owners as of 17 March 2010. The
bank's equity certificates will be quoted ex dividend on 18
March 2010.
Interest margins
At the end of the 4th
quarter of 2009, the group's net
interest income aggregated NOK 1,218 million, down
NOK 102 million compared with the end of 4th
quarter of
2008. In terms of average total assets, net interest income
at the end of the 4th
quarter was 1.87 per cent, which is
0.28 percentage points lower than in the same period last
year.
For the 4th quarter seen in isolation, net interest income
was NOK 6 million higher than in the 3rd quarter and
NOK 32 million lower than in the same period in 2008.
The reduction in the interest margin in 2009 is to a great
extent due to the effect of falling interest rate levels,
including:
• Reduced current interest earnings on the bank's
equity
• Reduced interest margin that is not fully
compensated for by increased margins on lending.
The improving interest margins in the 4th
quarter come
from measures introduced in the 3rd
quarter having full
effect in the 4th
quarter.
To ensure liquidity, the bank raised substantial long-term
funding from the capital markets during the financial crisis
in 2007 and 2008. These loans have large credit spreads
compared with the current level and have raised the bank's
average funding cost. Redemption and replacement of
older capital market funding raised before the financial
crisis (with low credit spreads) will continue to have an
increasing negative impact on the bank's interest margin.
The bank maintains its constant focus on the lending
margin. The low interest rates, coupled with the relatively
low activity levels in the economy, are expected to
continue to exert pressure on the bank's interest margin,
also in nominal terms.
Net income from banking services and other income
At the end of the 4th
quarter, net commission income
totalled NOK 438 million, compared with NOK 394
million at the same time last year.
With effect from 1 July 2008, SpareBank 1 Nord-Norge
waived the usage and monthly fees for card and electronic
transmission services for prioritised customers. The bank
will strive to compensate for the reduced income as a
result of this change by increasing other income and
reducing costs.
Seen in isolation, net commission income in the 4th
quarter
amounted to NOK 121 million, compared with NOK 122
million in the preceding quarter and NOK 100 million in
the 4th
quarter of 2008.
In the 1st quarter of 2009, NOK 20 million was recognised
as other income in the consolidated accounts following the
sale of the group's factoring business from SpareBank 1
Finans Nord-Norge AS to SpareBank 1 Gruppen Finans
Holding AS.
Income from investment securities
Net income from investment securities at the end of the 4th
quarter of 2009 amounted to NOK 479 million, divided as
follows:
Result from SpareBank 1 Gruppen NOK 175 million
Result from SpareBank 1
Boligkreditt
Result from BN Bank
Income - badwill BN Bank
Amortised net lesser value book as
income BN Bank
Dividends
Net gains on shares
NOK 13 million
NOK 28 million
NOK 56 million
NOK 8 million
NOK 23 million
NOK 118 million
Net gains on bonds NOK 22 million
Net gains on foreign exchange and
financial derivatives
NOK 36 million
Compared with the end of the 4th
quarter of 2008, the net
result from investment securities rose by NOK 563
million. This improvement is first and foremost a
consequence of last year's write-downs of securities being
replaced by book gains in 2009.
For the 4th
quarter seen in isolation, the net result of
investment securities was NOK 210 million, divided as
follows:
Result from SpareBank 1 Gruppen NOK 36 million
Result from SpareBank 1
Boligkreditt
Result from BN Bank
Income - badwill BN Bank
Amortised net lesser value book as
income BN Bank
Dividends
Net gains on shares
NOK 4 million
NOK 10 million
NOK 56 million
NOK 1 million
NOK 17 million
NOK 85 million
Net gains on bonds - NOK 2 million
Net gains on foreign exchange and
financial derivatives
NOK 3 million
On 1 July 2008, the bank completed a reclassification of
large parts of the fixed income trading portfolio from the
category "Fair value with value changes over the income
statement" to categories that are assessed at amortised cost.
This included NOK 3,807 million of the portfolio totalling
NOK 4.981 million at 30 June 2008. Had such a
reclassification not been made, further unrealised losses of
3/22
NOK 212 million on this portfolio would have been
charged to the income statement from 1 July 2008 to 31
December 2008 as a result of increased credit spreads.
This unrealised loss would have been reduced to NOK 18
million as at 31 December 2009, without such
reclassification. Previously written-down amounts on this
part of the portfolio as at 30 June 2008 amounted to NOK
112 million and are now included as income (amortised)
over the remaining life of each of the securities involved.
As at the end of the 4th
quarter of 2009, this inclusion of
income totalled NOK 26 million. As at 31 December 2009,
the average maturity of the reclassified part of the portfolio
has been assessed at two years. The reclassified portfolio
has been assessed with regard to permanent impairment in
value. As at 31 December 2008 such write-downs were
made on two of the bank's investments, involving NOK 46
million. Further write-downs of an individual security have
been made in 2009 in the amount of NOK 17 million.
Reference is made to the relevant note in the quarterly
accounts.
Operating expenses
Ordinary operating expenses at the end of the 4th quarter
of 2009 totalled NOK 972 million, up by NOK 1 million
or 0.1 per cent compared with 2008.
Personnel costs rose by NOK 45 million, while
administration costs, depreciation and other operating
expenses were cut by NOK 44 million. The increase in
personnel costs is first and foremost a result of allocations
in 2009 of NOK 35 million for the group's profit sharing
with the employees .No such allocation was made in
2008. In terms of average total assets expenses accounted
for 1.49 per cent, a reduction of 0.09 percentage points
compared with the same period last year.
The group's cost ratio was 45.0 per cent in 2009 compared
with 59.0 per cent in 2008.
For the 4th
quarter in isolation, ordinary operating expenses
totalled NOK 276 million compared with NOK 227
million in the preceding quarter and NOK 247 million in
the 4th
quarter of 2008
The rise in operating expenses in the 4th
quarter, compared
with the 3rd
quarter, came from the following:
Allocations to bonuses/profit sharing NOK 20 million
Increase in allocation for social
security contributions NOK 3 million
Increased personnel costs subsidiaries NOK 4 million
Increased IT costs NOK 11 million
Increased admin. expenses subsidiaries NOK 4 million
Increase in other expenses NOK 12 million
Total increase NOK 54 million
At the end of 2009, the group employed 778 man-years, of
which 690 in the parent bank. The corresponding figures in
2008 were 821 and 724 respectively.
Against the backdrop of continued expected weak growth,
cost-reducing measures have been introduced. This work
will be continued, including possible measures aimed at
further enhancing overall efficiency within the areas of
distribution and staff levels.
Net losses and commitments in default
As at 31 December 2009, the group's net losses on loans
totalled NOK 185 million, of which unspecified write-
downs and changes in the long-term monitoring portfolio
accounted for NOK 36 million. Net losses in the corporate
market aggregated NOK 163 million, while in the retail
market they totalled NOK 22 million.
Seen in isolation, net losses in the 4th
quarter totalled NOK
44 million.
Net non-performing loans and doubtful commitments
totalled NOK 571 million as at 31 December 2009,
representing 1.19 per cent of total loans, up by NOK 18
million at the same time in 2008.
Group specific loss write-downs in the 4th
quarter of 2009
totalled NOK 228 million, NOK 21 million more than in
the preceding quarter. The increase in the 4th
quarter, and
the total for 2009 as a whole compared with 2008, is
largely ascribable to losses on a small number of
individual commitments. Although, overall, there has been
an increase in the number of defaults, there are at present
few new bankruptcies and unexpected events involving
commitments. The bank is still to a smaller extent
observing a weaker performance in certain sectors or in the
portfolio generally
As a result of the weak economic situation, the group has
increased unspecified write-downs by NOK 5 million in
the 4th
quarter. Provisions for unspecified losses
represented 0.49 per cent of the group's total loans as at 31
December 2009.
The bank's scoring models for loans made to the corporate
market show a significant rise in the high risk share. This
change, however, is largely attributable to the model basis
having been changed in June 2009 to calculate the
probability of default as a long-term average throughout an
economic cycle, as against point-in-time as was previously
the case. The increased share of high risk is, however, also
due to impairment in the financial soundness and
economic status of the bank's corporate customers.
A comparison of the portfolio at 31 December 2009
compared with 31 December 2008, using the new scoring
models at both dates, shows little change in the risk.
In the opinion of the main Board of Directors, the quality
of the bank's lending portfolio remains good, and every
effort is being made to deal effectively with non-
performing loans and doubtful commitments throughout
the group. As a result of the weakened prospects nationally
and internationally, however, we still expect a higher loss
level compare with the very low level seen over the last
couple of year.
Taxes
The group's tax charge for 2009 is estimated at NOK 143
million. In the parent bank's accounts, the tax basis is
reduced by permanent differences and the effect of the
exemption model. According to IFRS, wealth tax is not a
tax charge and NOK 7 million has therefore been charged
to the income statement as part of other operating
expenses.
4/22

Total assets
The group's total assets amounted to NOK 64,239 million
as at 31 December 2009. This is NOK 1,268 million or 2
per cent lower than one year earlier.
Lending
The group's gross lending amounted to NOK 48,180
million at 31 December 2009. This is 6.0 per cent lower
than at 31 December 2008. As at 31 December 2009, loans
totalling NOK 10,881 million with collateral in the form of
mortgages on housing has been transferred to SpareBank 1
Boligkreditt AS. The growth in lending, including these
loans, was 4.0 per cent. Growth in the retail market was
8.4 per cent, whilst growth in the corporate market and the
public sector was down 4.8 per cent. Including loans
transferred to SpareBank 1 Boligkreditt, the percentage of
loans to the retail market was somewhat higher at the end
of the 4th
quarter and accounted for 69 per cent of total
lending at 31 December 2009.
The financial crisis, with the diminishing economic
growth, has brought about reduced lending growth. The
immediate future is expected to be characterised by a weak
macro-economy, with relatively low growth in lending,
especially in the corporate market. However, the main
Board of Directors still anticipates some lending growth
and increased market shares. As regards new loans,
particular emphasis is placed on customers' ability to
service their outstanding loans and on a satisfactory level
of collateral security to ensure that credit risk is
maintained at an acceptable level.
Savings and investments
As at 31 December 2009, the group had customer deposits
aggregating NOK 34,877 million. This is NOK 305
million or 0.9 per cent higher than one year earlier. 5.7 per
cent of the rise came from the retail market, 20.2 per cent
from the public sector market, while the volume of
deposits from the corporate market declined by 15.1 per
cent.
Portfolio of certificates and bonds
At 31 December 2009, the group's portfolio of certificates
and bonds aggregated NOK 8,893 million. The
corresponding figure at 30 September 2009 and 31
December 2008 was NOK 10,378 and NOK 6,756 million
respectively. The portfolio of interest-bearing papers is
still higher than in previous years as a result of:
• Increased liquidity reserves in the form of
certificates and Treasury bills
• The transfer of mortgage loans to SpareBank 1
Boligkreditt results in an increase in the portfolio
of covered bonds (and reduced lending)
• Use of the authorities swap arrangement for
covered bonds involves accounting-related
incorporation on a gross basis, which in turn
means a parallel increase in assets (including
certificates) and liabilities.
The increase in the certificates and bonds portfolio entails
only a small degree of increased risk.
Liquidity
Deposits from customers represent the bank's main
funding source. The deposit-to-loan ratio at 31 December
2009 was 72.4 per cent, up 5.0 percentage points on the
preceding year. Apart from equity and deposits from
customers, the bank's remaining funding represents first
and foremost long-term borrowings from the capital
markets. The bank's access to liquidity has been
satisfactory throughout the period of unrest in the
international markets. The bank's strategic goal is to
maintain the overall funding risk at a low level.
Basel II
With effect from 1 January 2007, new capital adequacy
rules and regulations (Basel II – EU’s new directive for
capital coverage) were implemented in Norway. The new
rules and regulations are based on a proposal for a new
standard for capital adequacy calculations from Bank for
International Settlements (BIS).
With effect from 1 January 2007, SpareBank 1 Nord-
Norge was given permission by the Financial Supervisory
Authority of Norway (FSAN) to apply internal measuring
methods (Internal Rating-Based Approach) to credit risk.
From 2007, therefore, the statutory minimum requirement
for capital adequacy for credit risk was based on the
Bank’s internal risk assessment. The new rules and
regulations make the statutory minimum capital adequacy
requirement more risk-sensitive, so that the capital
adequacy requirement will to a larger extent correspond to
the risk in the underlying portfolios. The use of internal
measuring methods involves comprehensive demands with
regard to the Bank’s organisation, competence, risk
models and risk management systems.
As a result of transition rules in the new regulations, IRB
banks will nevertheless only experience the full effect of
the reduced regulatory requirements in 2010.It has now
been resolved that this is to be postponed and the
transitional rules for 2009 will continue in 2010.
Equity capital and capital adequacy
At the 31 December 2009, the Group’s core capital
adequacy was 11.94 per cent (9.06 per cent) of the
calculation base. The total capital adequacy was 14.26
percent (10.56 per cent). The calculation in 2009 is made
in accordance with the transitional rules and regulations
provided by FSAN.
As at 31.12.09, the Parent Bank’s capital adequacy ratio
was 13.44 per cent (10.8 per cent), and the core capital
ratio 11.83 per cent (9.61 per cent).
The bank raised a subordinated loan of NOK 350 million
in July 2009. Further subordinated loan capital amounting
to NOK 100 million was raised in the 4th
quarter of 2009.
The new subordinated loan capital was raised to replace a
EURO 50 million subordinated loan with redemption right
(call/step up) at the beginning of 2010.
The group has been given permission from FSAN to use
proportional consolidation in the capital adequacy
reporting of stakes in SpareBank 1Boligkreditt and
SpareBank 1 Næringskreditt.
The bank's stated goal is a core capital ratio of 10% or
higher. The bank's capital strength is considered to be
satisfactory.
5/22

The Bank’s equity certificate holders
The Bank’s equity certificate capital was NOK 896 million
divided into 17,912,073 equity certificates. As at 01.01.09,
the equity certificate ratio was estimated at 34.54 per cent.
The number of equity certificate holders was 8,207 as at
31 December 2009, down 164 during the last 12 months.
The number of equity certificate holders domiciled in
North Norway was 2,199. A summary of the Bank’s 20
largest equity certificate owners is included in the notes to
the accounts.
Equity certificates and dividend policy
A new act and regulations relating to equity certificates,
formerly primary capital certificates) came into effect on 1
July 2009. The new regulations imply, inter alia, that
savings banks' equity certificates will to a greater extent be
treated in line with shares. The regulations imply a greater
degree of equality between the various owner groups in
saving banks and will to a great extent minimise earlier
challenges reacting to dilution of equity certificate holders
in the case of payment of cash dividends. The new
legislation is positive for equity certificates as a security.
On the basis of the new legislation, the main Board of
Directors has adopted a new dividend policy for the bank.
Taking into account the bank's financial strength, the bank
aims at up to 50 per cent of the profit being allocated to
dividends (cash dividend and gifts and endowments).
The bank's other adaptations to the new regulations will be
considered prior to the ordinary meeting of the bank's
Supervisory Board in the spring of 2010.
Concluding remarks –prospects
The result for 2009 is regarded as very good especially
taking into consideration the difficult macroeconomic
situation. The Bank’s core operations remain good.
The macro-economic situation is expected to remain
relatively weak in Norway and North Norway in the near
future. This will mean lower credit demand than is normal,
especially in the corporate market, and a relatively high
level of credit losses. A low level of interest rates is likely
to continue to result in downward pressure on the bank’s
net interest income.
The bank considers balanced growth both for deposits and
loans to be important. Emphasis will be placed on
increasing other income through the sale of different
products and services. Lending growth will continue to be
conditional upon good credit quality.
As a result of expected weak growth, the Bank will
continue to focus sharply on cost-reducing measures. This
includes possible measures aimed at enhancing overall
effectiveness within distribution and in staff levels.
Tromso, 10 February 2010
The Main Board of Directors of SpareBank 1 Nord-
Norge
6/22
Key figures group
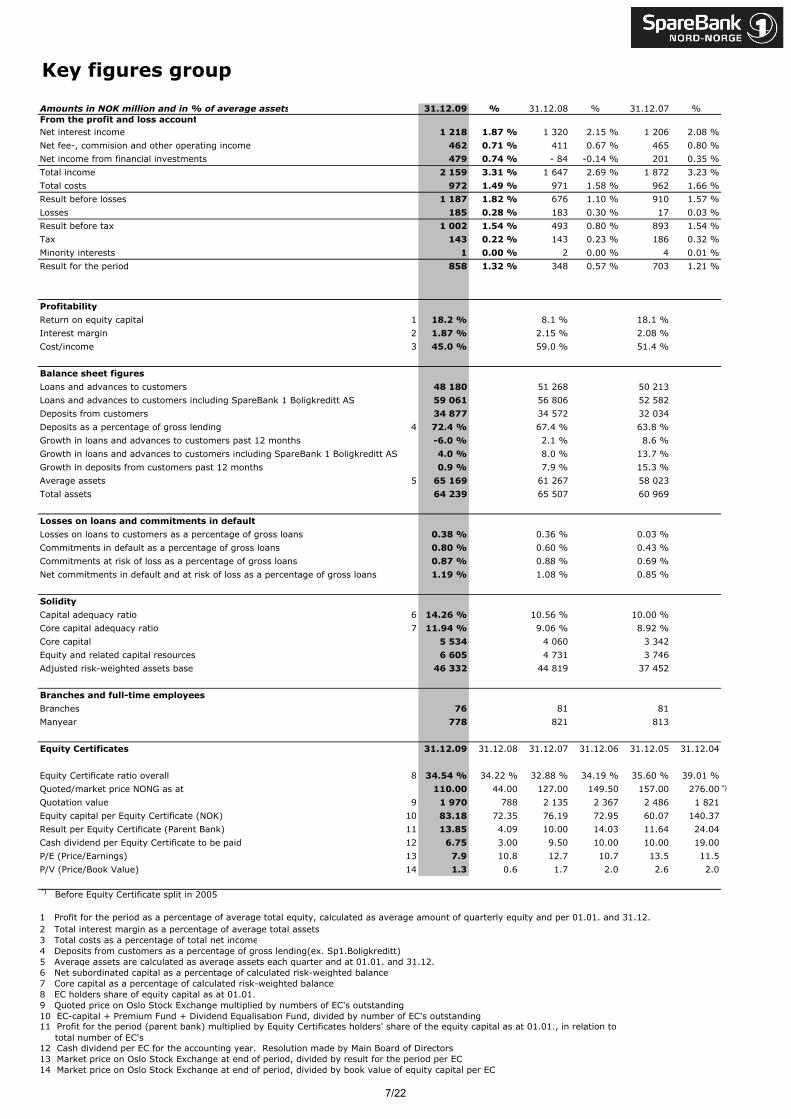
Amounts in NOK million and in % of average assets 31.12.09 % 31.12.08 % 31.12.07 %From the profit and loss accountNet interest income 1 218 1.87 % 1 320 2.15 % 1 206 2.08 %
Net fee-, commision and other operating income 462 0.71 % 411 0.67 % 465 0.80 %
Net income from financial investments 479 0.74 % - 84 -0.14 % 201 0.35 %
Total income 2 159 3.31 % 1 647 2.69 % 1 872 3.23 %
Total costs 972 1.49 % 971 1.58 % 962 1.66 %
Result before losses 1 187 1.82 % 676 1.10 % 910 1.57 %
Losses 185 0.28 % 183 0.30 % 17 0.03 %
Result before tax 1 002 1.54 % 493 0.80 % 893 1.54 %
Tax 143 0.22 % 143 0.23 % 186 0.32 %
Minority interests 1 0.00 % 2 0.00 % 4 0.01 %
Result for the period 858 1.32 % 348 0.57 % 703 1.21 %
Profitability
Return on equity capital 1 18.2 % 8.1 % 18.1 %
Interest margin 2 1.87 % 2.15 % 2.08 %
Cost/income 3 45.0 % 59.0 % 51.4 %
Balance sheet figures
Loans and advances to customers 48 180 51 268 50 213
Loans and advances to customers including SpareBank 1 Boligkreditt AS 59 061 56 806 52 582
Deposits from customers 34 877 34 572 32 034
Deposits as a percentage of gross lending 4 72.4 % 67.4 % 63.8 %
Growth in loans and advances to customers past 12 months -6.0 % 2.1 % 8.6 %
Growth in loans and advances to customers including SpareBank 1 Boligkreditt AS 4.0 % 8.0 % 13.7 %
Growth in deposits from customers past 12 months 0.9 % 7.9 % 15.3 %
Average assets 5 65 169 61 267 58 023
Total assets 64 239 65 507 60 969
Losses on loans and commitments in default
Losses on loans to customers as a percentage of gross loans 0.38 % 0.36 % 0.03 %
Commitments in default as a percentage of gross loans 0.80 % 0.60 % 0.43 %
Commitments at risk of loss as a percentage of gross loans 0.87 % 0.88 % 0.69 %
Net commitments in default and at risk of loss as a percentage of gross loans 1.19 % 1.08 % 0.85 %
Solidity
Capital adequacy ratio 6 14.26 % 10.56 % 10.00 %
Core capital adequacy ratio 7 11.94 % 9.06 % 8.92 %
Core capital 5 534 4 060 3 342
Equity and related capital resources 6 605 4 731 3 746
Adjusted risk-weighted assets base 46 332 44 819 37 452
Branches and full-time employees
Branches 76 81 81
Manyear 778 821 813
Equity Certificates 31.12.09 31.12.08 31.12.07 31.12.06 31.12.05 31.12.04
Equity Certificate ratio overall 8 34.54 % 34.22 % 32.88 % 34.19 % 35.60 % 39.01 %
Quoted/market price NONG as at 110.00 44.00 127.00 149.50 157.00 276.00
Quotation value 9 1 970 788 2 135 2 367 2 486 1 821
Equity capital per Equity Certificate (NOK) 10 83.18 72.35 76.19 72.95 60.07 140.37
Result per Equity Certificate (Parent Bank) 11 13.85 4.09 10.00 14.03 11.64 24.04
Cash dividend per Equity Certificate to be paid 12 6.75 3.00 9.50 10.00 10.00 19.00
P/E (Price/Earnings) 13 7.9 10.8 12.7 10.7 13.5 11.5
P/V (Price/Book Value) 14 1.3 0.6 1.7 2.0 2.6 2.0
Before Equity Certificate split in 2005
13 Market price on Oslo Stock Exchange at end of period, divided by result for the period per EC 14 Market price on Oslo Stock Exchange at end of period, divided by book value of equity capital per EC
1 Profit for the period as a percentage of average total equity, calculated as average amount of quarterly equity and per 01.01. and 31.12. 2 Total interest margin as a percentage of average total assets 3 Total costs as a percentage of total net income4 Deposits from customers as a percentage of gross lending(ex. Sp1.Boligkreditt) 5 Average assets are calculated as average assets each quarter and at 01.01. and 31.12. 6 Net subordinated capital as a percentage of calculated risk-weighted balance 7 Core capital as a percentage of calculated risk-weighted balance 8 EC holders share of equity capital as at 01.01. 9 Quoted price on Oslo Stock Exchange multiplied by numbers of EC's outstanding 10 EC-capital + Premium Fund + Dividend Equalisation Fund, divided by number of EC's outstanding 11 Profit for the period (parent bank) multiplied by Equity Certificates holders' share of the equity capital as at 01.01., in relation to total number of EC's 12 Cash dividend per EC for the accounting year. Resolution made by Main Board of Directors
*)
*)
7/22

31.12.07 4Q08 4Q09 31.12.08 31.12.09 31.12.09 31.12.08 4Q09 4Q08 31.12.07
3 216 1 156 588 4 285 2 731 Interest income 2 808 4 334 603 1 171 3 250
2 048 828 293 3 021 1 591 Interest costs 1 590 3 014 286 822 2 044
1 168 328 295 1 264 1 140 Net interest income 1 218 1 320 317 349 1 206
427 106 124 424 449 Fee- and commission income 526 478 145 122 502
67 23 24 85 87 Fee- and commission costs 88 84 24 22 65
7 2 2 6 5 Other operating income 24 17 3 3 28
367 85 102 345 367 Net fee-, commision and other operating income 462 411 124 103 465
11 2 17 15 22 Dividend 23 16 17 2 11
60 0 - 38 114 144 Income from investments 281 277 109 220 231
- 66 - 163 104 - 349 233 Net gain from investments in securities 175 - 377 84 - 195 - 41
5 - 161 83 - 220 399 Net income from financial investments 479 - 84 210 27 201
1 540 252 480 1 389 1 906 Total income 2 159 1 647 651 479 1 872
410 87 131 398 441 Personnel costs 508 463 151 107 473
260 72 79 278 264 Administration costs 284 304 84 79 293
38 10 9 37 34 Ordinary depreciation 49 62 12 22 55
149 37 35 156 153 Other operating costs 131 142 29 39 141
857 206 254 869 892 Total costs 972 971 276 247 962
683 46 226 520 1 014 Result before losses 1 187 676 375 232 910
14 104 37 168 170 Losses 185 183 44 114 17
669 - 58 189 352 844 Result before tax 1 002 493 331 118 893
177 19 16 138 126 Tax 143 143 20 18 186
492 - 77 173 214 718 Result for the period 859 350 311 100 707
Majority interest 858 348 310 99 703
Minority interests 1 2 1 1 4
Result per Equity Certificate
10.00 -1.47 3.34 4.09 13.85 Result per Equity Certificate (Parent Bank) 16.39 6.65 5.92 1.89 14.30
10.00 -1.47 3.34 4.09 13.85 Diluted result per Equity Certificate 16.39 6.65 5.92 1.89 14.30
Allocation of result for the period:
Fund for Evaluation Differences 119 133 211
168 73 248 Dividend Equalisation Fund 248 73 168
83 40 69 Donations 69 40 83
241 101 401 Saving Bank's Fund 422 102 241
492 214 718 Total allocations 858 348 703
492 -77 173 214 718 Result for the period 859 350 311 100 7070 0 0 0 0 Effective part of change in fair market value in cash flow hedging -18 0 -18 0 00 0 0 0 0 Net change in fair market value of investment in joint ventures 0 -17 0 0 00 0 0 6 -6 Net change in fair market value of financial assets available for sale -6 6 0 0 00 0 0 2 -2 Tax on other comprehensive income -7 2 -5 0 00 0 0 4 -4 Other comprehensive income for the period -17 -13 -13 0 0
492 -77 173 218 714 Total comprehensive income for the period 842 337 298 100 707
Majority interest 841 335 297 99 703Minority interests 1 2 1 1 4
Totalresult per Equity Certificate
10.00 -1.47 3.34 4.17 13.76 Total result per Equity Certificate (Parent Bank) 16.08 6.44 5.69 1.91 14.30
10.00 -1.47 3.34 4.17 13.76 Diluted total result per Equity Certificate 16.08 6.44 5.69 1.91 14.30
Tax on other comprehensive income:0 0 0 0 0 Effective part of change in fair market value in cash flow hedging -5 0 -5 0 00 0 0 2 -2 Net change in fair market value of financial assets available for sale -2 2 0 0 00 0 0 2 -2 Tax on other comprehensive income -7 2 -5 0 0
Group
Comprehensive income
Statement of comprehensive incomeParent Bank
(Amounts in NOK million)
8/22

31.12.07 31.12.08 31.12.09 31.12.09 31.12.08 31.12.07
Assets2 484 3 290 2 159 Cash and balances with central banks 2 159 3 290 2 4841 726 1 964 2 671 Loans and advances to credit institutions 908 143 330
48 945 49 491 46 431 Loans and advances to customers 48 180 51 268 50 213 130 191 216 - Individual write-downs for impaired value 228 201 134 166 196 227 - Collective write-downs for impaired value 238 204 170
48 649 49 104 45 988 Net loans and advances to customers 47 714 50 863 49 909 423 346 410 Shares 560 472 547
4 856 6 749 8 891 Certificates and bonds 8 893 6 756 4 856 276 647 561 Financial derivatives 561 647 276 227 284 248 Investments in Group Companies 0 0 0 717 1 092 1 586 Investments in assosiated companies and joint ventures 2 396 1 796 1 248 125 126 110 Property, plant and equipment 469 489 567 20 0 11 Intangible assets 1 1 15
665 937 554 Other assets 578 1 050 737
60 168 64 539 63 189 Total assets 64 239 65 507 60 969
Liabilities2 415 3 720 6 869 Deposits from credit institutions 6 868 3 708 2 414
32 053 34 599 34 892 Deposits from customers 34 877 34 572 32 03419 665 19 746 14 162 Debt securities in issue 14 162 19 746 19 665
297 367 319 Financial derivatives 319 367 297 918 878 1 092 Other liabilities 1 242 1 083 1 051
0 112 0 Deferred tax liabilities 3 112 01 254 1 461 1 608 Subordinated loan capital 1 608 1 461 1 254
56 602 60 883 58 942 Total liabilities 59 079 61 049 56 715
Equity
841 896 896 Equity Certificate capital 896 896 841
76 123 123 Equity Certificate premium reserve 123 123 76
364 277 471 Dividend Equalisation Fund 471 277 364
2 121 2 221 2 624 The Savings Bank's Fund 2 724 2 314 2 270
164 133 133 Donations 133 133 164
0 6 0 Fund for unrealised gains 0 6 0
0 0 0 Other equity capital 810 703 530
Minority interests 3 6 93 566 3 656 4 247 Total equity 5 160 4 458 4 254
60 168 64 539 63 189 Total liabilities and equity 64 239 65 507 60 969
Statement of financial positionParent Bank
(Amounts in NOK million)
Group
9/22

(Amounts in NOK million) 4Q09 3Q09 2Q09 1Q09 4Q08 3Q08 2Q08 1Q08 4Q07
Interest income 603 635 702 868 1 171 1 126 1 049 988 953
Interest costs 286 324 415 565 822 777 736 679 629
Net interest income 317 311 287 303 349 349 313 309 324
Fee- and commission income 145 143 126 112 122 119 126 111 126
Fee- and commission costs 24 21 23 20 22 26 20 16 16
Other operating income 3 - 1 0 22 3 1 6 7 13
Net fee-, commision and other operating income 124 121 103 114 103 94 112 102 123
Dividend 17 1 5 0 2 1 5 8 0
Income from investments 109 97 68 7 220 8 30 19 60
Net gain from investments in securities 84 48 - 18 61 - 195 - 65 - 2 - 115 4
Net income from financial investments 210 146 55 68 27 - 56 33 - 88 64
Total income 651 578 445 485 479 387 458 323 511
Personnel costs 151 124 117 116 107 124 119 113 116
Administration costs 84 59 66 75 79 71 74 80 73
Ordinary depreciation 12 12 12 13 22 13 13 14 17
Other operating costs 29 32 31 39 39 25 31 47 40
Total costs 276 227 226 243 247 233 237 254 246
Result before losses 375 351 219 242 232 154 221 69 265
Losses 44 39 49 53 114 41 25 3 8
Result before tax 331 312 170 189 118 113 196 66 257
Tax 20 50 36 37 18 49 48 28 48
Minority interests 1 0 0 0 1 0 1 0 1
Result for the period 310 262 134 152 99 64 147 38 208
Profitability
Return on equity capital 25.23 % 22.71 % 11.56 % 13.13 % 9.27 % 5.98 % 13.67 % 3.62 % 21.40 %
Interest margin 1.97 % 1.88 % 1.75 % 1.88 % 2.21 % 2.31 % 2.10 % 2.06 % 2.15 %
Cost/income 42.40 % 39.27 % 50.79 % 50.10 % 51.57 % 60.21 % 51.75 % 78.64 % 48.14 %
Balance sheet figures
Loans and advances to customers 48 180 49 413 50 473 50 900 51 268 50 414 49 907 49 815 50 213
Deposits from customers 34 877 34 256 36 129 34 078 34 572 32 148 33 793 31 106 32 034
Deposits as a percentage of gross lending 72.4 % 69.3 % 71.6 % 67.0 % 67.4 % 63.8 % 67.7 % 62.4 % 63.8 %
Growth in loans and advances to customers including SpareBank 1 Boligkreditt AS 4.0 % 5.6 % 5.1 % 7.4 % 8.0 % 9.0 % 11.0 % 11.2 % 13.7 %
Growth in deposits from customers past 12 months 0.9 % 6.6 % 6.9 % 9.6 % 7.9 % 6.1 % 4.3 % 7.3 % 15.3 %
Average assets 65 169 65 402 65 678 64 537 61 267 60 207 59 983 59 900 58 023
Total assets 64 239 64 574 67 961 63 566 65 507 60 879 60 148 58 831 60 969
Losses on loans and commitments in default
Losses on loans to customers as a percentage of gross loans 0.37 % 0.32 % 0.39 % 0.42 % 0.89 % 0.33 % 0.20 % 0.02 % 0.06 %
Commitments in default as a percentage of gross loans 0.80 % 0.79 % 0.93 % 0.88 % 0.60 % 0.55 % 0.32 % 0.34 % 0.43 %
Commitments at risk of loss as a percentage of gross loans 0.87 % 0.83 % 0.76 % 0.74 % 0.88 % 0.93 % 0.95 % 0.75 % 0.69 %
Net commitments in default and at risk of loss as a percentage of gross loans 1.19 % 1.21 % 1.34 % 1.27 % 1.08 % 1.11 % 0.98 % 0.85 % 0.85 %
Solidity
Capital adequacy ratio 14.26 % 12.07 % 11.08 % 11.73 % 10.56 % 11.26 % 10.93 % 11.71 % 10.00 %
Core capital adequacy ratio 11.94 % 10.08 % 9.65 % 10.13 % 9.06 % 9.35 % 9.44 % 9.54 % 8.92 %
Core capital 5 534 4 683 3 914 4 059 4 060 3 448 3 415 3 403 3 342
Equity and related capital resources 6 605 5 609 4 494 4 699 4 731 4 151 3 955 4 175 3 746
Basel I risk-weighted assets base 46 332 46 476 40 559 40 069 44 819 36 862 36 191 35 665 37 452
Result from the Group's quarterly accounts
10/22

Parent Bank
31.12.08 31.12.09
Equity Certificate capital 896 896
Equity Certificate premium reserve 123 123
Dividend Equalisation Fund 277 471
Set aside dividend - 54 - 121
Share Fund Fair Value Options - 5 - 30
A. Equity attributable to Equity Certificate holders of the Bank 1 237 1 339
The Savings Bank's Fund 2 221 2 623
Allocated dividends to ownerless capital 0 - 161
Donations 133 133
Share Fund Fair Value Options - 10 - 57
B. Total ownerless capital 2 344 2 538
Equity Certificate Ratio overall (A/(A+B)) 34.54 % 34.54 %
ECC ratio overall
(Amounts in NOK million)
(Amounts in NOK million) PCC capital
Premium
Fund
Dividend
Equalisation
Fund
Saving Bank's
Fund
Donations
Fund
Fair value
reserve
Fund for
evaluation
differences
Period
result
Total
Majority
interests
Minority
interests Total equity
Group
Equity at 01.01.08 841 76 364 2 270 164 530 4 245 9 4 254
Total comprehensive income for the
Period result 73 102 40 133 348 2 350Other comprehensive income:
Net change in fair market value of
investment in joint ventures - 58 40 - 18 - 18Tax on other comprehensive income Total other comprehensive income - 58 6 40 - 12 - 12Total comprehensive income for the period 73 44 40 6 173 336 2 338
Transactions with owners
Dividend issue 55 47 102 102Set aside for dividend payments 54 54 54Reversal of dividend payments - 54 - 54 - 54Dividend paid - 160 - 160 - 5 - 165Payments from Donations Fund - 71 - 71 - 71Total transactions with owners 55 47 - 160 - 71 - 129 - 5 - 134
Equity at 31.12.08 896 123 277 2 314 133 6 703 4 452 6 4 458
Equity at 01.01.09 896 123 277 2 314 133 6 703 4 452 6 4 458
Total comprehensive income for the
Period result 127 422 69 120 738 1 739Other comprehensive income:
Net change in fair market value of
investment in joint ventures - 12 - 13 - 25 - 1 - 26Net change in fair market value of financial
assets available for sale - 6 - 6 - 6Tax on other comprehensive income Total other comprehensive income - 12 - 6 - 13 - 31 - 1 - 32Total comprehensive income for the period 127 410 69 - 6 107 707 707
Transactions with owners
Dividend issue Set aside for dividend payments 121 121 121Reversal of dividend payments Dividend paid - 54 - 54 - 2 - 56Payments from Donations Fund - 69 - 69 - 1 - 70Total transactions with owners 67 - 69 - 2 - 3 - 5
Equity at 31.12.09 896 123 471 2 724 133 810 5 157 3 5 160
Quarterly Report - Changes in equity
11/22

31.12.07 31.12.08 31.12.09 31.12.09 31.12.08 31.12.07
669 352 844 Result before tax 1 002 493 893 38 36 34 + Ordinary depreciation 49 61 55 0 6 0 + Write-downs, gains/losses fixed assets 0 11 6
14 168 170 + Losses on loans and guarantees 185 183 17 177 138 126 - Tax 142 143 193
0 0 0 - Group contributions 0 0 0 158 160 54 - Dividend paid on Equity Certificates 54 160 158
386 264 868 Provided from the year's operations 1 040 445 620
- 316 76 - 22 Change in sundry liabilities: + increase/ - decrease - 89 125 - 323 150 - 623 485 Change in various claims: - increase/ + decrease 545 - 671 91
-3 641 - 623 2 946 Change in gross lending to and claims on customers: - increase/ + decrease 2 964 -1 137 -4 070 15 -1 816 -2 232 Change in short term-securities: - increase/ + decrease -2 225 -1 825 - 50
4 179 2 546 293 Change in deposits from and debt owed to customers: + increase/ - decrease 305 2 538 4 250 432 1 305 3 149 Change in debt owed to credit institutions: + increase/ - decrease 3 160 1 294 449
1 205 1 129 5 487 A. Net liquidity change from operations 5 700 769 967
- 68 - 45 - 17 - Investment in fixed assets - 33 - 62 - 117 1 2 1 + Sale of fixed assets 4 70 10
- 201 - 432 - 458 Change in holdings of long-term securities: - increase/ + decrease - 600 - 548 - 313
- 268 - 475 - 474 B. Liquidity change from investments - 629 - 540 - 420
924 81 -5 584 Change in borrowings through the issuance of securities: + increase/ - decrease -5 584 81 924- 3 309 147 Change in Equity Certificate/subordinated loan capital: + increase/ - decrease 147 309 - 3
921 390 -5 437 C. Liquidity change from financing -5 437 390 921
1 858 1 044 - 424 A + B + C. Total change in liquidity - 366 619 1 4682 352 4 210 5 254 + Liquid funds at the start of the period 3 433 2 814 1 346
4 210 5 254 4 830 = Liquid funds at the end of the period 3 067 3 433 2 814
Liquid funds are defined as cash-in-hand, claims on central banks,plus loans to and claims on credit institutions.
Statement of cash flowsParent Bank
(Amounts in NOK million)
Group
12/22
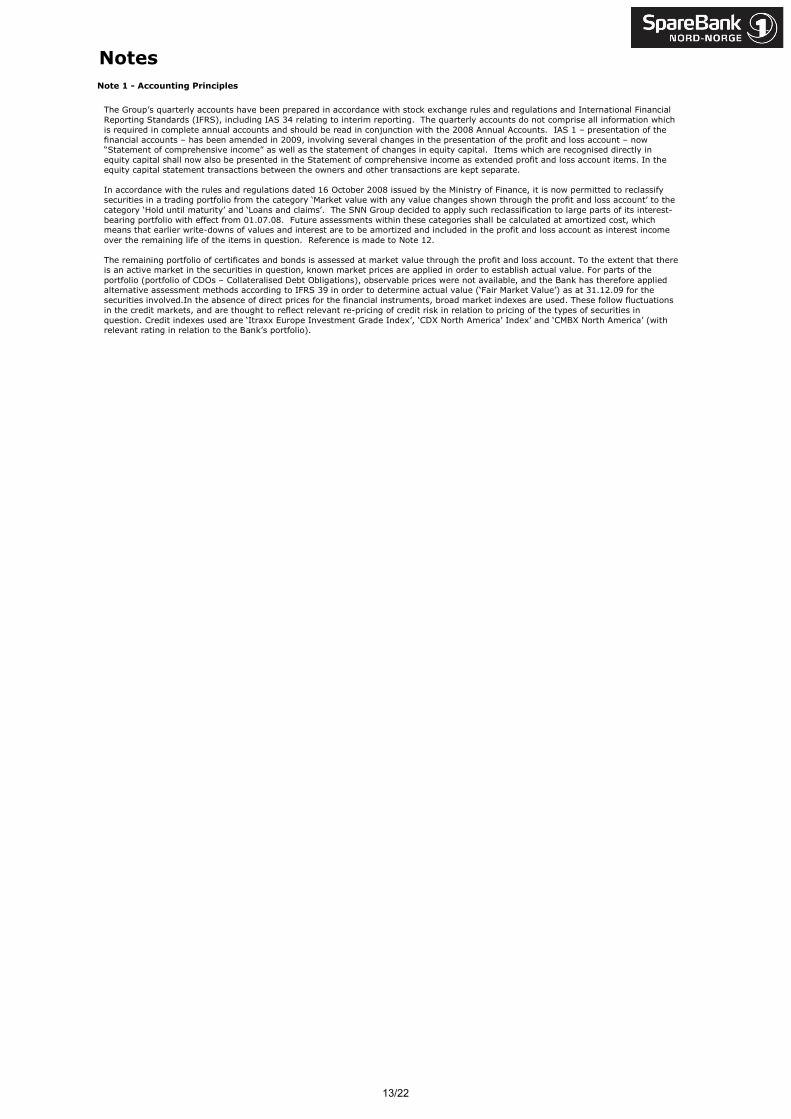
Note 1 - Accounting Principles
Notes
The Group’s quarterly accounts have been prepared in accordance with stock exchange rules and regulations and International Financial
Reporting Standards (IFRS), including IAS 34 relating to interim reporting. The quarterly accounts do not comprise all information which
is required in complete annual accounts and should be read in conjunction with the 2008 Annual Accounts. IAS 1 – presentation of the
financial accounts – has been amended in 2009, involving several changes in the presentation of the profit and loss account – now “Statement of comprehensive income” as well as the statement of changes in equity capital. Items which are recognised directly in
equity capital shall now also be presented in the Statement of comprehensive income as extended profit and loss account items. In the
equity capital statement transactions between the owners and other transactions are kept separate.
In accordance with the rules and regulations dated 16 October 2008 issued by the Ministry of Finance, it is now permitted to reclassify
securities in a trading portfolio from the category ‘Market value with any value changes shown through the profit and loss account’ to the
category ‘Hold until maturity’ and ‘Loans and claims’. The SNN Group decided to apply such reclassification to large parts of its interest-
bearing portfolio with effect from 01.07.08. Future assessments within these categories shall be calculated at amortized cost, which means that earlier write-downs of values and interest are to be amortized and included in the profit and loss account as interest income
over the remaining life of the items in question. Reference is made to Note 12.
The remaining portfolio of certificates and bonds is assessed at market value through the profit and loss account. To the extent that there is an active market in the securities in question, known market prices are applied in order to establish actual value. For parts of the
portfolio (portfolio of CDOs – Collateralised Debt Obligations), observable prices were not available, and the Bank has therefore applied alternative assessment methods according to IFRS 39 in order to determine actual value (‘Fair Market Value’) as at 31.12.09 for the
securities involved.In the absence of direct prices for the financial instruments, broad market indexes are used. These follow fluctuations
in the credit markets, and are thought to reflect relevant re-pricing of credit risk in relation to pricing of the types of securities in
question. Credit indexes used are ‘Itraxx Europe Investment Grade Index’, ‘CDX North America’ Index’ and ‘CMBX North America’ (with relevant rating in relation to the Bank’s portfolio).
13/22
31.12.07 31.12.08 31.12.09 31.12.09 31.12.08 31.12.07
Equity and related capital resources
3 566 3 656 4 247 Core capital eksclusive minority interests 5 157 4 452 4 095
0 0 0 Result for the period 0 0 0
0 0 0 Deduction Fund for Evaluation Differences - 810 - 703 - 380
0 - 6 0 Deduction Fund for unrealised gains 0 - 6 0
- 160 - 54 - 121 Deduction set aside dividend - 121 - 54 - 160
326 421 346 Perpetuan non-call bonds 346 421 326
Share core capital from consolidated financial institutions 1 436 559 0
- 20 0 - 11 Deduction deffered tax - 1 - 1 - 15
- 358 - 501 - 678 Deduction subordinated capital in other financial institutions (50 %) 0 - 146 - 111
- 108 - 80 - 80 Deduction adjusted expected amount lost (50 %) - 82 - 71 - 129
Core capital adequacy reserve (50 %) - 391 - 391 - 284
3 246 3 436 3 703 Core capital 5 534 4 060 3 342
928 1 039 1 262 Subordinated loan capital 1 262 1 039 928
Share supplementary capital from consolidated institutions 282 240 0
- 358 - 501 - 678 Deduction subordinated capital in other financial institutions (50 %) 0 - 146 - 111
- 108 - 80 - 80 Deduction adjusted expected amount lost (50 %) - 82 - 71 - 129
Core capital adequacy reserve (50 %) - 391 - 391 - 284
462 458 504 Supplementary capital 1 071 671 404
3 708 3 894 4 207 Equity and related capital resources 6 605 4 731 3 746
Risk-weighted assets base
21 943 20 235 20 834 Credit risk 22 030 20 235 22 402
6 0 0 Settlement/Delivery risk 0 0 6
1 334 1 102 1 239 Position,foreign exchange and commodity risks 1 364 1 220 1 334
2 896 2 944 2 302 Operational risk 3 117 3 549 3 134
3 289 6 918 7 623 Standardised approach 0 8 472 3 967
Standardised approach consolidated financial institutions 17 028 8 131 0
- 716 -1 002 -1 357 Deduction subordinated capital in other financial institutions (100 %) - 28 - 291 - 221
- 216 - 160 - 160 Deduction adjusted expected amount lost (100 %) - 163 - 143 - 208
Core capital adequacy reserve (100 %) - 782 - 783 - 568
28 536 30 037 30 481 Total risk-weighted assets base - IRB 42 566 40 390 29 846
37 702 39 726 39 126 Basel I risk-weighted assets base 57 915 49 799 39 423
35 817 35 753 31 301 Adjusted risk-weighted assets base 46 332 44 819 37 452
9.06 % 9.61 % 11.83 % Core capital adequacy ratio 11.94 % 9.06 % 8.92 %
1.29 % 1.28 % 1.61 % Supplementary capital adequacy ratio 2.31 % 1.50 % 1.08 %
10.35 % 10.89 % 13.44 % Capital adequacy ratio 14.26 % 10.56 % 10.00 %
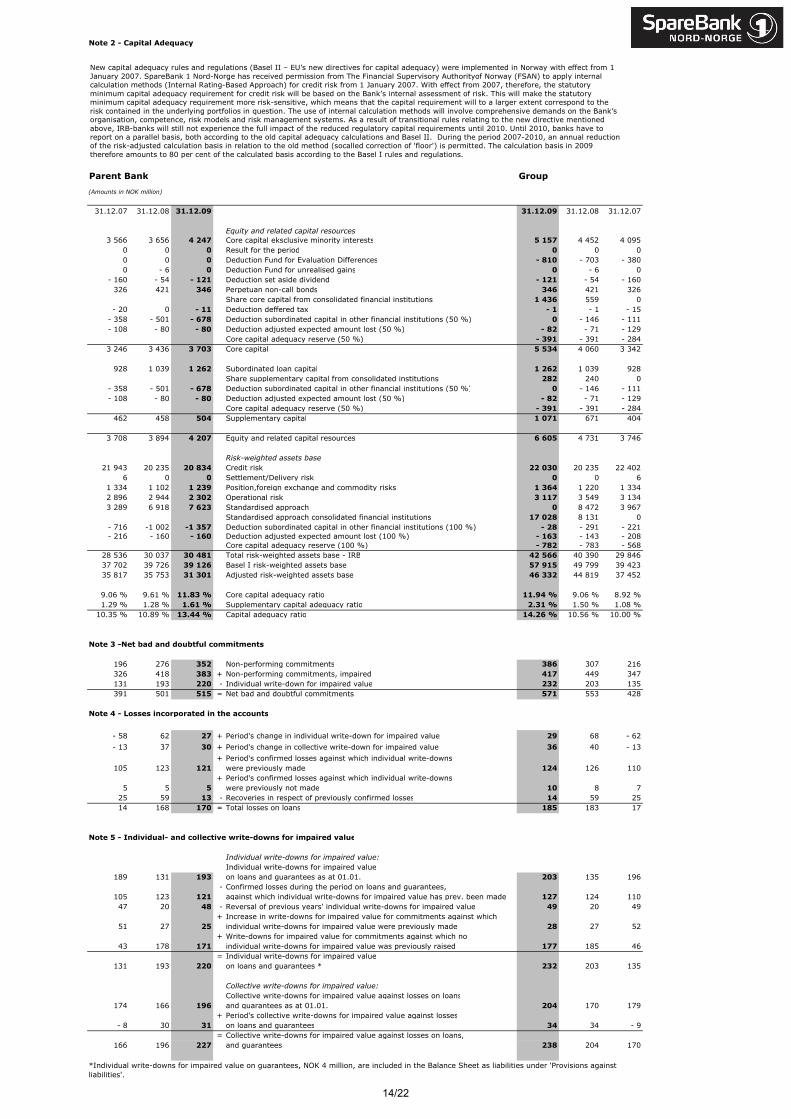
196 276 352 Non-performing commitments 386 307 216
326 418 383 + Non-performing commitments, impaired 417 449 347
131 193 220 - Individual write-down for impaired value 232 203 135
391 501 515 = Net bad and doubtful commitments 571 553 428
- 58 62 27 + Period's change in individual write-down for impaired value 29 68 - 62
- 13 37 30 + Period's change in collective write-down for impaired value 36 40 - 13
+ Period's confirmed losses against which individual write-downs
105 123 121 were previously made 124 126 110
+ Period's confirmed losses against which individual write-downs
5 5 5 were previously not made 10 8 7
25 59 13 - Recoveries in respect of previously confirmed losses 14 59 25
14 168 170 = Total losses on loans 185 183 17
Individual write-downs for impaired value:
Individual write-downs for impaired value
189 131 193 on loans and guarantees as at 01.01. 203 135 196
- Confirmed losses during the period on loans and guarantees,
105 123 121 against which individual write-downs for impaired value has prev. been made 127 124 110
47 20 48 - Reversal of previous years' individual write-downs for impaired value 49 20 49
+ Increase in write-downs for impaired value for commitments against which
51 27 25 individual write-downs for impaired value were previously made 28 27 52
+ Write-downs for impaired value for commitments against which no
43 178 171 individual write-downs for impaired value was previously raised 177 185 46
= Individual write-downs for impaired value
131 193 220 on loans and guarantees * 232 203 135
Collective write-downs for impaired value:
Collective write-downs for impaired value against losses on loans
174 166 196 and guarantees as at 01.01. 204 170 179
+ Period's collective write-downs for impaired value against losses
- 8 30 31 on loans and guarantees 34 34 - 9
= Collective write-downs for impaired value against losses on loans,
166 196 227 and guarantees 238 204 170
*Individual write-downs for impaired value on guarantees, NOK 4 million, are included in the Balance Sheet as liabilities under 'Provisions against
liabilities'.
Note 2 - Capital Adequacy
Group
Note 5 - Individual- and collective write-downs for impaired value
Note 4 - Losses incorporated in the accounts
Note 3 -Net bad and doubtful commitments
Parent Bank
(Amounts in NOK million)
New capital adequacy rules and regulations (Basel II – EU’s new directives for capital adequacy) were implemented in Norway with effect from 1
January 2007. SpareBank 1 Nord-Norge has received permission from The Financial Supervisory Authorityof Norway (FSAN) to apply internal calculation methods (Internal Rating-Based Approach) for credit risk from 1 January 2007. With effect from 2007, therefore, the statutory
minimum capital adequacy requirement for credit risk will be based on the Bank’s internal assessment of risk. This will make the statutory minimum capital adequacy requirement more risk-sensitive, which means that the capital requirement will to a larger extent correspond to the
risk contained in the underlying portfolios in question. The use of internal calculation methods will involve comprehensive demands on the Bank’s organisation, competence, risk models and risk management systems. As a result of transitional rules relating to the new directive mentioned
above, IRB-banks will still not experience the full impact of the reduced regulatory capital requirements until 2010. Until 2010, banks have to report on a parallel basis, both according to the old capital adequacy calculations and Basel II. During the period 2007-2010, an annual reduction of the risk-adjusted calculation basis in relation to the old method (socalled correction of 'floor') is permitted. The calculation basis in 2009
therefore amounts to 80 per cent of the calculated basis according to the Basel I rules and regulations.
14/22

31.12.07 31.12.08 31.12.09 31.12.09 31.12.08 31.12.07
398 305 0 Central government administration and social security administration 1 307 398 181 249 140 Counties and municipalities 170 286 231
2 831 2 562 2 420 Agriculture, forestry, fisheries, hunting and fish farming 2 545 2 694 2 941 21 146 125 Production of crude oil and natural gas 125 146 21
1 359 1 261 1 116 Industry and mining 1 240 1 372 1 4571 135 1 267 2 109 Building and construction, power and water supply 2 408 1 570 1 3761 559 1 694 1 195 Wholesale and retail trade; hotel and restaurant industry 1 355 1 892 1 704
0 124 419 International shipping and pipeline transport 419 126 18 064 8 165 7 443 Financing, property management and business services 7 296 8 054 7 8251 050 1 448 1 463 Transport and communication 1 795 1 755 1 261 788 846 694 Other service industries 789 900 817 203 198 286 Insurance, fund management and financial services 157 118 198
31 305 31 168 28 970 Retail banking market 29 827 31 990 31 932 51 58 51 Foreign retail banking market 53 58 51
48 945 49 491 46 431 Gross lending 48 180 51 268 50 213
0 0 0 Central government administration and social security administration 0 0 0 0 0 0 Counties and municipalities 0 0 0 0 41 50 Agriculture, forestry, fisheries, hunting and fish farming 50 41 0 0 0 0 Production of crude oil and natural gas 0 0 0
11 78 24 Industry and mining 25 78 11 3 7 9 Building and construction, power and water supply 9 7 4
16 19 6 Wholesale and retail trade; hotel and restaurant industry 6 21 16 0 0 1 International shipping and pipeline transport 1 0 0 7 29 33 Financing, property management and business services 34 29 8 2 7 2 Transport and communication 7 9 2 2 1 2 Other service industries 3 3 2 0 0 0 Insurance, fund management and financial services 0 0 0 6 15 25 Retail banking market 30 21 7 0 0 0 Foreign retail banking market 0 0 0 0 0 0 Non individual specific write-downs public market 0 0 0
- 8 21 31 Collective write-downs public market 31 22 - 8 0 9 0 Collective write-downs retail market 3 11 0 0 0 0 Unallocated market 0 0 0
39 227 183 Gross losses 199 242 42 25 59 13 Recoveries from previously written off losses 14 59 25 14 168 170 Net losses 185 183 17
257 284 622 Central government administration and social security administration 622 284 2574 463 4 837 5 532 Counties and municipalities 5 532 4 837 4 4631 036 1 018 763 Agriculture, forestry, fisheries, hunting and fish farming 763 1 018 1 036
1 2 1 Production of crude oil and natural gas 1 2 1 642 657 412 Industry and mining 412 657 642
1 461 1 536 1 587 Building and construction, power and water supply 1 587 1 536 1 4611 460 1 352 1 322 Wholesale and retail trade; hotel and restaurant industry 1 322 1 352 1 460
12 13 23 International shipping and pipeline transport 23 13 123 155 3 880 2 773 Financing, property management and business services 2 764 3 866 3 154 792 711 844 Transport and communication 844 711 792 622 567 346 Insurance, fund management and financial services 340 553 604
1 872 1 852 1 758 Other service industries 1 758 1 852 1 87216 076 17 650 18 663 Retail banking market 18 663 17 651 16 076
204 240 246 Foreign retail banking market 246 240 20432 053 34 599 34 892 Deposits from customers 34 877 34 572 32 034
Note 8 - Deposits broken down by sector and industry
Group(Amounts in NOK million)
Note 6 - Loans broken down by sector and industry
Note 7 - Losses broken down by sector and industry
Parent Bank
15/22

Parent Bank Group
31.12.07 31.12.08 31.12.09 31.12.09 31.12.08 31.12.07
2 1 1 Repossessed assets 1 1 1
446 764 285 Accrued income 292 771 456
18 25 33 Prepayments 44 31 25
199 147 235 Other assets 241 247 255
665 937 554 Total other assets 578 1 050 737
442 504 471 Costs incurred 586 609 536
119 100 82 Provisioning against incurred liabilities and costs 107 105 125
357 274 539 Other liabilities 549 369 390
918 878 1 092 Total other liabilities 1 242 1 083 1 051
Note 10 - Other assets
Note 11 - Other liabilities
(Amounts in NOK million)
Note 12 - Investment in bonds
(Amounts in NOK million) 01.07.08 30.09.08 31.12.08 31.03.09 30.06.09 30.09.09 31.12.09Hold until maturityBook value 3 109 3 194 3 498 3 222 3 058 2 923 2 650Nominal value (nominal amount) 3 182 3 265 3 588 3 281 3 111 2 969 2 689Theoretical market value 3 109 3 122 3 358 3 053 2 942 2 885 2 623
Loans and claimsBook value 698 720 739 689 682 639 629Nominal value (nominal amount) 737 760 809 755 751 663 656Theoretical market value 698 687 675 650 646 621 599
Total book value 3 807 3 914 4 237 3 911 3 740 3 562 3 279
As a result of extraordinary market conditions, parts of the Bank’s ordinary securities portfolio became illiquid in 2008. Following the changes in international accounting standards in October 2008 (see note 1), the SNN Group decided to reclassify parts of the Bank’s bond portfolio as at 01.07.09 from the category ‘Market value with inclusion of value changes over the profit and loss account’ to the categories ‘Hold until maturity’ and ‘Loans and claims’ as the securities in question no longer was expected to be sold before maturity. In the category ‘Hold until maturity’ the Bank includes quoted securities, whereas unquoted securities has been put into the category of ‘Loans and claims.'
In the categories ‘Hold until maturity’ and ‘Loans and claims’ the securities are assessed at amortized cost. After the reclassification, the writedowns made earlier will be reversed over the portfolio’s remaining life, which on average is 1,91 year as at 31.12.09, and included in the profit and loss account as interest income. For the last half year of 2008, such inclusion of income amounts to NOK 18 million. As at 31.12.09 the amount booked as income is NOK 26 million. If the reclassification had not been made, the Group would have charged NOK 212 million to the profit and loss account in the third and fourth quarter of 2008 due to increased credit spreads. This unrealised loss would have been reduced to NOK 18 as at 31.12.09. It was necessary to apply a NOK 46 million write-down due to the permanent impairment of value in this portfolio as at 31.12.08. A further NOK 17 million write-down has been made on this part of the portfolio as at 31.12.09. The portfolio had an NOK 478 million unrealised loss on foreign exchange as at 31.12.08. As at 31.12.09 the loss was NOK 3 million.
Note 9 - Subsidiaries
(Amounts in NOK 1 000) EquityShare of Eq.% 31.12.09 31.12.08 31.12.07 31.12.09 31.12.08 31.12.07
SpareBank 1 Finans Nord-Norge AS 100 64 912 19 625 19 371 286 798 241 128 199 257
SpareBank 1 Nord-Norge Invest AS 100 -64 779 -33 831 13 238 -9 274 55 533 86 292
Eiendomsdrift AS 100 2 075 2 055 3 380 44 756 55 142 48 655
EiendomsMegler 1 Nord-Norge AS 100 3 783 -9 823 - 254 17 334 13 579 11 901
SpareBank 1 Nord-Norge Securities ASA 79.25 2 087 1 805 5 108 10 168 5 506 5 526
Sparebanken Factoring 0 637 4 858 0 0 14 980 0
BBL Eiendomsmegling AS 0 0 - 550 0 0 5 958 0
Profit from ordinary operations after tax
Sparebanken Factoring was sold at 31.03.09. BBL Eiendomsmegling AS are included in accounts for EiendomsMegler 1 Nord-Norge AS.
16/22

Parent Bank and Group(Amounts in NOK million)
Securities issued31.12.09 31.12.08 31.12.07
Certificates and other short-term borrowings 555 3 349Bond debt 14 162 19 191 16 316Total debt securities in issue 14 162 19 746 19 665
Changes in securities issued:
Statement of financial position Issued
Matured/redeemed
Exchange rate
movementsOther
adjustments
Statement of financial
position31.12.08 31.12.09 31.12.09 31.12.09 31.12.09 31.12.09
Certificates and other short-term borrowings 555 - 555 Bond debt 19 191 350 -4 125 -1 008 - 246 14 162Total debt securities issued 19 746 350 -4 680 -1 008 - 246 14 162
Subordinated loan capital and perpetual subordinated loan capital securities
31.12.09 31.12.08 31.12.07Perpetual subordinated loan capital securities2033 6 months Libor + margin (US$ 60 mill.)(call opt. 2013) 370 370 370Perpetual subordinated loan capital securities - currency - 24 51 - 46Total perpetual subordinated loan capital securities 346 421 324
Subordinated loan capitalSubordinated loan capital with definite maturities 1 262 1 040 930Total subordinated loan capital 1 262 1 040 930
Total subordinated loan capital and perpetual 1 608 1 461 1 254
Changes in subordinated loan capital and perpetual subordinated loan capital securities:
Statement of financial position Issued
Matured/redeemed
Exchange rate
movementsOther
adjustments
Statement of financial
position31.12.08 31.12.09 31.12.09 31.12.09 31.12.09 31.12.09
Subordinated loan capital with definite maturities 1 040 450 - 146 - 80 - 2 1 262Perpetual subordinated loan capital securities 421 - 75 346subordinated loan capital securities 1 461 450 - 146 - 155 - 2 1 608
Note 13 - Securities issued and subordinated loan capital
17/22
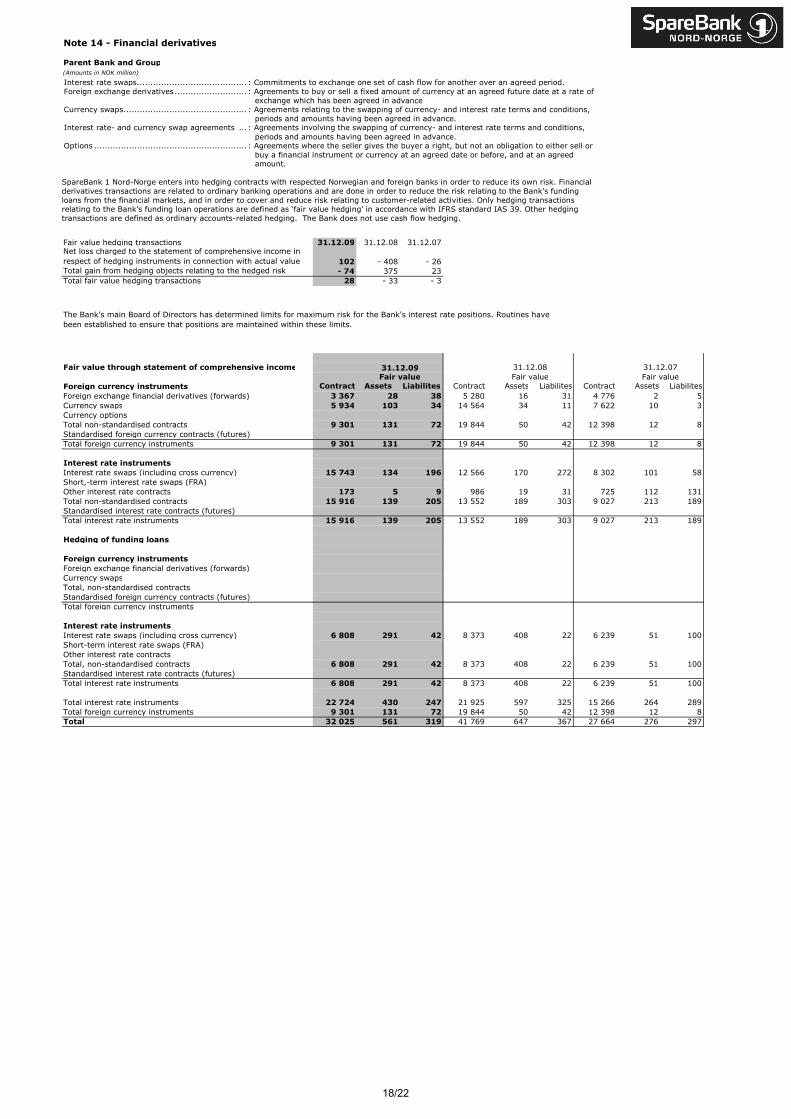
Note 14 - Financial derivatives
Parent Bank and Group
(Amounts in NOK million)
Fair value hedging transactions 31.12.09 31.12.08 31.12.07Net loss charged to the statement of comprehensive income in
respect of hedging instruments in connection with actual value 102 - 408 - 26
Total gain from hedging objects relating to the hedged risk - 74 375 23
Total fair value hedging transactions 28 - 33 - 3
Fair value through statement of comprehensive income 31.12.09 31.12.08 31.12.07
Fair value Fair value Fair value
Foreign currency instruments Contract Assets Liabilites Contract Assets Liabilites Contract Assets Liabilites
Foreign exchange financial derivatives (forwards) 3 367 28 38 5 280 16 31 4 776 2 5
Currency swaps 5 934 103 34 14 564 34 11 7 622 10 3
Currency options
Total non-standardised contracts 9 301 131 72 19 844 50 42 12 398 12 8
Standardised foreign currency contracts (futures)
Total foreign currency instruments 9 301 131 72 19 844 50 42 12 398 12 8
Interest rate instruments
Interest rate swaps (including cross currency) 15 743 134 196 12 566 170 272 8 302 101 58
Short,-term interest rate swaps (FRA)
Other interest rate contracts 173 5 9 986 19 31 725 112 131
Total non-standardised contracts 15 916 139 205 13 552 189 303 9 027 213 189
Standardised interest rate contracts (futures)
Total interest rate instruments 15 916 139 205 13 552 189 303 9 027 213 189
Hedging of funding loans
Foreign currency instruments
Foreign exchange financial derivatives (forwards)
Currency swaps
Total, non-standardised contracts
Standardised foreign currency contracts (futures)
Total foreign currency instruments
Interest rate instruments
Interest rate swaps (including cross currency) 6 808 291 42 8 373 408 22 6 239 51 100
Short-term interest rate swaps (FRA)
Other interest rate contracts
Total, non-standardised contracts 6 808 291 42 8 373 408 22 6 239 51 100
Standardised interest rate contracts (futures)
Total interest rate instruments 6 808 291 42 8 373 408 22 6 239 51 100
Total interest rate instruments 22 724 430 247 21 925 597 325 15 266 264 289
Total foreign currency instruments 9 301 131 72 19 844 50 42 12 398 12 8
Total 32 025 561 319 41 769 647 367 27 664 276 297
The Bank's main Board of Directors has determined limits for maximum risk for the Bank's interest rate positions. Routines have
been established to ensure that positions are maintained within these limits.
Interest rate swaps......................................... : Commitments to exchange one set of cash flow for another over an agreed period.
Foreign exchange derivatives........................... : Agreements to buy or sell a fixed amount of currency at an agreed future date at a rate of
exchange which has been agreed in advance Currency swaps.............................................. : Agreements relating to the swapping of currency- and interest rate terms and conditions,
periods and amounts having been agreed in advance. Interest rate- and currency swap agreements ... : Agreements involving the swapping of currency- and interest rate terms and conditions,
periods and amounts having been agreed in advance. Options ......................................................... : Agreements where the seller gives the buyer a right, but not an obligation to either sell or
buy a financial instrument or currency at an agreed date or before, and at an agreed amount.
SpareBank 1 Nord-Norge enters into hedging contracts with respected Norwegian and foreign banks in order to reduce its own risk. Financial
derivatives transactions are related to ordinary banking operations and are done in order to reduce the risk relating to the Bank’s funding
loans from the financial markets, and in order to cover and reduce risk relating to customer-related activities. Only hedging transactions relating to the Bank’s funding loan operations are defined as ‘fair value hedging’ in accordance with IFRS standard IAS 39. Other hedging
transactions are defined as ordinary accounts-related hedging. The Bank does not use cash flow hedging.
18/22
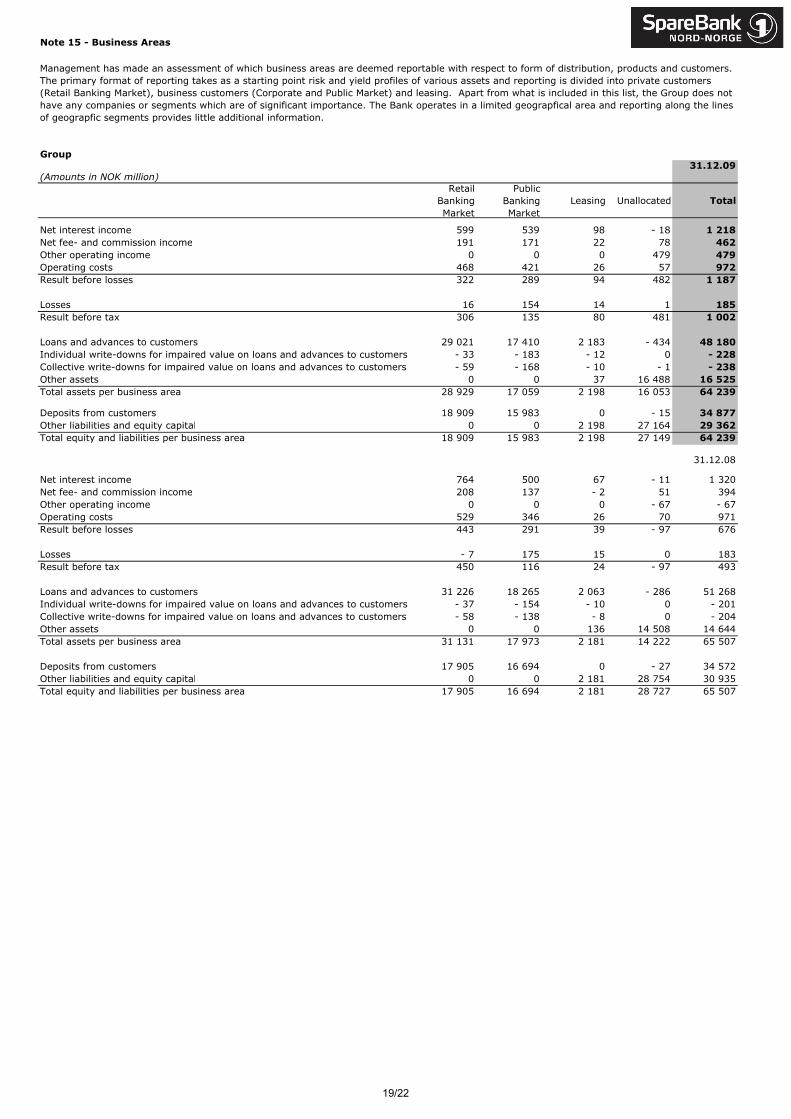
Note 15 - Business Areas
Group31.12.09
(Amounts in NOK million)Retail
Banking Market
Public Banking Market
Leasing Unallocated Total
Net interest income 599 539 98 - 18 1 218Net fee- and commission income 191 171 22 78 462Other operating income 0 0 0 479 479Operating costs 468 421 26 57 972Result before losses 322 289 94 482 1 187
Losses 16 154 14 1 185Result before tax 306 135 80 481 1 002
Loans and advances to customers 29 021 17 410 2 183 - 434 48 180Individual write-downs for impaired value on loans and advances to customers - 33 - 183 - 12 0 - 228Collective write-downs for impaired value on loans and advances to customers - 59 - 168 - 10 - 1 - 238Other assets 0 0 37 16 488 16 525Total assets per business area 28 929 17 059 2 198 16 053 64 239
Deposits from customers 18 909 15 983 0 - 15 34 877Other liabilities and equity capital 0 0 2 198 27 164 29 362Total equity and liabilities per business area 18 909 15 983 2 198 27 149 64 239
31.12.08
Net interest income 764 500 67 - 11 1 320Net fee- and commission income 208 137 - 2 51 394Other operating income 0 0 0 - 67 - 67Operating costs 529 346 26 70 971Result before losses 443 291 39 - 97 676
Losses - 7 175 15 0 183Result before tax 450 116 24 - 97 493
Loans and advances to customers 31 226 18 265 2 063 - 286 51 268Individual write-downs for impaired value on loans and advances to customers - 37 - 154 - 10 0 - 201Collective write-downs for impaired value on loans and advances to customers - 58 - 138 - 8 0 - 204Other assets 0 0 136 14 508 14 644Total assets per business area 31 131 17 973 2 181 14 222 65 507
Deposits from customers 17 905 16 694 0 - 27 34 572Other liabilities and equity capital 0 0 2 181 28 754 30 935Total equity and liabilities per business area 17 905 16 694 2 181 28 727 65 507
Management has made an assessment of which business areas are deemed reportable with respect to form of distribution, products and customers. The primary format of reporting takes as a starting point risk and yield profiles of various assets and reporting is divided into private customers (Retail Banking Market), business customers (Corporate and Public Market) and leasing. Apart from what is included in this list, the Group does not have any companies or segments which are of significant importance. The Bank operates in a limited geograpfical area and reporting along the lines of geograpfic segments provides little additional information.
19/22
Trading statistics
#NAVN?
741
885
2 55
9 20
461
8 83
181
5 20
31
270
439
1 20
1 37
2
259
220 58
3 33
558
8 98
567
7 54
7
2 11
8 73
842
1 87
339
6 16
156
8 41
7 781
553
181
045
281
907
275
475
1 02
6 88
765
2 31
6
2 57
6 47
642
2 44
1
621
058
366
282
0
500 000
1 000 000
1 500 000
2 000 000
2 500 000
3 000 000
jan.
08
feb.
08m
ar.0
8
apr.0
8m
ay.0
8
jun.
08
jul.0
8au
g.08
sep.
08
oct.0
8no
v.08
dec.
08
jan.
09
feb.
09m
ar.0
9
apr.0
9m
ay.0
9
jun.
09
jul.0
9au
g.09
sep.
09
oct.0
9no
v. 0
9de
c.09
Price trend NONG
0102030405060708090100110120130140150160170
jan.08
mar.08
mai.08
jul.08
sep.08
nov.08
jan.09
mar.09
mai.09
jun.09
aug.09
oct.09
dec.09
NOK
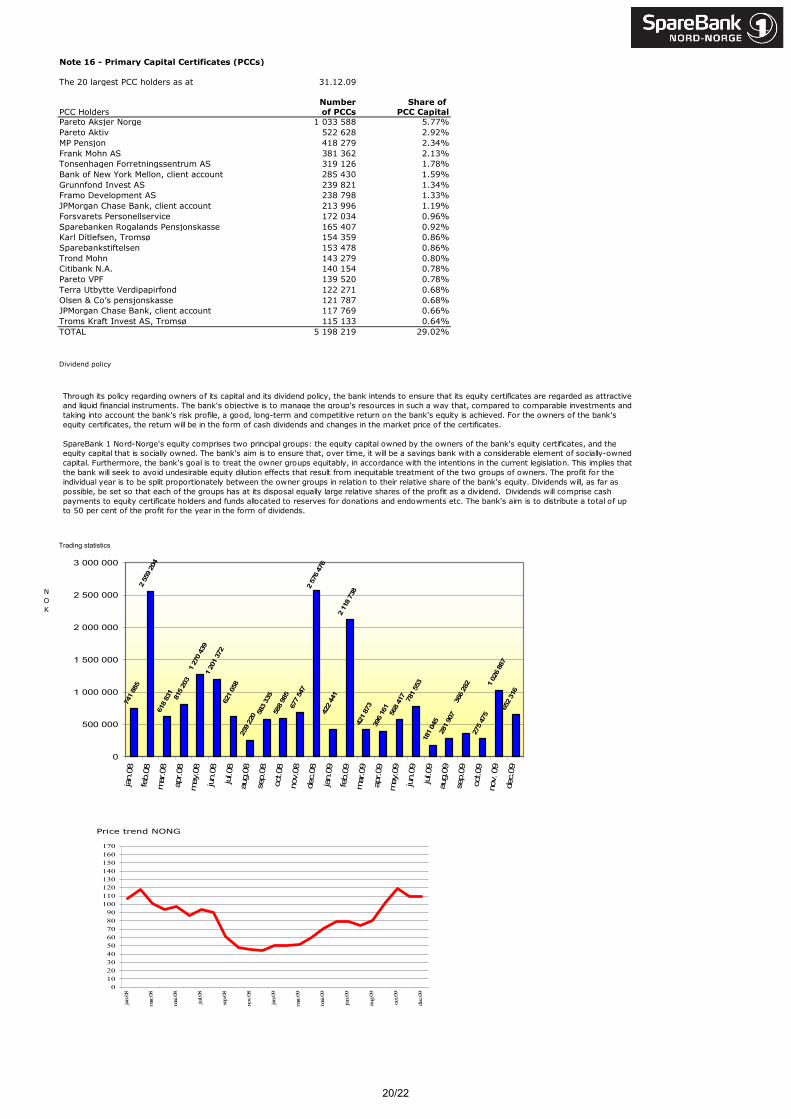
Note 16 - Primary Capital Certificates (PCCs)
The 20 largest PCC holders as at 31.12.09
Number Share of PCC Holders of PCCs PCC CapitalPareto Aksjer Norge 1 033 588 5.77%Pareto Aktiv 522 628 2.92%MP Pensjon 418 279 2.34%Frank Mohn AS 381 362 2.13%Tonsenhagen Forretningssentrum AS 319 126 1.78%Bank of New York Mellon, client account 285 430 1.59%Grunnfond Invest AS 239 821 1.34%Framo Development AS 238 798 1.33%JPMorgan Chase Bank, client account 213 996 1.19%Forsvarets Personellservice 172 034 0.96%Sparebanken Rogalands Pensjonskasse 165 407 0.92%Karl Ditlefsen, Tromsø 154 359 0.86%Sparebankstiftelsen 153 478 0.86%Trond Mohn 143 279 0.80%Citibank N.A. 140 154 0.78%Pareto VPF 139 520 0.78%Terra Utbytte Verdipapirfond 122 271 0.68%Olsen & Co’s pensjonskasse 121 787 0.68%JPMorgan Chase Bank, client account 117 769 0.66%Troms Kraft Invest AS, Tromsø 115 133 0.64%TOTAL 5 198 219 29.02%
Dividend policy
Through its policy regarding owners of its capital and its dividend policy, the bank intends to ensure that its equity certificates are regarded as attractive and liquid financial instruments. The bank's objective is to manage the group's resources in such a way that, compared to comparable investments and taking into account the bank's risk profile, a good, long-term and competitive return on the bank's equity is achieved. For the owners of the bank's equity certificates, the return will be in the form of cash dividends and changes in the market price of the certificates. SpareBank 1 Nord-Norge's equity comprises two principal groups: the equity capital owned by the owners of the bank's equity certificates, and the equity capital that is socially owned. The bank's aim is to ensure that, over time, it will be a savings bank with a considerable element of socially-owned capital. Furthermore, the bank's goal is to treat the owner groups equitably, in accordance with the intentions in the current legislation. This implies that the bank will seek to avoid undesirable equity dilution effects that result from inequitable treatment of the two groups of owners. The profit for the individual year is to be split proportionately between the owner groups in relation to their relative share of the bank's equity. Dividends will, as far as possible, be set so that each of the groups has at its disposal equally large relative shares of the profit as a dividend. Dividends will comprise cash payments to equity certificate holders and funds allocated to reserves for donations and endowments etc. The bank's aim is to distribute a total of up to 50 per cent of the profit for the year in the form of dividends.
20/22
The SpareBank 1 Nord-Norge Group – a Statement from the Board of Directors
and Chief Executive Officer
The Board of Directors and Chief Executive Officer have today discussed and approved
the annual report and accounts and the abridged, consolidated annual report and accounts
for SpareBank 1 Nord-Norge as at 31 December 2009 and for year 2009 including
abridged, consolidated comparative figures as at 31 December 2008 and for the year
2008.
According to our full and firm conviction, the annual report and accounts have been
prepared in compliance with the requirements contained in IAS approved by the EU, and
in compliance with Norwegian supplementary requirements forming part of the Securities
Trading Act.
According to our full and firm conviction, the 2009 annual report and accounts have been
prepared in compliance with currently valid accounting standards, and the information
provided in the report and accounts gives a true and correct picture of the Group’s assets,
liabilities and financial position and result as a whole as at 31 December 2009 and 31
December 2008. Furthermore, according to our full and firm conviction, the annual
report and accounts provide a true and correct
• overview of important events during the accounting period in question and their
impact on the annual report and accounts
• description of the most central risk- and uncertainty factors facing the operations
during the next accounting period
• a description of close individuals’ significant transactions
Tromso, 10 February 2010
The main Board of Directors of SpareBank 1 Nord-Norge
Kjell Olav Pettersen Erik Sture Larre jr. Roar Doms
Elisabeth Johansen Wenche Olsen Paal A. Pedersen
Ann-Christine Nybacka Vivi Ann Pedersen
Hans Olav Karde
(Chief Executive Officer)
21/22
SpareBank 1 Nord-NorgeP.O. Box 6800N-9298 Tromsø
Telephone: (+47 915) 02244Web: www.snn.no
E-mail: [email protected]
Org.number: 952 706 365Headoffice: Storgata 65, Tromsø
SpareBank 1 Nord-Norge Main Board of Directors:Kjell Olav Pettersen, Tromsø (Chairman)Erik Sture Larre jr., Oslo (Deputy Chairman)Roar Dons, TromsøElisabeth Johansen, StamsundWenche Olsen, GlomfjordPål Andreas Pedersen, BodøAnn-Christine Nybacka, BrønnøysundVivi Ann Pedersen, Tromsø (elected from the employees)Gunnar Kristiansen, Sortland (elected from the employees, deputy)
Members of the Group Management Committee:Hans Olav Karde (Chief Executive Officer)Oddmund Åsen (Deputy Chief Executive Officer)Liv Bortne Ulriksen (Senior Group General Manager Corporate Banking Market)Stig Arne Engen (Senior Group General Manager Retail Banking Market)Rolf Eigil Bygdnes (Senior Group General Manager CFO)Elisabeth Utheim (Senior Group General Manager Support Functions)Geir Andreassen (Senior Group General Manager Risk Management)Kjell Kolbeinsen (Director, Information and Public Relations)
Investor RelationsRolf Eigil Bygdnes (Senior Group General Manager CFO)Telephone +47 776 22211e-mail: [email protected]
Financial CalendarSupervisory Board Meeting 17 March 2010PCC noted exsclusive dividend 18 March 2009
Interim reports and accounts 2010:1st quarter 29 April 20102nd quarter 12 August 20103rd quarter 29 October 20104th quarter At the beginning of February 2011
Information
22/22

The SpareBank 1 Nord-Norge Group – a Statement from the Board of Directors
and Chief Executive Officer
The Board of Directors and Chief Executive Officer have today discussed and approved
the annual report and accounts and the abridged, consolidated annual report and accounts
for SpareBank 1 Nord-Norge as at 31 December 2009 and for year 2009 including
abridged, consolidated comparative figures as at 31 December 2008 and for the year
2008.
According to our full and firm conviction, the annual report and accounts have been
prepared in compliance with the requirements contained in IAS approved by the EU, and
in compliance with Norwegian supplementary requirements forming part of the Securities
Trading Act.
According to our full and firm conviction, the 2009 annual report and accounts have been
prepared in compliance with currently valid accounting standards, and the information
provided in the report and accounts gives a true and correct picture of the Group’s assets,
liabilities and financial position and result as a whole as at 31 December 2009 and 31
December 2008. Furthermore, according to our full and firm conviction, the annual
report and accounts provide a true and correct
• overview of important events during the accounting period in question and their
impact on the annual report and accounts
• description of the most central risk- and uncertainty factors facing the operations
during the next accounting period
• a description of close individuals’ significant transactions
Tromso, 10 February 2010
The main Board of Directors of SpareBank 1 Nord-Norge
Kjell Olav Pettersen Erik Sture Larre jr. Roar Doms
Elisabeth Johansen Wenche Olsen Paal A. Pedersen
Ann-Christine Nybacka Vivi Ann Pedersen
Hans Olav Karde
(Chief Executive Officer)