sparebanken more sparebanken more’s capital metrics have improved in the past three years,...
TRANSCRIPT

FINANCIAL INSTITUTIONS
CREDIT OPINION13 June 2019
Update
RATINGS
Sparebanken MoreDomicile Norway
Long Term CRR A1
Type LT Counterparty RiskRating - Fgn Curr
Outlook Not Assigned
Long Term Debt Not Assigned
Long Term Deposit A2
Type LT Bank Deposits - FgnCurr
Outlook Stable
Please see the ratings section at the end of this reportfor more information. The ratings and outlook shownreflect information as of the publication date.
Contacts
Nondas Nicolaides +357.2569.3006VP-Sr Credit [email protected]
Elena Ioannou, CFA +44.20.7772.1716Associate [email protected]
Sean Marion +44.20.7772.1056MD-Financial [email protected]
CLIENT SERVICES
Americas 1-212-553-1653
Asia Pacific 852-3551-3077
Japan 81-3-5408-4100
EMEA 44-20-7772-5454
Sparebanken MoreUpdate to credit analysis
SummarySparebanken More’s A2 long-term issuer and deposit ratings, both carrying stable outlook,are driven by its baa1 baseline credit assessment (BCA) and the application of our AdvancedLoss Given Failure (LGF) analysis, which results in a two-notches of rating uplift from itsBCA. The uplift reflects the protection to Sparebanken More’s senior creditors resulting fromthe volume of deposits and debt available to share losses, as well as from the volume ofsecurities subordinated to them. Sparebanken More’s A2 deposit ratings do not benefit fromany government support, reflecting our assumption of a “Low” likelihood of support given itslimited national market share of 1.2% of total loans and 1.4% of total deposits as of March20191, and the implementation of the BRRD law in Norway from 1 January 2019.
Sparebanken More's BCA of baa1 takes into account the strong macroeconomic environmentin Norway, its sizeable capital buffers with a CET1 capital ratio of 15.9% in March 2019 andsound asset quality metrics with problem loans at around 0.9% of gross loans. The BCA alsoconsiders Sparebanken More’s moderate profitability with some margin pressure in recentmonths, as well as its sizeable reliance on market funding, although this is somewhat lowerthan the average for Norwegian savings banks.
Exhibit 1
Key Financial indicators
0.9% 16.9%0.9%
24.9% 12.8%
0%
5%
10%
15%
20%
25%
30%
0%
2%
4%
6%
8%
10%
12%
14%
16%
18%
Asset Risk:Problem Loans/
Gross Loans
Capital:Tangible Common
Equity/Risk-WeightedAssets
Profitability:Net Income/
Tangible Assets
Funding Structure:Market Funds/
Tangible BankingAssets
Liquid Resources:Liquid Banking
Assets/TangibleBanking Assets
Solvency Factors (LHS) Liquidity Factors (RHS)
Sparebanken More (BCA: baa1) Median baa1-rated banks
So
lve
ncy F
acto
rs
Liq
uid
ity F
acto
rs
These represent our Banks methodology scorecard ratios, whereby asset risk and profitability reflect the weaker of either thethree year average and the latest annual figure. Capital ratio is the latest reported figure. Funding structure and liquid resourceratios reflect the latest fiscal year-end figures.Source: Moody's Investors Service

MOODY'S INVESTORS SERVICE FINANCIAL INSTITUTIONS
Credit strengths
» Highly supportive operating environment in Norway which translates into a Very Strong- Macro Profile.
» Sizeable capital buffers offering protection against unforeseen losses
» Asset quality metrics are sound, despite some recent deterioration
» Large volume of deposits and debt result in a two-notch uplift to the deposit rating from the BCA
Credit challenges
» Moderate profitability on the back of net interest margin pressure and strong competition
» While lower than its Norwegian savings banks peers, Sparebanken More has a sizeable reliance on market funding
OutlookThe stable outlook on the bank's long-term deposit and issuer ratings reflects our view that the bank's credit profile will remain broadlyunchanged over the next 12-18 months.
Factors that could lead to an upgradeUpward rating momentum could develop if Sparebanken More demonstrates:
» Improved asset quality metrics and contain sector and single name concentration levels in its loan book, combined with strongerearnings generation without a material deterioration in its risk profile
» Continued good access to capital markets and further issuance of covered bonds eligible as liquidity assets in the Liquidity CoverageRatio (LCR), which will further improve its liquidity metrics
» A higher loss absorption cushion by MREL-eligible securities that could trigger a change in our LGF notching analysis, leading to ahigher rating uplift for deposits and senior debt
Factors that could lead to a downgradeFuture downward rating pressure would emerge if:
» Sparebanken More's risk profile weakens as a result of increased exposures to more volatile sectors, for example if concentration toCommercial Real Estate (CRE) as a percent of Core Tier 1 capital exceeds 150%
» Financing conditions become more difficult or the macroeconomic environment deteriorates more than currently anticipated,leading to a lower Macro Profile while profitability weakens significantly from current levels
» A reduction in rating uplift as a result of our advance LGF analysis would also lead to a downgrade of the deposit ratings
This publication does not announce a credit rating action. For any credit ratings referenced in this publication, please see the ratings tab on the issuer/entity page onwww.moodys.com for the most updated credit rating action information and rating history.
2 13 June 2019 Sparebanken More: Update to credit analysis

MOODY'S INVESTORS SERVICE FINANCIAL INSTITUTIONS
Key indicators
Exhibit 2
Sparebanken More (Consolidated Financials) [1]03-192 12-182 12-172 12-162 12-152 CAGR/Avg.3
Total Assets (NOK Billion) 71.1 71.1 66.5 61.6 60.1 5.34
Total Assets (USD Million) 8,260.4 8,208.0 8,129.1 7,155.6 6,792.2 6.24
Tangible Common Equity (NOK Billion) 5.9 6.0 5.6 5.3 5.0 5.14
Tangible Common Equity (USD Million) 679.3 693.3 685.8 620.7 562.9 6.04
Problem Loans / Gross Loans (%) 0.9 0.6 0.6 1.2 0.5 0.75
Tangible Common Equity / Risk Weighted Assets (%) 16.9 17.5 16.3 16.2 15.4 16.46
Problem Loans / (Tangible Common Equity + Loan Loss Reserve) (%) 9.0 6.1 5.7 10.7 4.6 7.25
Net Interest Margin (%) 1.7 1.7 1.7 1.8 1.9 1.75
PPI / Average RWA (%) 2.6 2.4 2.2 2.2 2.1 2.36
Net Income / Tangible Assets (%) 0.9 0.8 0.8 0.9 0.8 0.85
Cost / Income Ratio (%) 41.5 42.5 44.1 44.4 45.1 43.55
Market Funds / Tangible Banking Assets (%) 22.7 24.9 24.6 22.1 26.2 24.15
Liquid Banking Assets / Tangible Banking Assets (%) 11.6 12.8 12.4 11.8 11.9 12.15
Gross Loans / Due to Customers (%) 175.5 176.1 174.2 162.9 175.7 172.95
[1]All figures and ratios are adjusted using Moody's standard adjustments. [2]Basel II; IFRS. [3]May include rounding differences due to scale of reported amounts. [4]Compound AnnualGrowth Rate (%) based on time period presented for the latest accounting regime. [5]Simple average of periods presented for the latest accounting regime. [6]Simple average of Basel IIperiods presented.Source: Moody's Investors Service; Company Filings
ProfileSparebanken Møre is a regional savings bank with a well-established market position in the county of Møre and Romsdal, located inWestern Norway. Sparebanken Møre provides retail and corporate banking and other financial services, including real estate brokerage.It also offers share trading and capital management advice and distributes insurance and leasing products.
Sparebanken Møre was established in 1985 followed by the merger of a number of banks in the region. The bank's history of mergedsavings banks can be traced back to 1843. Sparebanken Møre's Equity Certificates (EC) are listed on the Oslo Stock Exchange (ticker:MORG).
As of 31 March 2019, the bank reported total consolidated assets of NOK71 billion (€7.3 billion) and operated through a network of 28branches. The bank's head office is located in Ålesund.
Detailed credit considerationsStrong operating environment supports the bank's financial fundamentalsSparebanken More's operating environment is purely domestic. Therefore, its Macro Profile is aligned with that of Norway at VeryStrong-. Norwegian banks benefit from operating in a wealthy and developed country with very high economic, institutional andgovernment financial strength, as well as very low susceptibility to event risk. Norway has a diversified and growing economy, whichdemonstrated resilience to the past weakening in the oil sector.
The main risks to the banking system stem from the high level of household indebtedness, elevated real estate prices and domesticbanks’ extensive use of market funding. However, these risks are mitigated by the strength of households’ ability to service debt, banks’adequate capitalisation and the relatively small size of the banking system compared with the total size of the economy.
Sizeable capital buffers offering protection against unforeseen lossesIn line with many Norwegian savings banks, Sparebanken More has increased its capital ratios in accordance with the higher regulatorycapital requirements in recent years. As of end March 2019, Sparebanken More’s Common Equity Tier 1 (CET1) capital ratio was 15.9%(March 2018: 15.1%), and its Tier 1 ratio reached 17.1% (see exhibit 3). Sparebanken More’s CET1 ratio is above the regulatory minimumof 13.7% (which includes an individual Pillar II requirement of 1.7%), and the internally minimum CET1 target of 14.8%. SparebankenMore had also a reported leverage ratio of 8.1% as of March 2019 compared to the 5% regulatory requirement, which also points tothe bank's high capital buffers.
3 13 June 2019 Sparebanken More: Update to credit analysis

MOODY'S INVESTORS SERVICE FINANCIAL INSTITUTIONS
Sparebanken More’s capital metrics have improved in the past three years, reflecting both earnings retention (the payout ratio wascontained to 51% in year-end 2018 compared to 53% in 2017), as well as the adoption of the internal ratings based (IRB) approach tocalculate risk-weighted assets in 2015. Looking ahead, we expect the bank's capital metrics to benefit around 20 basis points from theremoval of the 80% Basel I floor in the second half of 2019, as well as another 40 basis points from the reduced capital requirement forSME exposures.
Accordingly, we believe that the bank will be able to fund its future asset growth, which has been capped at around 8% according tothe bank's updated credit risk strategy, without needing to raise any new capital. Our capital score for the bank also takes into accountits equity certificates (EC) capital structure, a common feature among Norwegian savings banks, with the EC holders owning around49.6% of the bank's capital. We believe that this structure could prove challenging for the bank to raise significant amount of newcapital when needed, especially during periods of stress in the market, although its long track record of non-dilutive dividend policycould alleviate this challenge.
Exhibit 3
Sizeable capital buffers offering protection against unforeseen losses compares well with peers
Sparebanken OestHelgeland Sparebank
Fana Sparebank
Sparebank Sogn og Fjordane Sparebanken More
Sparebanken Vest
Sparebanken Sor
7.0%
7.5%
8.0%
8.5%
9.0%
9.5%
10.0%
15.0% 15.5% 16.0% 16.5% 17.0% 17.5% 18.0%
Shar
eho
lder
's E
quit
y %
To
tal A
sset
s
Tier 1 Ratio
Note: Based on latest available dataSource: Moody's Investors Service
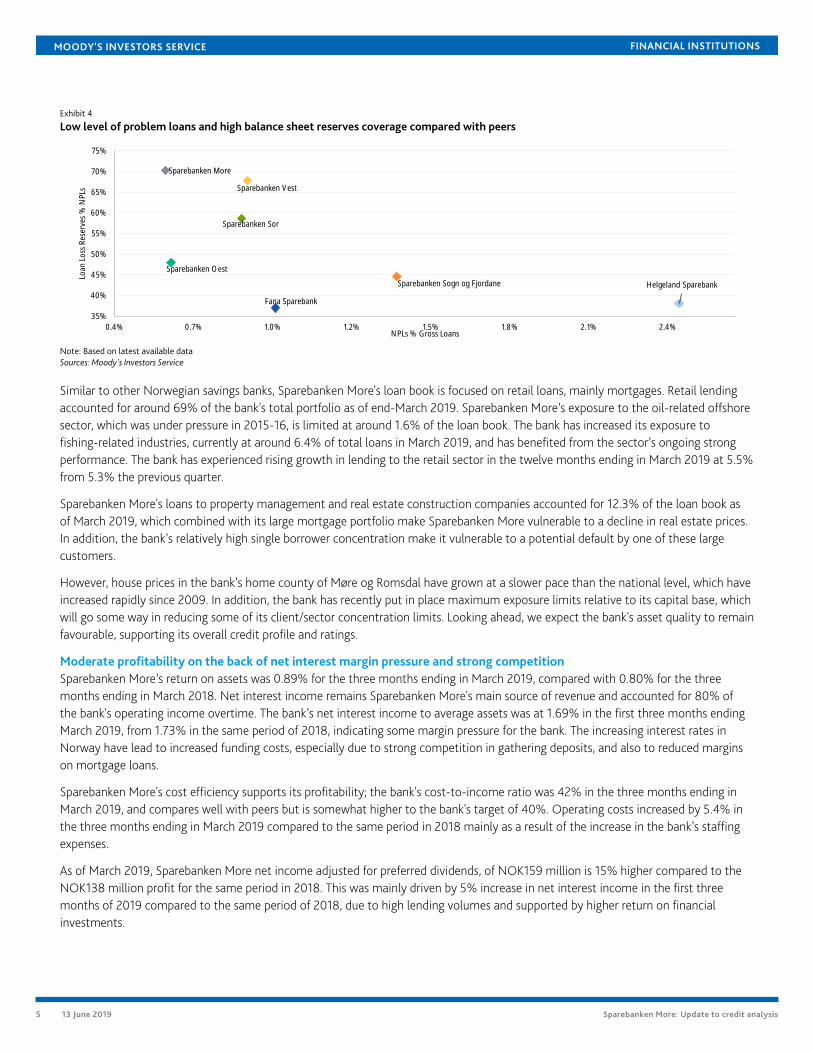
Asset quality metrics are sound, despite some recent deteriorationSparebanken More has relatively sound asset quality metrics comparing well with its local peers, despite some deterioration in recentmonths. The ratio of non-performing loans (NPL) to gross loans increased to 0.9% in March 2019 from 0.63% at year end-2018 and0.58% in March 2018 but remains low, while its overall provisioning coverage of NPLs was at 49% in March 2019 (see exhibit 4).
From 1 January 2018 Sparebanken More applies a three stage approach when assessing expected credit losses on loans to customer,loan commitments and financial guarantees subject to the IFRS 9 impairment disclosure (see FAQ: Limited impact from IFRS 9 firsttime adoption, but disclosure uneven so far, published 30 April 2018). Reported total losses in the first three months ending March2019 were NOK13 million, equivalent to 0.09% of gross loans on an annualised basis compared top only 0.01% in the first threemonths of 2018.
4 13 June 2019 Sparebanken More: Update to credit analysis
MOODY'S INVESTORS SERVICE FINANCIAL INSTITUTIONS
Exhibit 4
Low level of problem loans and high balance sheet reserves coverage compared with peers
Sparebanken Oest
Helgeland Sparebank
Fana Sparebank
Sparebanken Sogn og Fjordane
Sparebanken More
Sparebanken Vest
Sparebanken Sor
35%
40%
45%
50%
55%
60%
65%
70%
75%
0.4% 0.7% 1.0% 1.2% 1.5% 1.8% 2.1% 2.4%
Loan
Lo
ss R
eser
ves
% N
PLs
NPLs % Gross Loans
Note: Based on latest available dataSources: Moody's Investors Service
Similar to other Norwegian savings banks, Sparebanken More's loan book is focused on retail loans, mainly mortgages. Retail lendingaccounted for around 69% of the bank's total portfolio as of end-March 2019. Sparebanken More’s exposure to the oil-related offshoresector, which was under pressure in 2015-16, is limited at around 1.6% of the loan book. The bank has increased its exposure tofishing-related industries, currently at around 6.4% of total loans in March 2019, and has benefited from the sector’s ongoing strongperformance. The bank has experienced rising growth in lending to the retail sector in the twelve months ending in March 2019 at 5.5%from 5.3% the previous quarter.
Sparebanken More's loans to property management and real estate construction companies accounted for 12.3% of the loan book asof March 2019, which combined with its large mortgage portfolio make Sparebanken More vulnerable to a decline in real estate prices.In addition, the bank’s relatively high single borrower concentration make it vulnerable to a potential default by one of these largecustomers.
However, house prices in the bank’s home county of Møre og Romsdal have grown at a slower pace than the national level, which haveincreased rapidly since 2009. In addition, the bank has recently put in place maximum exposure limits relative to its capital base, whichwill go some way in reducing some of its client/sector concentration limits. Looking ahead, we expect the bank's asset quality to remainfavourable, supporting its overall credit profile and ratings.
Moderate profitability on the back of net interest margin pressure and strong competitionSparebanken More’s return on assets was 0.89% for the three months ending in March 2019, compared with 0.80% for the threemonths ending in March 2018. Net interest income remains Sparebanken More's main source of revenue and accounted for 80% ofthe bank's operating income overtime. The bank’s net interest income to average assets was at 1.69% in the first three months endingMarch 2019, from 1.73% in the same period of 2018, indicating some margin pressure for the bank. The increasing interest rates inNorway have lead to increased funding costs, especially due to strong competition in gathering deposits, and also to reduced marginson mortgage loans.
Sparebanken More's cost efficiency supports its profitability; the bank's cost-to-income ratio was 42% in the three months ending inMarch 2019, and compares well with peers but is somewhat higher to the bank's target of 40%. Operating costs increased by 5.4% inthe three months ending in March 2019 compared to the same period in 2018 mainly as a result of the increase in the bank’s staffingexpenses.
As of March 2019, Sparebanken More net income adjusted for preferred dividends, of NOK159 million is 15% higher compared to theNOK138 million profit for the same period in 2018. This was mainly driven by 5% increase in net interest income in the first threemonths of 2019 compared to the same period of 2018, due to high lending volumes and supported by higher return on financialinvestments.
5 13 June 2019 Sparebanken More: Update to credit analysis

MOODY'S INVESTORS SERVICE FINANCIAL INSTITUTIONS
Although lower than its Norwegian peers, Sparebanken More has a sizeable reliance on market fundingSparebanken More’s primary funding source are deposits, which accounted for 55% of funding at end of March 2019 (54% end-March 2018) and 57% of gross loans as of end of March 2019, a level we expect to remain broadly stable. However, the bank has ahigh, although lower than domestic peers, reliance on confidence sensitive market funding, which we view as a credit weakness. Theratio of market funds to tangible banking assets stood at 22.7% as of March 2019. The bank estimates that it will likely have to issuearound NOK4.8 billion of MREL-eligible non-preferred senior debt over the next 2-3 years, mainly through the refinancing of maturingpreferred senior debt. We note that the FSA will communicate the exact MREL requirement to the bank in the second half of 2020, andthat the amount could be lower due to the potential adoption in Norway of the BRRD2 framework.
The majority of market funds, around 73% as of March 2019 (63% as of March 2018), were in the form of covered bonds issuedthrough its subsidiary company More Boligkreditt. We view the diversification benefit and the typically longer maturity of thesefunding instruments positively, with almost 85% of total outstanding covered bond volume being eligible liquid assets under theliquidity coverage ratio rules, as they provide the bank with a wider and more diversified investor base.
Sparebanken More maintains good liquidity buffers of high quality that are broadly in line with peers. As of March 2019, the ratioof liquid assets to tangible banking assets was 11.6% (13.4% as of March 2018). Besides cash and due from banks (1.2% of tangiblebanking assets as of March 2019), the bank’s liquidity buffers include a securities portfolio, which mainly comprise domestic andEuropean covered bonds, government and supranational bonds, with minor holdings of senior and corporate bonds as well as minorshareholdings. Bond holdings in the liquidity portfolio are generally equally divided by foreign (European) and domestic issuers. Euro-denominated issues are hedged into Norwegian krone, and fixed-rate bonds are swapped into floating interest rates (mainly threemonths floating).
Source of facts and figures cited in this reportUnless noted otherwise, the bank specific figures originate from bank's reports and Moody's Banking Financial Metrics. All figures arebased on our own chart of accounts and may be adjusted for analytical purposes. Please refer to the document Financial StatementAdjustments in the Analysis of Financial Institutions, published on 9 August 2018.
6 13 June 2019 Sparebanken More: Update to credit analysis
MOODY'S INVESTORS SERVICE FINANCIAL INSTITUTIONS
Support and structural considerationsLoss Given FailureEuropean Union's BRRD has been transposed into Norwegian law, applicable from 1 January 2019, which confirmed our currentassumptions regarding the LGF analysis. We assume residual tangible common equity of 3% and losses post-failure of 8% of tangiblebanking assets, a 25% run-off in “junior” wholesale deposits, a 5% run-off in preferred deposits, and assign a 25% probability todeposits being preferred to senior unsecured debt. These metrics are in line with our standard assumptions.
For Sparebanken More's short-term and long-term deposit ratings, our ratings have considered the likely impact on loss-given-failureof the combination of their own volume and the amount of debt subordinated to them. This results in a Preliminary Rating Assessmentthat stands two notches above the BCA, reflecting very low loss-given-failure.
Government supportSparebanken More is a regional savings bank with a robust market position in western Norway in the county of Møre and Romsdal,where it has a market share of around 24% (incl. banks and mortgage companies) of loans and 31% of deposits as of December 2017.However, its national market share is limited at around 1.2% of loans and 1.4% on deposits as of March 2019. Accordingly, and inconjunction with the BRRD law implementation in Norway from 1 January 2019, we expect a low probability of government support fordeposits, resulting in no rating uplift.
Counterparty Risk (CR) assessmentCR Assessments are opinions of how counterparty obligations are likely to be treated if a bank fails and are distinct from debt anddeposit ratings in that they (1) consider only the risk of default rather than the likelihood of default and the expected financial losssuffered in the event of default; and (2) apply to counterparty obligations and contractual commitments rather than debt or depositinstruments. The CR Assessment is an opinion of the counterparty risk related to a bank's covered bonds, contractual performanceobligations (servicing), derivatives (e.g., swaps), letters of credit, guarantees and liquidity facilities.
Sparebanken More's CR Assessment is positioned at A1(cr)/P-1(cr)Sparebanken More’s CR Assessment is positioned three notches above its adjusted BCA of baa1, based on the cushion against defaultprovided by junior deposits, senior unsecured, subordinated debts and preference shares. The bank’s CR Assessment does not benefitfrom any government support, in line with deposit rating.
Counterparty Risk Rating (CRR)Counterparty Risk Ratings (CRRs) are opinions of the ability of entities to honour the uncollateralized portion of non-debt counterpartyfinancial liabilities (CRR liabilities) and also reflect the expected financial losses in the event such liabilities are not honoured. CRRliabilities typically relate to transactions with unrelated parties. Examples of CRR liabilities include the uncollateralized portion ofpayables arising from derivatives transactions and the uncollateralized portion of liabilities under sale and repurchase agreements. Webelieve that CRR liabilities have a lower probability of default than the bank's deposit and senior unsecured debt as they will more likelybe preserved in order to minimise banking system contagion, minimise losses and avoid disruption of critical functions.
Sparebanken More's CRR is placed at A1/P-1The CRR is three notches above the adjusted BCA of baa1 and at the same level as the Counterparty Risk Assessment, reflecting thebuffer against default provided by more junior instruments to the CRR liabilities.
About Moody's Bank ScorecardOur Scorecard is designed to capture, express and explain in summary form our rating committee's judgment. When read inconjunction with our research, a fulsome presentation of our judgment is expressed. As a result, the output of our Scorecardmay materially differ from that suggested by raw data alone (though it has been calibrated to avoid the frequent need for strongdivergence). The Scorecard output and the individual scores are discussed in rating committees and may be adjusted up or down toreflect conditions specific to each rated entity.
7 13 June 2019 Sparebanken More: Update to credit analysis

MOODY'S INVESTORS SERVICE FINANCIAL INSTITUTIONS
Rating methodology and scorecard factors
Exhibit 5
Sparebanken MoreMacro FactorsWeighted Macro Profile Very
Strong -100%
Factor HistoricRatio
MacroAdjusted
Score
CreditTrend
Assigned Score Key driver #1 Key driver #2
SolvencyAsset RiskProblem Loans / Gross Loans 0.9% aa2 ←→ a2 Geographical
concentrationSector diversification
CapitalTangible Common Equity / Risk Weighted Assets(Basel II)
16.9% aa2 ←→ aa3 Risk-weightedcapitalisation
ProfitabilityNet Income / Tangible Assets 0.9% baa1 ←→ baa2 Expected trend
Combined Solvency Score aa3 a2LiquidityFunding StructureMarket Funds / Tangible Banking Assets 24.9% baa1 ←→ ba1 Extent of market
funding relianceLiquid ResourcesLiquid Banking Assets / Tangible Banking Assets 12.8% baa3 ←→ baa3 Stock of liquid assets
Combined Liquidity Score baa2 ba1Financial Profile baa1Qualitative Adjustments Adjustment
Business Diversification 0Opacity and Complexity 0Corporate Behavior 0
Total Qualitative Adjustments 0Sovereign or Affiliate constraint AaaScorecard Calculated BCA range a3 - baa2Assigned BCA baa1Affiliate Support notching 0Adjusted BCA baa1
Balance Sheet In-scope(NOK Million)
% In-scope At failure(NOK Million)
% At failure
Other liabilities 27,924 39.3% 31,501 44.3%Deposits 35,066 49.3% 31,489 44.3%
Preferred deposits 25,949 36.5% 24,651 34.7%Junior Deposits 9,117 12.8% 6,838 9.6%
Senior senior unsecured bank debt 0 0.0% 0 0.0%Senior unsecured bank debt 4,621 6.5% 4,621 6.5%Junior senior unsecured bank debt 0 0.0% 0 0.0%Dated subordinated bank debt 703 1.0% 703 1.0%Junior subordinated bank debt 0 0.0% 0 0.0%Preference shares (bank) 647 0.9% 647 0.9%Senior unsecured holding company debt 0 0.0% 0 0.0%Dated subordinated holding company debt 0 0.0% 0 0.0%Junior subordinated holding company debt 0 0.0% 0 0.0%Preference shares(holding company) 0 0.0% 0 0.0%Equity 2,133 3.0% 2,133 3.0%Total Tangible Banking Assets 71,094 100.0% 71,094 100.0%
8 13 June 2019 Sparebanken More: Update to credit analysis

MOODY'S INVESTORS SERVICE FINANCIAL INSTITUTIONS
De jure waterfall De facto waterfall NotchingDebt ClassInstrumentvolume +
subordination
Sub-ordination
Instrumentvolume +
subordination
Sub-ordination
De jure De factoLGF
notchingguidance
versusBCA
AssignedLGF
notching
Additionalnotching
PreliminaryRating
Assessment
Counterparty Risk Rating 21% 21% 21% 21% 3 3 3 3 0 a1Counterparty Risk Assessment 21% 21% 21% 21% 3 3 3 3 0 a1(cr)Deposits 21% 5% 21% 11% 2 3 2 2 0 a2
Instrument Class Loss GivenFailure notching
Additionalnotching
Preliminary RatingAssessment
GovernmentSupport notching
Local Currency rating ForeignCurrency
ratingCounterparty Risk Rating 3 0 a1 - A1 A1Counterparty Risk Assessment 3 0 a1(cr) - A1(cr)Deposits 2 0 a2 - A2 A2[1]Where dashes are shown for a particular factor (or sub-factor), the score is based on non-public information.Source: Moody’s Investors Service
Ratings
Exhibit 6Category Moody's RatingSPAREBANKEN MORE
Outlook StableCounterparty Risk Rating A1/P-1Bank Deposits A2/P-1Baseline Credit Assessment baa1Adjusted Baseline Credit Assessment baa1Counterparty Risk Assessment A1(cr)/P-1(cr)Issuer Rating A2
Source: Moody's Investors Service
Endnotes1 Based on on-balance sheet lending nationwide, using Statistic Norway data as of February 2019
9 13 June 2019 Sparebanken More: Update to credit analysis

MOODY'S INVESTORS SERVICE FINANCIAL INSTITUTIONS
© 2019 Moody’s Corporation, Moody’s Investors Service, Inc., Moody’s Analytics, Inc. and/or their licensors and affiliates (collectively, “MOODY’S”). All rights reserved.
CREDIT RATINGS ISSUED BY MOODY'S INVESTORS SERVICE, INC. AND ITS RATINGS AFFILIATES (“MIS”) ARE MOODY’S CURRENT OPINIONS OF THE RELATIVE FUTURE CREDITRISK OF ENTITIES, CREDIT COMMITMENTS, OR DEBT OR DEBT-LIKE SECURITIES, AND MOODY’S PUBLICATIONS MAY INCLUDE MOODY’S CURRENT OPINIONS OF THERELATIVE FUTURE CREDIT RISK OF ENTITIES, CREDIT COMMITMENTS, OR DEBT OR DEBT-LIKE SECURITIES. MOODY’S DEFINES CREDIT RISK AS THE RISK THAT AN ENTITYMAY NOT MEET ITS CONTRACTUAL FINANCIAL OBLIGATIONS AS THEY COME DUE AND ANY ESTIMATED FINANCIAL LOSS IN THE EVENT OF DEFAULT OR IMPAIRMENT. SEEMOODY’S RATING SYMBOLS AND DEFINITIONS PUBLICATION FOR INFORMATION ON THE TYPES OF CONTRACTUAL FINANCIAL OBLIGATIONS ADDRESSED BY MOODY’SRATINGS. CREDIT RATINGS DO NOT ADDRESS ANY OTHER RISK, INCLUDING BUT NOT LIMITED TO: LIQUIDITY RISK, MARKET VALUE RISK, OR PRICE VOLATILITY. CREDITRATINGS AND MOODY’S OPINIONS INCLUDED IN MOODY’S PUBLICATIONS ARE NOT STATEMENTS OF CURRENT OR HISTORICAL FACT. MOODY’S PUBLICATIONS MAYALSO INCLUDE QUANTITATIVE MODEL-BASED ESTIMATES OF CREDIT RISK AND RELATED OPINIONS OR COMMENTARY PUBLISHED BY MOODY’S ANALYTICS, INC. CREDITRATINGS AND MOODY’S PUBLICATIONS DO NOT CONSTITUTE OR PROVIDE INVESTMENT OR FINANCIAL ADVICE, AND CREDIT RATINGS AND MOODY’S PUBLICATIONSARE NOT AND DO NOT PROVIDE RECOMMENDATIONS TO PURCHASE, SELL, OR HOLD PARTICULAR SECURITIES. NEITHER CREDIT RATINGS NOR MOODY’S PUBLICATIONSCOMMENT ON THE SUITABILITY OF AN INVESTMENT FOR ANY PARTICULAR INVESTOR. MOODY’S ISSUES ITS CREDIT RATINGS AND PUBLISHES MOODY’S PUBLICATIONSWITH THE EXPECTATION AND UNDERSTANDING THAT EACH INVESTOR WILL, WITH DUE CARE, MAKE ITS OWN STUDY AND EVALUATION OF EACH SECURITY THAT IS UNDERCONSIDERATION FOR PURCHASE, HOLDING, OR SALE.
MOODY’S CREDIT RATINGS AND MOODY’S PUBLICATIONS ARE NOT INTENDED FOR USE BY RETAIL INVESTORS AND IT WOULD BE RECKLESS AND INAPPROPRIATE FORRETAIL INVESTORS TO USE MOODY’S CREDIT RATINGS OR MOODY’S PUBLICATIONS WHEN MAKING AN INVESTMENT DECISION. IF IN DOUBT YOU SHOULD CONTACTYOUR FINANCIAL OR OTHER PROFESSIONAL ADVISER. ALL INFORMATION CONTAINED HEREIN IS PROTECTED BY LAW, INCLUDING BUT NOT LIMITED TO, COPYRIGHT LAW,AND NONE OF SUCH INFORMATION MAY BE COPIED OR OTHERWISE REPRODUCED, REPACKAGED, FURTHER TRANSMITTED, TRANSFERRED, DISSEMINATED, REDISTRIBUTEDOR RESOLD, OR STORED FOR SUBSEQUENT USE FOR ANY SUCH PURPOSE, IN WHOLE OR IN PART, IN ANY FORM OR MANNER OR BY ANY MEANS WHATSOEVER, BY ANYPERSON WITHOUT MOODY’S PRIOR WRITTEN CONSENT.
CREDIT RATINGS AND MOODY’S PUBLICATIONS ARE NOT INTENDED FOR USE BY ANY PERSON AS A BENCHMARK AS THAT TERM IS DEFINED FOR REGULATORY PURPOSESAND MUST NOT BE USED IN ANY WAY THAT COULD RESULT IN THEM BEING CONSIDERED A BENCHMARK.
All information contained herein is obtained by MOODY’S from sources believed by it to be accurate and reliable. Because of the possibility of human or mechanical error as wellas other factors, however, all information contained herein is provided “AS IS” without warranty of any kind. MOODY'S adopts all necessary measures so that the information ituses in assigning a credit rating is of sufficient quality and from sources MOODY'S considers to be reliable including, when appropriate, independent third-party sources. However,MOODY’S is not an auditor and cannot in every instance independently verify or validate information received in the rating process or in preparing the Moody’s publications.
To the extent permitted by law, MOODY’S and its directors, officers, employees, agents, representatives, licensors and suppliers disclaim liability to any person or entity for anyindirect, special, consequential, or incidental losses or damages whatsoever arising from or in connection with the information contained herein or the use of or inability to use anysuch information, even if MOODY’S or any of its directors, officers, employees, agents, representatives, licensors or suppliers is advised in advance of the possibility of such losses ordamages, including but not limited to: (a) any loss of present or prospective profits or (b) any loss or damage arising where the relevant financial instrument is not the subject of aparticular credit rating assigned by MOODY’S.
To the extent permitted by law, MOODY’S and its directors, officers, employees, agents, representatives, licensors and suppliers disclaim liability for any direct or compensatorylosses or damages caused to any person or entity, including but not limited to by any negligence (but excluding fraud, willful misconduct or any other type of liability that, for theavoidance of doubt, by law cannot be excluded) on the part of, or any contingency within or beyond the control of, MOODY’S or any of its directors, officers, employees, agents,representatives, licensors or suppliers, arising from or in connection with the information contained herein or the use of or inability to use any such information.
NO WARRANTY, EXPRESS OR IMPLIED, AS TO THE ACCURACY, TIMELINESS, COMPLETENESS, MERCHANTABILITY OR FITNESS FOR ANY PARTICULAR PURPOSE OF ANY CREDITRATING OR OTHER OPINION OR INFORMATION IS GIVEN OR MADE BY MOODY’S IN ANY FORM OR MANNER WHATSOEVER.
Moody’s Investors Service, Inc., a wholly-owned credit rating agency subsidiary of Moody’s Corporation (“MCO”), hereby discloses that most issuers of debt securities (includingcorporate and municipal bonds, debentures, notes and commercial paper) and preferred stock rated by Moody’s Investors Service, Inc. have, prior to assignment of any rating,agreed to pay to Moody’s Investors Service, Inc. for ratings opinions and services rendered by it fees ranging from $1,000 to approximately $2,700,000. MCO and MIS also maintainpolicies and procedures to address the independence of MIS’s ratings and rating processes. Information regarding certain affiliations that may exist between directors of MCO andrated entities, and between entities who hold ratings from MIS and have also publicly reported to the SEC an ownership interest in MCO of more than 5%, is posted annually atwww.moodys.com under the heading “Investor Relations — Corporate Governance — Director and Shareholder Affiliation Policy.”
Additional terms for Australia only: Any publication into Australia of this document is pursuant to the Australian Financial Services License of MOODY’S affiliate, Moody’s InvestorsService Pty Limited ABN 61 003 399 657AFSL 336969 and/or Moody’s Analytics Australia Pty Ltd ABN 94 105 136 972 AFSL 383569 (as applicable). This document is intendedto be provided only to “wholesale clients” within the meaning of section 761G of the Corporations Act 2001. By continuing to access this document from within Australia, yourepresent to MOODY’S that you are, or are accessing the document as a representative of, a “wholesale client” and that neither you nor the entity you represent will directly orindirectly disseminate this document or its contents to “retail clients” within the meaning of section 761G of the Corporations Act 2001. MOODY’S credit rating is an opinion as tothe creditworthiness of a debt obligation of the issuer, not on the equity securities of the issuer or any form of security that is available to retail investors.
Additional terms for Japan only: Moody's Japan K.K. (“MJKK”) is a wholly-owned credit rating agency subsidiary of Moody's Group Japan G.K., which is wholly-owned by Moody’sOverseas Holdings Inc., a wholly-owned subsidiary of MCO. Moody’s SF Japan K.K. (“MSFJ”) is a wholly-owned credit rating agency subsidiary of MJKK. MSFJ is not a NationallyRecognized Statistical Rating Organization (“NRSRO”). Therefore, credit ratings assigned by MSFJ are Non-NRSRO Credit Ratings. Non-NRSRO Credit Ratings are assigned by anentity that is not a NRSRO and, consequently, the rated obligation will not qualify for certain types of treatment under U.S. laws. MJKK and MSFJ are credit rating agencies registeredwith the Japan Financial Services Agency and their registration numbers are FSA Commissioner (Ratings) No. 2 and 3 respectively.
MJKK or MSFJ (as applicable) hereby disclose that most issuers of debt securities (including corporate and municipal bonds, debentures, notes and commercial paper) and preferredstock rated by MJKK or MSFJ (as applicable) have, prior to assignment of any rating, agreed to pay to MJKK or MSFJ (as applicable) for ratings opinions and services rendered by it feesranging from JPY125,000 to approximately JPY250,000,000.
MJKK and MSFJ also maintain policies and procedures to address Japanese regulatory requirements.
REPORT NUMBER 1175952
10 13 June 2019 Sparebanken More: Update to credit analysis

MOODY'S INVESTORS SERVICE FINANCIAL INSTITUTIONS
CLIENT SERVICES
Americas 1-212-553-1653
Asia Pacific 852-3551-3077
Japan 81-3-5408-4100
EMEA 44-20-7772-5454
11 13 June 2019 Sparebanken More: Update to credit analysis