sparse pls discriminant analysis: biologically relevant
TRANSCRIPT

Sparse PLS discriminant analysis: biologicallyrelevant feature selection and graphical displaysfor multiclass problemsLê Cao et al.
Lê Cao et al. BMC Bioinformatics 2011, 12:253http://www.biomedcentral.com/1471-2105/12/253 (22 June 2011)

RESEARCH ARTICLE Open Access
Sparse PLS discriminant analysis: biologicallyrelevant feature selection and graphical displaysfor multiclass problemsKim-Anh Lê Cao1*, Simon Boitard2 and Philippe Besse3
Abstract
Background: Variable selection on high throughput biological data, such as gene expression or single nucleotidepolymorphisms (SNPs), becomes inevitable to select relevant information and, therefore, to better characterizediseases or assess genetic structure. There are different ways to perform variable selection in large data sets.Statistical tests are commonly used to identify differentially expressed features for explanatory purposes, whereasMachine Learning wrapper approaches can be used for predictive purposes. In the case of multiple highlycorrelated variables, another option is to use multivariate exploratory approaches to give more insight into cellbiology, biological pathways or complex traits.
Results: A simple extension of a sparse PLS exploratory approach is proposed to perform variable selection in amulticlass classification framework.
Conclusions: sPLS-DA has a classification performance similar to other wrapper or sparse discriminant analysisapproaches on public microarray and SNP data sets. More importantly, sPLS-DA is clearly competitive in terms ofcomputational efficiency and superior in terms of interpretability of the results via valuable graphical outputs. sPLS-DA is available in the R package mixOmics, which is dedicated to the analysis of large biological data sets.
BackgroundHigh throughput technologies, such as microarrays orsingle nucleotide polymorphisms (SNPs) are seen as agreat potential to gain new insights into cell biology,biological pathways or to assess population geneticstructure. Microarray technique has been mostly used tofurther delineate cancers subgroups or to identify candi-date genes for cancer prognosis and therapeutic target-ing. To this aim, various classification techniques havebeen applied to analyze and understand gene expressiondata resulting from DNA microarrays ([1-3], to cite onlya few). Genome wide association studies using SNPsaim to identify genetic variants related to complex traits.Thousands of SNPs are genotyped for a small numberof phenotypes with genomic information, and clusteringmethods such as Bayesian cluster analysis and
multidimensional scaling were previously applied toinfer about population structure [4].
Variable selectionAs these high throughput data are characterized bythousands of variables (genes, SNPs) and a small num-ber of samples (the microarrays or the patients), theyoften imply a high degree of multicollinearity, and, as aresult, lead to severely ill-conditioned problems. In asupervised classification framework, one solution is toreduce the dimensionality of the data either by perform-ing feature selection, or by introducing artificial vari-ables that summarize most of the information. For thispurpose, many approaches have been proposed in themicroarray literature. Commonly used statistical testssuch as t- or F-tests are often sensitive to highly corre-lated variables, which might be neglected in the variableselection. These tests may also discard variables thatwould be useful to distinguish classes that are difficultto classify [5]. Machine Learning approaches, such asClassification and Regression Trees (CART, [6]),
* Correspondence: [email protected] Facility for Advanced Bioinformatics, University of Queensland,4072 St Lucia, QLD, AustraliaFull list of author information is available at the end of the article
Lê Cao et al. BMC Bioinformatics 2011, 12:253http://www.biomedcentral.com/1471-2105/12/253
© 2011 Lê Cao et al; licensee BioMed Central Ltd. This is an Open Access article distributed under the terms of the Creative CommonsAttribution License (http://creativecommons.org/licenses/by/2.0), which permits unrestricted use, distribution, and reproduction inany medium, provided the original work is properly cited.

Support Vector Machines (SVM, [7]) do not necessarilyrequire variable selection for predictives purposes. How-ever, in the case of highly dimensional data sets, theresults are often difficult to interpret given the largenumber of variables. To circumvent this problem, sev-eral authors developed wrapper and embeddedapproaches for microarray data: Random Forests (RF,[8]), Recursive Feature Elimination (RFE, [3]), NearestShrunken Centroids (NSC, [9]), and more recently Opti-mal Feature Weighting (OFW, [5,10]). Other approacheswere also used for exploratory purposes and to givemore insight into biological studies. This is the case ofLinear Discriminant Analysis (LDA), Principal Compo-nent Analysis (PCA, see [11,12] for a supervised ver-sion), Partial Least Squares Regression (PLS, [13], seealso [14-16] for discrimination purposes), to explainmost of the variance/covariance structure of the datausing linear combinations of the original variables. LDAhas often been shown to produce the best classificationresults. However, it has numerical limitations. In parti-cular, for large data sets with too many correlated pre-dictors, LDA uses too many parameters that areestimated with a high variance. There is therefore aneed to either regularize LDA or introduce sparsity inLDA to obtain a parsimonious model. Another limita-tion of the approaches cited above is the lack of inter-pretability when dealing with a large number ofvariables.Numerous sparse versions have therefore been pro-
posed for feature selection purpose. They adapt wellknown ideas in the regression context by introducingpenalties in the model. For example, a l2 norm penaltyleads to Ridge regression [17] to regularize non inverti-ble singular matrices. In particular, penalties of type l1norm, also called Lasso [18], or l0 norm, were also pro-posed to perform feature selection, as well as a combi-nation of l1 and l2 penalties [19]. These penalties (l1and/or l2) were applied to the variable weight vectors inorder to select the relevant variables in PCA [20,21] andmore recently in Canonical Correlation Analysis [22-24]and in PLS [25-27]. [28,29] also proposed a penalizedversion of the PLS for binary classification problems.Recently, [30] extended the SPLS from [27] for multi-class classification problems and demonstrated that bothSPLSDA and SPLS with an incorporated generalized fra-mework (SGPLS) improved classification accuracy com-pared to classical PLS [31-33].
Multiclass problemsIn this study, we specifically focus on multiclass classifi-cation problems. Multiclass problems are commonlyencountered in microarray studies, and have recentlygiven rise to several contributions in the literature [34]and more recently [35,36]. Extending binary classification
approaches to multiclass problems is not a trivial task.Some approaches can naturally extend to multiclass pro-blems, this is the case of CART or LDA. Otherapproaches require the decomposition of the multiclassproblem into several binary problems, or the definition ofmulticlass objective functions. This is the case, for exam-ple, of SVM one-vs.-one, one-vs.-rest or multiclass SVM.
Sparse PLS-DAWe introduce a sparse version of the PLS for discrimi-nation purposes (sPLS-Discriminant Analysis) which is anatural extension to the sPLS proposed by [25,26].Although PLS is principally designed for regression pro-blems, it performs well for classification problems[37,38]. Using this exploratory approach in a supervisedclassification context enables to check the generalizationproperties of the model and be assured that the selectedvariables can help predicting the outcome status of thepatients. It is also important to check the stability of theselection, as proposed by [39,40]. We show that sPLS-DA has very satisfying predictive performances and iswell able to select informative variables. In contrary tothe two-stages approach recently proposed by [30],sPLS-DA performs variable selection and classificationin a one step procedure. We also give a strong focus tographical representations to aid the interpretation of theresults. We show that the computational efficiency ofsPLS-DA, combined with graphical outputs clearly givesPLS-DA a strong advantage to the other types of onestep procedure variable selection approaches in the mul-ticlass case.
Outline of the paperWe will first discuss the number of dimensions tochoose in sPLS-DA, and compare its classification per-formance with multivariate projection-based approaches:variants of sLDA [41], variants of SPLSDA and withSGPLS from [30]; and with five multiclass wrapperapproaches (RFE, NSC, RF, OFW-cart, OFW-svm) onfour public multiclass microarray data sets and one pub-lic SNP data set. All approaches perform internal vari-able selection and are compared based on theirgeneralization performance and their computationaltime. We discuss the stability of the variable selectionperformed with sPLS-DA and the biological relevancy ofthe selected genes. Unlike the other projection-basedsparse approaches tested, we show that sPLS-DA pro-poses valuable graphical outputs, also available from ourR package mixOmics, to guide the interpretation of theresults [42,43].
Results and DiscussionIn this section, we compare our proposed sPLS-DAapproach with other sparse exploratory approaches such
Lê Cao et al. BMC Bioinformatics 2011, 12:253http://www.biomedcentral.com/1471-2105/12/253
Page 2 of 16

as two sparse Linear Discriminant Analyses (LDA) pro-posed by [41], and three other versions of sparse PLSfrom [30]. We also include in our comparisons severalwrapper multiclass classification approaches. Compari-sons are made on four public cancer microarray datasets and on one SNP data set. All these approaches per-form variable selection in a supervised classification set-ting, i.e. we are looking for the genes/SNPs which canhelp classifying the different sample classes.We first discuss the choice of the number of dimen-
sions H to choose with sPLS-DA, the classification per-formance obtained with the tested approaches and thecomputational time required for the exploratoryapproaches. We then perform a stability analysis withsPLS-DA that can help tuning the number of variablesto select and we illustrate some useful graphical outputsresulting from the by-products of sPLS-DA. We finallyassess the biological relevancy of the list of genesobtained on one data set.
Data setsLeukemiaThe 3-class Leukemia version [1] with 7129 genes com-pares the lymphocytes B and T in ALL (Acute Lympho-blastic Leukemia, 38 and 9 cases) and the AML class(Acute Myeloid Leukemia, 25 cases). The classes AML-B and AML-T are known to be biologically very similar,which adds some complexity in the data set.SRBCTThe Small Round Blue-Cell Tumor Data of childhood(SRBCT, [44]) includes 4 different types of tumors with23, 20, 12 and 8 microarrays per class and 2308 genes.BrainThe Brain data set compares 5 embryonal tumors [45]with 5597 gene expression. Classes 1, 2 and 3 count 10microarrays each, the remaining classes 4 and 8.GCMThe Multiple Tumor data set initially compared 14tumors [46] and 7129 gene expressions. We used thenormalized data set from [47] with 11 types of tumor.The data set contains 90 samples coming from differenttumor types: breast (7), central nervous system (12),colon (10), leukemia (29), lung (6), lymphoma (19), mel-anoma (5), mesotheolima (11), pancreas (7), renal (8)and uterus (9).SNP dataThe SNP data set considered in our study is a subsam-ple of the data set studied by [48] in the context of theHuman Genome Diversity Project, which was initiatedfor the purpose of assessing worldwide genetic diversityin human. The original data set of [48] included thegenotypes at 525,910 single-nucleotide polymorphisms(SNPs) of 485 individuals from a worldwide sample of29 populations. In order to work on a smaller sample
size data set with still a large number of classes orpopulations (K = 7) and with a high complexity classifi-cation, we chose to keep only the African populations:Bantu Kenya, Bantu South Africa, Biaka Pygmy, Man-denka, Mbuty Pygmy, San and Yoruba. We filtered theSNPs with a Minor Allele Frequency> 0.05. For compu-tational reasons, in particular to run the evaluation pro-cedures using the wrapper methods, we randomlysampled 20,000 SNPs amongst the ones of the originaldataset. The aim of this preliminary analysis is to showthat sPLS-DA is well able to give satisfying results onbiallelic discrete ordinal data (coded 0, 1 or 2, i.e. thenumber of mutant alleles at one SNP for one individual)compared to the other approaches.
Choosing the number of sPLS-DA dimensionsIn the case of LDA or sparse LDA (sLDA), it is of con-vention to choose the number of discriminant vectors H≤ min(p, K - 1), where p is the total number of variablesand K is the number of classes. The p-dimensional datawill be projected onto a H-dimensional space spannedby the first H discriminant vectors, also called dimen-sions in the case of sPLS.To check if the same applies to sPLS-DA, we have
plotted the mean classification error rate (10 cross-vali-dation averaged 10 times) for each sPLS-DA dimension(Figure 1 for the Brain and SNP data sets, see Addi-tional file 1 for the other data sets). We can observethat the estimated error rate is stabilized after the firstK - 1 dimensions for any number of selected variablesfor the microarray data sets. For the SNP data set, Hshould be set to K - 2. The latter result is surprising,but can be explained by the high similarity between twoof the classes: the Bantu Kenya and Banty South Africapopulations, as illustrated later in the text.Therefore, according to these graphics, reducing the
subspace to the first K - 1 (K - 2) dimensions is suffi-cient to explain the covariance structure of the micro-array (SNP) data. In the following, we only record theclassification error rate obtained after K - 1 (K - 2)deflation steps have been performed with sPLS-DA -this also applies to the tested variants of SPLS from[30].
Comparisons with other multiclass classificationapproachesWe compared the classification performance obtainedwith state-of-the-art classification approaches: RFE [49],NSC [9] and RF [8], as well as a recently proposedapproach: OFW [10] that has been implemented withtwo types of classifiers, CART or SVM and has alsobeen extended to the multiclass case [5]. These wrapperapproaches include an internal variable selection proce-dure to perform variable selection.
Lê Cao et al. BMC Bioinformatics 2011, 12:253http://www.biomedcentral.com/1471-2105/12/253
Page 3 of 16

We compared the classification performance of sPLS-DA to sLDA variants proposed by [41] based on apooled centroids formulation of the LDA predictorfunction. The authors introduced feature selection byusing correlation adjusted t-scores to deal with highlydimensional problems. Two shrinkage approaches wereproposed, with the classical LDA (subsequently calledsLDA) as well as with the diagonal discriminant analysis(sDDA). The reader can refer to [41] for more detailsand the associated R package sda.Finally, we included the results obtained with 3 other
versions of sparse PLS proposed by [30]. The SPLSDAformulation is very similar to what we propose in sPLS-DA, except that the variable selection and the classifica-tion is performed in two stages - whereas the predictionstep in sPLS-DA is directly obtained from the by-pro-ducts of the sPLS - see Section Methods. The authors in[30] therefore proposed to apply different classifiersonce the variable selection is performed: Linear Discri-minant Analysis (SPLSDA-LDA) or a logistic regression(SPLSDA-LOG). The authors also proposed a one-stageapproach SGPLS by incorporating SPLS into a general-ized linear model framework for a better sensitivity formulticlass classification. These approaches are imple-mented in the R package spls.Figure 2 displays the classification error rates esti-
mated on each of the five data sets for all the testedapproaches and Table 1 records the computational timerequired by the exploratory approaches to train the dataon a given number of selected variables. Table 2 indi-cates the minimum estimated classification error rateobtained on each data set and for most of theapproaches. Note that this table should be interpreted inconjunction with the results displayed in Figure 2 toobtain a better comprehensive understanding of how allapproaches perform in relation with each other.Details about the analysisThe aim of this section is to compare the classificationperformance of different types of variable selection
approaches that may require some parameters to tune.We performed 10 fold cross-validation and averaged theobtained classification error rate accross 10 repetitions,and this for different variable selection sizes (Figure 2).The wrapper approaches were run with the default
parameters or the parameters proposed by the authors[8,50]. The sDDA and sLDA approaches are actuallytwo-stages approaches as variables need to be rankedfirst before sLDA/DDA can be applied, but they do notrequire any other input parameter than the number ofvariables to select. sPLS-DA, SPLSDA-LOG/LDA andSGPLS require as input the number of PLS dimensionsas discussed above. In addition, while sPLS-DA requiresthe number of variables to select on each dimension asan input parameter, SPLSDA-LOG/LDA and SGPLSrequire to tune the h parameter that varies between 0and 1 - the closer to 1 the smaller variable selectionsize, so that it matched the variable selection sizes withthe other approaches. SPLSDA-LOG/LDA are per-formed in two steps: one step for variable selection withSPLS and one step for classification.Complexity of the data setsAll data sets differ in their complexity. For example, the4-class SRBCT data set is known to be easy to classify[5] and most approaches - except NSC, have similargood performances. Analogously, the GCM data set thatcontains numerous classes (11) gives similar overall clas-sification error rates for all approaches. The Brain andLeukemia data sets with 5 and 3 classes respectivelyseem to increase in complexity, and, therefore, lead tomore accentuated discrepancies between the differentapproaches. The SNP data set is more complex due tothe discrete ordinal nature of the data (3 possible valuesfor each variable), a high number of populations (7) thathave similar characteristics - some of them, for instanceBantu Kenya and Bantu South Africa, are closely related.Consequently, it can be expected that a large number ofSNP may be needed to discriminate at best the differentpopulations. This is what we observe, but, nonetheless,
Figure 1 Choosing the number of dimensions in sPLS-DA. Estimated classification error rates for Brain and SNP (10 cross-validation averaged10 times) with respect to each sPLS-DA dimension. The different lines represent the number of variables selected on each dimension (goingfrom 5 to p).
Lê Cao et al. BMC Bioinformatics 2011, 12:253http://www.biomedcentral.com/1471-2105/12/253
Page 4 of 16

most approaches (except OFW) perform well, in parti-cular NSC.Computational efficiencyWe only recorded the computational time of theexploratory approaches sDDA, sLDA, SPLSDA-LOG,SPLSDA-LDA, SGPLS and sPLS-DA as the wrapperapproaches are computationally very greedy (the trainingcould take from 15 min up to 1 h on these data). Some
computation time could not be recorded as a R memoryallocation problem was encountered (SNP data forsLDA and SGPLS).The fastest approach is sDDA (except for Leukemia).
This approach is not necessarily the one that performsthe best, but is certainly the most efficient on large datasets. sPLS-DA is the second fastest one. The SPLSDAapproaches were efficient on SRBCT but otherwise
number of genes
erro
r rat
e
5 10 15 20 25 30 35 40 45 50 100 200 500 7129
0.20
0.25
0.30
0.35
0.40
0.45
0.50
Leukemia
number of genes
erro
r rat
e
5 10 15 20 25 30 35 40 45 50 100 200 500 2308
0.0
0.1
0.2
0.3
0.4
0.5
0.6
SRBCT
number of genes
erro
r rat
e
5 10 15 20 25 30 35 40 45 50 100 200 500 6144
0.10
0.15
0.20
0.25
0.30
0.35
Brain
5 10 15 20 25 30 35 40 45 50 100 200 500 7129
0.0
0.2
0.4
0.6
erro
r rat
e
number of genes
GCM
10 20 50 100 200 500 1000 2000 5000 20000
0.1
0.2
0.3
0.4
0.5
0.6
0.7
erro
r rat
e
SNP Human
number of SNPs
RFEOFW svm
RFOFW cart
NSCsPLS DA
sDDAsLDA
SPLSDA LDASPLSDA LOG
SGPLS
Figure 2 Comparisons of the classification performance with other variable selection approaches. Estimated classification error rates forLeukemia, SRBCT, Brain, GCM and the SNP data set (10 cross-validation averaged 10 times) with respect to the number of selected genes (from5 to p) for the wrapper approaches and the sparse exploratory approaches.
Lê Cao et al. BMC Bioinformatics 2011, 12:253http://www.biomedcentral.com/1471-2105/12/253
Page 5 of 16
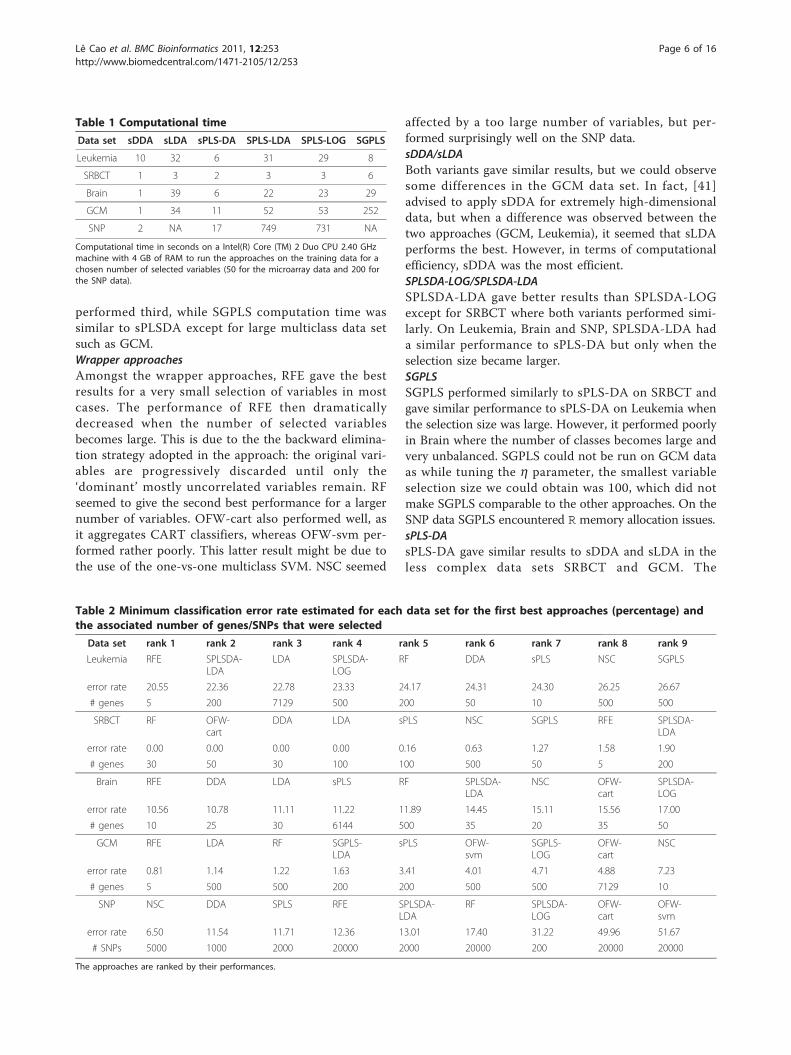
performed third, while SGPLS computation time wassimilar to sPLSDA except for large multiclass data setsuch as GCM.Wrapper approachesAmongst the wrapper approaches, RFE gave the bestresults for a very small selection of variables in mostcases. The performance of RFE then dramaticallydecreased when the number of selected variablesbecomes large. This is due to the the backward elimina-tion strategy adopted in the approach: the original vari-ables are progressively discarded until only the‘dominant’ mostly uncorrelated variables remain. RFseemed to give the second best performance for a largernumber of variables. OFW-cart also performed well, asit aggregates CART classifiers, whereas OFW-svm per-formed rather poorly. This latter result might be due tothe use of the one-vs-one multiclass SVM. NSC seemed
affected by a too large number of variables, but per-formed surprisingly well on the SNP data.sDDA/sLDABoth variants gave similar results, but we could observesome differences in the GCM data set. In fact, [41]advised to apply sDDA for extremely high-dimensionaldata, but when a difference was observed between thetwo approaches (GCM, Leukemia), it seemed that sLDAperforms the best. However, in terms of computationalefficiency, sDDA was the most efficient.SPLSDA-LOG/SPLSDA-LDASPLSDA-LDA gave better results than SPLSDA-LOGexcept for SRBCT where both variants performed simi-larly. On Leukemia, Brain and SNP, SPLSDA-LDA hada similar performance to sPLS-DA but only when theselection size became larger.SGPLSSGPLS performed similarly to sPLS-DA on SRBCT andgave similar performance to sPLS-DA on Leukemia whenthe selection size was large. However, it performed poorlyin Brain where the number of classes becomes large andvery unbalanced. SGPLS could not be run on GCM dataas while tuning the h parameter, the smallest variableselection size we could obtain was 100, which did notmake SGPLS comparable to the other approaches. On theSNP data SGPLS encountered R memory allocation issues.sPLS-DAsPLS-DA gave similar results to sDDA and sLDA in theless complex data sets SRBCT and GCM. The
Table 1 Computational time
Data set sDDA sLDA sPLS-DA SPLS-LDA SPLS-LOG SGPLS
Leukemia 10 32 6 31 29 8
SRBCT 1 3 2 3 3 6
Brain 1 39 6 22 23 29
GCM 1 34 11 52 53 252
SNP 2 NA 17 749 731 NA
Computational time in seconds on a Intel(R) Core (TM) 2 Duo CPU 2.40 GHzmachine with 4 GB of RAM to run the approaches on the training data for achosen number of selected variables (50 for the microarray data and 200 forthe SNP data).
Table 2 Minimum classification error rate estimated for each data set for the first best approaches (percentage) andthe associated number of genes/SNPs that were selected
Data set rank 1 rank 2 rank 3 rank 4 rank 5 rank 6 rank 7 rank 8 rank 9
Leukemia RFE SPLSDA-LDA
LDA SPLSDA-LOG
RF DDA sPLS NSC SGPLS
error rate 20.55 22.36 22.78 23.33 24.17 24.31 24.30 26.25 26.67
# genes 5 200 7129 500 200 50 10 500 500
SRBCT RF OFW-cart
DDA LDA sPLS NSC SGPLS RFE SPLSDA-LDA
error rate 0.00 0.00 0.00 0.00 0.16 0.63 1.27 1.58 1.90
# genes 30 50 30 100 100 500 50 5 200
Brain RFE DDA LDA sPLS RF SPLSDA-LDA
NSC OFW-cart
SPLSDA-LOG
error rate 10.56 10.78 11.11 11.22 11.89 14.45 15.11 15.56 17.00
# genes 10 25 30 6144 500 35 20 35 50
GCM RFE LDA RF SGPLS-LDA
sPLS OFW-svm
SGPLS-LOG
OFW-cart
NSC
error rate 0.81 1.14 1.22 1.63 3.41 4.01 4.71 4.88 7.23
# genes 5 500 500 200 200 500 500 7129 10
SNP NSC DDA SPLS RFE SPLSDA-LDA
RF SPLSDA-LOG
OFW-cart
OFW-svm
error rate 6.50 11.54 11.71 12.36 13.01 17.40 31.22 49.96 51.67
# SNPs 5000 1000 2000 20000 2000 20000 200 20000 20000
The approaches are ranked by their performances.
Lê Cao et al. BMC Bioinformatics 2011, 12:253http://www.biomedcentral.com/1471-2105/12/253
Page 6 of 16

performance obtained on Brain was quite poor, butresults were very competitive in Leukemia for a numberof selected genes varying between 5 and 30. Note thatthe number of selected variables is the total number ofvariables selected accross the K - 1(K - 2) chosendimensions (SNP data). In overall, sPLS-DA gave betterresults than the wrapper approaches, and remained verycompetitive to the other exploratory approaches. Onewinning advantage of sPLS-DA is the graphical outputsthat it can provide (see next Section), as well as its com-putational efficiency.
Stability analysis of sPLS-DAIt is useful to assess how stable the variable selection iswhen the training set is perturbed, as recently proposedby [39,40]. For instance, the idea of bolasso [40] is torandomize the training set by drawing boostrap samplesor drawing n/2 samples in the training set, where n isthe total number of samples. The variable selectionalgorithm is then applied on each subsample with afixed number of variables to select and the variables thatare selected are then recorded [40]. proposed to keep inthe selection only the variables that were selected in allsubsamples, whereas [39] proposed to compute a rela-tive selection frequency and keep the most stable vari-ables in the selection.We chose to illustrate the latter option as we believe
that the stability frequency, or probability, gives a betterunderstanding of the number of stable discriminativevariables that are selected in sPLS-DA. The highly cor-related variables will get a higher probability of beingselected in each subsample, while the noisy variableswill have a probability close to zero. This stability mea-sure can also guide the user in the number of variablesto choose on each sPLS-DA dimension. Once the num-ber of variables to select has been chosen for the firstdimension, the stability analysis should be run for thesecond dimension and so on. Note that [39] proposedan additional perturbation by introducing randomweights in the Lasso coefficients, called random lasso.This latter approach could not, however, be directlyapplied in the sPLS-DA algorithm due to its iterativenature.Figure 3 illustrates the stability frequencies for the first
two dimensions of the sPLS-DA for the GCM and SNPdata sets using bootstrap sampling (i.e. of size n). Thefrequencies obtained on the GCM data set clearly showthat the first 3 variables are often selected accrossnumerous bootstrap samples on the first dimension. Wecan see that while most microarray data could achieve areasonably high stability frequency (see Additional file2), this was not the case, however, for the SNP data.Several SNPs may contain similar information, this mayinduce a lower stability across the bootstrap samples for
a small variable selection. Once the variable selectionsize grows larger, then there is enough stable informa-tion to be retained.We also noticed that once we reached too many
dimensions (i.e. close K - 1), then the frequencies of allvariables dropped, which clearly showed that sPLS-DAcould not distinguish between discriminative variablesand noisy variables any more (not shown).
Data visualization with sPLS-DARepresenting the samples and the variablesData interpretation is crucial for a better understanding ofhighly dimensional biological data sets. Data visualizationis one of the clear advantage of projection-based methods,such a Principal Component Analysis (PCA), the originalPLS-DA or sPLS-DA, compared to the other testedapproaches (wrapper methods, SPLSDA and SGPLS). Thedecomposition of the data matrix into loading vectors andlatent variables provide valuable graphical outputs to easilyvisualize the results. For example, the latent variables canbe used to represent the similarities and dissimilaritiesbetween the samples: Figure 4 illustrates the difference inthe sample representation between classical PLS-DA (novariable selection) and sPLS-DA (26 genes selected on thefirst 2 dimensions) for the Brain data set. Variable selec-tion for highly dimensional data sets can be beneficial toremove the noise and improve the samples clustering. A3D graphical representation can be found in Additionalfile 3 with sPLS-DA. Figures 5, 6 and 7 compare the sam-ple representation on the SNP data set using PCA (SNPdata set only), classical PLS-DA and sPLS-DA on severalprincipal components or PLS dimensions. On the full dataset, PCA is able to discriminate the African hunter gath-erers populations San, Mbuti and Biaka from the 4 otherpopulations that are very similar (Mandeka, Yoruba, BantuSouth Africa and Bantu Kenya). This is a fact that was pre-viously observed [48] and it indicates a good quality of thedata. With PCA however, the differentiation between the4 populations Mandeka, Yoruba, Bantu South Africa andBantu Kenya is not very clear, even for further dimensions(Figure 5). On the contrary to PCA, PLS-DA (Figure 6)and sPLS-DA (Figure 7) are able to discriminate furtherthese 4 populations on dimensions 4 and 5. In particular,the Mandeka population is well differentiated on dimen-sion 4, and so is the Yaruba population on dimension 5. Interms of sample representation and in contrary to whatwas obtained with the Brain data set (Figure 4), the differ-ence between PLS-DA and sPLS-DA is not striking onthis particular data set. This is probably because the SNPvariables, although containing redundant information, areall informative and mostly not noisy. This also explainsthe good population clusters obtained with PCA (Figure5). However, the variable selection performed in sPLS-DAhas two advantages: firstly it reduces the size of the data
Lê Cao et al. BMC Bioinformatics 2011, 12:253http://www.biomedcentral.com/1471-2105/12/253
Page 7 of 16

set for further investigation and analyses; secondly, sinceeach (s)PLS dimension focuses on the differentiation ofsome particular populations (Figures 5 and 6) and sincesPLS selects an associated subset of variables on each onthese dimensions, each of these subsets of variables is wellable to differentiate these particular populations. This vari-able selection therefore gives more insight into the data(see [25] for more details). Figure 8 illustrates the weightsin absolute value of the sparse loading vectors for eachsPLS-DA dimension in the Brain data set. Only the geneswith a non-zero weight are considered in the sPLS-DAanalysis and were included in the gene selection (50 genesin total for this example). Generally, the sparse loadingvectors are orthogonal to each other, which permits touniquely select genes across all dimensions. The latentvariables can also be used to compute pairwise correla-tions between the genes to visualize them on correlationcircles and better understand the correlation between thegenes on each dimension (Figure 9(a)). Note that this typeof output is commonly used for Canonical CorrelationAnalysis.
On the contrary, the pooled centroid formulation usedin sDDA and sLDA do not provide such latent variables,and, therefore, lack of such useful outputs. The samecan be said about the wrapper approaches, which oftenhave a much higher computational cost than the sparseexploratory approaches applied in this study.
Brain data set: biological interpretationComparisons between the gene listsThe ultimate aim when performing variable selection isto investigate whether the selected genes (or SNPS)have a biological meaning. We saw for example thatsome of the tested approaches gave similar perfor-mances, even though they select different variables.We therefore compared the lists of 50 genes selected
with the different approaches on the Brain data set.Note that the selection size has to be large enough toextract known biological information from manuallycurated databases.Unsurprisingly, given the variety of approaches used,
there were not many genes in common: there were
Figure 3 Stability analysis. Stability frequency using bolasso for the first two dimensions of sPLS-DA for GCM (top) and SNP data (bottom).One has to sequentially choose the most stabler genes/SNPs in the first dimension in order to pursue the stability analysis for the next sPLS-DAdimension.
Lê Cao et al. BMC Bioinformatics 2011, 12:253http://www.biomedcentral.com/1471-2105/12/253
Page 8 of 16

between 12 and 30 genes shared between sPLS-DA,sDDA, sLDA and SPLDA - sDDA and sLDA shared themost important number of genes (30). The gene selec-tion from SGPLS grandly differed from the other multi-variate approaches (between 2 and 9 genes). This mayexplain why the performance of SGPLS was pretty poorcompared to the other approaches on the Brain data set.RF seemed to be the approach that selected the highestnumber of genes in common with all approaches exceptwith NSC (between 10 and 23 genes). A fact to beexpected was that there were very few commonlyselected genes between the exploratory approaches andthe wrapper approaches (between 2 and 10 genes).We then investigated further the biological meaning of
the selected genes. This analysis was performed with theGeneGo software [4] that outputs process networks,gene ontology processes as well as the list of diseasespotentially linked with the selected genes.
It was interesting to see that in all these gene lists(except NSC and RFE), between 3 to 5 genes werelinked to networks involved in neurogenesis, apoptosis,as well as DNA damage (sPLS-DA, sDDA) and neuro-physiological processes (OFW-cart). Most of the liststhat were selected with the wrapper approaches gener-ated interesting gene ontology processes, such as degen-eration of neurons (RF), synaptic transmission orgeneration of neurons (OFW-svm). On the contrary, thesparse exploratory approaches seemed to pinpointpotential biomarkers linked with relevant diseases: cen-tral nervous system and brain tumor (sPLS-DA), SturgeWeber syndrome, angiomatosis, brain stem (sDDA,sLDA), neurocutaneous syndrome (sDDA), neurologicmanifestations and cognition disorders (SGPLS).This preliminary analysis shows that the different
approaches are able to select relevant genes linked tothe biological study and are able to select complemen-tary information. This was also the conclusion drawn in[10].Further biological interpretation with the sPLS-DA listUsing the GeneGo software, known biological networkswere generated from the list of genes selected withsPLS-DA - 26 genes in total for the first two dimen-sions. For example, the network represented in Figure 9(b) is based on 12 of these selected genes (indicatedwith a red dot), which are involved in biological func-tions such as cell differentiation, cellular developmentalprocess and central nervous system development. Thesegenes are organised around two transcription factors,ESR1 and SP1. SP1 can activate or repress transcriptionin response to physiological and pathological stimuliand regulates the expression of a large number of genesinvolved in a variety of processes such as cell growth,apoptosis, differentiation and immune responses.Interestingly, all 12 genes present in the network were
also found to be highly correlated to the sPLS-DAdimensions 1 and 2 (indicated in green for the ESR1network, magenta for the SP1 network and red for com-mon genes in both subgraphs). This latter result sug-gests a. that the first (second) dimension of sPLS-DAseems to focus on the SP1 (ESR1) network and b. thatthe genes selected with sPLS-DA are of biological rele-vance (see Table 3 for a description of most genes).Further investigation would be required to give moreinsight into the sPLS-DA gene selection.
ConclusionsIn this article, we showed that sPLS could be naturallyextended to sPLS-DA for discrimination purposes bycoding the response matrix Y with dummy variables.sPLS-DA often gave similar classification performanceto competitive sparse LDA approaches in multiclassproblems. Undoubtedly, the sparse approaches that we
Figure 4 Brain data: sample representation and comparisonwith classical PLS-DA. Comparisons of the sample representationusing the first 2 latent variables from PLS-DA (no variable selection)and sPLS-DA (26 genes selected).
Lê Cao et al. BMC Bioinformatics 2011, 12:253http://www.biomedcentral.com/1471-2105/12/253
Page 9 of 16
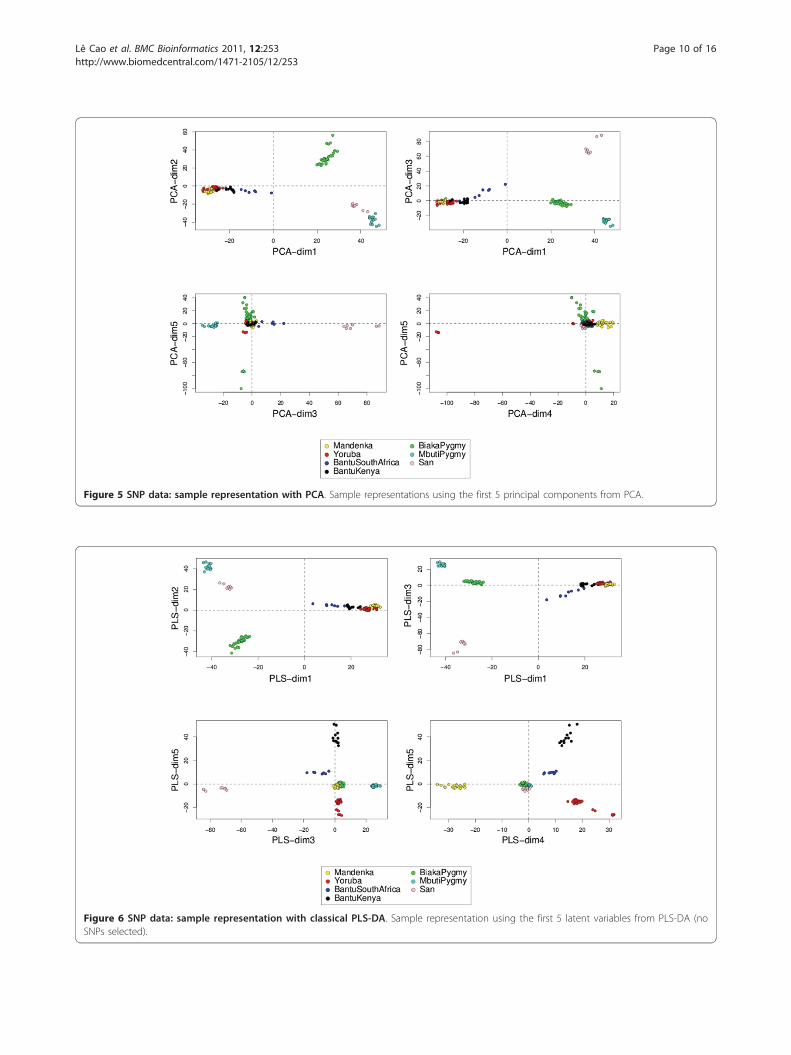
Figure 5 SNP data: sample representation with PCA. Sample representations using the first 5 principal components from PCA.
Figure 6 SNP data: sample representation with classical PLS-DA. Sample representation using the first 5 latent variables from PLS-DA (noSNPs selected).
Lê Cao et al. BMC Bioinformatics 2011, 12:253http://www.biomedcentral.com/1471-2105/12/253
Page 10 of 16

tested are extremely competitive to the wrapper meth-ods, which are often considered as black boxes with nointuitive tuning parameters (such as the kernels to usein the SVM). The preliminary biological analysis showedthat some tested approaches brought relevant biologicalinformation. The PLS-based approaches such as thesPLS-DA approach that we propose have a well estab-lished framework for class prediction. The computa-tional efficiency of sPLS-DA as well as the valuablegraphical outputs that provide easier interpretation ofthe results make sPLS-DA a great alternative to othertypes of variable selection techniques in a supervisedclassification framework. We also showed that a stabilityanalysis could guide the parameter tunings of sPLS-DA.On the Brain data set, we showed that sPLS-DA selectedrelevant genes that shed more light on the biologicalstudy. For these reasons, we believe that sPLS-DA pro-vides an interesting and worthwhile alternative for fea-ture selection in multiclass problems.
MethodsIn this section, we introduce the sparse Partial LeastSquares Discriminant Analysis (sPLS-DA) to performfeature selection. sPLS-DA is based on Partial LeastSquares regression (PLS) for discrimination analysis, buta Lasso penalization has been added to select variables.We denote X the n × p sample data matrix, where n is
the number of patients or samples, and p is the numberof variables (genes, SNPs, ...). In this supervised classifi-cation framework, we will assume that the samples nare partitioned into K groups.
Introduction on PLS Discriminant AnalysisAlthough Partial Least Squares [13] was not originallydesigned for classification and discrimination problems,it has often been used for that purpose [38,51]. Theresponse matrix Y is qualitative and is recoded as adummy block matrix that records the membership ofeach observation, i.e. each of the response categories arecoded via an indicator variable. The PLS regression (nowPLS-DA) is then run as if Y was a continuous matrix.Note that this might be wrong from a theoretical point ofview, however, it has been previously shown that thisworks well in practice and many authors have useddummy matrice in PLS for classification [30,37,51,52].PLS constructs a set of orthogonal components that
maximize the sample covariance between the responseand the linear combination of the predictor variables.The objective function to be solved can be written as
arg maxu′
h uh=1,v′hvh=1
cov2(u′hX, v′
hY)
where uh and vh are the hth left and right singular vectorof the singular value decomposition (SVD) of XT Y
Figure 7 SNP data: sample representation with sPLS-DA. Sample representation using the first 5 latent variables from sPLS-DA (1000 SNPsselected on each dimension).
Lê Cao et al. BMC Bioinformatics 2011, 12:253http://www.biomedcentral.com/1471-2105/12/253
Page 11 of 16

respectively [53] for each iteration or dimension h of thePLS. These singular vectors are also called loading vectorsand are associated to the X and Y data set respectively.In the case of discrimination problems, the PLS model
can be formulated as follows:
Y = Xβ + E,
where b is the matrix of the regression coefficients andE is the residual matrix. To give more details, b = W*V T,where V is the matrix containing the loading vectors (orright singular vectors from the SVD decomposition) (v1,..., vH ) in columns, W* = W (UT W )-1, where W is thematrix containing the regression coefficients of theregression of X on the latent variable th = v′
hY , and U isthe matrix containing the loading vectors (or left singularvectors from the SVD decomposition) (u1, ..., uH ) in col-umns. More details about the PLS algorithm and the PLSmodel can be found in the reviews of [53,54]. The predic-tion of a new set of samples is then
Ynew = Xnewβ ,
The identity of the class membership of each newsample (each row in Ynew ) is assigned as the columnindex of the element with the largest predicted value inthis row.
Discriminant PLS for large data setsNumerous variants of PLS-DA have been proposed inthe literature to be adapted to classification problemsfor large data sets such as microarray. IterativeReweighted PLS was first proposed by [31] to extendPLS into the framework of generalized linear models. Inthe same context, [51,55,56] proposed a two-stageapproach, first by extracting the PLS-DA latent variablesto reduce the dimension of the data, and then by apply-ing logistic discrimination or polychotomous discrimina-tion in the case of multiclass problems. To avoid infiniteparameters estimates and non convergence problems,other authors [32] extended the work of [31] by apply-ing Firth’s procedure to avoid (quasi) separation,whereas [33] combined PLS with logistic regressionpenalized with a ridge parameter. The response variablesY is modelled either as a dummy matrix [51,55,56], or asa pseudo-response variable whose expected value has alinear relationship with the covariates [33]. Theapproach proposed by [32] updates the adjusted depen-dent variable as the response rather than working withthe original outcome. While these authors propose toaddress the problem of dimension reduction, they stillrequire to perform gene filtering beforehand, with, forexample, t-statistics or other filtering criterion such asthe BSS/WSS originally proposed by [2].
0 1000 2000 3000 4000 5000 6000
0.0
0.3
0 1000 2000 3000 4000 5000 6000
0.0
0.3
0 1000 2000 3000 4000 5000 6000
0.0
0.2
0.4
0 1000 2000 3000 4000 5000 6000
0.0
0.2
0.4
wei
ghts
dim
1w
eigh
ts d
im 2
wei
ghts
dim
3w
eigh
ts d
im 4
genes
genes
genes
genes
Figure 8 Brain data: representation of the loading vectors. Absolute value of the weights in the loading vectors for each sPLS-DAdimension. Only the genes with non zero weights are considered in the sPLS-DA analysis and are included in the gene selection.
Lê Cao et al. BMC Bioinformatics 2011, 12:253http://www.biomedcentral.com/1471-2105/12/253
Page 12 of 16

1.0 0.5 0.0 0.5 1.0
1.0
0.5
0.0
0.5
1.0
Comp 1
Com
p 2
D12676_atMLLT3
D31764_at
D79998_at
STAB1
D89667_atL00205_at
SCN1B
M20471_at
M31520_at
M33653_at
M74089_at
M83233_at
INSM1
SIRPA
U21858_atU30521_atAP3B2
MAB21L1U56833_at
SORL1
U85267_at
X16560_at
X68836_at
X78520_at
PEA15
Z50022_at
BTN2A2
STMN2
LRRC16A
PON2
U30255_at
X63578_rna1_at
X53777_at
Y00764_at
TNFRSF1A
GRM4BAD
Cyclin D1
Neuronatin
BARD1
NDF1
ALDOC
PTMACIP4
PGHD
PEA15
CD97
HG384.HT384_atM28213_s_at
U76272_at
Midkine
(a)
Figure 9 Brain data: variable representation. (a) projection of the sPLS-DA selected variables on correlation circles with the R mixOmicspackage; (b) biological network generated with GeneGo using the same list of genes. Genes that are present in the network (b) are labelled ingreen, red and magenta in (a).
Lê Cao et al. BMC Bioinformatics 2011, 12:253http://www.biomedcentral.com/1471-2105/12/253
Page 13 of 16
sparse PLS Discriminant Analysissparse PLS for two data setsThe sparse PLS proposed by [25,26] was initiallydesigned to identify subsets of correlated variables oftwo different types coming from two different data setsX and Y of sizes (n × p) and (n × q) respectively. Theoriginal approach was based on Singular Value Decom-position (SVD) of the cross product Mh = XT
h Yh . Wedenote uh (vh) the left (right) singular vector from theSVD, for iteration h, h = 1 ... H where H is the numberof performed deflations - also called chosen dimensionsof the PLS. These singular vectors are named loadingvectors in the PLS context. Sparse loading vectors werethen obtained by applying l1 penalization on both uhand vh. The optimization problem of the sPLS mini-mizes the Frobenius norm between the current crossproduct matrix and the loading vectors:
minuh,vh
||Mh − uhv′h||
2F +Pλ1(uh) + Pλ2(vh), (1)
where Pl1 (uh) = sign(uh)(|uh| - l1)+, and Pl2 (vh) =sign(vh)(|vh| - l2)+ are applied componentwise in thevectors uh and vh and are the soft thresholding functionsthat approximate Lasso penalty functions [21]. They aresimultaneously applied on both loading vectors. Theproblem (1) is solved with an iterative algorithm and theXh and Yh matrices are subsequently deflated for eachiteration h (see [25] for more details). For practical pur-poses, sPLS has been implemented in the R packagemixOmics such that the user can input the number ofvariables to select on each data set rather than the pena-lization parameters l1 and l2.sPLS extended to sPLS-DAThe extension of sparse PLS to a supervised classifica-tion framework is straightforward. The response matrixY of size (n × K) is coded with dummy variables to
indicate the class membership of each sample. Note thatin this specific framework, we will only perform variableselection on the X data set, i.e., we want to select thediscriminative features that can help predicting theclasses of the samples. The Y dummy matrix remainsunchanged. Therefore, we set Mh = XT
h Yh and the opti-mization problem of the sPLS-DA can be written as:
minuh,vh
||Mh − uhv′h||2F + Pλ(uh),
with the same notation as in sPLS. Therefore, thepenalization parameter to tune is l. Our algorithm hasbeen implemented to choose the number of variables toselect rather than l for practical reasons. For the classprediction of test samples, we use the maximum dis-tance as presented above for the PLS case as it seemedto be the one that worked better in practice for multi-class problems. Note that other distances such as thecentroids or Malhanobis distances are also implementedin the mixOmics package [42,43]. In the results section,we illustrated how to tune the PLS dimension H as wellas the number of X variables to select.sPLS-DA for multiclass classificationIn binary problems, sPLS-DA was shown to bring rele-vant results in microarray cancer data sets (see [57]). Inthis paper, we investigated the use of sPLS-DA in themore complex multiclass case, as PLS-DA and sPLS-DAare naturally adapted to multiclass problems. In thispaper, we did not attempt to address the specific pro-blem of unbalanced classes, that would require thedevelopment of appropriately weighted multiclass objec-tive functions for wrapper classification approaches (seefor example [58]).Parameters to tune in sPLS-DAThere are two parameters to tune in sPLS-DA: thenumber of dimensions H, and the number of variablesto select on each dimension. In the Results Section, we
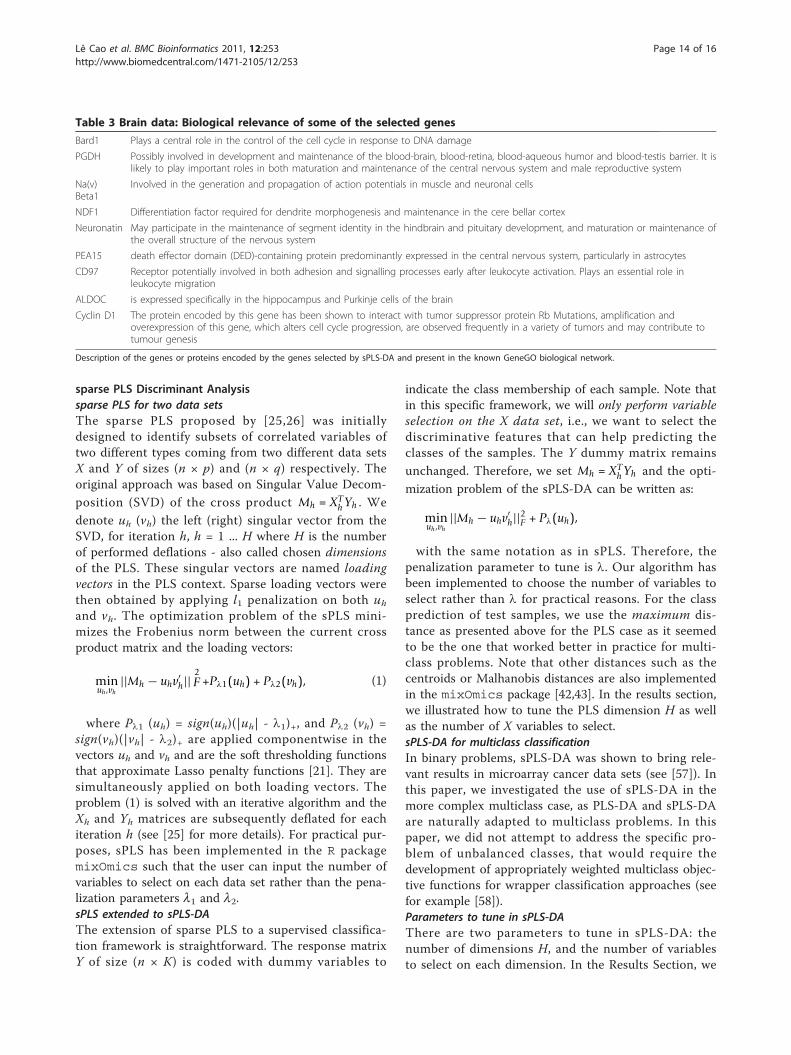
Table 3 Brain data: Biological relevance of some of the selected genes
Bard1 Plays a central role in the control of the cell cycle in response to DNA damage
PGDH Possibly involved in development and maintenance of the blood-brain, blood-retina, blood-aqueous humor and blood-testis barrier. It islikely to play important roles in both maturation and maintenance of the central nervous system and male reproductive system
Na(v)Beta1
Involved in the generation and propagation of action potentials in muscle and neuronal cells
NDF1 Differentiation factor required for dendrite morphogenesis and maintenance in the cere bellar cortex
Neuronatin May participate in the maintenance of segment identity in the hindbrain and pituitary development, and maturation or maintenance ofthe overall structure of the nervous system
PEA15 death effector domain (DED)-containing protein predominantly expressed in the central nervous system, particularly in astrocytes
CD97 Receptor potentially involved in both adhesion and signalling processes early after leukocyte activation. Plays an essential role inleukocyte migration
ALDOC is expressed specifically in the hippocampus and Purkinje cells of the brain
Cyclin D1 The protein encoded by this gene has been shown to interact with tumor suppressor protein Rb Mutations, amplification andoverexpression of this gene, which alters cell cycle progression, are observed frequently in a variety of tumors and may contribute totumour genesis
Description of the genes or proteins encoded by the genes selected by sPLS-DA and present in the known GeneGO biological network.
Lê Cao et al. BMC Bioinformatics 2011, 12:253http://www.biomedcentral.com/1471-2105/12/253
Page 14 of 16

showed that for most cases, the user could set H = K -1, similar to what is advised in a LDA case. The numberof variables to select is more challenging given the com-plexity of such data sets and is still as an open question.The tuning of such parameter can be guided throughthe estimation of the generalisation classification errorand a stability analysis. However, these analyses mightbe seriously limited by the small number of samples.Most importantly, the user should keep in mind that aclose interaction with the biologists is necessary to care-fully tune this parameter in order to answer biologicalquestions. Sometimes, an optimal but too short geneselection may not suffice to give a comprehensive biolo-gical interpretation, and experimental validation mightbe limited in the case of a too large gene selection.
Additional material
Additional file 1: Tuning the number of dimensions in sPLS-DA.Estimated classification error rates for Leukemia, SRBCT and GCM (10cross-validation averaged 10 times) with respect to each sPLS-DAdimension. The different lines represent the number of variables selectedon each dimension (going from 5 to p).
Additional file 2: Stability analysis. Stability frequency using bolassofor the first two dimensions of sPLS-DA for Brain (top) and SRBCT data(bottom). One has to sequentially choose the most stabler genes/SNP inthe first dimension in order to go on to the next sPLS-DA dimension.
Additional file 3: Brain data: sample representation in 3D. Exampleof 3D samples plot using the first 3 latent variables from sPLS-DA withthe R mixOmics package.
AcknowledgementsWe would like to thank Dr. Dominique Gorse (QFAB) for his advice on usingGeneGo. We are indebted to Pierre-Alain Chaumeil (QFAB) for his supporton using the QFAB cluster. We thank the referees for their useful commentsthat helped improving the manuscript. This work was supported, in part, bythe Wound Management Innovation CRC (established and supported underthe Australian Government’s Cooperative Research Centres Program).
Author details1Queensland Facility for Advanced Bioinformatics, University of Queensland,4072 St Lucia, QLD, Australia. 2UMR444 Laboratoire de Génétique Cellulaire,INRA, BP 52627, F-31326 Castanet Tolosan, France. 3Institut deMathématiques de Toulouse, Université de Toulouse et CNRS (UMR 5219), F-31062 Toulouse, France.
Authors’ contributionsKALC performed the statistical analysis, wrote the R functions and draftedthe manuscript. SB preprocessed the SNP data and helped to draft themanuscript. PB participated in the design of the manuscript and helped todraft the manuscript. All authors read and approved the final manuscript.
Competing interestsThe authors declare that they have no competing interests.
Received: 3 November 2010 Accepted: 22 June 2011Published: 22 June 2011
References1. Golub T, Slonim D, Tamayo P, Huard C, Gaasenbeek M, Mesirov J, Coller H,
Loh M, Downing J, Caligiuri M, et al: Molecular Classification of Cancer:
Class Discovery and Class Prediction by Gene Expression Monitoring.Science 1999, 286(5439):531.
2. Dudoit S, Fridlyand J, Speed T: Comparison of Discrimination Methods forthe Classification of Tumors Using Gene Expression Data. Journal of theAmerican Statistical Association 2002, 97(457):77-88.
3. Guyon I, Elisseefi A, Kaelbling L: An Introduction to Variable and FeatureSelection. Journal of Machine Learning Research 2003, 3(7-8):1157-1182.
4. Ashburner M, Ball C, Blake J, Botstein D, Butler H, Cherry J, Davis A,Dolinski K, Dwight S, Eppig J, et al: Gene Ontology: tool for the unificationof biology. Nature genetics 2000, 25:25-29.
5. Lê Cao KA, Bonnet A, Gadat S: Multiclass classification and gene selectionwith a stochastic algorithm. Computational Statistics and Data Analysis2009, 53:3601-3615.
6. Breiman L, Friedman J, Olshen R, Stone C: Classification and Regression TreesMonterey, CA: Wadsworth and Brooks; 1984.
7. Vapnik VN: The Nature of Statistical Learning Theory (Information Science andStatistics) Springer; 1999.
8. Breiman L: Random forests. Machine learning 2001, 45:5-32.9. Tibshirani R, Hastie T, Narasimhan B, Chu G: Diagnosis of multiple cancer
types by shrunken centroids of gene expression. Proceedings of theNational Academy of Sciences 2002, 99(10):6567.
10. Lê Cao KA, Goncalves O, Besse P, Gadat S: Selection of biologicallyrelevant genes with a wrapper stochastic algorithm. StatisticalApplications in Genetics and Molecular Biology 2007, 6:29.
11. Bair E, Hastie T, Paul D, Tibshirani R: Prediction by Supervised PrincipalComponents. Journal of the American Statistical Association 2006,101(473):119-137.
12. Jombart T, Devillard S, Balloux F: Discriminant analysis of principalcomponents: a new method for the analysis of genetically structuredpopulations. BMC Genetics 2010, 11(94).
13. Wold H: In Multivariate Analysis. Edited by: krishnaiah pr. Academic Press,New York, Wiley; 1966:.
14. Antoniadis A, Lambert-Lacroix S, Leblanc F: Effective dimension reductionmethods for tumor classification using gene expression data.Bioinformatics 2003, 19(5):563-570.
15. Boulesteix A: PLS Dimension Reduction for Classification with MicroarrayData. Statistical Applications in Genetics and Molecular Biology 2004, 3:1075.
16. Dai J, Lieu L, Rocke D: Dimension reduction for classification with geneexpression microarray data. Statistical Applications in Genetics andMolecular Biology 2006, 5:1147.
17. Hoerl A, Kennard R: In Ridge regression in ‘Encyclopedia of Statistical Sciences’.Volume 8. Monterey, CA: Wiley, New York; 1984.
18. Tibshirani R: Regression shrinkage and selection via the lasso. Journal ofthe Royal Statistical Society, Series B 1996, 58:267-288.
19. Zou H, Hastie T: Regularization and variable selection via the elastic net.Journal of the Royal Statistical Society Series B 2005, 67(2):301-320.
20. Jolliffe I, Trendafilov N, Uddin M: A Modified Principal ComponentTechnique Based on the LASSO. Journal of Computational & GraphicalStatistics 2003, 12(3):531-547.
21. Shen H, Huang JZ: Sparse Principal Component Analysis via RegularizedLow Rank Matrix Approximation. Journal of Multivariate Analysis 2008,99:1015-1034.
22. Waaijenborg S, de Witt Hamer V, Philip C, Zwinderman A: Quantifying theAssociation between Gene Expressions and DNA-Markers by PenalizedCanonical Correlation Analysis. Statistical Applications in Genetics andMolecular Biology 2008, 7(3).
23. Parkhomenko E, Tritchler D, Beyene J: Sparse canonical correlationanalysis with application to genomic data integration. StatisticalApplications in Genetics and Molecular Biology 2009, 8:1.
24. Witten D, Tibshirani R, Hastie T: A penalized matrix decomposition, withapplications to sparse principal components and canonical correlationanalysis. Biostatistics 2009, 10(3):515.
25. Lê Cao KA, Rossouw D, Robert-Granié C, Besse P: Sparse PLS: VariableSelection when Integrating Omics data. Statistical Application andMolecular Biology 2008, 7(1):37.
26. Lê Cao KA, Martin P, Robert-Granié C, Besse P: ofw: Sparse canonicalmethods for biological data integration: application to a cross-platformstudy. BMC Bioinformatics 2009, 10(34).
27. Chun H, Keleş S: Sparse partial least squares regression for simultaneousdimension reduction and variable selection. Journal of the Royal StatisticalSociety: Series B (Statistical Methodology) 2010, 72:3-25.
Lê Cao et al. BMC Bioinformatics 2011, 12:253http://www.biomedcentral.com/1471-2105/12/253
Page 15 of 16
28. Huang X, Pan W: Linear regression and two-class classification with geneexpression data. Bioinformatics 2003, 19(16):2072.
29. Huang X, Pan W, Park S, Han X, Miller L, Hall J: Modeling the relationshipbetween LVAD support time and gene expression changes in thehuman heart by penalized partial least squares. Bioinformatics 2004, 4991.
30. Chung D, Keles S: Sparse Partial Least Squares Classification for HighDimensional Data. Statistical Applications in Genetics and Molecular Biology2010, 9:17.
31. Marx B: Iteratively reweighted partial least squares estimation forgeneralized linear regression. Technometrics 1996, 374-381.
32. Ding B, Gentleman R: Classification using generalized partial leastsquares. Journal of Computational and Graphical Statistics 2005,14(2):280-298.
33. Fort G, Lambert-Lacroix S: Classification using partial least squares withpenalized logistic regression. Bioinformatics 2005, 21(7):1104.
34. Zhou X, Tuck D: MSVM-RFE: extensions of SVM-RFE for multiclass geneselection on DNA microarray data. Bioinformatics 2007, 23(9):1106-1114.
35. Yang T: Efficient multi-class cancer diagnosis algorithm, using a globalsimilarity pattern. Computational Statistics & Data Analysis 2009,53(3):756-765.
36. Liu K, Xu C: A genetic programming-based approach to the classificationof multiclass microarray datasets. Bioinformatics 2009, 25(3):331.
37. Barker M, Rayens W: Partial least squares for discrimination. Journal ofChemometrics 2003, 17(3):166-173.
38. Tan Y, Shi L, Tong W, Gene Hwang G, Wang C: Multi-class tumorclassification by discriminant partial least squares using microarray geneexpression data and assessment of classification models. ComputationalBiology and Chemistry 2004, 28(3):235-243.
39. Meinshausen N, Bühlmann P: Stability selection Tech. rep., ETH Zurich; 2008.40. Bach F: Model-consistent sparse estimation through the bootstrap. Tech.
rep., Laboratoire d’Informatique de l’Ecole Normale Superieure, Paris; 2009.41. Ahdesmäki M, Strimmer K: Feature selection in omics prediction
problems using cat scores and false non-discovery rate control. Ann ApplStat 2010, 4:503-519.
42. Lê Cao KA, González I, Déejean S: integrOmics: an R package to unravelrelationships between two omics data sets. Bioinformatics 2009,25(21):2855-2856.
43. mixOmics. [http://www.math.univ-toulouse.fr/~biostat/mixOmics].44. Khan J, Wei JS, Ringnér M, Saal LH, Ladanyi M, Westermann F, Berthold F,
Schwab M, Antonescu CR, Peterson C, Meltzer PS: Classification anddiagnostic prediction of cancers using gene expression profiling andartificial neural networks. Nat Med 2001, 7(6):673-679.
45. Pomeroy S, Tamayo P, Gaasenbeek M, Sturla L, Angelo M, McLaughlin M,Kim J, Goumnerova L, Black P, Lau C, et al: Prediction of central nervoussystem embryonal tumour outcome based on gene expression. Nature2002, 415(6870):436-442.
46. Ramaswamy S, Tamayo P, Rifkin R, Mukherjee S, Yeang C, Angelo M,Ladd C, Reich M, Latulippe E, Mesirov J, et al: Multiclass cancer diagnosisusing tumor gene expression signatures. Proceedings of the NationalAcademy of Sciences 2001, 98(26):15149-15154.
47. Yeung K, Burmgarner R: Multi-class classification of microarray data withrepeated measurements: application to cancer. Genome Biology 2003,4(83).
48. Jakobsson M, Scholz S, Scheet P, Gibbs J, VanLiere J, Fung H, Szpiech Z,Degnan J, Wang K, Guerreiro R, et al: Genotype, haplotype and copy-number variation in worldwide human populations. Nature 2008,451(7181):998-1003.
49. Guyon I, Weston J, Barnhill S, Vapnik V: Gene selection for cancerclassification using support vector machines. Machine learning 2002,46:389-422.
50. Lê Cao KA, Chabrier P: ofw: An R Package to Select Continuous Variablesfor Multiclass Classification with a Stochastic Wrapper Method. Journal ofStatistical Software 2008, 28(9):1-16[http://www.jstatsoft.org/v28/i09/].
51. Nguyen D, Rocke D: Tumor classification by partial least squares usingmicroarray gene expression data. Bioinformatics 2002, 18:39.
52. Boulesteix A, Strimmer K: Partial least squares: a versatile tool for theanalysis of high-dimensional genomic data. Briefings in Bioinformatics2007, 8:32.
53. Höskuldsson A: PLS regression methods. Journal of Chemometrics 1988,2(3):211-228.
54. Wold S, Sjöström M, Eriksson L: PLS-regression: a basic tool ofchemometrics. Chemometrics and intelligent laboratory systems 2001,58(2):109-130.
55. Chih-Yu Wang C, Chiang C, Shueng-Tsong Young S, Chiang H: Aprobability-based multivariate statistical algorithm for autofluorescencespectroscopic identification of oral carcinogenesis. Photochemistry andphotobiology 1999, 69(4):471-477.
56. Nguyen D, Rocke D: Multi-class cancer classification via partial leastsquares with gene expression profiles. Bioinformatics 2002, 18(9):1216.
57. Lê Cao KA, Meugnier E, McLachlan G: Integrative mixture of experts tocombine clinical factors and gene markers. Bioinformatics 2010.
58. Qiao X, Liu Y: Adaptive weighted learning for unbalanced multicategoryclassification. Biometrics 2009, 65:159-168.
doi:10.1186/1471-2105-12-253Cite this article as: Lê Cao et al.: Sparse PLS discriminant analysis:biologically relevant feature selection and graphical displays formulticlass problems. BMC Bioinformatics 2011 12:253.
Submit your next manuscript to BioMed Centraland take full advantage of:
• Convenient online submission
• Thorough peer review
• No space constraints or color figure charges
• Immediate publication on acceptance
• Inclusion in PubMed, CAS, Scopus and Google Scholar
• Research which is freely available for redistribution
Submit your manuscript at www.biomedcentral.com/submit
Lê Cao et al. BMC Bioinformatics 2011, 12:253http://www.biomedcentral.com/1471-2105/12/253
Page 16 of 16