spasticity after first-ever stroke - diva
TRANSCRIPT

������������������� ���������� �
����
���������� �������������� ������������������� ������� ����������������������������
������ ���� �������� �����
���� ���������
���� �! ��"#���$� %�&�% �!!���!���'(�)*)+)*��*((*,��� #� '�

����������������������� ������� �������������������������������������������������� ������!"������"���#�"������� ����������������$������������% &���� &'(������������������������)��������*+���������,������-.�/������������0����������������$0�����.
��������
1�����2����.�% &.�$������������������������������"�.�!���� ������������ ���������.����������� � ���� ������ ���������������� ������������� ������������ ����� �345.�����.� ������.� ����&56�&(���3�5�45�7.
/����������������������������������������������"������������������% 8���������������������� �����������������������������������./��� ���������������������������������"�����������0���(&8����538��0������������������������0��������������������"0.� ����0������������������������������������������0������������������������"�.��� �'�/0�����������������0�����������.����� �� 0��� �� ������������� ������.� !� �������������� ������� �� (3 � �������� 0��
������������ (� ����� ������ ������ ����������� ���"�.� $���������� 0��� ������� ��� 9� (� ����� � �����������!��0�������������������������������0�����������������������������������������������������������.�.����������������������������������������������������������������������.�)���0�����������0��������:������!������$����.�!���������������������������0����������������������������)���������)0���)�������� $�������*)));-.��������0��������������������������.�+���������������0�������������������%<( �
���������������������������������������������������"�.�!���������������������0�����������������������.������'�$����������������0�����(���������������������������������0�����4�����.!����������������������������������������0���(58����������� ���������������������38.
��������������������0����������=�������������������������.�/�����0�����������������������������������������������������*>?�%%��@��7.&<(%�-�����������0�4��������*>?�&.���@�(.�<4 -./��� ���������� �� ���"���������� ���� 0��� %(8� ������ �� ����.� $��"���������� ���� 0��
����������0������������*>?�7.(��&�8�@��(.%<5.5-�������������������*>?�7.(��&�8�@��(.(<6.&-�������������*>?�3.(��&�8�@��(.3<(7-��������0�������������������������������������./�����#������� ����������� ����� ���������� *568-�0��������������0������������A����
0�������% 8�0�������������0������������������������.�>���(8�������������������0������������������������������������(8�����������.�/�������*������������=������������-�����������������"����������0���������������0���)));�63�(&��*5%�((4���7�5 5-�����������)));�%(�63%*(%�76���(5�363-�������"����������0�����������������*)��� . (-.
� ����������"������������������������������������� ,B���������������������������������������������������������
��!�"������#$������������ ����������� ���������������������������������������������������� !" ���������� � �
C����"�1�����2��% &
�$$B�(4�(�4% 4�$DB�&56�&(���3�5�45�7��'�'��'��'�����( 5(73�*����'EE��."�.��E������F��G��'�'��'��'�����( 5(73-

To Carin


List of papers
This thesis is based on the following papers, which will be referred to in the text by their Roman numerals: I Prevalence of disabling spasticity 1 year after first-ever stroke.
Erik Lundström, Andreas Terént, Jörgen Borg. European journal of neurology, 2008, 15: 533–539.
II Risk factors for stroke-related pain one year after first-ever stroke. Erik Lundström, Anja Smits, Andreas Terént, Jörgen Borg. European journal of neurology, 2009, 16: 188–193.
III Four-fold increase in direct costs of stroke-survivors with spas-ticity compared to stroke-survivors without spasticity – the first year after the event. Erik Lundström, Anja Smits, Jörgen Borg, Andreas Terént. Submitted manus.
IV On the time course and determinants of spasticity during the first six months after first-ever stroke. Erik Lundström, Anja Smits, Andreas Terént, Jörgen Borg. Submitted manus.

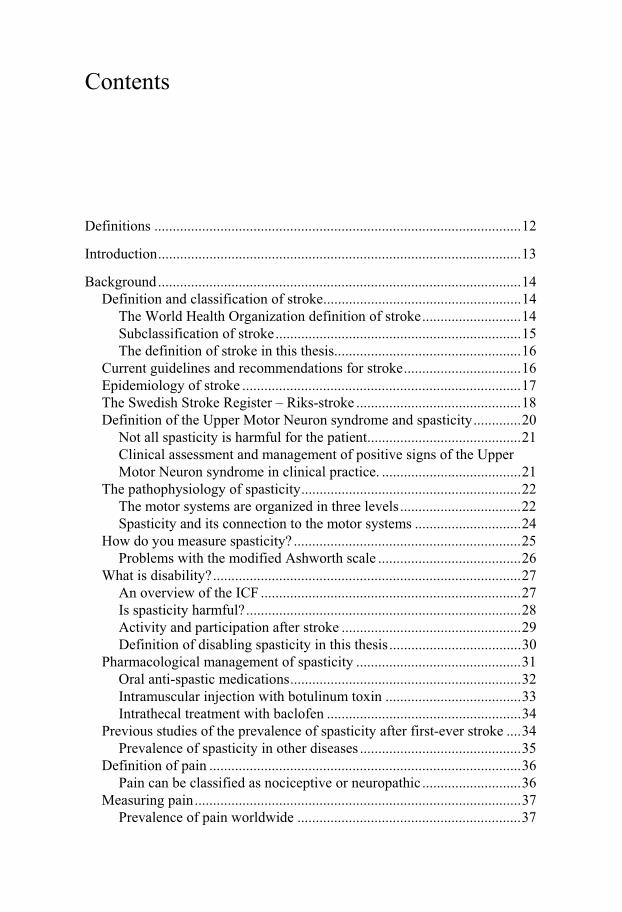
Contents
Definitions .................................................................................................... 12
Introduction ................................................................................................... 13
Background ................................................................................................... 14 Definition and classification of stroke ...................................................... 14
The World Health Organization definition of stroke ........................... 14 Subclassification of stroke ................................................................... 15 The definition of stroke in this thesis................................................... 16
Current guidelines and recommendations for stroke ................................ 16 Epidemiology of stroke ............................................................................ 17 The Swedish Stroke Register – Riks-stroke ............................................. 18 Definition of the Upper Motor Neuron syndrome and spasticity ............. 20
Not all spasticity is harmful for the patient .......................................... 21 Clinical assessment and management of positive signs of the Upper Motor Neuron syndrome in clinical practice. ...................................... 21
The pathophysiology of spasticity ............................................................ 22 The motor systems are organized in three levels ................................. 22 Spasticity and its connection to the motor systems ............................. 24
How do you measure spasticity? .............................................................. 25 Problems with the modified Ashworth scale ....................................... 26
What is disability? .................................................................................... 27 An overview of the ICF ....................................................................... 27 Is spasticity harmful? ........................................................................... 28 Activity and participation after stroke ................................................. 29 Definition of disabling spasticity in this thesis .................................... 30
Pharmacological management of spasticity ............................................. 31 Oral anti-spastic medications ............................................................... 32 Intramuscular injection with botulinum toxin ..................................... 33 Intrathecal treatment with baclofen ..................................................... 34
Previous studies of the prevalence of spasticity after first-ever stroke .... 34 Prevalence of spasticity in other diseases ............................................ 35
Definition of pain ..................................................................................... 36 Pain can be classified as nociceptive or neuropathic ........................... 36
Measuring pain ......................................................................................... 37 Prevalence of pain worldwide ............................................................. 37

Prevalence of pain among stroke patients ............................................ 38 Previous studies of the correlation between spasticity and pain after first-ever stroke ........................................................................................ 38 Cost of illness studies ............................................................................... 38
Organisation of the health care system in Sweden .............................. 39 Organisation of the health care system in Uppsala county .................. 39 Different methods in cost of illness studies ......................................... 40
Outline of the thesis ...................................................................................... 41
Aims .............................................................................................................. 42 Paper I ...................................................................................................... 42 Paper II ..................................................................................................... 42 Paper III .................................................................................................... 42 Paper IV ................................................................................................... 42
Methods for Paper I–III ................................................................................ 43 Study design ............................................................................................. 43 Study population ...................................................................................... 43 Case ascertainment ................................................................................... 43
Inclusion and exclusion criteria ........................................................... 44 Methods and definitions ........................................................................... 46
Stroke severity was measured with the NIHSS ................................... 46 Spasticity ............................................................................................. 47 Study variables for cohort I ................................................................. 47
Health economic parameters .................................................................... 48 Perspective of analysis ......................................................................... 48 Study type, design, estimation procedures, cost included, and unit of measurement ........................................................................................ 48 Included in the estimation of the direct costs ...................................... 48 Statistics ............................................................................................... 49
Ethics ........................................................................................................ 51
Methods for Paper IV .................................................................................... 52 Study design ............................................................................................. 52 Study population ...................................................................................... 52 Case ascertainment ................................................................................... 53
Inclusion and exclusion criteria ........................................................... 53 Baseline assessment ............................................................................. 53 Follow-up at 1 month and 6 months .................................................... 53
Methods of assessments and definitions .................................................. 54 Statistics ............................................................................................... 54
Ethics ........................................................................................................ 55
Results for Paper I–II .................................................................................... 56

The results for the whole sample .............................................................. 56 Prevalence of spasticity ....................................................................... 57 Multiple logistic regression for disabling spasticity ............................ 58 Spasticity in relation to other parameters ............................................ 58 Distribution of the spasticity ................................................................ 59 Prevalence of pain................................................................................ 59 Pain in relation to demographic data, sensorimotor impairments and depression ............................................................................................ 59 Multiple logistic regression for pain .................................................... 60 Distribution and intensity of pain ........................................................ 60
Conclusions and future reseach .................................................................... 63 Methods for the two cohorts ..................................................................... 63
Cohort I – strengths and weaknesses ................................................... 63 Cohort II – strengths and weaknesses .................................................. 64 Measuring spasticity with the modified Ashworth scale (MAS) – what is the catch? ................................................................................. 64 The definition of Disabling spasticity .................................................. 65
Results ...................................................................................................... 65 Disabling spasticity .............................................................................. 65 Pain and spasticity ............................................................................... 66 Spasticity and direct costs .................................................................... 66 The rehabilitation gap in the primary care ........................................... 67 The temporal course of spasticity ........................................................ 67
Future research ......................................................................................... 68 Clinical measurements and pathophysiology ...................................... 68 Prevention and treatment ..................................................................... 68 Subarachnoid haemorrhage and traumatic brain injury ....................... 68
Acknowledgements ....................................................................................... 69
Knuten näve och släpande fot. Populärvetenskaplig sammanfattning på svenska .......................................................................................................... 70
Inom ett år utvecklar en femtedel spasticitet ............................................ 70 Spasticiteten uppträder inom en månad. Funktionshindrande spasticitet tar längre tid att utveckla. ......................................................................... 71 En liten del av strokepatienterna utvecklar funktionshindrande spasticitet ett år efter stroke ...................................................................... 72 Patienter med spasticitet har fyra gånger högre kostnader det första året 72 Smärta är vanligt efter en stroke men spasticitet ger ingen oberoende riskökning för stroke-relaterad smärta ..................................................... 73 Förslag på framtida forskning inom fältet. ............................................... 74
Kliniska mätmetoder ............................................................................ 74 Förebyggande och behandla ................................................................ 74 Andra skadegrupper ............................................................................. 74

Appendix: WHO:s International Classification of Cerebrovascular Disease 75 The original and the modified Ashworth scale......................................... 78 National Institutes of Health Stroke Scale (NIHSS) ................................ 79 Modified Rankin Scale (mRS) ................................................................. 81 Barthel Index (BI) .................................................................................... 82 Purchasing Power Parities ........................................................................ 83
Index ............................................................................................................. 85
Tables in the thesis ........................................................................................ 87
References ..................................................................................................... 88

Abbreviations
ADL Activities of Daily Living BI Barthel index CI Confidence Interval COI Cost of Illness (study) CT Computed Tomography DS Disabling spasticity ICF International Classification of Functioning, Disability and
Health IQR Inter-quartile range MADRS Montgomery-Åsberg Depression Rating Scale MAS Modified Ashworth scale MRI Magnetic Resonance Imaging mRS Modified Rankin Scale NIHSS National Institutes of Health Stroke Scale OR Odds Ratio Riks-stroke Swedish Stroke Register SAH Subarachnoid Haemorrhage UMN Upper Motor Neuron TIA Transient Ischemic Attack VAS Visual Analogue Scale (of pain) WHO World Health Organization
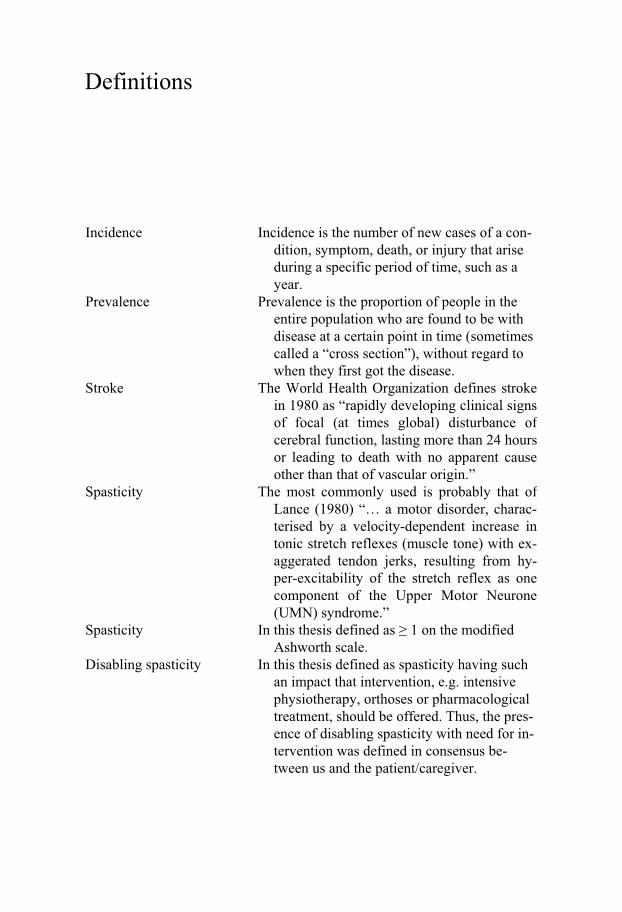
Definitions
Incidence Incidence is the number of new cases of a con-
dition, symptom, death, or injury that arise during a specific period of time, such as a year.
Prevalence Prevalence is the proportion of people in the entire population who are found to be with disease at a certain point in time (sometimes called a “cross section”), without regard to when they first got the disease.
Stroke The World Health Organization defines strokein 1980 as “rapidly developing clinical signs of focal (at times global) disturbance ofcerebral function, lasting more than 24 hoursor leading to death with no apparent causeother than that of vascular origin.”
Spasticity The most commonly used is probably that of Lance (1980) “… a motor disorder, charac-terised by a velocity-dependent increase in tonic stretch reflexes (muscle tone) with ex-aggerated tendon jerks, resulting from hy-per-excitability of the stretch reflex as onecomponent of the Upper Motor Neurone (UMN) syndrome.”
Spasticity In this thesis defined as � 1 on the modified Ashworth scale.
Disabling spasticity In this thesis defined as spasticity having such an impact that intervention, e.g. intensive physiotherapy, orthoses or pharmacological treatment, should be offered. Thus, the pres-ence of disabling spasticity with need for in-tervention was defined in consensus be-tween us and the patient/caregiver.

13
Introduction
This thesis is about spasticity after first-ever stroke. It consists of studies of two patient cohorts, as reported in four papers, and the related literature. Paper I-III are based on the same cohort, 140 patients investigated one year after first-ever stroke. Paper IV is based on a second cohort, 49 patients with first-ever stroke, investigated three times; acute, after one month and six months respectively. This study investigates predictors of spasticity.
The Background gives a description of stroke classifications and epide-miology, information of the Swedish Stroke Register and a background of the main measurements used. In addition, it includes a background on pain, in relation to stroke.
It is important to recognize that this is a clinical thesis. It will not look into pathophysiological mechanisms behind spasticity, instead it will address questions like: How common is disabling spasticity? Is spasticity correlated with pain?
Last, but not least, why should anyone bother about spasticity after first-ever stroke? First, stroke is a leading cause of death and disability. Stroke represents a major economic challenge to society 1. Currently, the clinical burden of stroke and transient ischemic attack exceeds that of coronary heart disease 2. In Sweden, with a population of nine million inhabitants, about 30 000 patients suffer a stroke annually, whereof 20 000 for the first time 3. In addition, stroke accounts for 10% of the total number of hospital bed-days in Sweden 4.
Second, spasticity in a well-known complication after stroke. Health pro-fessionals think it is very important to measure spasticity and believe it to be common and treatable 5. However, the prevalence of spasticity after stroke has only been investigated three times 6-8, and the proportion of disabling spasticity has never been investigated.
Third, we can treat spasticity, and policies have changed towards increas-ing use of intramuscular Botulinum toxin 9. For these obvious reasons, we need to know the magnitude of the problem in terms of suffering and eco-nomics. Stroke is common, but how common is disabling spasticity, e.g. spasticity with a specific need for an intervention?
Finally, spasticity is believed to cause pain. But what are the facts? Is spasticity really correlated with pain?

14
Background
This chapter gives the background to the thesis. It addresses questions like: How do you define and classify stroke? How common is stroke? What is the Swedish Stroke Register? How do you define spasticity? What previous research has been done of the prevalence of spasticity? It also gives a short background to pain, in relation to stroke and spasticity.
Definition and classification of stroke The World Health Organization definition of stroke The World Health Organization (WHO) defines stroke as 10:
Rapidly developing clinical signs of focal (at times global) disturbance of cerebral function, lasting more than 24 hours or leading to death with no ap-parent cause other than that of vascular origin.
The WHO definition is a clinical definition. It is not dependent on brain im-aging. It includes subarachnoid haemorrhage, intracerebral haemorrhage and cerebral infarction. Subdural haematoma and other traumatic bleedings are excluded by this stroke definition. The reason for the exclusion is that ex-tradural haematoma is usually caused by trauma.
The 24-hour criterion was based on the assumption that if the syndrome persisted for 24 hour, or longer, an injury to brain parenchyma should be detectable by microscopy. If the symptoms lasted for longer than 24 hours it was a stroke, and if the symptoms resolved before the 24-hour limit, it was a Transient Ischemic Attack (TIA). Insights gained from Computed Tomogra-phy (CT), Magnetic Resonance Imagining (MRI), and other imagining tech-niques have changed this assumption. Both stroke and TIA are markers of current or impending disability and a risk of death 11.
In the latest WHO classification of disease, International Classification of Disease (ICD-10) cerebrovascular diseases are classified into I60–I69 12, see page 52 in the Appendix. The main classifications of stroke are: Subarach-noid haemorrhage, intracerebral haemorrhage and cerebral infarction. Note-worthy, there is no specific ICD-10 number for cerebellar or brainstem in-farction, but the rare disease Moya-Moya has an ICD-10 number (I67.5).
15
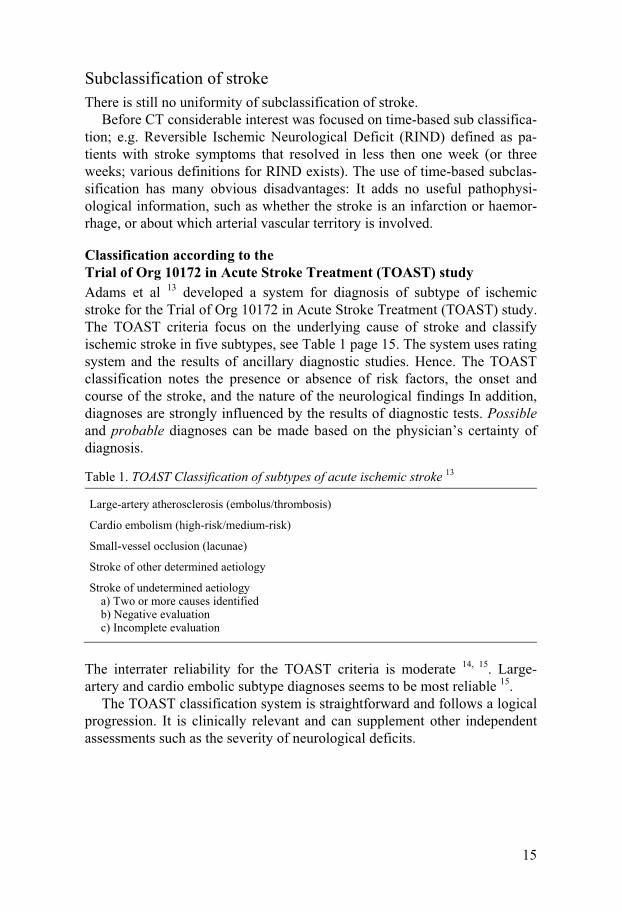
Subclassification of stroke There is still no uniformity of subclassification of stroke.
Before CT considerable interest was focused on time-based sub classifica-tion; e.g. Reversible Ischemic Neurological Deficit (RIND) defined as pa-tients with stroke symptoms that resolved in less then one week (or three weeks; various definitions for RIND exists). The use of time-based subclas-sification has many obvious disadvantages: It adds no useful pathophysi-ological information, such as whether the stroke is an infarction or haemor-rhage, or about which arterial vascular territory is involved.
Classification according to the Trial of Org 10172 in Acute Stroke Treatment (TOAST) study Adams et al 13 developed a system for diagnosis of subtype of ischemic stroke for the Trial of Org 10172 in Acute Stroke Treatment (TOAST) study. The TOAST criteria focus on the underlying cause of stroke and classify ischemic stroke in five subtypes, see Table 1 page 15. The system uses rating system and the results of ancillary diagnostic studies. Hence. The TOAST classification notes the presence or absence of risk factors, the onset and course of the stroke, and the nature of the neurological findings In addition, diagnoses are strongly influenced by the results of diagnostic tests. Possible and probable diagnoses can be made based on the physician’s certainty of diagnosis.
Table 1. TOAST Classification of subtypes of acute ischemic stroke 13
Large-artery atherosclerosis (embolus/thrombosis)
Cardio embolism (high-risk/medium-risk)
Small-vessel occlusion (lacunae)
Stroke of other determined aetiology
Stroke of undetermined aetiologya) Two or more causes identified b) Negative evaluation c) Incomplete evaluation
The interrater reliability for the TOAST criteria is moderate 14, 15. Large-artery and cardio embolic subtype diagnoses seems to be most reliable 15.
The TOAST classification system is straightforward and follows a logical progression. It is clinically relevant and can supplement other independent assessments such as the severity of neurological deficits.

16
Oxfordshire Community Stroke Project classification Yet another way to subclassifiy of stroke is the Oxfordshire Community Stroke Project (OCSP) classification. The OCSP classification is a clinical scheme for subdividing first-ever acute stroke based on neurological signs and syndromes only 16. OCSP contains four subtypes of ischemic stroke: lacunar syndrome (LACS), posterior circulation syndrome (POCS), total anterior circulation syndrome (TACS) and partial anterior circulation syn-drome (PACS) 16. The classification is considered easy to communicate and has good interobserved reliability, and has value for predicting recovery 16-18.
In short, TACS is defined as large anterior circulation infarct with both cortical and subcortical involvement, PACS is more restricted and predomi-nantly cortical infarcts, LACS is infarcts confined to the territory of the deep perforating arteries, and POCS is infarcts clearly associated with the verte-brobasilar arterial territory.
The definition of stroke in this thesis In this thesis stroke is defined according to the WHO criterion, e.g. both ischaemic and haemorrhagic stroke are included, but SAH and TIA are ex-cluded. The reason for this is that the patients were included from the Swed-ish Stroke Register (Riks-Stroke) in Sweden, and to be included in the Riks-Stroke, the patient has a stroke according to the WHO criterion.
It was not possible to subclassify the stroke according to the TOAST or the OCSP. Patients in the Riks-Stroke are registered as ischaemic or haemor-rhagic, and in Sweden neither TOAST nor OCSP is standard classification. When I scrutinized the medical record for each patient, there was too much uncertainly for a proper OCSP classification in my first cohort (Paper I–III), and for the second cohort the sample was too small (N = 49) to make a fur-ther subclassification of ischaemic stroke.
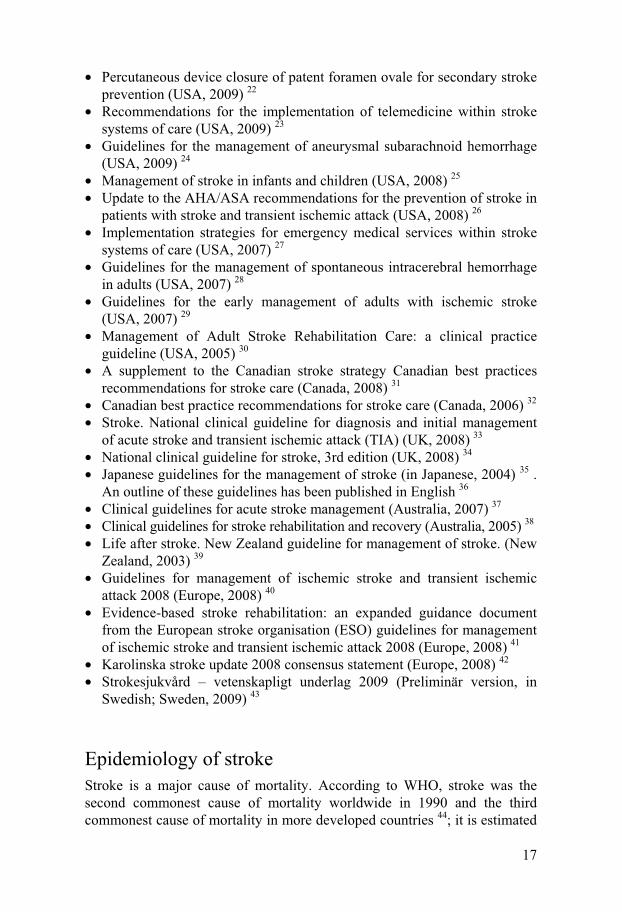
Current guidelines and recommendations for stroke The knowledge in the stroke field has expanded substantially the last dec-ades, and as a consequence many countries have published guidelines for stroke. Guidelines for the management of stroke were first published in 1994 by the American Heart Association 19. The following list presents some im-portant guidelines and recommendations from USA, Canada, UK, Japan, Australia, the European stroke organisation (ESO) and Sweden: • Expansion of the time window for treatment of acute ischemic stroke with
intravenous tissue plasminogen activator (USA, 2009) 20 • Comprehensive overview of nursing and interdisciplinary care of the
acute ischemic stroke patient (USA, 2009) 21
17
• Percutaneous device closure of patent foramen ovale for secondary stroke prevention (USA, 2009) 22
• Recommendations for the implementation of telemedicine within stroke systems of care (USA, 2009) 23
• Guidelines for the management of aneurysmal subarachnoid hemorrhage (USA, 2009) 24
• Management of stroke in infants and children (USA, 2008) 25 • Update to the AHA/ASA recommendations for the prevention of stroke in
patients with stroke and transient ischemic attack (USA, 2008) 26 • Implementation strategies for emergency medical services within stroke
systems of care (USA, 2007) 27 • Guidelines for the management of spontaneous intracerebral hemorrhage
in adults (USA, 2007) 28 • Guidelines for the early management of adults with ischemic stroke
(USA, 2007) 29 • Management of Adult Stroke Rehabilitation Care: a clinical practice
guideline (USA, 2005) 30 • A supplement to the Canadian stroke strategy Canadian best practices
recommendations for stroke care (Canada, 2008) 31 • Canadian best practice recommendations for stroke care (Canada, 2006) 32 • Stroke. National clinical guideline for diagnosis and initial management
of acute stroke and transient ischemic attack (TIA) (UK, 2008) 33 • National clinical guideline for stroke, 3rd edition (UK, 2008) 34 • Japanese guidelines for the management of stroke (in Japanese, 2004) 35 .
An outline of these guidelines has been published in English 36 • Clinical guidelines for acute stroke management (Australia, 2007) 37 • Clinical guidelines for stroke rehabilitation and recovery (Australia, 2005) 38 • Life after stroke. New Zealand guideline for management of stroke. (New
Zealand, 2003) 39 • Guidelines for management of ischemic stroke and transient ischemic
attack 2008 (Europe, 2008) 40 • Evidence-based stroke rehabilitation: an expanded guidance document
from the European stroke organisation (ESO) guidelines for management of ischemic stroke and transient ischemic attack 2008 (Europe, 2008) 41
• Karolinska stroke update 2008 consensus statement (Europe, 2008) 42 • Strokesjukvård – vetenskapligt underlag 2009 (Preliminär version, in
Swedish; Sweden, 2009) 43
Epidemiology of stroke Stroke is a major cause of mortality. According to WHO, stroke was the second commonest cause of mortality worldwide in 1990 and the third commonest cause of mortality in more developed countries 44; it is estimated

18
that stroke causes 5.5 million deaths annually 45. Currently, the clinical bur-den of stroke and TIA exceeds that of coronary heart disease 2.
In Sweden, with a population of nine million inhabitants, about 30 000 pa-tients are hospitalised due to stroke every year, and 20 000 of these suffer a first-ever stroke3, 46. The number of deaths in Sweden from stroke was 8388 (men 3555, women 4833) in 2005. 47.
Stroke mortality has declined over recent decades, most notably in Japan, North America, and Western Europe including Sweden 44.
A recent systematic review 48 of population-based studies of the incidence and early case fatality of stroke for the last four decades (1970 to 2008) found a 42% decrease in stroke incidence in high-income countries. In addi-tion, the authors found a more than 100% increase in low to middle-income countries. Table 2 presents some of the information from the article by Feigin et al. 48.
Stroke is also a major cause of long-term disability 49 and the most com-mon cause of disability in developed countries 50.
International comparisons of stroke prevalence are difficult due to low in-cidence of stroke in some countries, wide between-country variations in the population age structure, and methodological differences.
The Swedish Stroke Register – Riks-stroke The Swedish Stroke Register (Riks-stroke) is a national quality register for stroke care that was established in 1994, and from 1998 the register has cov-ered all hospital in Sweden. The aim of Riks-stroke is to monitor the quality of stroke management and to improve stroke care by providing feedback to all hospitals. Sweden is the first country in the world with a monitoring care that has national coverage 51.
The number of registrations has successively increased and now amounts to more than 24 000 a year for estimated coverage of approximately 90%. The database contains more than 247 000 care episodes in 2006 52. Studies from Örebro in the late 1990s showed a admission rate of 92% 53 for stroke patients. Another study 54, from 2001–2002 from Lund, had an admission rate of 84%. Both these studies indicate a risk for selection bias.
Information regarding living conditions, vascular risk factor and medica-tion before stroke are collected together with information of stroke manage-ment during hospital stay. Three months after the stroke, the patient is con-tacted by telephone or mail and asked to fill in a questionnaire. All the data are computerised in a database and each hospital receives feedback informa-tion. The results from every hospital are compared with an average national data and presents in a report every year. For more information, please visit Riks-Stroke’s home page, http/www.riks-stroke.org.

Tabl
e 2.
Cha
ract
eris
tics o
f pop
ulat
ion-
base
d st
udie
s. Ad
apte
d fro
m 48
. Str
oke
inci
denc
e pe
r 100
000
per
son-
year
s C
ity, C
ount
ry
Stud
y pe
riod
Cru
de in
cide
nce
of to
tal s
troke
(9
5% C
I)
Age
-adj
uste
d in
cide
nce
of to
tal
stro
kes (
95%
CI)
Hos
pita
l adm
is-
sion
rate
1
mon
th c
ase
fata
lity
of to
tal
stro
kes
CT
or M
R o
r au
tops
i rat
e
Roc
hest
er, M
N, U
SA
1970
–74
122
(114
–142
) 91
(81-
102)
N
R
15-2
4%
43%
R
oche
ster
, MN
, USA
19
85–8
9 14
9 (1
36–1
62)
102
(92–
112)
85
%
14-2
5%
92%
U
lan
Bat
or, M
ongo
liet
1971
–74
50 (4
6–54
) 78
(71–
84)
51%
N
R a
NR
a M
alm
ö, S
wed
en
1989
22
5 (2
06–2
44)
83 (7
4–91
) 95
%
15%
51
%
Söde
rham
n, S
wed
en
1975
–78
290
(256
–324
) 25
4 (2
23–2
85)
89%
23
%
1%
Söde
rham
n, S
wed
en
1983
–86
352
(317
–390
) 31
2 (2
78–3
47)
95%
22
%
38%
Ö
rebr
o, S
wed
en
1999
–200
0 31
4 (2
79–3
49)
126
(111
–140
) 92
%
19%
84
%
East
Lan
cash
ire, U
K
1994
–95
158
(146
–171
) 74
(67–
80)
70%
34
%
12%
O
xfor
dshi
re, U
K
1981
–84
165
(150
–181
) 10
2 (9
2–11
2)
54%
18
%
82%
O
xfor
dshi
re, U
K
2002
–04
145
(127
–162
) 73
(64–
83)
56%
17
%
98%
N
R N
ot re
porte
d.

20
Definition of the Upper Motor Neuron syndrome and spasticity The clinical phenomena observed after lesions of cortical motor areas or the corticofugal, descending tracts are often referred to as the Upper Motor Neu-ron (UMN) syndrome, and described as positive and negative symptoms and signs 55. These phenomena are summarized in Table 3. In addition, rheologi-cal changes in involved muscles may occur.
Table 3. Clinical features of the Upper Motor Neuron syndrome 55
Positive symptoms Negative Symptoms
Increased tendon reflexes with radiation Muscle weaknessClonus Loss of dexterityPositive Babinski’s sign FatigueabilitySpasticity Extensor spasm Flexor spasm Mass reflexes Dyssynergic paterns of co-contraction during
movements Associated reactions and other dyssynergic
and steroetypical spastic dystonia
The UMN syndrome is common after stroke as well as in other central nerv-ous system disorders, e.g. cerebral palsy, multiple sclerosis, traumatic brain injury, spinal cord injury, and neurodegenerative diseases.
In stroke patients, lesions that interrupt the descending tracts typically cause weakness of voluntary movements and loss of dexterity (negative signs) as acute manifestations. One or more of the positive signs, e.g. in-creased muscle tone 56, may be present in the acute phase or develop in the post acute phase, and then contribute to motor impairment. The clinical sig-nificance and management of spasticity, as one positive sign of the UMN syndrome, is far from clear-cut and the definition of spasticity as well as assessment methods are debated 57, 58.
The most commonly used definition of spasticity is probably that of Lance from 1980 59.
“… a motor disorder characterised by a velocity-dependent increase in tonic stretch reflexes (muscle tone) with exaggerated tendon jerks, resulting from hyperexcitability of the stretch reflex as one component of the Upper Motor Neurone (UMN) syndrome.”
The definition by Lance points out that spasticity is only one component of the Upper Motor Neuron (UMN) syndrome and also that spasticity is a sign

21
at clinical examination that has a diagnostic value with regard to lesion loca-tion but not with regard to impact on motor ability or need for treatment.
Others have suggested a broader use of the term spasticity to be better in accordance with clinical practice. For example, Pandyan have proposed the following definition 57:
“… disordered sensori-motor control, resulting from an upper motor neuron lesion presenting as intermittent or sustained involuntary activation of mus-cles.”
This definition 57 of spasticity incorporates other positive signs of the UMN syndrome such as abnormal activation of muscles during voluntary move-ments and flexor spasms 57. Spasticity in this broader sense may interfere with motor function and be disabling with regard to motor function, activity performance and social life.
Not all spasticity is harmful for the patient Spasticity is not always harmful. In fact, some of the patients use their spas-ticity as a crutch, and reducing spasticity may do the patient a disservice. The fact that spasticity as such is always bad for the patients is recognised in the current recommendation and guidelines for treatment of spasticity 30, 34, 38,
39, 41, 43, 60-62.
Clinical assessment and management of positive signs of the Upper Motor Neuron syndrome in clinical practice. Spasticity At bedside, spasticity is characterized by increased resistance so passive movements over a joint with the patient in a resting, most often supine, re-laxed position. Typically, resistance increases at higher movement velocities. Thus, spasticity resists muscle stretch and lengthening of the muscle in-volved. This has two important consequences. First the muscle tends to re-main in a shortened position, which probably contributes to dystonic pos-tures, and also leads to soft tissue changes and contractures 63. Second, vol-untary movements might be restricted. If, for example, the patient tries to extend the elbow, spasticity of the stretched flexor muscles will hamper the extension.
Since the muscle stretch reflex is influenced by input from many sources, a number of clinical factors such as limb and body position, pain and infec-tions may have an impact. This has important implications for clinical man-agement and requires that triggering factors be controlled before specific treatments are considered.
22
Other positive signs of the UMS. In accordance with Lance’s definition, tendon reflexes are often exaggerated in parallel with the increased resistance to passive movements and there might be clonus. Clonus, i.e. involuntary, repetitive extension and flexion movements is most often observed over the ankle. Clonus might be pro-voked at the examination of the patient at rest or only be present in certain positions, such as sitting, or activities such as walking. Clonus may be trou-blesome for the patient if triggered during sitting or walking. Co-activation of muscles by definition needs voluntary activation to be identified, and might impair the voluntary movements during e.g. walking 64. In addition, there might be abnormal flexor reflexes, most often observed as Babinski’s sign. Muscle spasms might exhibit extensor or flexor patterns, most often involve lower limbs and are more common after spinal cord lesions than after cerebral lesions 65.
Rheological changes in the spastic muscle In addition to the positive and negative phenomena in the UMN syndrome, the muscle and surrounding soft tissue, including tendons, ligaments and the joints, can develop changes resulting in decreased compliance 63. It is possi-ble, but not proven, that maintaining the joints range through a full range of movement may prevent contractures.
Thus, increased resistance to passive movements often has a neural and a biomechanical component and in advanced conditions, probably soft tissue changes contribute most to the disability 66.
The pathophysiology of spasticity The pathophysiology of spasticity is complex. Although the exact patho-physiology of spasticity is unclear, it is known that interruption of descend-ing pathways frequently produces spasticity 67.
For a better understanding of the pathophysiology of spasticity, I will first review the organisation of the motor systems. The review is based mainly on the excellent textbook Principles of Neural Sciences edited by Kandel et al. 56. The different areas in the brain are often referred to as Brodmann’s areas. Korbinian Brodmann originally described these areas in the book Verglei-chends Lokalisationslehre der Grosshirnrinde published in 1906. This book is available in an English translation by Laurence J Garvey 68.
The motor systems are organized in three levels The motor systems are organized hierarchically in three levels. The cortex is the highest level. The primary motor cortex and several premotor areas pro-
23
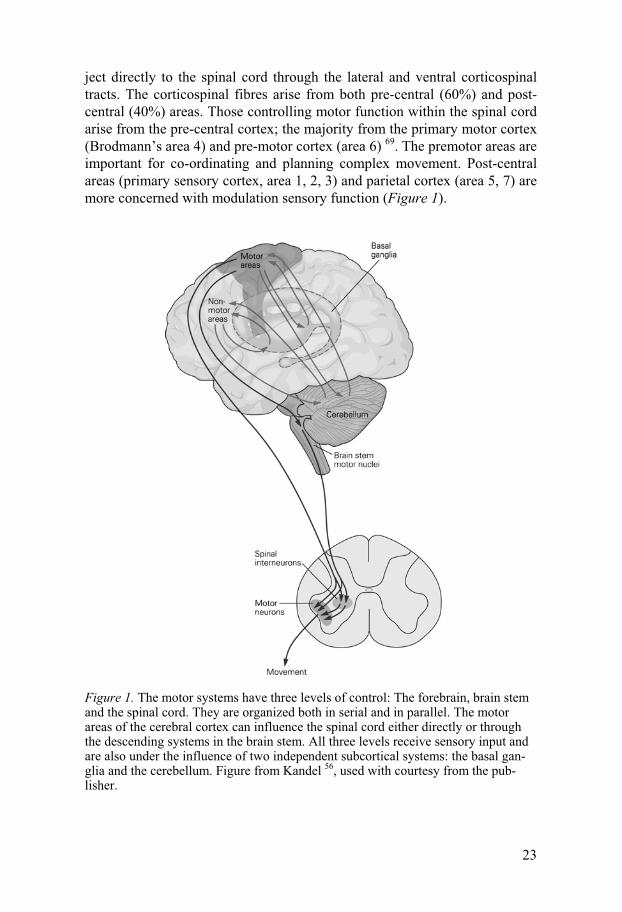
ject directly to the spinal cord through the lateral and ventral corticospinal tracts. The corticospinal fibres arise from both pre-central (60%) and post-central (40%) areas. Those controlling motor function within the spinal cord arise from the pre-central cortex; the majority from the primary motor cortex (Brodmann’s area 4) and pre-motor cortex (area 6) 69. The premotor areas are important for co-ordinating and planning complex movement. Post-central areas (primary sensory cortex, area 1, 2, 3) and parietal cortex (area 5, 7) are more concerned with modulation sensory function (Figure 1).
Figure 1. The motor systems have three levels of control: The forebrain, brain stem and the spinal cord. They are organized both in serial and in parallel. The motor areas of the cerebral cortex can influence the spinal cord either directly or through the descending systems in the brain stem. All three levels receive sensory input and are also under the influence of two independent subcortical systems: the basal gan-glia and the cerebellum. Figure from Kandel 56, used with courtesy from the pub-lisher.
24
The second level of the motor hierarchy is the brain stem. In the brain stem there are two systems, the medial and the lateral, which receive input from the cerebral cortex and subcortical nuclei, and project to the spinal cord. The medial descending systems contribute to the posture by integrating visual, vestibular, and somatosensory information. The lateral descending system control more distal limb muscles, and is important for goal-directed move-ments, especially of the arm and hand.
The third, and lowest level is the spinal cord. It contains neuronal circuits that mediate reflexes and rhythmic automatisms such as locomotion. Inter neurons and motor neurons receive input from axons from higher centres, and these higher centres can facilitate or inhibiate inter neurons in the brain stem.
All three levels of motor systems are organized both in serial and in paral-lel. In addition, all levels are also under the influence of two independent subcortical systems: the basal ganglia and the cerebellum.
Spasticity and its connection to the motor systems Spasticity and the other symptoms and signs of the UMN syndrome arise from the disruption of certain descending pathways involved in the motor control 69.
Lesions at the cortical level Isolated lesions of the primary motor cortex uncommonly produce spasticity – both Brodmann’s areas 4 and 6 must be affected to produce spasticity 69. There are non-pyramidal UMN motor fibres, mainly in area 6, which travel near the pyramidal fibres. These fibres must be involved for the production of spasticity. It has been debated whether these pathways should be called extrapyramidal 70 or parapyramidal 71. In this thesis these fibres will be re-ferred to as parapyramidal to avoid confusion with the extrapyramidal fibres from the basal ganglia that produce rigidity.
The close association of pyramidal and parapyramidal fibres continues in the spinal cord where lesions in the pyramidal fibres produce results similar to those of the primary motor cortex without spasticity.
What are the consequences of a pure motor lesion? In humans, mild hand and foot paresis, mild tendon hyperreflexia, normal tone, and a Babinski’s sign 72 are observed. The majority of the UMN syndrome symptoms are not due to interruption of the pyramidal tracts (except for the Babinski’s sign), but of the parapyramidal fibres 71. Cortical lesions producing spasticity must involve both the primary motor and pre-motor cortices. Such lesions affect both pyramidal and parapyramidal fibres, which run in parallel in the corona radiata and internal capsula.

25
The brainstem and spinal cord level At the brainstem level there are two different systems that affect spasticity – one inhibitory and one excitatory. Both of these systems balance the spinal reflexes in the brain stem. The inhibitory area in the reticular formation largely suppresses spinal reflexes. The dorsal reticulospinal tract (DRT) is the ascending tract for the inhibitory centre in the brainstem. The DRT runs in the dorsolateral funiculus, adjacent to the pyramidal tract.
There are two excitatory systems that facilate spinal stretch reflexes and extensor tone. The main one arises diffusely throughout the brainstem and descends as the median reticulospinal tract. The other is the lateral vestibular nucleus, giving rise to the vestibulo tract. Both of these excitatory systems are located in the ventromedial cord, well away from the pyramidal and the inhibitory tract.
Thus, spasticity arises when the parapyramidal fibres of the inhibitory system are interrupted, either above the medulla (cortex, corona radiata, internal capsula) or of the DRT in the spinal cord.
Differences between spasticity from cerebral and spinal origin The clinical feature of the UMN syndrome seems to depend less upon the aetiology of the lesion and more upon its location in the neuraxis. However, often there are some differences between the UMN syndrome of a cerebral in comparison with a spinal origin. Table 4 describes the main differences.
Table 4. Characteristics of UMN syndrome of cerebral or spinal origin
Characteristics Cerebral origin Spinal origin
Severity Less severe More often severeInvolving extensors with a posture of lower limb
Common Uncommon
Flexor spasm Uncommom Common Clasp-knife phenomenon Uncommon Common Clonus Less severe Common
The reasons for these differences are not discussed in this thesis, but may be explained on anatomical grounds.
How do you measure spasticity? Clinical evaluation of spasticity includes assessment of the velocity-dependent increase of resistance to passive movements to capture the key element of spasticity according to the de�nition by Lance. In the clinical setting, the most well-known spasticity scales are the original and the modi-fied Ashworth scale (MAS) 73, 74. The original Ashworth scale was devel-
26
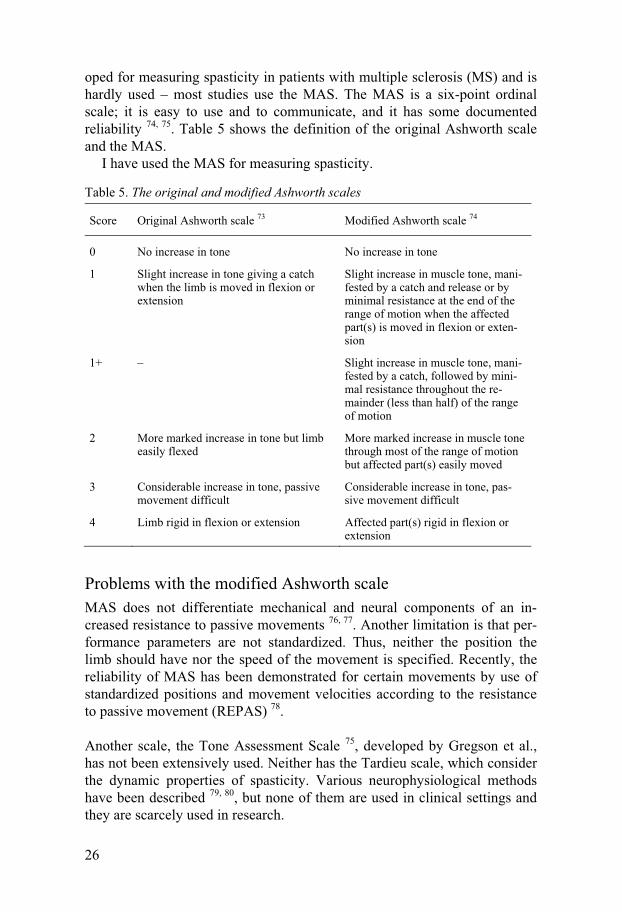
oped for measuring spasticity in patients with multiple sclerosis (MS) and is hardly used – most studies use the MAS. The MAS is a six-point ordinal scale; it is easy to use and to communicate, and it has some documented reliability 74, 75. Table 5 shows the definition of the original Ashworth scale and the MAS.
I have used the MAS for measuring spasticity.
Table 5. The original and modified Ashworth scales
Score Original Ashworth scale 73 Modified Ashworth scale 74
0 No increase in tone No increase in tone
1 Slight increase in tone giving a catch when the limb is moved in flexion or extension
Slight increase in muscle tone, mani-fested by a catch and release or by minimal resistance at the end of the range of motion when the affected part(s) is moved in flexion or exten-sion
1+ – Slight increase in muscle tone, mani-fested by a catch, followed by mini-mal resistance throughout the re-mainder (less than half) of the range of motion
2 More marked increase in tone but limb easily flexed
More marked increase in muscle tone through most of the range of motion but affected part(s) easily moved
3 Considerable increase in tone, passive movement difficult
Considerable increase in tone, pas-sive movement difficult
4 Limb rigid in flexion or extension Affected part(s) rigid in flexion or extension
Problems with the modified Ashworth scale MAS does not differentiate mechanical and neural components of an in-creased resistance to passive movements 76, 77. Another limitation is that per-formance parameters are not standardized. Thus, neither the position the limb should have nor the speed of the movement is specified. Recently, the reliability of MAS has been demonstrated for certain movements by use of standardized positions and movement velocities according to the resistance to passive movement (REPAS) 78.
Another scale, the Tone Assessment Scale 75, developed by Gregson et al., has not been extensively used. Neither has the Tardieu scale, which consider the dynamic properties of spasticity. Various neurophysiological methods have been described 79, 80, but none of them are used in clinical settings and they are scarcely used in research.
27
What is disability? What is disability? At first this question might seem easy to answer. How-ever, the concept is complex and the use of the term disability varies. Re-cently, WHO has proposed a new definition in the International Classifica-tion of Functioning, Disability and Health (ICF) 81. The ICF approach to functioning and disability is biopsychosocial and it tries to integrate medical and social aspects. A purely medical model would see disability as a conse-quence of a disease or trauma and medical cure as the solution. A purely social model would regard disability as mainly a contextual problem and ask for social solutions. An integrated approach is obviously relevant to medical conditions with ongoing, complex impairments. ICF is considered relevant for clinical settings, health services or surveys at both the individual and population level, and has gained increasing attention not least in rehabilita-tion medicine and neurorehabilitation.
In ICF, disability is used as an umbrella term for impairment of function, activity limitation or participation restrictions. Thus, ICF complements ICD-10, and is looking beyond mortality and disease. The definitions in ICF con-tain commonly used anchor points for assessments so that they can be trans-lated into questionnaires. Results from existing assessment instruments can be coded in ICF terms.
An overview of the ICF The ICF classification has two parts, each with two components:
Part 1. Functioning and Disability a) Body Function and Structure b) Activities and Participation
Part 2. Contextual Factors c) Environmental Factors d) Personal Factors
Each component can be expressed in both positive (functioning) and nega-tive terms (disability). The components are further divided in domains. The domains are the units of classification. Table 6 is an overview of ICF 81.
Definitions of terms in the ICF The following terminology is used in the ICF 82:
Disability is an umbrella term for impairment, activity limitation and par-ticipation restrictions.
Body function is the physiological functions of body system, including psychological functions.
Body structure are the structural or anatomical parts of the body such as organs, limbs and their components classified according to body systems.

28
Although Body function and Body structure are classified in two different sections, these two classifications are designed for use in parallel.
Activity is the execution of a task or action by an individual. Participation is a person’s involvement in a life situation. Contextual factors are the factors that together constitute the complete
context of an individual’s life and in particular the background. Environmental factors are all external factors for the individual, including
the physical world, other persons, social services, rules and laws. Personal factors are factors that relate to the individual such as age, gen-
der, social status and so on.
Table 6. An overview of ICF 83
Part 1: Functioning and disability Part 2: Contextual factors
Components Body functions and structures
Activities and participations
Enviromental factors
Personal fac-tors
Domains Body functions and structures
Life areas (tasks, actions)
External influ-ence on func-tioning and disability
Internal influ-ence on func-tioning and disability
Contructs Change in body func-tion (physiological) Change in body struc-tures (anatomical)
Capacity executing tasks in a standard envi-roment Performance executing tasks in the current envi-roment
Faciliating or hindering impact of features of the physical, social, and attitudinal world
Impact of attributes of the person
Positive aspects
Functional and structu-ral integrity.
Activities participation.
Facilitators Not applicable
Functioning
Negative aspects Impairment Activity limi-tation partici-pation restric-tion
Barriers or hindrance
Not applicable
Disability
Is spasticity harmful? Table 7 shows how the Royal Collage of Physicians, UK, 60 describe the harmful effects of spasticity according to the ICF in their guideline for treatment of spasticity.

29
Table 7. Harmful effects of spasticity 60
ICF level Problem Effect
Impairment Muscle spasms Pain
Difficulty with seating and posture Fatigue
Abnormal trunk and limb posture Contractures Pressure sores Deformity Pain Distress and low mood Poor sleep patternsActivity Activity function loss Reduced mobility Inability to use limbs in function Difficulty with sexual intercourse Passive function loss Difficulty with self-care and hygiene Increased carer burdenParticipation Impact of any/all of the above Poor self-esteem/self-image Reduced social interaction Impact on family relationships
Activity and participation after stroke There are two scales that are frequently used for assessment of activity and participation in stroke patients: The modified Rankin scale (mRS) and the Barthel Index (BI). Both mRS and BI are ordinal scales.
The mRS was first published in 1957 84. In 1988 it was modified 85 to im-prove its comprehensiveness. The validity and inter-rater reliability is well documented 86. The current version of the mRS running from 0 (no disabil-ity) to 6 (death).
A structured interview can be used to assign patients to the right mRS grade. The interview consists of five sections corresponding to the level of disability on the mRS 87. The best available information should be used; information can be obtained from the patient, next of kin, or caregiver. The mRS in presented in the Appendix, page 81, with some exemplified ques-tions from the structured interview 87. Focus on the mRS lies on personal-ADL, e.g. management of self-care (bathing, dressing, transportation), but the mRS 1 could represent an instrumental-ADL. Instrumental-ADL is ac-tivities that is not fundamental for an individual, but enables an individual to live independently in the community (e.g. using a phone or managing money).
In many studies the mRS is dichotomized into excellent (0–1 vs. 2–6) or good (0–2 vs. 3–6) outcome 88. Sometimes shift analysis is used, e.g. com-paring the outcome between the treatment and control across the entire ordi-nal scale. Shift analysis is better than dichotomizing when there is a small benefit across all ranges of stroke severity 89.

30
The BI 90 is a scale with documented validity after stroke 91. The BI is fo-cused on personal-ADL (Appendix).
These disability scales yield information about disability related to the ac-tivity and participation component according to the ICF. Disabilities cap-tured might reflect the impact of any motor or other neurological impairment after stroke. Thus, the scales do not address the relative impact of specific impairments, or the individual perception of various disabilities.
Definition of disabling spasticity in this thesis In order to compare the results of our studies we used the modified Ashworth scale to capture one of the positive signs of the UMS and an MAS score of 1 or more was referred to as spasticity. However, as discussed above, spasticity in this sense is not a problem per se. In fact, some patients may use their spasticity for mobility, and then treating spasticity might cause problems instead of solving them. On the other hand, spasticity according to the proposed broader definition, may interfere with motor performance as previously discussed.
There is no single assessment instrument that captures all relevant aspects of spasticity according to this broader definition. Neither is there a single measure that addresses spasticity-related disability. Therefore, we used a comprehensive clinical evaluation to achieve a clinically relevant estimate of the prevalence of disabling spasticity after first-ever stroke in addition to conventional measures of disability (the mRS and Barthel Index).
The clinical evaluation comprised a detailed history and clinical examina-tion of motor performance to identify any intermittent or sustained involun-tary activation of muscles in accordance with the broader definition 57. Fur-ther, by use of a semi-structured interview, we tried to evaluate if there was any disabling effect of these phenomena, as based on observation at the ex-amination and the patients’ history. Thus, we tried to disentangle any impact on motor function, limb positioning, mobility or activities of daily living (e.g. personal hygiene, dressing) – or on pain conditions or sleep. Finally, we used clinical judgement to decide, in dialogue with the patient and/or caregiver, whether there was a need for intervention targeted specifically to any of the identified spasticity phenomena, such as intense physiotherapy, orthoses or drug treatment. If so, we used the term disabling spasticity for this condition in accordance with how disability is defined by the ICF.
Disabling spasticity was defined, as spasticity having such an impact that intervention, e.g. intensive physiotherapy, orthoses or pharmacological treatment, should be offered. Thus, the presence of disabling spasticity with need for intervention was defined in consensus between us and the pa-tient/caregiver.

31
Limitations of our definition of disabling spasticity Clearly our definition of disabling spasticity has certain limitations. Even if all patients exhibited an MAS score � 1, this finding is open to various inter-pretations. Further, the clinical evaluation and the final decision on need for treatment are subject to the same weaknesses as all clinical evaluations. However, these were performed in a clinical setting with a considerable ex-perience in the area. In addition, the procedure is in accordance with the current concept that individualised goal setting and attainment might be more sensitive and clinically relevant for interventions and outcome assess-ment in complex disorders including spasticity after stroke 92, 93. Finally, conventional disability measures – the mRS and BI – were also used and allowed comparisons on the group level.
Who did the assessments? I assessed all patients, and all patients exhibiting any signs or symptoms of spasticity were also assessed by my main supervisor (JB), as well as a physiotherapist and/or occupational therapist, who were members of a neu-rorehabilitation team specialised in motor disorders.
Pharmacological management of spasticity Assessment of spasticity often requires a multiprofessional team in order to evaluate the troublesome effect of spasticity. It must be recognized that some patients use their increased tone for walking and sometimes the best treat-ment may be no treatment. In addition, the medication may have side effects with greater impairment than spasticity itself.
Treatment goals must be set for the rehabilitation and discussed with the patient and their care giver 94.
The primary treatment of spasticity is physical. The physical treatment should be continued even if a pharmacological treatment is started 94. The first step in the management is to assure that noxious and external stimuli are diminished 95, e.g. pain, incontinence, constipation, infections, and pressure sores. The next step is to assess the indications for pharmacological treat-ment. Some of the indications are listed in Table 8.

32
Table 8. Indications for pharmacological treatment of spasticity 66
Indication
Increasing tone despite physical stretching/casting limbsPain Prevention and treatment of contracture formationPrevention of deformitiesPrevention and treatment of dysphagiaPreservation of skin hygienePreservation of sexual functioningDecrease carer burden to perform carer tasksCosmetic effect
Oral medications are often associated with side, such as drowsiness, vertigo, ataxia, memory deficit and confusion. In the 1990s botulinum toxin was introduced, and it emerged as treatment of choice for focal spasticity. Neuro-lysis with phenol might be effective but is associated with side effects such as dysestesia and oedema. The following section will briefly outline the medical treatment of spasticity. I will not discuss physiotherapy, occupa-tional therapy and surgical treatment.
Oral anti-spastic medications Baclofen Baclofen is the most commonly used medication and it has been used for over 40 years. Multiple sclerosis and spinal cord lesion are the most frequent studied diseases, and baclofen reduces spasticity and spasms for these dis-eases 96-98. The effect on spasticity of cerebral origin seems more limited. 66.
Baclofen is an analogue of gamma-aminobutyric acid (GABA), which is one of the main inhibitory neurotransmitters in the central nervous system. Baclofen binds to a presynaptic GABAB-receptor, calcium influx is inhib-ited, and the release of excitatory neurotransmitters is suppressed. The plasma half-life is 3.5 hours. Only a small fraction crosses the blood-brain barrier.
Benzodiazepine The effect of benzodiazepines is mediated through GABAA-receptors. Ben-zodiazepines binds to a specific benzodiazepine site in the post synaptic GABAA-receptors that booster the inhibitory effect 99. Various subtypes of benzodiazepine receptors have slightly different actions. Alpha 1 is responsi-ble for sedative effects, whereas alpha 2 is responsible for the anti-anxiety effects. The anticonvulsant effects are mediated through alpha 1, alpha 2 and alpha 5. All benzodiazepines on the market combine all these receptor sub-types, and bearing in mind that 40% of the neurons in the brain are GABA-dependent, it is easy to understand why benzodiazepines have side-effects.

33
Diazepam Diazepam has been used as an anti-spastic drug for over 40 years and its effectiveness has been demonstrated in two double-blind, cross-over trials 100, 101. Diazepam is problematic to use in stroke patients because of its seda-tion side-effect.
Dantrolene sodium Dantrolene sodium acts peripherally on muscle fibres through suppressing the release of calcium ions from the sarcoplasmic reticulum 102. Some evi-dence suggests that dantrolene work better for spasticity after stroke 103, 104.
Dantrolene has side-effects that limit its use; it might cause transient ab-normalities in liver function, as well as fatal hepatitis in 0.2% of the patients. Liver function must be checked regularly.
Tizanidine Tizanidine has been tested in several randomized, double-blinded, placebo-controlled studies for multiple sclerosis and spinal cord injury 105-108. The anti-spastic effect is similar to that of baclofen 109-111 and diazepam 112. In addition, there are some advantages with tizanidine: muscle strength is more preserved and the side-effects are milder compared to both baclofen and diazepam.
Tizanidine is an alfa-adrenergic agonist. A clinical significant increase in liver enzymes can occur in 5–7% of pa-
tients. The liver enzymes normalises after withdrawal of the drug. Serious tizanidine hepatic injury has been reported. Liver function must be checked regularly.
Clonidine There is no double-blind, placebo-controlled study of clonidine. Two trials have found that clonidine reduced spasticity in patients with spinal cord le-sions 113, 114.
Intramuscular injection with botulinum toxin Botulinum toxin (BTX) is the most potent neurotoxin known. It acts by bind-ing presynaptically on the cholinergic nerve terminals and decreasing the releasing of acetylcholine, causing a neuromuscular block. There are seven different neurotoxins: A, B, C, D, E, F and G. They are antigenically and serologically different but structurally similar. Human botulism is caused by types A, B, E and F. Types C and D cause toxicity only in animals.
Botulinum toxin A (BTX-A) was first used for strabism in the late 1970s 115. It is now used for a wide range of diseases including focal dystonia, cer-vical dystonia, task specific dystonias, and hemifacial spasm. In a consensus

34
statement from 2009 on the use of BTX-A in adult spasticity 62, it was con-cluded that BTX-A is a valuable treatment in the management of spasticity after a stroke. Currently there are two different BTX in the Swedish market: BTX-A and botulinum toxin B (BTX-B). The benefits of BTX are that a specific muscle can be treated, and that there are few side-effects. BTX is considered expensive.
Intrathecal treatment with baclofen The first description of the use of intrathecal baclofen (ITB) was in a small study of six patients in 1985 116.
In 1996, the U.S. Food and Drug Administration approved the use of ITB therapy for severe spasticity of cerebral origin. However, the evidence basis is still weak.
Previous studies of the prevalence of spasticity after first-ever stroke There are three prior studies of the frequency of spasticity after stroke and the result of the studies are not consistent. Two follow-up studies of a Swed-ish cohort, using the MAS, report a spasticity frequency of 19% in patients examined 3 months 7 and 18 months after stroke 8. One UK study 6 reports a frequency of 39% in patients examined 1-year after stroke. The discrepancy might be related to various study settings and samples. In UK approximately 50–70% of the stroke patients are admitted to hospital 117 in comparison with 95% in Sweden 118-120, probably leading to more severe stroke hospitalised in the UK. An overview of the previous studies on spasticity after stroke is presented in Table 9.

35
Table 9. Studies on spasticity after stroke
Watkins 6 Sommerfeld 7 Welmer 8
Study type Hospital based. Cross-sectional. 12 months after stroke.
Hospital based. Co-hort study. Acute and 3 months after stroke.
Same cohort as Sommerfeld. 18 month after stroke.
Inclusion criteria First-ever and recur-rent stroke
First-ever stroke. Same as Sommerfeld
Exclusion TIA and SAH TIA and cerebellar stroke.
Same as Sommerfeld
Inclusion period Jan-Jun 1996 Jun 2001-Mar 2002, consecutively recrui-ted, not weekends and holidays
Same as Sommerfeld
Year published 2002. 2004. 2006.Recruitment 270 included at stro-
ke onset. 134 (50%) died within 12 months. 106 consen-ted to follow-up.
109 patients include-dand in the acute phase. During the follow-up 14 patients was excluded or lost to follow-up at 3 months. (4 had a recurrent stroke, 4 died, 5 claimed to be fully recovered an declined to participa-te, and 1 could not be located).
They did a follow-up of the Sommerfeld cohort. At 3 months there were 95 patients and 29 patients were excluded or lost to follow-up at 18 months. (9 had a recurrent stroke, 15 died, 4 declined to participate, whereof 1 claimed to be fully recovered, and 1 could not be located).
Number of patients with first-ever stroke
59 109 (acute) and 95 (at 3 months).
66
Mean age (years) 70 a 78 76Percent women NR b 63% 67% Haemorrage stroke 17% c NR b 14% Measurement of spasticity
MAS and Tone As-sessment Scale
MAS MAS
Hospital, Country University Hopital Aintree, UK
Danderyd Hospital, Sweden
Danderyd Hospital, Sweden
Percent spasticity 39% at 12 months 21% in the acute phase and 19% at 3 months
20% at 18 months
a Mean age for the whole sample, not specified for first-ever stroke. b NR Not reported in the article. c The percentage is based on the 84% who underwent a CT of the brain.
Previous studies 6-8 have reported on some weak or moderate associations between spasticity, activity performance and health-related quality of life. However, data on the prevalence of disabling spasticity (DS) are scarce.
Prevalence of spasticity in other diseases Spasticity can occur in other diseases than stroke. Spasticity affects between 37–78% of patients with multiple sclerosis 121, 122, 40% of those with spinal
36
cord injury 123 and, more than 90% with cerebral paresis 124. Wedekind et al. 125 investigated the 1-year outcome of 32 survivors with severe traumatic brain injury (TBI). The patients were divided into two groups; those with brain stem injury (mid-brain and pons, n = 15), and those without brain stem lesions (n = 17). After 1 year 8/15 (53%) in the brain stem group, and 3/17 (18%) had spasticity, respectively. Unfortunately, the authors did not men-tion how they assessed spasticity. However, it is evident that a brain stem lesion negatively affects spasticity.
Definition of pain The International Association for the Study of Pain (IASP) defines pain as 126:
An unpleasant sensory and emotional experience associated with actual or potential tissue damage, or described in terms of such damage
The IASP emphasises that inability to communicate verbally does not ex-clude that a person could experiences pain, and that pain is always subjec-tive. Pain is the experience we associate with actual or potential tissue dam-age.
Further, IASP states that many people report pain in the absence of tissue damage or any likely pathophysiological cause. IASP concludes that there is usually no way to distinguish their experience from pain due to tissue dam-age. If they regard their experience as pain and if they report it in the same way as pain caused by tissue damage, it should be accepted as pain. The IASP argues that this definition avoids connecting pain to stimulus.
Pain can be classified as nociceptive or neuropathic Pain can be classified as nociceptive or neuropathic pain.
Typically, nociceptive pain is well localized, constant and often described as aching or throbbing. The pain is mediated via nociceptors. These nocicep-tors sense and respond to parts of the body, which suffer from damage. No-ciceptive pain is usually time limited and responds well to treatment with opioids.
Neuropathic pain is the result of an injury or malfunction in the peripheral or central nervous system. The pain can persist for years beyond the apparent healing of the damaged tissue. The neuropathic pain is often burning, lanci-nating, or described as an electric shock. In addition, light touch may result in pain. Neuropathic pain tends to respond less well with opioids, but may respond to other drugs such as anti-seizure and tricyclic antidepressant medications.

37
Measuring pain Because pain is of subjective nature, it cannot be measured in an objective way. In studies to assess pain the visual analogue scale (VAS) has been used. The VAS typically consists of a 100-mm line without subdivisions or num-bers, anchored at either end by an extreme statement as “I have no pain at all” and “My pain is as bad as it could possibly be” 127. The individual is asked to mark on the line their current state between these two extremes, and the position of which is measured in millimetres from the lower end.
Examination of the VAS has suggested that outside the stroke population it is reliable and accurate for pain 128. However, there is debate about the validity of the VAS for older patients 129, and stroke patients are generally older. In addition, stroke patients often suffer from cognitive deficit, he-mianopia and inattention, making it even more difficult to use scales. To overcome these problems, vertical and mechanical “slide-rule” versions have been used 130. Subjects with stroke are less likely than an age-matched con-trol group to correctly complete subjective rating scales, including VAS 131, but at the same time VAS was the most sensitive scale examined although it was the scale with the most mistakes.
In spite of its limitation, the VAS is reasonably to use in the stroke popu-lation.
Prevalence of pain worldwide The reported prevalence of pain in the general population varies considera-bly. A Canadian study 132 estimated that 11% of the genral population had persistent pain and had experienced that pain within the preceding 2 weeks. According to a Swedish postal survey 133, including persons aged 18–84, any pain or discomfort, was reported by 66%. Their questionnaire consisted of two pain scales: one for pain intensity and one for how much the pain trou-bled and affected the individual. Forty percent reported pain, which affected them “to quite a high degree”, or more and was “like being stiff after exer-cise” or worse, lasting more then 6 months. In a recent survey of chronic pain in Europe 134, screening persons aged � 18 years, 19% of 46 394 re-sponders had suffered pain for � 6 months, had experienced pain in the last month and several times during the last week. Even if these prevalence rates vary, probably reflecting different definitions of pain, time frame for re-ported pain, sample characteristics and other factors, it is clear that pain is common in the general population. In addition, chronic pain occurs often concomitant with depression 135-138. Depression after stroke is very common; in an systematic review of 51 obser-vational studies 139 the pooled estimate for depression after stroke was 33%.

38
Thus, both pain and depression are common in the population and may coin-cide in patients with stroke.
Prevalence of pain among stroke patients The reported prevalence of pain after stroke varies between 19–74% 140-144.
Most previous studies have focused on specific clinical conditions, e.g. central post-stroke pain 145 or shoulder pain 142-144. Data on the overall preva-lence and characteristics of pain after stroke are scarce. One population-based study of Appelros 146 reports the overall prevalence of stroke-related pain at one year after first-ever stroke to be 11%. In another recent study by Jönsson 147, 21% of the patients reported moderate to severe pain at 16 months after first-ever stroke, but in this study prior- and post-stroke pain were not differentiated. Both studies indicated an association between pain and sensorimotor impairments according to the NIHSS.
Previous studies of the correlation between spasticity and pain after first-ever stroke Spasticity is believed to cause pain, but no study has investigated the correla-tion between spasticity and pain after first-ever stroke.
Cost of illness studies Stroke represents a major economic challenge to society 1. Currently, the clinical burden of stroke and transient ischaemic attack exceeds that of coro-nary heart disease 2. Over the years there has been an increased number of Cost of Illness (COI) studies 1, 4, 148-156. Stroke is accountable for 10% of the total number of hospital bed-days in Sweden, and the direct costs of stroke accounts for 76% of the total cost of stroke 4.
There are no empirical data on health economics for spasticity after stroke. To date, three top-down studies 157-159 have assessed the economic impact of botulinum toxin, and all three studies indicate that treatment with botulinum toxin is cost-effective. However, the studies 157-159 use Delphi panel survey 160, e.g. based solely on expert opinions and as such subject to bias and inaccuracy. The Delphi model is reliable of evaluating expert opin-ions in areas where empirical knowledge is not available, but more knowl-edge is needed to estimate the economic burden for spasticity after stroke. An ongoing phase IV study with botulinum toxin 161 is investigating whether patients who have had a stroke and suffer from spasticity might benefit from
39
being given Botox® in addition to standard care. Patients will be enrolled in this study at about 33 locations in Europe and Canada.
Organisation of the health care system in Sweden Sweden is divided into 290 municipalities, 18 county councils and 2 regions. There is no hierarchical relation between municipalities, county councils and regions since all have their own self-governing local authorities with respon-sibility for different activities. The Parliament, Riksdagen is the supreme political decision-making body. Municipalities are responsible for matters relating to the inhabitants of the municipality and their immediate environ-ment. Sweden’s municipalities are responsible for a larger share of public services in comparison with the situation in most other countries. Three-quarters of the activities of the municipalities are directly related to demo-graphic factors and are determined by the number of inhabitants, their age and their state of health. Elderly care and care of the disabled are also impor-tant tasks for the municipalities and account for almost 30% of their budgets. Care and assistance is provided in the home and in nursing homes 162.
The main task of the county councils and regions is health care. The health care system is financed via taxes. The county councils and regions are responsible for ensuring that everyone living in Sweden has access to good health care. Health care is largely tax-financed in guarantee that people have access to the same high level of care regardless of where they live. On aver-age, patient fees account for 3% of the overall revenues of county councils and regions 162.
There are over 1 000 local medical centres, doctors’ surgeries and district nursing clinics throughout the country. Together, these form the primary care structure, which is the foundation of the Swedish healthcare system. At local medical centres, patients can be treated for all the health problems that do not require the technical and medical resources of a hospital. In addition, Sweden has more than 70 hospitals at county level and 9 regional/university hospitals. The most advanced technical equipment is only available at these hospitals and highly-specialised care has been concentrated here 162.
Organisation of the health care system in Uppsala county Uppsala county has two hospitals: Uppsala University Hospital and Enköping Hospital. Uppsala University Hospital is a university hospital but also serves as a local hospital for the inhibitans in the county. In the catch-ment area for the hospital there are 26 medical centres and 6 private medical centres.
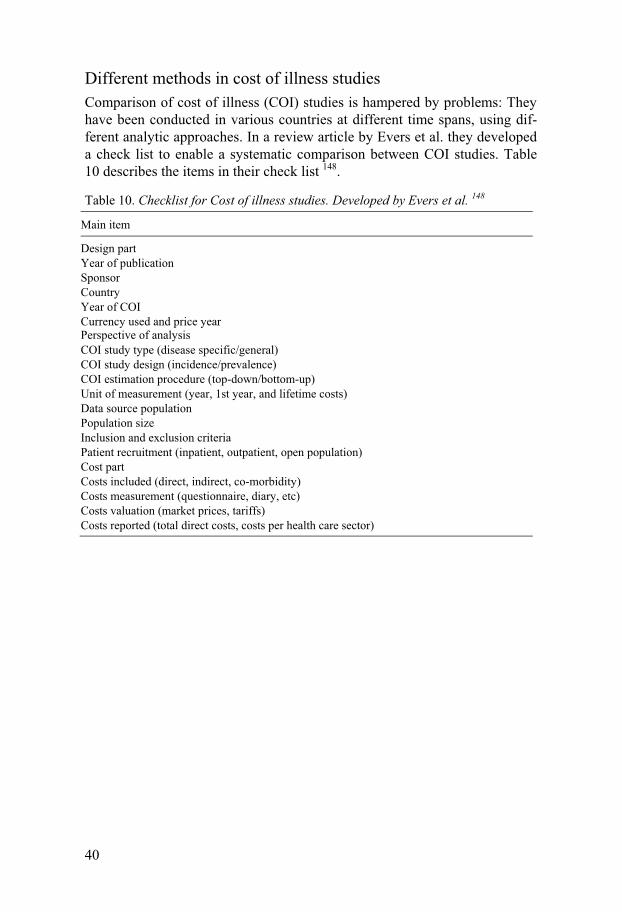
40
Different methods in cost of illness studies Comparison of cost of illness (COI) studies is hampered by problems: They have been conducted in various countries at different time spans, using dif-ferent analytic approaches. In a review article by Evers et al. they developed a check list to enable a systematic comparison between COI studies. Table 10 describes the items in their check list 148.
Table 10. Checklist for Cost of illness studies. Developed by Evers et al. 148
Main item
Design part Year of publicationSponsor Country Year of COI Currency used and price yearPerspective of analysis COI study type (disease specific/general)COI study design (incidence/prevalence)COI estimation procedure (top-down/bottom-up)Unit of measurement (year, 1st year, and lifetime costs)Data source populationPopulation size Inclusion and exclusion criteriaPatient recruitment (inpatient, outpatient, open population)Cost part Costs included (direct, indirect, co-morbidity)Costs measurement (questionnaire, diary, etc)Costs valuation (market prices, tariffs)Costs reported (total direct costs, costs per health care sector)

41
Outline of the thesis
Table 11. Outline of the thesis
Cohort I Cohort II
Study type Cross-sectional study Cohort study When investigated 1 year post stroke At three times: Acute (2 to 10
days after stroke), 1 month, and 6 months post stroke
Eligible Catchment area for Uppsala University Hospital. Included via Riks-stroke.
Catchment area for Uppsala University Hospital. Conse-cutivly included at the stroke unit.
Inclusion criteria (a) Resident in the catchment area, (b) above 18 years, (c) a �rst-ever stroke (cerebral infarction or intracerebral hemorrhage) and survive 1 year, and (d) ability to give informed consent.
(a) Resident in the catchment area, (b) age between 18–84, (c) a first-ever stroke (cere-bral infarction or intracereb-ral haemorrhage), (d) ability to give informed consent, (e) any paresis in the face, arm, hand or leg, at stroke onset.
Exclusion criteria (a) Any other neurological disorder, which might affect muscle tone, (b) TIA, and (c) subarachnoid haemorrhage.
Same as cohort I
Number of patients 140 49 Paper(s) based on Paper I–III Paper IV

42
Aims
Paper I To estimate the prevalence of disabling spasticity 1 year after first-ever stroke.
Paper II To determine whether spasticity 1 year after first-ever stroke correlates to pain.
Paper III To estimate the direct costs related to spasticity for patients who had had a first-ever stroke and who had survived for 12 months.
Paper IV To explore the occurrence of spasticity according to modified Ashworth scale and of disabling spasticity during the first six months after first-ever stroke as well as risk factors for spasticity.

43
Methods for Paper I–III
This Chapter describes the methods used in Paper I–III. First, the study de-sign and study population followed by case ascertainment. Second, the as-sessment methods and definitions. Table 13 illustrate the key parameters for the study.
Study design It is a cross-sectional study carried out 1 year after first-ever stroke. Cross-sectional studies are observational studies suitable for estimating the point prevalence of a condition in the population. As we do not know when the event occurs prior to the study, we can only say that there is an association between the investigated factor and a disease, and not that the factor per se has caused the disease. Further, we cannot estimate the incidence and trends over time.
In addition, Paper III can be described as: a disease-specific, incidence-based, bottom-up, including direct costs.
Study population At the time of the study period, the area of Uppsala University Hospital health care district consisted of four municipalities (Uppsala, Knivsta, Tierp and Östhammar) with approximately 244 000 inhabitants. In the area there were 26 communities and six privately owned primary health care centres.
Case ascertainment Patients were recruited from the Riks-stroke. For more information about the Riks-stroke, see page 15. The medical history of the stroke patients was carefully reviewed to exclude prior stroke and any neurological disorder, which might affect muscle tone. No multiple overlapping methods were used.
Eligible for the study were stroke patients hospitalized at Uppsala Univer-sity Hospital between January 2003 and April 2004.
44
Inclusion and exclusion criteria Inclusion criteria were: (a) resident in the catchment area, (b) above 18 years of age, (c) a �rst-ever stroke (cerebral infarction or intracerebral haemor-rhage) and survive 1 year and (d) ability to give informed consent. Exclusion criteria were: (a) any other neurological disorder, which might affect muscle tone, (b) TIA and (c) subarachnoid haemorrhage. All patients had received an acute CT scan examination.
Sampling procedure Eligible patients were listed by date of birth (year, month, and day; if two patients were born on the same date, they were ordered by name). To create a representative sample of a manageable size, and equally large age groups, a cluster sample was created in the following way; patients were strati�ed by age in four groups: 18–64, 65–74, 75–84 years, and 85 or more years of age. All patients in the youngest (18–64 years) and oldest (85 years or more) age group were invited to participate. Every second patient aged 65–74 years and every third patient aged 75–84 years were invited to participate. If a patient in the age groups 65–74 and 75–84 years denied participation, the reason for this was noted, and the next patient on the list was invited to participate.
A patient who fell ill on January 2003 was examined in January 2004 ± 1 month. Patients were invited first by a letter, and after a week, a phone call. In total, 163 patients were invited, and 140 patients (86%) of these accepted to participate. In the youngest age group, the main reasons for non-participation were lack of time and no perceived health problems whereas in the oldest age group, the main reason was general fatigue. Due to a relative high loss of non-participations in the youngest and oldest age groups, the inclusion period were extended four months (January–April 2004) for these groups.
If a patient did not manage to visit the hospital, a house call was offered. In total, 30 house calls were made, mainly to elderly patients. Figure 1 de-scribes the number of patients by age group at each step in creation of the study sample.

Fi
gure
2. N
umbe
r of p
atie
nts b
y ag
e gr
oups
at e
ach
step
in c
reat
ion
of th
e st
udy
sam
ple

46
Comparison between participants and non-participants Participants and non-participants did not differ with regard to age, gender, stroke type (ischaemic versus haemorrhagic), stroke severity according to the Reaction Level Scale (RLS-85) score, initial motor impairments or length of stay in hospital (Table 12). RLS-85 163, 164 is an ordinal coma scale used to indicate injury severity in Riks-stroke, where the results are strati�ed in three levels: RLS 1 (alert and oriented), RLS 2–3 (drowsy or confused to very drowsy or confused responding to strong stimuli) and RLS 4–8 (uncon-scious, only re�ex or no response to stimuli). The initial motor impairments were categorized according to maximal severity of paresis observed during the �rst 7 days after the stroke: no or minor paresis, moderate pare-sis/walking without assistance or severe paresis/ assisted walking or unable to walk.
Table 12. Stroke onset characteristics of participants and non-participants
Participants (N = 140)
Non-participants (N = 23)
Age, mean (SD), years 71 (13) 76 (15) Women, n (%) 67 (48) 11 (48) Stroke type
Ischaemic stroke, n (%) Haemorrhagic stroke, n (%)
124 (89) 16 (11)
20 (87) 3 (13)
Stroke severity RLS a 1 (alert and oriented, n, %) RLS 2-3 (drowsy or confused, n, %) RLS 4-8 (unconscious, %)
127 (91) 12 (8.6) 1 (0.7)
21 (91) 2 (8.7) 0 (0)
Motor impairment No or minor paresis, n (%) Moderate paresis/walking without assis-tance, n (%) Severe paresis/assisted walking
47 (34)
48 34) 45 (32)
9 (39)
9 (39) 5 (22)
Length of stay in hospital, median (min–max) 8 (1–70) 11 (1–82) a RLS. Reaction Level Scale. On all items, the difference between participants and non-participants was non-significant.
Methods and definitions Stroke severity was measured with the NIHSS Stroke severity was estimated with the National Institutes of Health Stroke Scale (NIHSS). NIHSS is an ordinal scale that assesses level of conscious-ness speech, language, cognition, inattention, visual field abnormalities, motor and sensory impairment, and ataxia. Confusingly, there have been different variants of the NIHSS during the years. The original NIHSS had 15 items 165, in 2003 a modified NIHSS were presented 166 with 11 items. At the

47
time I started the study, a 12-item scale with a maximum of 46 points were used. The 46-point scale included the hand. I have used the 46-point scale.
Currently, the whole of Sweden, and probably the rest of the world use an 11 item NIHSS, with a maximum point of 42 (not including the hand). For an exact description of the 46-point scale (Appendix).
The NIHSS is considered reliable and valid as well as quick and easy to use 165, 167, 168. Recognized limitations of the NIHSS include overestimation of left hemisphere stroke and underestimation of brainstem and cerebellar stroke 169.
Spasticity In spite of its limitation, the modified Ashworth scale (MAS) is established and we used it in our studies to enable comparisons with previous studies in the area. For more detailed description and discussion of the scale, see page 25.
For definition and assessment of disabling spasticity, I refer to page 30.
Study variables for cohort I Table 13 outlines the study variables for cohort I.
Table 13. The study variables for cohort I (Paper I, II and III)
Review of the inclusion and exclusion criteriaReview of the past medical history including medicationWritten and oral consent, by patient or next of kinStroke characteristics (ischemic/haemorragic, stroke side)Information from Riks-stroke (acute and 3-months)Basic information on living, social service etc (same questions as in Riks-stroke, 3 months) Modified Rankin Scale (mRS) Bartel’s Index National Institutes of Stroke Scale (NIHSS) Reflexes and Babinsi’s sign Modified Ashworth scale (MAS) Pain (VAS); location of pain; stroke-related vs. not stroke-related Depression (Montgomery-Åsberg Depression Scale, MADRS) Handedness (right, left, ambidexter)
48
Health economic parameters For Paper III we have followed a checklist developed by Evers et al. 148, to enable systematic comparison between cost of illness (COI) studies. Accord-ing to their checklist our study can be described in the following terms:
Perspective of analysis We had a broad health care sector perspective. We did not intend to estimate the economic costs for the individual.
Study type, design, estimation procedures, cost included, and unit of measurement The design was disease-specific, incidence-based, bottom-up, including di-rect costs. In a bottom-up analysis the costs are based on real costs. A group of patients with a specific disease is followed for a time period. Our patients were followed during one year after a first-ever stroke and all direct costs (both stroke and non-stroke related) were included. The Swedish currency (SEK) was converted into Purchasing Power Parities 170 (PPP) at the ex-change rate of 9.34 SEK for 1 PPP (2003 value) 171. PPP are exchange rates that measure the purchasing power of different national currencies. It is rec-ommended to convert local currencies into PPP 148 because this eliminates the variation in monetary levels between countries. A PPP equals the pur-chasing power of $1 in the US.
Included in the estimation of the direct costs
Costs for hospitalization The patient administrative system at Uppsala University Hospital enabled us to get access to specific costs for each patient related to hospitalization, e.g. costs for medical personnel, diagnostic investigations, medication and labo-ratory tests at all levels of care – intensive care, intermediate care, stroke unit, medical ward and inpatient rehabilitation. The different costs are shown in Table 3, Paper III. Costs in connection with re-admittances to hospital, occurring during the first year after the event, were also included in the analyses.
Costs after discharge Primary health care We scrutinized the medical records of the primary health care (both commu-nity and private care) for each patient after discharge from the hospital, and recorded all outpatient visits at general practitioners (GPs), district nurses,

49
physiotherapists, occupational therapists, dieticians, and speech therapists. The primary health care administration assisted in calculation total costs for each patient, based on the following tariffs: A physician’s consultation equals $164, and the price for other consultations or treatments is $48.
Medication All medications for each patient at one year after stroke were recorded, and costs were calculated assuming that the same medication was used during the whole period of one year. The specific costs for each medication were obtained from the national catalogue of registered medications in Sweden 2003, FASS 2003.
Municipality The economic department of the municipalities, both of the city of Uppsala and of neighbouring townships, assisted in providing the total costs for each patient in our cohort regarding home help service, residential and nursing home, adjustment of housing, transportation, food delivery and home alarm. For costs, see Table 3 in Paper III.
Statistics The text under the heading Statistics is based on three books 172-174, and I have chosen not to give the exact reference for every statement. Instead I try to explain why I have used a specific statistical method in my sample. The statistics has been discussed with a statistician before and after the study
First the different variables were characterized into either: categorial (qualitative) or numerical (quantitative). The categorial variables were fur-ther divided into nominal (categories are mutually exclusive and not orded, e.g. gender), and ordinal (categories are mutually exclusive and ordered, e.g. spasticity graded in the modified Ashworth Scale (MAS). Spasticity was dichotomized into spasticity (e.g. MAS � 1 in any of the investigated joints) versus no spasticity (e.g. MAS = 0). In addition, we also dichotomized the sample into disabling spasticity versus no disabling spasticity. Table 14 illus-trates some of the variables, their definitions, scale type and statistics used.

50
Table 14. Examples of variables, their definitions, scale types and statistics used for cohort I.
Variable Definition Scale type Statistics
Gender Male/female Nominal Chi-square
Spasticity MAS � 1 in any of the joints Ordinal Chi-squareAge group < 65 y, 65-74 y, 75-84 y, �85 y Ordinal Chi-squareAge Age at stroke onset Numeric Mann-Whitney U-test NIHSS score a See page 78 Numeric Mann-Whitney U-test
Direct costs Numeric Mann-Whitney U-test a Although NIHSS is an ordinal scale, it is treated as a numeric scale in the stroke literature.
Second, the numerical variables were explored for normal distribution. Age was skewed to the left, NIHSS score and direct costs were skewed to the right; hence we used median as an average measure, and inter-quartile range for spread. Square transformation of age (due to skewing to the left) did not accomplish normal distribution; neither did logarithmic transformation of the NIHSS score. However, logarithmic transformation of the direct cost did accomplish a fairly normal distribution (mean/median = 4.28; skewness = 0.045; kurtosis = -0.156).
Since all numerical variables were non-normally distributed we used no-parametric tests.
Identifying of outliers and extremes were done graphically with SPSS. The statistics were performed with SPSS version 13 for PC for Paper I,
and SPSS version 16 for Macintosh for Paper II–IV.
Comparing two unrelated groups – univariate analysis Third, we wanted to compare patients with and without spasticity; hence the sample was divided into those with spasticity, and those without spasticity. These two groups can be regarded as unrelated 1. The numeric variables were non-normally distributed; hence we used Mann-Whitney U-test for univariate analysis. For categorial data we used chi-square, and when ex-pected less than 5, Fisher’s exact test.
Fourth, the sample was divided into those with disabling versus non-disabling spasticity. The same statistics as for spasticity versus no spasticity was used.
Comparing more than two unrelated groups In addition, we compared the direct costs for different patient groups regard-ing mRS and MAS with the Kruskal-Wallis test in Paper III.
1 Sometimes terms like unpaired or independent are used, but all these terms describe the same thing – two unrelated groups are being compared.

51
Multiple logistic regression In Paper I we wanted to explore the influence of variables identified in the univariate analyses for disabling spasticity (DS). We wanted to which ex-planatory variable that predicted DS. In the model, the following variables were entered as independent variables: age (65 years or less versus > 65 years of age), stroke type (ischemic or haemorrhagic), and severe paresis of the arm (> 2 points on NIHSS item 5). The regression analysis was by use of backward elimination (likelihood ratio) in order to minimize effects of inter-action between explanatory variables. Odds ratio was given with 95% confi-dence interval.
Ethics Before entering the study, the patients received written and oral information. All participating patients gave informed consent (oral and written). In the case of language difficulties, next of kin gave the informed consent. The study was approved by the regional Human Ethics Committee (Ups. 03–595).

52
Methods for Paper IV
This Chapter gives some additional information of the methods used in Pa-per IV. For more detailed information, see Methods in Paper IV. Table 15 illustrates the key parameters for the study.
Study design Details of the study design and inclusion procedures are presented in Figure 3. It a cohort study. The patients were assessed three times: at baseline, at 1 month and at 6 months.
Figure 3. Consort flow diagram for the patient sample
Study population The study population was the same as for cohort I, see page 43.

53
Case ascertainment Patients were consecutively recruited from Uppsala University Hospital be-tween February 2005 and March 2008, with the last follow-up in September 2008. The medical history of the stroke patients was carefully reviewed to exclude prior stroke and any neurological disorder, which might affect mus-cle tone. No multiple overlapping methods were used.
In total, 50 patients were recruited, but 1 patient was excluded during the course of study because of a revised diagnosis of brain tumour instead of stroke, leaving 49 eligible patients.
All acute assessments and most of the follow-ups were done at the Upp-sala University Hospital. In total 144 investigations were performed of which 32 were home-visits. All patients were investigated by me. Patients with any spasticity (measured with the MAS) were also investigated by my supervisor, professor Jörgen Borg.
Inclusion and exclusion criteria Inclusion criteria were: (a) resident in the catchment area, (b) age between 18-84 years, (c) a �rst-ever stroke (cerebral infarction or intracerebral haem-orrhage), (d) any paresis in the face, arm, hand or leg, at stroke onset, and (e) ability to give informed consent.
Exclusion criteria were: (a) any other neurological disorder, which might affect muscle tone, (b) TIA and (c) subarachnoid haemorrhage.
All had received an acute CT scan examination.
Baseline assessment The baseline assessment was undertaken between 2 to 10 days after the first-ever stroke. The inclusion and exclusion criteria were reviewed to ensure that the participant was eligible. Participants underwent a clinical assessment and were asked to complete a battery of assessments, see Table 15.
Follow-up at 1 month and 6 months The patients were follow-up at two visits, at 1 month and at 6 months after the event.
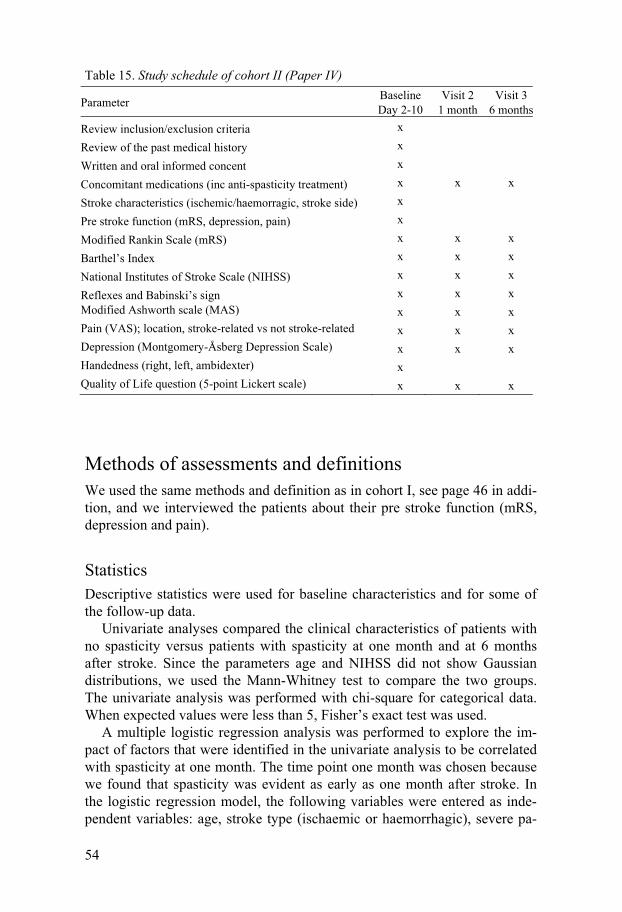
54
Table 15. Study schedule of cohort II (Paper IV)
Parameter BaselineDay 2-10
Visit 2 1 month
Visit 3 6 months
Review inclusion/exclusion criteria x
Review of the past medical history x
Written and oral informed concent x
Concomitant medications (inc anti-spasticity treatment) x x x
Stroke characteristics (ischemic/haemorragic, stroke side) x
Pre stroke function (mRS, depression, pain) x
Modified Rankin Scale (mRS) x x x
Barthel’s Index x x x
National Institutes of Stroke Scale (NIHSS) x x x
Reflexes and Babinski’s sign x x x Modified Ashworth scale (MAS) x x x Pain (VAS); location, stroke-related vs not stroke-related x x x Depression (Montgomery-Åsberg Depression Scale) x x x Handedness (right, left, ambidexter) x Quality of Life question (5-point Lickert scale) x x x
Methods of assessments and definitions We used the same methods and definition as in cohort I, see page 46 in addi-tion, and we interviewed the patients about their pre stroke function (mRS, depression and pain).
Statistics Descriptive statistics were used for baseline characteristics and for some of the follow-up data.
Univariate analyses compared the clinical characteristics of patients with no spasticity versus patients with spasticity at one month and at 6 months after stroke. Since the parameters age and NIHSS did not show Gaussian distributions, we used the Mann-Whitney test to compare the two groups. The univariate analysis was performed with chi-square for categorical data. When expected values were less than 5, Fisher’s exact test was used.
A multiple logistic regression analysis was performed to explore the im-pact of factors that were identified in the univariate analysis to be correlated with spasticity at one month. The time point one month was chosen because we found that spasticity was evident as early as one month after stroke. In the logistic regression model, the following variables were entered as inde-pendent variables: age, stroke type (ischaemic or haemorrhagic), severe pa-

55
resis of the arm and sensory disturbance. The regression analysis was made by use of backward elimination (Likelihood Ratio) to minimise effects of interaction between explanatory variables. Odds ratios are given with 95% confidence intervals.
Cochrane’s Q test was used to analyse whether the frequency of spasticity changed during the study period.
Statistics were performed by use of SPSS version 16.0 for Macintosh.
Ethics Before entering the study, the patients received written and oral information. All participating patients gave informed consent (oral and written). In the case of language difficulties, next of kin gave the informed consent. The study was approved by the regional Human Ethics Committee (Ups 2004: M–444).

56
Results for Paper I–II
This chapter reports only on the main results for Paper I–III. For more exten-sive results, I refer to the respective paper.
The results for the whole sample The mean age for the sample was 71 years. For distribution of the age, see Figure 4.
Figure 4. Age distribution of the sample.
The age distribution was skewed to the left and had a non-normal distribu-tion. Mean age (95% CI) was 71 years (69–73). Median age (inter-quartile range) was 73 year (18). The proportion of women was 48%. Moreover,

57
87% had had ischaemic strokes. In the acute phase, 91% were alert and ori-ented, i.e. Reaction of Level Scale 1.
One year post stroke the median National Institute of Stroke Scale (NIHSS) was 3 (range 0–21), see Figure 5.
Figure 5. NIHSS distribution 1 year after stroke for the whole sample.
Prevalence of spasticity The frequency of spasticity was 18% (25/140 patients) and the frequency of disabling was 6% (8/140 patients). The estimated prevalence of spasticity in the total study population, when the different weights of the age groups were considered, was 17% and the estimated prevalence of disabling spasticity was 4%.
Table 16 illustrate a univariate analysis of spasticity and disabling spastic-ity. I have compared patients with no spasticy versus patients with spasticity, and disabling spasticity, respectively.

58
Table 16. Comparison between patients with no spasticity versus patients with spasticity and disabling spasticity, respectively
No spasticity
(n=115)Spasticity
(n=25) Sign. a
Disabling spasticity
(n=8) Sign. a Age, mean (SD) 71.0 (13.4) 72.4 (12.1) Ns b 60.7 (11.4) P = 0.02 Women (%) 45.2 60.0 Ns b 50 Ns 1 Stroke type
Ischemic (%) 88.7 88.0 Ns b 62.5 P = 0.048 Haemorrhagic (%) 11.3 12.0 Ns b 37.5
Stroke side (lesion side) Right 53.9 60.0 Ns 2 25.0 Ns 2 Left 41.7 40.0 Ns 2 75.0 Ns 2 Bilateral 4.3 0 Ns 2 0 Ns 2
Discharged to home 88.7 36.0 P < 0.001 25.0 P < 0.001 Stroke severity 1 year post stroke
NIHSS, mean (SD) 1.1 (1.6) 9.3 (5.5) P < 0.001 11.6 (4.5) P < 0.001 Severe paresis in the arm c % 0 64.0 P < 0.001 62.5 P < 0.001
Disability 1 year post stroke mRS 0-2 (%) 52 8 P < 0.001 0 P < 0.009 mRS 3-5 (%) 48 92 100 BI 0-95 points (%) 51 96 P < 0.001 88 P < 0.005
a Sign. significance. b Ns Not statistically significant, P > 0.05. c Severe paresis in the arm, e.g. more than 2 points on item 5 on the NIHSS.
Multiple logistic regression for disabling spasticity Disabling spasticity (DS) was more common in patients under 65 years, with severe arm paresis and haemorragic stroke. Including these explanatory vari-ables in a multiple logistic regression analysis, stroke-type lost its signi�cance. Table 17 shows the multiple regression for DS.
Table 17. Multiple logistic regression. Factors associated with Disabling spasticity. The regression analysis was by use of backward elimination (likelihood ratio).
Dependent variable Independent variable Odds ratio 95% CI
Disabling spasticity Severe arm paresis 22 3.9–125 Age < 65 years 10 1.5–60
Spasticity in relation to other parameters Table 18 gives an overview of data on all patients with spasticity. Among the patients with disabling spasticity, 1 patient had only an Ashworth grad-ing of maximum 1+. In addition, 2 patients with the highest MAS, which is
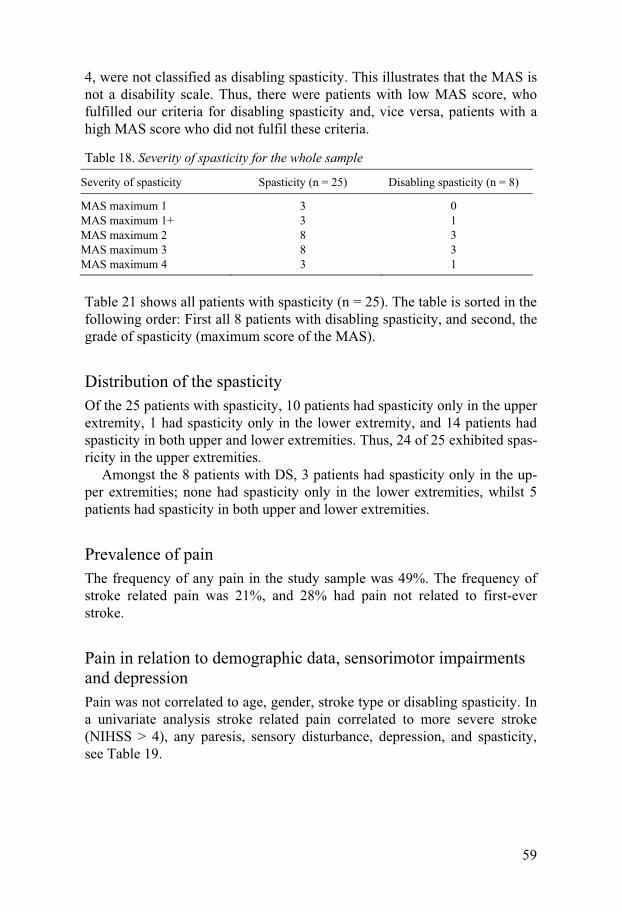
59
4, were not classified as disabling spasticity. This illustrates that the MAS is not a disability scale. Thus, there were patients with low MAS score, who fulfilled our criteria for disabling spasticity and, vice versa, patients with a high MAS score who did not fulfil these criteria.
Table 18. Severity of spasticity for the whole sample
Severity of spasticity Spasticity (n = 25) Disabling spasticity (n = 8)
MAS maximum 1 3 0MAS maximum 1+ 3 1MAS maximum 2 8 3MAS maximum 3 8 3MAS maximum 4 3 1
Table 21 shows all patients with spasticity (n = 25). The table is sorted in the following order: First all 8 patients with disabling spasticity, and second, the grade of spasticity (maximum score of the MAS).
Distribution of the spasticity Of the 25 patients with spasticity, 10 patients had spasticity only in the upper extremity, 1 had spasticity only in the lower extremity, and 14 patients had spasticity in both upper and lower extremities. Thus, 24 of 25 exhibited spas-ricity in the upper extremities.
Amongst the 8 patients with DS, 3 patients had spasticity only in the up-per extremities; none had spasticity only in the lower extremities, whilst 5 patients had spasticity in both upper and lower extremities.
Prevalence of pain The frequency of any pain in the study sample was 49%. The frequency of stroke related pain was 21%, and 28% had pain not related to first-ever stroke.
Pain in relation to demographic data, sensorimotor impairments and depression Pain was not correlated to age, gender, stroke type or disabling spasticity. In a univariate analysis stroke related pain correlated to more severe stroke (NIHSS > 4), any paresis, sensory disturbance, depression, and spasticity, see Table 19.
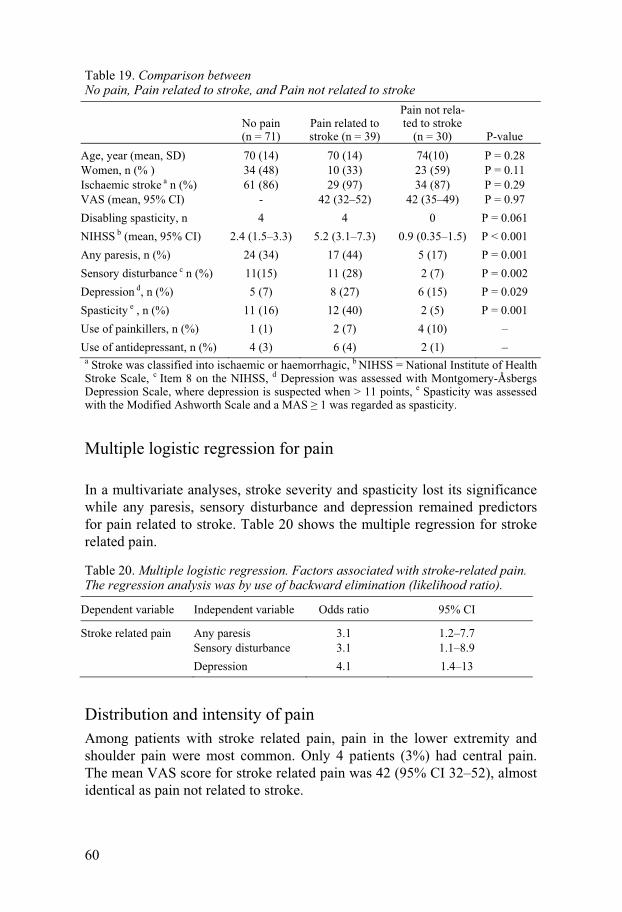
60
Table 19. Comparison between No pain, Pain related to stroke, and Pain not related to stroke
No pain (n = 71)
Pain related to stroke (n = 39)
Pain not rela-ted to stroke
(n = 30) P-value Age, year (mean, SD) 70 (14) 70 (14) 74(10) P = 0.28 Women, n (% ) 34 (48) 10 (33) 23 (59) P = 0.11 Ischaemic stroke a n (%) 61 (86) 29 (97) 34 (87) P = 0.29 VAS (mean, 95% CI) - 42 (32–52) 42 (35–49) P = 0.97 Disabling spasticity, n 4 4 0 P = 0.061 NIHSS b (mean, 95% CI) 2.4 (1.5–3.3) 5.2 (3.1–7.3) 0.9 (0.35–1.5) P < 0.001 Any paresis, n (%) 24 (34) 17 (44) 5 (17) P = 0.001 Sensory disturbance c n (%) 11(15) 11 (28) 2 (7) P = 0.002 Depression d, n (%) 5 (7) 8 (27) 6 (15) P = 0.029 Spasticity e , n (%) 11 (16) 12 (40) 2 (5) P = 0.001 Use of painkillers, n (%) 1 (1) 2 (7) 4 (10) – Use of antidepressant, n (%) 4 (3) 6 (4) 2 (1) –
a Stroke was classified into ischaemic or haemorrhagic, b NIHSS = National Institute of Health Stroke Scale, c Item 8 on the NIHSS, d Depression was assessed with Montgomery-Åsbergs Depression Scale, where depression is suspected when > 11 points, e Spasticity was assessed with the Modified Ashworth Scale and a MAS � 1 was regarded as spasticity.
Multiple logistic regression for pain
In a multivariate analyses, stroke severity and spasticity lost its significance while any paresis, sensory disturbance and depression remained predictors for pain related to stroke. Table 20 shows the multiple regression for stroke related pain.
Table 20. Multiple logistic regression. Factors associated with stroke-related pain. The regression analysis was by use of backward elimination (likelihood ratio).
Dependent variable Independent variable Odds ratio 95% CI
Stroke related pain Any paresis 3.1 1.2–7.7 Sensory disturbance 3.1 1.1–8.9 Depression 4.1 1.4–13
Distribution and intensity of pain Among patients with stroke related pain, pain in the lower extremity and shoulder pain were most common. Only 4 patients (3%) had central pain. The mean VAS score for stroke related pain was 42 (95% CI 32–52), almost identical as pain not related to stroke.

61
Figure 6. Comparison between Pain related to stroke versus Pain not related to stroke.

Tabl
e 21
. An
over
view
of s
tudy
dat
a fr
om c
ohor
t I o
f all
patie
nts w
ith sp
astic
ity (n
=25
)
Age
(yea
r)
Gen
der a
Stro
ke ty
pe
Dis
ablin
g sp
astic
ity
Max
MA
S sc
ore
NIH
SS
mR
S B
arth
el In
dex
VA
S D
irect
cos
ts b
Patie
nt #
c
75
F Is
chae
mic
Y
es
4 14
4
45
0 11
5 57
1 54
59
M
Is
chae
mic
Y
es
312
480
14
248
542
120
80
M
Isch
aem
ic
Yes
3
124
35
010
1 56
589
46
F Is
chae
mic
Y
es
37
210
0 23
55 9
1113
862
M
Is
chae
mic
Y
es
215
480
25
230
030
6054
M
H
aem
orrh
agic
Y
es
23
380
45
110
961
125
56
F H
aem
orrh
agic
Y
es
217
370
0
45 3
8240
54
F H
aem
orrh
agic
Y
es
1+13
285
0
380
521
7364
F
Isch
aem
ic
No
411
450
15
120
529
127
73
M
Isch
aem
ic
No
49
340
40
87 2
6068
72
M
Isch
aem
ic
No
310
530
20
114
443
111
81
F Is
chae
mic
N
o 3
65
35
011
7 60
898
70
F Is
chae
mic
N
o 3
14
50
6880
563
473
M
Is
chae
mic
N
o 3
143
25
072
655
3881
F
Isch
aem
ic
No
39
380
55
103
653
1185
F
Isch
aem
ic
No
212
440
50
64 7
2569
63
F Is
chae
mic
N
o 2
104
80
062
0647
74
M
Isch
aem
ic
No
22
295
0
1419
876
83
M
Isch
aem
ic
No
22
285
17
78 5
1544
86
F Is
chae
mic
N
o 2
01
90
028
331
2387
F
Isch
aem
ic
No
1+9
340
0
40 4
3428
89
M
Isch
aem
ic
No
1+11
335
70
6778
117
86
F Is
chae
mic
N
o 1
215
15
5032
426
136
73
F Is
chae
mic
N
o 1
123
40
7210
0 06
016
82
F Is
chae
mic
N
o 1
0 0
95
0 10
4 53
6 14
a G
ende
r F =
fem
ale,
M =
Man
, b Cos
ts in
PPP
$, c P
atie
nt in
tern
al n
umbe
r in
the
coho
rt.

63
Conclusions and future reseach
In this Chapter I will summarize the conclusions of my thesis. I will discuss the strengths and weaknesses of my thesis. Finally, I will outline future re-search.
Methods for the two cohorts Cohort I – strengths and weaknesses The first cohort is a cross-sectional survey. A cross-sectional survey is ob-servational and can be used to estimate point prevalence and to explore asso-ciations between variables and an outcome. A cross-sectional study gives a picture of the frequency of a disease at a specific moment. However, impor-tantly, a cross-sectional study does not prove that an investigated variable causes the outcome. The advantages with this type of study, are that it is relatively simple and cheap to perform.
Paper I–III are based on 140 first-ever stoke investigated 1 year after their stroke. The sample was selected from Riks-Stroke. At Uppsala University Hospital we have two dedicated nurses that scrutinize all hospital patients to identify possible stroke. Our own quality work (data not published) has shown a wrong diagnosis in the discharge registry of 10%. When registered in the Riks-Stroke, every stroke diagnosis is scrutinized, and patients with wrong diagnosis are not entered in the Riks-stroke. However, it is a hospital based registry, and we did not use all of the techniques for case ascertain-ment described by Malmgren et al. 175 and Sudlow et al. 176.
First, the sample was not collected prospectively. It was a cross sectional survey of stroke patients surviving one year. Consequently we have no base line assessments of spasticity. Moreover, between the first-ever stroke and the follow-up one year later 22% of the patients had died.
Second, we did not use a complete community-based case ascertainment, based on multiple overlapping sources. The reason for not doing a prospec-tive and a complete community-based case ascertainment was lack of re-sources. I had some valuable help from the stroke co-ordinators and the sec-retary for the rehabilitation medicine, but most of the work I had to do my-self. It is considerable work to organize 140 investigation (cohort I) and

64
three follow-ups for 49 patients (cohort II). To look for stroke cases outside the hospital was not a realistic option.
Although we did not use all of the techniques described by Malmgren 175 and Sudow 176, the study used the WHO criteria for stroke; it was first-ever strokes only, it was a fairly large, well-defined, stable and representative population. In addition, stroke was presented as ischaemic or haemorrhagic, and CT of the brain was done on all patients.
Finally, when we did a dropout analysis, there was no significant differ-ence between participants and non-participants.
In short, the sample was representative although it did not fulfil all criteria for a perfect epidemiological study.
Cohort II – strengths and weaknesses Paper IV is a cohort study. A cohort study is observational; an investigator does nothing to affect the outcome, but simply observes what happens. Co-hort studies are useful for prognosis and natural history as well as aetiology. If a cross-sectional study is like a picture, a cohort study is more like a film. Although the most convincing evidence comes from randomized controlled studies, information from observational studies can be used provided that they meet a number of criteria. The most cited criteria for assessing causality were proposed by Hill as early as 1965 177:
• The cause must precede the effect • The association should be plausible • There should be consistent results from a number of studies • The association between the cause and the effect should be strong • There should be a dose-response relationship with the effect • Removing of the factor of interest should reduce the risk of the dis-
ease.
Patients in cohort II were recruited consecutively from the stroke unit at Uppsala University Hospital. Two additional inclusion criteria were added; the patient had to have an initial paresis (in the face or arm or leg), and there was an upper age limit (84 years); and as a consequence of that, the inci-dence figures are not representative for an unselected population. However, the reason for the paresis criterion was that we wanted to have more patients with spasticity in order to test some predictors for spasticity. In addition, when including patients consecutively, there is always a selection bias.
Measuring spasticity with the modified Ashworth scale (MAS) – what is the catch? The most common scale for measuring spasticity is the modified Ashworth scale (MAS) 74, 77 which is considered reliable 74, 75, 178. Recognized limita-
65
tions of the scale include that it captures only one feature of spasticity, i.e. resistance to passive movement, and that it does not differentiate the effects of re�ex hyperexcitability from those of biomechanical factors 76, 77.
Platz et al. 78 have suggested a summary rating scale for resistance to pas-sive movement (REPAS): in fact REPAS is a standardized MAS. At the time we started our studies REPAS was not available.
We used the MAS because it is the most widely used scale and to enable comparison with previous studies.
The definition of Disabling spasticity One may criticize our definition of disabling spasticity (DS) as being vague and arbitrary, but for complex phenomena such as disability there is no singe scale that can capture all aspects. Moreover, there is no uniform and valid assessment instrument for activity related manifestations of spasticity such as dystonic posturing, arm flexion or crawling toes during gait.
Spastity as such, is not altogether a bad thing. Some patients use their spasticity as a crutch, and treating it may be doing someone a disservice. Thus, the analysis must be individualized and consider all aspects of disabil-ity, which is common practice in rehabilitation medicine 179.
Recently, formalized goal setting and use of goal attainment scaling (GAS) has been introduced in this field 92, 180-185.
In contrast to Barthel Index (BI) and modified Rankin Scale (mRS), both of which consist of predefined items, GAS identifies individual goals. For example, patients with spasticity after a stroke might want to decrease the spasticity in order to improve mobility or to reduce pain. GAS can be used in clinical practice and create realistic expectations for the patients. The disad-vantage with GAS, on the other hand, is that you the goal is measured with “an elastic band” 181. Because of that, many authors suggest that one should use the GAS and standardized methods side by side.
Results Disabling spasticity This thesis is the first to report on DS after first-ever stroke. The prevalence of DS is low (4%) but corresponds to a large number of patients because stroke is so common. If 4% of first-ever stroke in Sweden have DS, this means that 800 new patients each year deserve further attention with regard to prevention and treatment. The prevalence of DS is even higher; if a stroke patient is assumed to survives 5 years, it would be 4000 patient patients with DS in Sweden at the moment.

66
Treatment policies have changed towards increasing use of intramuscular Botulinum toxin 9, which is currently considered as the treatment option for limb spasticity with the strongest evidence basis 186-188. However, treatment with Botulinum toxin is expensive, and to estimate the cost for treatment it is important to know the magnitude of the problem.
Severe upper extremity paresis one year after stroke was associated with a 22 times higher risk for DS (OR 22, 95% CI 3.9–125). This finding is patho-physiologically reasonable – because voluntary and reflex motor networks are anatomically and functionally related.
Age below 65 years increased the odds for DS with a factor of ten (OR 9.5, 95% CI 1.5–60). Although efforts for reducing non-participation in the older ages, selection bias cannot be ruled out.
The confidence interval for the odds ratio was wide, so the association be-tween DS and severe paresis in the arm and younger age, must be interpre-tated cautiously. Furthermore, since the survey is cross-sectional we can just claim that the findings are an association. Our studies cannot explain why DS was more common in the younger population.
Pain and spasticity This thesis is the first to study the association between pain and spasticity and first-ever stroke. Pain is believed to be a common problem after spastic-ity. Stroke-related pain was significantly higher among patients with spastic-ity (41%) compared to patients without spasticity (5%), however, when ana-lysing the significant parameters in a multiple logistic regression, spasticity lost its significance. How can we explain the somewhat surprising result? As pointed out in an editorial by Sheean 189 the spasticity in our cohort might have been too mild to cause spasticity. Another reason could be that we clas-sified the stroke-related and not stroke-related pain wrong.
Our results indicate that motor and sensory impairment were associated with a 3–4 fold risk for developing stroke related pain. Both sensory, and motor impairment might increase the risk for abnormal musculo-skeletal loading, which might lead to strain injuries and pain.
Spasticity and direct costs This thesis is the first to report the direct costs related to spasticity after stroke. Direct costs for stroke patients with spasticity are four times higher than the costs for non-spasticity stroke patients. The costs for stroke are huge as is the variation of costs in stroke between and within countries 190. Reli-able estimates of the costs are crucial for allocation of resources, and it is likely that specific estimations have to be made for different countries and regularly updated. Since the study was done before botulinum toxin was introduced in Sweden for spasticity after stroke (no patient was excluded due

67
to prior use of botulinum toxin), our estimate can be regarded as a base line for the costs in Sweden around 2004.
The rehabilitation gap in the primary care This thesis illustrates a rehabilitation gap. After discharge from the hospital care only 4% met a physiotherapist, 2% an occupational therapist, and 1% visit a dietician. In addition, no (0%) visits were made to a speech therapist. These figures are surprisingly low. It must be added, though, that patients had full access to the rehabilitation team during their hospital-based period.
The temporal course of spasticity This thesis adds some new knowledge about the temporal course of spastic-ity after first-ever stroke (Table 22). Moreover, some of my data show di-vergent results in comparison with prior studies.
Table 22. The temporal course of spasticity.
Time after stroke Percent spasticity Year (published) Country First author
Acute 21% 2004 Sweden Sommerfeld 7 Acute 4% 2009 a Sweden Lundström
1 month 27% 2009 a Sweden Lundström 3 months 19% 2004 Sweden Sommerfeld 7 6 months 23% 2009 a Sweden Lundström
12 months 39% 2002 UK Watkins 6 12 months 17% 2008 Sweden Lundström 191 18 months 20% 2006 Sweden Welmer 8
a Data from Paper IV in this thesis.
Differences in the prevalence of spasticity in the acute phase and at 12 months after first-ever stroke Sommerfeld 7 et al. reported 21% spasticity in the acute phase, more than 5 time higher than in my cohort. The reason for this difference in unclear for me; we used the same definitions for spasticity. The timing of the measure-ment is almost identical, but also minor differences in this respect might play a role. The clinical settings are slight different; Sommerfeld recruited their patients from a geriatric ward wheras I recruited from Riks-stroke. However, this small difference can scarcely explain a 5-fold variation in spasticity. In addition, the occurrence of spasticity is around 20% after 3 and 18 months 7,
8 in the same cohort from Sommerfeld in line with my findings at 12 moths. Watkins et al. 6 on the other hand has a higher prevalence 12 months post
stroke – 39% – compared to our prevalence, 17%. This discrepancy is somewhat easier to explain. Watkins has a high mortality, 50% in one year,
68
probably reflecting a more severe stroke population. The hospitalization rate is generally lower in UK than in Sweden, see Table 9 page 35, probably leading to a selection bias towards more severe stroke in the UK study.
Future research Finally, what about the future research in the field of spasticity after first-ever stroke? This last part outlines some questions and areas of interest:
Clinical measurements and pathophysiology • How can the different components in the UMN syndromebe quantified? • What is the relation between these components and voluntary motor con-
trol? • Studies of the neurobiological basis of spasticity with modern imaging
and neurophysiological methods.
Prevention and treatment • Can early treatment prevent the development of disabling spasticity? • Can a combination of intensive physiotherapy and focal, pharmacological treatment reduce spasticity and improve function for patients with severe paresis in the chronic phase.
Subarachnoid haemorrhage and traumatic brain injury • What is the incidence and prevalence of spasticity after subarachnoidal
haemorrhage and traumatic brain injury?

69
Acknowledgements
John Donne said: No man is an island 2. I do not know whether Donne wrote a thesis, but his words from the 17th century certainly holds true for me. No PhD-student prospers in isolation. I appreciate all the help I had throughout the years, and acknowledge the following persons: • Professor Jörgen Borg, my supervisor, for introducing me into the world
of rehabilitation medicine, always interesting in discussion of a manu-script.
• Professor Andreas Terént, my co-supervisor, who originally got me into stroke medicine. For encourage me and always available for questions.
• Associate professor Anja Smits, my co-supervisor, for all support and unceasingly improving my manuscripts.
• Professor emeritus Sten-Magnus Aquilonius, who introduced me to neu-rology and neuroscience, and for helping me in moments of despair.
• All colleagues at the department of neurology and the stroke unit at Upp-sala University Hospital.
• Secretary Gun Schönnings, probably one of the kindest persons I have ever met.
• Secretary Lotta Sjölander, for all help and support. • Lisa Johnsson and Ulla-Britt Söderström, both stroke co-ordinators,
providing me essential help for recruiting Riks-stroke patients. • Harry Smits and Steve Scott-Robson for proofreading of my manu-
script. • All patients in my studies. There will be nothing without you. • My parents, Ingegerd and Bo, for support throughout my life. • My wife, Carin, and our children Ludvig, Gustav and Edvard for mak-
ing my life worthwhile living. Love and respect. • Finally, I will also acknowledge Uppsala University, Selander’s founda-
tion and Stroke riksförbundet for financial support.
No man is an island, entire of itself...any man's death diminishes me, because I am involved in mankind; and therefore never send to know for whom the bell tolls; it tolls for thee.
2 John Donne (1572-1631); Devotions Upon Emergent Occasions and Seuerall Steps in My Sicknes - Meditation XVII, published 1624.

70
Knuten näve och släpande fot. Populärvetenskaplig sammanfattning på svenska
Jag har nu ägnat nästan sex år av mitt liv för att studera spasticitet efter stroke. Jag har läst ett otal artiklar, undersökt flera hundra patienter och mödosamt, bit för bit, skrivit en avhandling. Varför? Detta är mina skäl. • Stroke är en vanlig sjukdom. Globalt är det den näst vanligaste dödsor-
saken. Varje år dör 5,5 miljoner människor varav två tredjedelar av döds-fallen inträffar i utvecklingsländerna. Studier visar att stroke ökar i dessa länder. I Västvärlden är situationen bättre. Stroke minskar men orsakar fortfarande var tredje dödsfall. I Sverige insjuknas 30 000 individer årli-gen varav 20 000 för första gången.
• Kostnaderna för stroke är mycket hög. Den överstiger utgifterna för vård av hjärtsjukdomar. Var tionde sjukhusbädd i Sverige upptas av en strokepatient.
• Spasticitet anges som en vanlig komplikation efter stroke, men förekom-sten av funktionshindrande spasticitet har aldrig studerats. En del drabbas extra hårt, handen är så svårt knuten att den inte går att räta ut och na-glarna växer in i handflatan och leder till smärtsamma sår. Idag är det möjligt att behandla spasticitet med avancerade metoder. Problemet med dessa metoder är att de är dyra och frågan är om det är ekonomiskt förs-varbart. För att kunna svara på denna fråga måste man veta kostnaden för obehandlad spasticitet.
Jag har studerat två grupper av strokepatienter. Den första gruppen bestod av 140 individer som jag undersökta ett år efter deras förstagångsstroke. Den andra gruppen, 49 personer, undersökte jag vid tre tillfällen; akut, efter en månad och efter sex månader.
Här redovisar jag mina fem viktigaste slutsatser och skissar på framtida forskningsfält.
Inom ett år utvecklar en femtedel spasticitet Min undersökning visade att 17 % av patienterna utvecklar spasticitet inom ett år. Denna siffra överensstämmer med andra undersökningar från Sverige. Sommerfeld och medarbeterare rapporterade 19 % spasticitet efter 3 må-

71
nader och 20 % efter 18 månader. I Storbritannien fann man en betydligt högre frekvens av spasticitet – 39 % efter ett år. Den troliga orsaken till den högre siffran är att vårdtraditionerna skiljer sig mellan Sverige och Storbri-tannien. I Sverige så vårdas cirka 95 % av strokepatienterna på sjukhus. Motsvarande siffra för Storbritannien är cirka 55 %. Sannolikt innebär det att de som vårdas på sjukhus i Storbritannien har en allvarligare stroke jämfört med i Sverige.
Table 23. Faktaruta om spasticitet
Vad är spasticitet och hur mäter man det?
• Patienten måste vara avslappnad. Spasticiteten är ett motstånd som man kän-ner när man böjer och sträcker i leden. Spasticitet är hastighetsberoende. Högre hastighet leder till kraftigare motstånd.
• Vanliga sjukdomar som leder till spasticitet är: Multipel skleros, traumatisk hjärnskada, traumatisk skada av ryggmärgen, cerebral pares och stroke.
• Den vanligaste metoden för att mäta spasticitet är den modifierade Ash-worthskalan, som förkortas MAS. Med den skalan graderar man motståndet man känner när man böjer och sträcker i leden. MAS = 0 är det normala, MAS = 4 betyder mycket kraftigt motstånd, knappt att man orkar böja i le-den.
• Det finns flera problem med skalan: den är inte standardiserad (ska patienten undersökas i stående, sittande eller liggande), det finns inga regler för hur snabbt ska man böja och sträcka över leden och man har dessutom inte angi-vit vilka leder som ska ingå vid undersökningen. Skalan kan heller inte skilja mellan den s.k. neurogena komponenten (den del som beror på nervskada) i spasticiteten och den del som beror på förändringar i muskler och senor.
• Spasticitet definierade vi som � 1 på MAS. Det innebär en spasticitet som är lika med eller större än då man känner ett litet hugg av rörelsemotstånd.
• Funktionshindrande spasticitet definierade vi som en spasticitet som påver-kade den dagliga aktiviteten så att det krävdes intensiv sjukgymnastisk be-handling, ortoser (skenor) eller behandling med mediciner, t.ex. botulinum-toxin direkt in i muskeln.
Spasticiteten uppträder inom en månad. Funktionshindrande spasticitet tar längre tid att utveckla. Min avhandling visar att spasticiteten uppträder inom en månad. Det är en viktig kunskap eftersom man redan efter en månad kan se vilka som drabbas. Funktionshindrande spasticitet uppträder senare, inom sex månader.
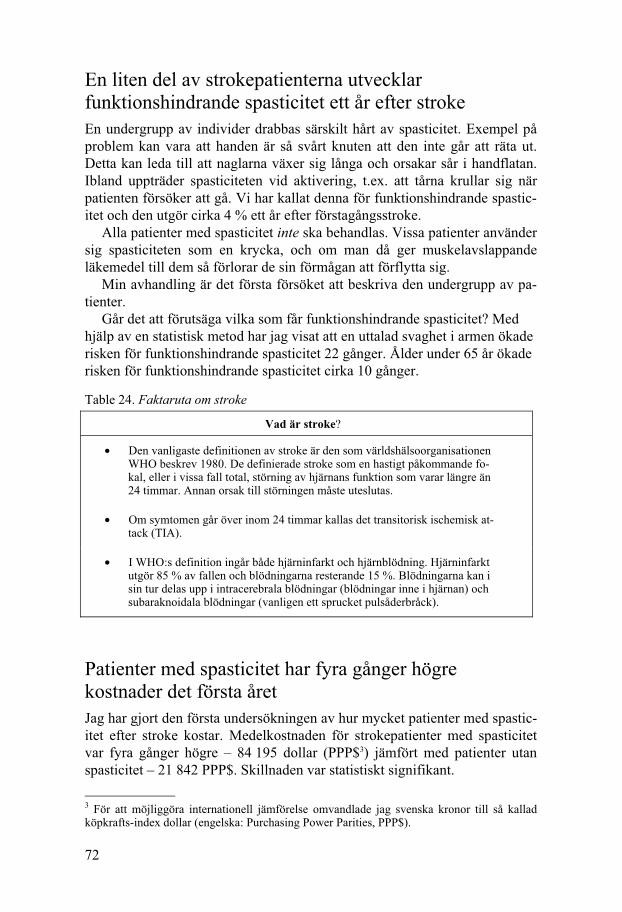
72
En liten del av strokepatienterna utvecklar funktionshindrande spasticitet ett år efter stroke En undergrupp av individer drabbas särskilt hårt av spasticitet. Exempel på problem kan vara att handen är så svårt knuten att den inte går att räta ut. Detta kan leda till att naglarna växer sig långa och orsakar sår i handflatan. Ibland uppträder spasticiteten vid aktivering, t.ex. att tårna krullar sig när patienten försöker att gå. Vi har kallat denna för funktionshindrande spastic-itet och den utgör cirka 4 % ett år efter förstagångsstroke.
Alla patienter med spasticitet inte ska behandlas. Vissa patienter använder sig spasticiteten som en krycka, och om man då ger muskelavslappande läkemedel till dem så förlorar de sin förmågan att förflytta sig.
Min avhandling är det första försöket att beskriva den undergrupp av pa-tienter.
Går det att förutsäga vilka som får funktionshindrande spasticitet? Med hjälp av en statistisk metod har jag visat att en uttalad svaghet i armen ökade risken för funktionshindrande spasticitet 22 gånger. Ålder under 65 år ökade risken för funktionshindrande spasticitet cirka 10 gånger.
Table 24. Faktaruta om stroke
Vad är stroke?
• Den vanligaste definitionen av stroke är den som världshälsoorganisationen WHO beskrev 1980. De definierade stroke som en hastigt påkommande fo-kal, eller i vissa fall total, störning av hjärnans funktion som varar längre än 24 timmar. Annan orsak till störningen måste uteslutas.
• Om symtomen går över inom 24 timmar kallas det transitorisk ischemisk at-tack (TIA).
• I WHO:s definition ingår både hjärninfarkt och hjärnblödning. Hjärninfarkt utgör 85 % av fallen och blödningarna resterande 15 %. Blödningarna kan i sin tur delas upp i intracerebrala blödningar (blödningar inne i hjärnan) och subaraknoidala blödningar (vanligen ett sprucket pulsåderbråck).
Patienter med spasticitet har fyra gånger högre kostnader det första året Jag har gjort den första undersökningen av hur mycket patienter med spastic-itet efter stroke kostar. Medelkostnaden för strokepatienter med spasticitet var fyra gånger högre – 84 195 dollar (PPP$3) jämfört med patienter utan spasticitet – 21 842 PPP$. Skillnaden var statistiskt signifikant.
3 För att möjliggöra internationell jämförelse omvandlade jag svenska kronor till så kallad köpkrafts-index dollar (engelska: Purchasing Power Parities, PPP$).

73
Är 84 195 PPP$ en hög kostnad? Det är mycket svårt att jämföra kost-nader för stroke mellan olika länder. I en översiktsartikel fann man att ut-gifterna för strokevård i USA varierade med en faktor på 20. Skillnaden beror på många saker: olika beräkningsmetoder, varierande lönekostnader och tidsperiod. I min beräkning ingick de s.k. direkta kostnaderna dvs. jag inkluderade all sjukvård, den kommunala kostnaden (ombyggnad av bostad, kommunal sjukvård och rehabilitering), läkemedel, primärvårdskostnaden och färdtjänst. Styrkan med min undersökning är att den bygger på verkliga kostnader, det är en underifrån-uppåt-analys. Nackdelen är att jag inte tagit med kostnaden för sjukskrivning.
Om besvären är betydande kan man prova olika läkemedel som gör att musklerna slappnar av. Det finns olika former av läkemedel: tabletter, injek-tioner i muskeln och i utvalda fall kan man ge medicinen direkt i ryggmärg-skanalen. Problemet med tablettbehandlingen är att den ofta ger biverkningar i form av trötthet och yrsel. Behandlingen med injektioner i muskler eller ryggmärgskanalen är effektiv men dyr. Resultatet av min forskning kan an-vändas som ett utgångsvärde för hälsoekonomiska beräkningar Det har tidi-gare inte funnits några uppgifter om vad spasticitet kostar. Och även om kostnaden för läkemedel är hög så är det mycket möjligt att även den avancerade behandlingen med sprutor i musklerna och ryggmärgskanalen lönar sig.
Smärta är vanligt efter en stroke men spasticitet ger ingen oberoende riskökning för stroke-relaterad smärta I litteraturen förekommer det ofta uppgifter om att det är vanligt med smärta och spasticitet. Min avhandling är den första som undersöker sambandet mellan smärta och spasticitet efter förstagångsstroke. Visserligen var stroke-relaterad smärta betydligt vanligare hos patienter med spasticitet (41 %) jämfört med patienter utan spasticitet (4 %), men när jag undersökte sam-bandet med en statistisk metod så gav spasticitet ingen oberoende riskökning för smärta. Ett skäl kan vara att spasticitet och nedsatt kraft är starkt sam-manvävda och att nedsatt kraft fick starkare genomslag i analysen. En annan förklaring kan vara att spasticiteten var för lindrig för att orsaka smärta. Yt-terligare en möjlighet är att jag har klassificerat stroke-relaterad smärta fe-laktigt. Meningen med att klassificera smärta som antingen stroke-relaterad eller inte stroke-relaterad var att inte skylla all smärta på en stroke. I de flesta fall var det inte svårt. Patienten sade: ”Ont i ryggen, det har jag alltid haft.” Ibland var det dock svårt att avgöra och i de fall jag var tveksam, så klassifi-cerade jag det som stroke-relaterad. Till sist, förklaringen till smärtan kanske låg i felaktig belastning av kroppen och störd känsel. Min statistiska analys
74
visade nämligen att känselnedsättning och nedsatt kraft vardera gav en tre till fyra gånger riskökning för stroke-relaterad smärta.
Förslag på framtida forskning inom fältet. Hur ser då framtiden ut inom spasticitetsforskningen? Jag avslutar denna populärvetenskapliga sammanfattning med att skissa på några frågor och fält för framtida forskning inom tre huvudområden: Kliniska mätmetoder och sjukdomsutveckling, förebyggande behandling, och andra skadegrupper.
Kliniska mätmetoder • Hur kan man förbättra kvantifiering av spasticitet och andra reflex-
störningar? • Vilken är relationen mellan dessa och viljemässig kontroll? • Studier av spasticitetens bakomliggande mekanismer med an-
vändning av moderna avbildnings- och neurofysiologiska metoder.
Förebyggande och behandla • Kan tidig behandling förhindra utveckling av funktionshindrande
spasticitet? • Kan kombinationen av intensiv, målinriktad funktionsträning och
lokal, farmakologisk behandling minska spasticitet och förbättra funktion i den kroniska fasen?
Andra skadegrupper • Hur många utvecklar funktionshindrande spasticitet av patienter
med traumatisk hjärnskada respektive subaraknoidala blödningar?
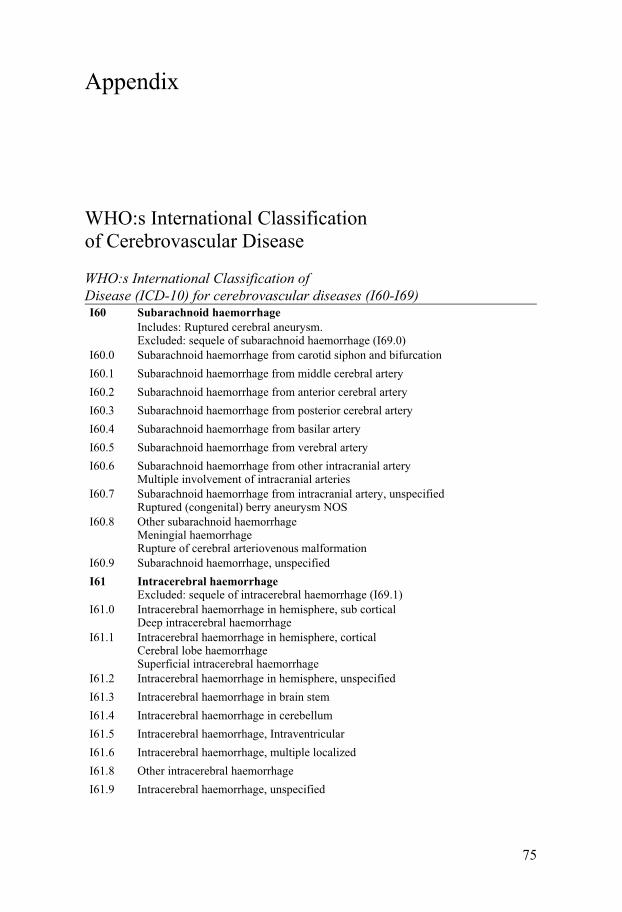
75
Appendix
WHO:s International Classification of Cerebrovascular Disease
WHO:s International Classification of Disease (ICD-10) for cerebrovascular diseases (I60-I69) I60 Subarachnoid haemorrhage
Includes: Ruptured cerebral aneurysm. Excluded: sequele of subarachnoid haemorrhage (I69.0)
I60.0 Subarachnoid haemorrhage from carotid siphon and bifurcation I60.1 Subarachnoid haemorrhage from middle cerebral artery I60.2 Subarachnoid haemorrhage from anterior cerebral artery I60.3 Subarachnoid haemorrhage from posterior cerebral artery I60.4 Subarachnoid haemorrhage from basilar artery I60.5 Subarachnoid haemorrhage from verebral artery I60.6 Subarachnoid haemorrhage from other intracranial artery
Multiple involvement of intracranial arteriesI60.7 Subarachnoid haemorrhage from intracranial artery, unspecified
Ruptured (congenital) berry aneurysm NOSI60.8 Other subarachnoid haemorrhage
Meningial haemorrhage Rupture of cerebral arteriovenous malformation
I60.9 Subarachnoid haemorrhage, unspecified I61 Intracerebral haemorrhage
Excluded: sequele of intracerebral haemorrhage (I69.1)I61.0 Intracerebral haemorrhage in hemisphere, sub cortical
Deep intracerebral haemorrhageI61.1 Intracerebral haemorrhage in hemisphere, cortical
Cerebral lobe haemorrhage Superficial intracerebral haemorrhage
I61.2 Intracerebral haemorrhage in hemisphere, unspecified I61.3 Intracerebral haemorrhage in brain stem I61.4 Intracerebral haemorrhage in cerebellum I61.5 Intracerebral haemorrhage, Intraventricular I61.6 Intracerebral haemorrhage, multiple localized I61.8 Other intracerebral haemorrhage I61.9 Intracerebral haemorrhage, unspecified

76
WHO:s International Classification… Continued I62 Other no traumatic intracranial haemorrhage
Excluded: sequele of intracranial haemorrhage (I69.2) I62.0 Subdural haemorrhage (acute) (nontraumatic) I62.1 Nontraumatic extradural haemorrhage I62.9 Intracranial haemorrhage (nontraumatic), unspecified I63 Cerebral infarction
Included: occlusion and stenosis of cerebral and precerebral arteries, resulting in cerebral infarction Excluded: sequele of cerebral infarction (I69.3)
I63.0 Cerebral infarction due to thrombosis of precerebral arteries I63.1 Cerebral infarction due to embolism of precerebral arteries I63.2 Cerebral infarction due to unspecified occlusion or stenosis of precerebral arteries I63.3 Cerebral infarction due to thrombosis of cerebral arteries I63.4 Cerebral infarction due to embolism of cerebral arteries I63.5 Cerebral infarction due to unspecified occlusion or stenosis of cerebral arteries I63.6 Cerebral infarction due to cerebral venous thrombosis, nonpyogenic I63.8 Other cerebral infarction I63.9 Cerebral infarction, unspecified I64 Stroke, not specified as haemorrhage or infarction
Excludes: sequele of stroke (I69.4)I65 Occlusion and stenosis of precerebral arteries, not resulting in cerebral in-
farct Includes: embolism, narrowing, obstruction (complete or partial), thrombosis Excludes: when causing cerebral infarction (I63.-)
I65.0 Occlusion and stenosis of vertebral artery I65.1 Occlusion and stenosis of basilar artery I65.2 Occlusion and stenosis of carotid artery I65.3 Occlusion and stenosis of multiple and bilateral precerebral arteries I65.8 Occlusion and stenosis of other precerebral artery I65.9 Occlusion and stenosis of unspecified precerebral artery I66 Occlusion and stenosis of cerebral arteries, not resulting in cerebral infarct
Includes: embolism, narrowing, obstruction (complete or partial), thrombosis Excludes: when causing cerebral infarction (I63.-)
I66.0 Occlusion and stenosis of middle cerebral artery I66.1 Occlusion and stenosis of anterior cerebral artery I66.2 Occlusion and stenosis of posterior cerebral artery I66.3 Occlusion and stenosis of cerebellar arteries I66.4 Occlusion and stenosis of multiple and bilateral cerebral arteries I66.8 Occlusion and stenosis of other cerebral artery I66.9 Occlusion and stenosis of unspecified cerebral artery
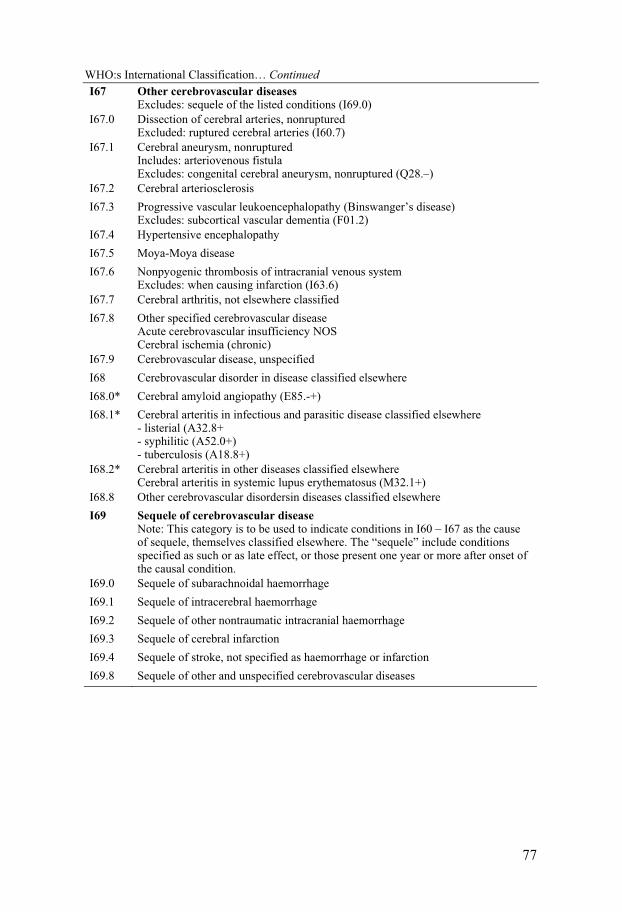
77
WHO:s International Classification… Continued I67 Other cerebrovascular diseases
Excludes: sequele of the listed conditions (I69.0)I67.0 Dissection of cerebral arteries, nonruptured
Excluded: ruptured cerebral arteries (I60.7)I67.1 Cerebral aneurysm, nonruptured
Includes: arteriovenous fistula Excludes: congenital cerebral aneurysm, nonruptured (Q28.–)
I67.2 Cerebral arteriosclerosis I67.3 Progressive vascular leukoencephalopathy (Binswanger’s disease)
Excludes: subcortical vascular dementia (F01.2)I67.4 Hypertensive encephalopathy I67.5 Moya-Moya disease I67.6 Nonpyogenic thrombosis of intracranial venous system
Excludes: when causing infarction (I63.6)I67.7 Cerebral arthritis, not elsewhere classified I67.8 Other specified cerebrovascular disease
Acute cerebrovascular insufficiency NOS Cerebral ischemia (chronic)
I67.9 Cerebrovascular disease, unspecified I68 Cerebrovascular disorder in disease classified elsewhere I68.0* Cerebral amyloid angiopathy (E85.-+) I68.1* Cerebral arteritis in infectious and parasitic disease classified elsewhere
- listerial (A32.8+ - syphilitic (A52.0+) - tuberculosis (A18.8+)
I68.2* Cerebral arteritis in other diseases classified elsewhere Cerebral arteritis in systemic lupus erythematosus (M32.1+)
I68.8 Other cerebrovascular disordersin diseases classified elsewhere I69 Sequele of cerebrovascular disease
Note: This category is to be used to indicate conditions in I60 – I67 as the cause of sequele, themselves classified elsewhere. The “sequele” include conditions specified as such or as late effect, or those present one year or more after onset of the causal condition.
I69.0 Sequele of subarachnoidal haemorrhage I69.1 Sequele of intracerebral haemorrhage I69.2 Sequele of other nontraumatic intracranial haemorrhage I69.3 Sequele of cerebral infarction I69.4 Sequele of stroke, not specified as haemorrhage or infarction I69.8 Sequele of other and unspecified cerebrovascular diseases

78
The original and the modified Ashworth scale
Table 25. The original and the modified Ashworth scale
Score Original Ashworth scale 73 Modified Ashworth scale 74
0 No increase in tone No increase in tone
1 Slight increase in tone giving a catch when the limb is moved in flexion or extension
Slight increase in muscle tone, manifested by a catch and release or by minimal resistance at the end of the range of motion when the af-fected part(s) is moved in flexion or extension
1+ – Slight increase in muscle tone, manifested by a catch, followed by minimal resistance throughout the remainder (less than half) of the range of motion
2 More marked increase in tone but limb easily flexed
More marked increase in muscle tone through most of the range of motion but affected part(s) easily moved
3 Considerable increase in tone, passive movement difficult
Considerable increase in tone, pas-sive movement difficult.
4 Limb rigid in flexion or extension Affected part(s) rigid in flexion or extension

79
National Institutes of Health Stroke Scale (NIHSS)
Table 26. The NIHSS (12 item, maximum 46 points, short version). Adapted from 192.
Item Description Max. point
1a. Level of Consciousness (LOC) 0 = Alert 1 = Arousable by minor stimulation 2 = Requires repeated stimulation 3 = Coma
3
1b. LOC Questions Ask patient the month and their age
0 = Answers both correctly. 1 = Answers one correctly. 2 = Answers neither correctly
2
1c. LOC Commands Ask patient to open/close eyes and form/release the hand
0 = Obeys boths correctly. 1 = Obeys one correctly. 2 = Both incorrectly.
2
2. Best Gaze: Only horizontal eye movements
0 = Normal. 1 = Partial gaze palsy. 2 = Forced gaze palzy.
2
3.Visual fields 0 = No visual loss. 1 = Partial hemianopia. 2 = Complete hemianopia. 3 = Bilateral hemianopia (blind inclu-ding cortical blindness).
3
4. Facial Palsy Ask patient to show teeth or raise eyeb-rows and close eyes
0 = Normal symmetrical movements. 1 = Minor paralysis (flattened nasolabi-al fold, asymmetry on smiling). 2 = Partial paralysis (total or near-total paralysis of lower face). 3 = Complete paralysis of one or both sides (absence of facial movement in the upper and lower face).
3

80
Table 33 continued
5. Motor function, arm 0 = Normal 1 = Drift 2 = Some effort against gravity 3 = No effort against gravity; limb falls. 4 = No movement. 5a. Left Arm 5b. Right Arm
8
6. Motor funktion, leg 0 = Normal 1 = Drift 2 = Some effort against gravity 3 = No effort against gravity 4 = No movement 6a. Left Leg 6b. Right Leg
8
7. Limb Ataxia 0 = Absent 1 = Present in one limb 2 = Present in two limbs
2
8. Sensory Use pinprick to test arms, legs, trunk and face, compare side to side
0 = Normal; no sensory loss 1 = Mild-to-moderate sensory loss 2 = Severe to total sensory loss
2
9. Best Language
0 = No aphasia; normal 1 = Mild-to-moderate aphasia 2 = Severe aphasia 3 = Mute, global aphasia
3
10. Dysarthria Ask patient to read several words
0 = Normal. 1 = Mild-to-moderate dysarthria 2 = Severe dysarthria
2
11. Extinction and Inattention Use visual double stimulation or sensory double stimulation
0 = Normal 1 = Inattention or extinction to bilateral simultaneous stimulation in one of the sensory modalities 2 = Severe hemi-inattention or hemi-inattention to more than one modality
2
12. Hand function 0 = Normal 1 = Flexion within 5 seconds 2 = No voluntary extension of the hand.
4
TOTAL SCORE 46

81
Modified Rankin Scale (mRS)
Table 27. Modified Rankin Scale 85
Score Description Exemplified questions from structured interview 87
0 No symptoms at all
1 No significant disability despite symp-toms; able to carry out all usual duties and activities.
Symptoms as a result of the stroke. Can be any symptoms or problems reported by the patients or found in neurological examination; difficulty reading or wri-tong, speaking or finding the right word, weakness in extremity; however the patient is able to carry out all usual duties and activities.
2 Slight disability; unable to carry out all previous activities but able to look after own affairs without assistance.
Concentration on change. Change sho-uld come from impairment. Possible improvement in the future is no relevant. Questions like: ”Since stroke has there been a change in your ability to work?”, ”Since stroke has there been changes in your abiliry to look after your family at home?”
3 Moderate disability; requiring some help, but able to walk without assistance.
Assistance is the key word to separate mRS 3 and mRS 4. Questions like: ”Is assistance essential for eating; using the toilet; routine daily hygien; walking; preparing a simple meal; basic house-hold expenses; local travel?
4 Moderately severe disability; unable to walk without assistance and unable to attend to own bodily needs without assis-tance.
In mRS 4, the patient require assistance, see above.
5 Severe disability; bedridden, incontinent and requiring constant nursing care and attention.
Constant care means that someone need to be available at all times.
6 Dead.

82
Barthel Index (BI)
Table 28. The Barthel Index (BI) 90
Activity
Feeding 0 = unable 5 = needs help cutting, spreading butter, etc., or requires modified diet 10 = independent
Bathing 0 = dependent 5 = independent (or in shower)
Grooming 0 = needs to help with personal care 5 = independent face/hair/teeth/shaving (implements provided)
Dressing 0 = dependent 5 = needs help but can do about half unaided 10 = independent (including buttons, zips, laces, etc.)
Bowels 0 = incontinent (or needs to be given enemas) 5 = occasional accident 10 = continent
Bladder 0 = incontinent, or catheterized and unable to manage alone 5 = occasional accident 10 = continent
Toilet use 0 = dependent 5 = needs some help, but can do something alone 10 = independent (on and off, dressing, wiping)
Transfer (bed to chair and back)
0 = unable, no sitting balance 5 = major help (one or two people, physical), can sit 10 = minor help (verbal or physical) 15 = independent
Mobility (on level surfaces)
0 = immobile or < 50 yards 5 = wheelchair independent, including corners, > 50 yards 10 = walks with help of one person (verbal or physical) > 50 yards 15 = independent (but may use any aid; for example, stick) > 50 yards
Stairs 0 = unable 5 = needs help (verbal, physical, carrying aid) 10 = independent

83
Purchasing Power Parities
Table 29. What are Purchasing Power Parities?
What are Purchasing Power Parities (PPP)?
Purchasing Power Parities (PPP) are currency rates that equalise the purchasing power of different currencies by eliminating the differences in price levels betwe-en countries. The model with PPP were developed by the Swedish professor of economics at Stockholms University, Gustav Cassel, in 1918 193. PPP are ex-change rates for a given basket of goods and services. It is important to note that PPP are not a currency, it is a currenct rate that tries to equalise the purchasing power of different currencies. The PPP often presents as PPP US dollar (PPP$), where a PPP$ equals the purchasing power of $1 in the US. We have used the PPP exchange rated given by the Organisation for Economic Co-operation and Development (OECD). The OECD presents PPP as PPP$ (http://www.oecd.org/dataoecd/59/10/37984252.pdf).
If you buy goods for 1000 Swedish Krona (SEK) in Sweden you get goods for 1069 in the US, 1452 in Greece, and 965 in Irland, respectively.
The advantage with PPP are that it tries to compensate not only for different ex-change rates between countries, but it also includes different costs between coun-tries 194. For example, the Chinese Yuan are kept low by the Chinese government through a constant invest of the trade surplus in foreign currencies, especially of the US governmental securities, e.g. lending money to the US enabling them to buy cheaper Chinese products 195 196. In 2003 the average exchange rate was $1 = 8.3 Yuan 197. The World Bank estimate of PPP, however, was 1PPP$ = 1.8 Yuan 198.
The uses of PPP have been criticized. The statistical basket of goods varies be-tween countries. For example, Japanese people do not eat yoghurt in the same amount as Europeans. In addition, some goods may be considered differently, and be differently priced due to market availability between countries. For exam-ple, a Big Mac in the US is a cheap product for the low end segment of the mar-ket, but in India, a Big Mac is highly priced due to the rarity of the product – the Big Mac is therefore a product of the more wealthy parts of the population of In-dia.

84
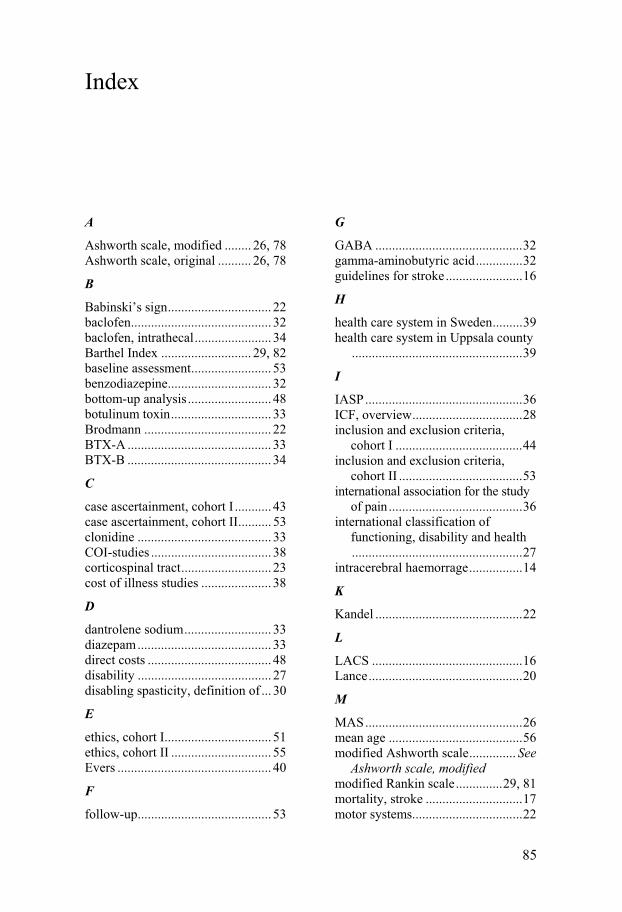
85
Index
A
Ashworth scale, modified ........ 26, 78 Ashworth scale, original .......... 26, 78
B
Babinski’s sign ............................... 22 baclofen .......................................... 32 baclofen, intrathecal ....................... 34 Barthel Index ........................... 29, 82 baseline assessment ........................ 53 benzodiazepine ............................... 32 bottom-up analysis ......................... 48 botulinum toxin .............................. 33 Brodmann ...................................... 22 BTX-A ........................................... 33 BTX-B ........................................... 34
C
case ascertainment, cohort I ........... 43 case ascertainment, cohort II .......... 53 clonidine ........................................ 33 COI-studies .................................... 38 corticospinal tract ........................... 23 cost of illness studies ..................... 38
D
dantrolene sodium .......................... 33 diazepam ........................................ 33 direct costs ..................................... 48 disability ........................................ 27 disabling spasticity, definition of ... 30
E
ethics, cohort I................................ 51 ethics, cohort II .............................. 55 Evers .............................................. 40
F
follow-up ........................................ 53
G
GABA ............................................ 32 gamma-aminobutyric acid .............. 32 guidelines for stroke ....................... 16
H
health care system in Sweden ......... 39 health care system in Uppsala county
................................................... 39
I
IASP ............................................... 36 ICF, overview ................................. 28 inclusion and exclusion criteria,
cohort I ...................................... 44 inclusion and exclusion criteria,
cohort II ..................................... 53 international association for the study
of pain ........................................ 36 international classification of
functioning, disability and health ................................................... 27
intracerebral haemorrage ................ 14
K
Kandel ............................................ 22
L
LACS ............................................. 16 Lance .............................................. 20
M
MAS ............................................... 26 mean age ........................................ 56 modified Ashworth scale .............. See
Ashworth scale, modified modified Rankin scale .............. 29, 81 mortality, stroke ............................. 17 motor systems................................. 22

86
mRS ......................................... 29, 81 multiple logistic regression, disabling
spasticity ................................... 58 multiple logistic regression, pain ... 60
N
National Institutes of Health Stroke Scale .................................... 46, 79
NIHSS ...................................... 46, 79 NIHSS distribution ........................ 57
O
OCSP ............................................. 16 Oxfordshire community stroke
project classification of stroke... 16
P
PACS ............................................. 16 pain worldwide, prevalence of ....... 37 pain, among stroke patients ............ 38 pain, classification of ..................... 36 pain, definition of ........................... 36 pain, distribution of ........................ 60 pain, measuring .............................. 37 pain, prevalence of ......................... 59 Pandyan .......................................... 21 parapyramidal ................................ 24 POCS ............................................. 16 Purchasing Power Parities .............. 83 pyramidal tract ............................... 24
R
rating scale for resistance to passive movement .................................. 26
rheological changes ........................ 22 Riks-stroke ..................................... 18
S
Sommerfeld .................................... 35 spasticity ............................ 12, 20, 21 spasticity, disabling ........................ 58
spasticity, distribution of ................ 59 spasticity, incidence and prevalence
................................................... 67 spasticity, medication ..................... 31 spasticity, pathophysiology of ........ 22 spasticity, prevalence of ........... 34, 57 spasticity, severity of ...................... 58 statistics, cohort I ........................... 49 statistics, cohort II .......................... 54 stroke, definition in this thesis ........ 16 stroke, epidemiology of .................. 17 stroke, incidence ............................. 19 stroke, severity ............................... 46 stroke, the WHO definition of ........ 14 study design, cohort I ..................... 43 study design, cohort II .................... 52 study population, cohort I ............... 43 study population, cohort II ............. 52 study schedule, cohort II ................ 54 study variables, cohort I ................. 47 subarachnoid hemorrhage .............. 14 Swedish Stroke Register ...... see Riks-
stroke
T
TACS ............................................. 16 TIA ................................................. 14 tizanidine ........................................ 33 TOAST, classification of stroke ..... 15 tone assessment scale ..................... 26
U
UMN syndrome .............................. 20 upper motor neuron syndrome ....... 20
V
VAS ................................................ 37 Watkins .......................................... 35 Welmer ........................................... 35 visual analogue scale ...................... 37

87
Tables in the thesis
Table 1. TOAST Classification of subtypes of acute ischemic stroke 13 .................... 15 Table 2. Characteristics of population-based studies. Adapted from 48. Stroke incidence per 100 000 person-years ......................................................................... 19 Table 3. Clinical features of the Upper Motor Neuron syndrome 55 ......................... 20 Table 4. Characteristics of UMN syndrome of cerebral or spinal origin ................. 25 Table 5. The original and modified Ashworth scales ................................................ 26 Table 6. An overview of ICF 83 ................................................................................. 28 Table 7. Harmful effects of spasticity 60 .................................................................... 29 Table 8. Indications for pharmacological treatment of spasticity 66 ......................... 32 Table 9. Studies on spasticity after stroke ................................................................. 35 Table 10. Checklist for Cost of illness studies. Developed by Evers et al. 148 ........... 40 Table 11. Outline of the thesis .................................................................................. 41 Table 12. Stroke onset characteristics of participants and non-participants............ 46 Table 13. The study variables for cohort I (Paper I, II and III) ................................ 47 Table 14. Examples of variables, their definitions, scale types and statistics used for cohort I. ..................................................................................................................... 50 Table 15. Study schedule of cohort II (Paper IV) ..................................................... 54 Table 16. Comparison between patients with no spasticity versus patients with spasticity and disabling spasticity, respectively ........................................................ 58 Table 17. Multiple logistic regression. Factors associated with Disabling spasticity. The regression analysis was by use of backward elimination (likelihood ratio). ..... 58 Table 18. Severity of spasticity for the whole sample ............................................... 59 Table 19. Comparison between No pain, Pain related to stroke, and Pain not related to stroke .................................................................................................................... 60 Table 20. Multiple logistic regression. Factors associated with stroke-related pain. The regression analysis was by use of backward elimination (likelihood ratio). ..... 60 Table 21. An overview of study data from cohort I of all patients with spasticity (n=25) ....................................................................................................................... 62 Table 22. The temporal course of spasticity. ............................................................ 67 Table 23. Faktaruta om spasticitet ........................................................................... 71 Table 24. Faktaruta om stroke .................................................................................. 72 Table 25. The original and the modified Ashworth scale ......................................... 78 Table 26. The NIHSS (12 item, maximum 46 points, short version). Adapted from 192. .................................................................................................................................. 79 Table 27. Modified Rankin Scale 85 .......................................................................... 81 Table 28. The Barthel Index (BI) 90 ........................................................................... 82 Table 29. What are Purchasing Power Parities? ..................................................... 83

88
References
1. Payne KA, Huybrechts KF, Caro JJ, Craig Green TJ, Klittich WS. Long term cost-of-illness in stroke: An international review. Pharmacoeconomics. 2002;20:813-825
2. Rothwell PM, Coull AJ, Silver LE, Fairhead JF, Giles MF, Lovelock CE, Redgrave JN, Bull LM, Welch SJ, Cuthbertson FC, Binney LE, Gutnikov SA, Anslow P, Banning AP, Mant D, Mehta Z. Population-based study of event-rate, incidence, case fatality, and mortality for all acute vascular events in all arterial territories (Oxford vascular study). Lancet. 2005;366:1773-1783
3. Asplund K. A national quality register for acute stroke. Access date: 08/MAY/2009. http://www.riks-stroke.org/index.php?content=&lang=eng&text=
4. Terént A, Marke LA, Asplund K, Norrving B, Jonsson E, Wester PO. Costs of stroke in Sweden. A national perspective. Stroke. 1994;25:2363-2369
5. Haas BM. Measuring spasticity. A survey of current practice among health care professionals. British journal of therapy & rehabilitation. 1994;2:90-95
6. Watkins CL, Leathley MJ, Gregson JM, Moore AP, Smith TL, Sharma AK. Prevalence of spasticity post stroke. Clinical rehabilitation. 2002;16:515-522.
7. Sommerfeld DK, Eek EU, Svensson AK, Holmqvist LW, von Arbin MH. Spas-ticity after stroke: Its occurrence and association with motor impairments and activity limitations. Stroke. 2004;35:134-139
8. Welmer AK, von Arbin M, Widen Holmqvist L, Sommerfeld DK. Spasticity and its association with functioning and health-related quality of life 18 months after stroke. Cerebrovascular diseases. 2006;21:247-253
9. Ward AB, Aguilar M, De Beyl Z, Gedin S, Kanovsky P, Molteni F, Wissel J, Yakovleff A. Use of botulinum toxin type a in management of adult spasticity--a european consensus statement. Journal of rehabilitation medicine. 2003;35:98-99
10. Aho K, Harmsen P, Hatano S, Marquardsen J, Smirnov VE, Strasser T. Cere-brovascular disease in the community: Results of a who collaborative study. Bull World Health Organ. 1980;58:113-130
11. Wilterdink JL, Easton JD. Vascular event rates in patients with atherosclerotic cerebrovascular disease. Archives of neurology. 1992;49:857-863
89
12. World Health Organization. Cerebrovascular diseases (i60-i69). 2006;2008:ICD-10 classification of cerebrovascular disease
13. Adams HP, Jr., Bendixen BH, Kappelle LJ, Biller J, Love BB, Gordon DL, Marsh EE, 3rd. Classification of subtype of acute ischemic stroke. Definitions for use in a multicenter clinical trial. Toast. Trial of org 10172 in acute stroke treatment. Stroke. 1993;24:35-41
14. Gordon DL, Bendixen BH, Adams HP, Jr., Clarke W, Kappelle LJ, Woolson RF. Interphysician agreement in the diagnosis of subtypes of acute ischemic stroke: Implications for clinical trials. The toast investigators. Neurology. 1993;43:1021-1027
15. Meschia JF, Barrett KM, Chukwudelunzu F, Brown WM, Case LD, Kissela BM, Brown RD, Jr., Brott TG, Olson TS, Rich SS, Silliman S, Worrall BB. In-terobserver agreement in the trial of org 10172 in acute stroke treatment classi-fication of stroke based on retrospective medical record review. Journal of stroke and cerebrovascular disease. 2006;15:266-272
16. Bamford J, Sandercock P, Dennis M, Burn J, Warlow C. Classification and natural history of clinically identifiable subtypes of cerebral infarction. Lancet. 1991;337:1521-1526
17. Lindley RI, Warlow CP, Wardlaw JM, Dennis MS, Slattery J, Sandercock PA. Interobserver reliability of a clinical classification of acute cerebral infarction. Stroke. 1993;24:1801-1804
18. Mead GE, Lewis SC, Wardlaw JM, Dennis MS, Warlow CP. How well does the oxfordshire community stroke project classification predict the site and size of the infarct on brain imaging? Journal of neurology, neurosurgery, and psy-chiatry. 2000;68:558-562
19. Adams HP, Jr., Brott TG, Crowell RM, Furlan AJ, Gomez CR, Grotta J, Hel-gason CM, Marler JR, Woolson RF, Zivin JA, et al. Guidelines for the man-agement of patients with acute ischemic stroke. A statement for healthcare pro-fessionals from a special writing group of the stroke council, american heart as-sociation. Stroke. 1994;25:1901-1914
20. Del Zoppo GJ, Saver JL, Jauch EC, Adams HP, Jr. Expansion of the time win-dow for treatment of acute ischemic stroke with intravenous tissue plasminogen activator. A science advisory from the american heart association/american stroke association. Stroke. 2009
21. Summers D, Leonard A, Wentworth D, Saver JL, Simpson J, Spilker JA, Hock N, Miller E, Mitchell PH. Comprehensive overview of nursing and interdisci-plinary care of the acute ischemic stroke patient. A scientific statement from the american heart association. Stroke. 2009
90
22. O'Gara PT, Messe SR, Tuzcu EM, Catha G, Ring JC. Percutaneous device closure of patent foramen ovale for secondary stroke prevention: A call for completion of randomized clinical trials: A science advisory from the american heart association/american stroke association and the american college of car-diology foundation. Circulation. 2009;119:2743-2747
23. Schwamm LH, Audebert HJ, Amarenco P, Chumbler NR, Frankel MR, George MG, Gorelick PB, Horton KB, Kaste M, Lackland DT, Levine SR, Meyer BC, Meyers PM, Patterson V, Stranne SK, White CJ. Recommendations for the im-plementation of telemedicine within stroke systems of care. A policy statement from the american heart association. Stroke. 2009
24. Bederson JB, Connolly ES, Jr., Batjer HH, Dacey RG, Dion JE, Diringer MN, Duldner JE, Jr., Harbaugh RE, Patel AB, Rosenwasser RH. Guidelines for the management of aneurysmal subarachnoid hemorrhage: A statement for health-care professionals from a special writing group of the stroke council, american heart association. Stroke. 2009;40:994-1025
25. Roach ES, Golomb MR, Adams R, Biller J, Daniels S, Deveber G, Ferriero D, Jones BV, Kirkham FJ, Scott RM, Smith ER. Management of stroke in infants and children: A scientific statement from a special writing group of the ameri-can heart association stroke council and the council on cardiovascular disease in the young. Stroke. 2008;39:2644-2691
26. Adams RJ, Albers G, Alberts MJ, Benavente O, Furie K, Goldstein LB, Gorelick P, Halperin J, Harbaugh R, Johnston SC, Katzan I, Kelly-Hayes M, Kenton EJ, Marks M, Sacco RL, Schwamm LH. Update to the aha/asa recom-mendations for the prevention of stroke in patients with stroke and transient ischemic attack. Stroke. 2008;39:1647-1652
27. Acker JE, 3rd, Pancioli AM, Crocco TJ, Eckstein MK, Jauch EC, Larrabee H, Meltzer NM, Mergendahl WC, Munn JW, Prentiss SM, Sand C, Saver JL, Eigel B, Gilpin BR, Schoeberl M, Solis P, Bailey JR, Horton KB, Stranne SK. Implementation strategies for emergency medical services within stroke sys-tems of care: A policy statement from the american heart association/american stroke association expert panel on emergency medical services systems and the stroke council. Stroke. 2007;38:3097-3115
28. Broderick J, Connolly S, Feldmann E, Hanley D, Kase C, Krieger D, Mayberg M, Morgenstern L, Ogilvy CS, Vespa P, Zuccarello M. Guidelines for the man-agement of spontaneous intracerebral hemorrhage in adults: 2007 update: A guideline from the american heart association/american stroke association stroke council, high blood pressure research council, and the quality of care and out-comes in research interdisciplinary working group. Stroke. 2007;38:2001-2023

91
29. Adams HP, Jr., del Zoppo G, Alberts MJ, Bhatt DL, Brass L, Furlan A, Grubb RL, Higashida RT, Jauch EC, Kidwell C, Lyden PD, Morgenstern LB, Qureshi AI, Rosenwasser RH, Scott PA, Wijdicks EF. Guidelines for the early man-agement of adults with ischemic stroke: A guideline from the american heart association/american stroke association stroke council, clinical cardiology council, cardiovascular radiology and intervention council, and the atheroscle-rotic peripheral vascular disease and quality of care outcomes in research inter-disciplinary working groups: The american academy of neurology affirms the value of this guideline as an educational tool for neurologists. Stroke. 2007;38:1655-1711
30. Duncan PW, Zorowitz R, Bates B, Choi JY, Glasberg JJ, Graham GD, Katz RC, Lamberty K, Reker D. Management of adult stroke rehabilitation care: A clinical practice guideline. Stroke. 2005;36:e100-143
31. Canadian Stroke Network and the Heart and Stroke Foundation of Canada. A supplement to the canadian stroke strategy canadian best practices recommen-dations for stroke care. Access date: 17/JUL/2009 http://www.canadianstrokestrategy.ca/eng/resourcestools/documents/CSS_Performance_Manual_2008.pdf
32. Canadian Stroke Network and the Heart and Stroke Foundation of Canada. Canadian best practice recommendations for stroke care. Access date: 17/JUL/2009 http://www.canadianstrokestrategy.ca/eng/ resourcestools/documents/StrokeStrategyManual.pdf
33. Royal College of Physicians. Stroke. National clinical guideline for diagnosis and initial management of acute stroke and transient ischemic attack (TIA). Access date: 17/JUL/2009 http://www.nice.org.uk/nicemedia/pdf/CG68FullGuideline.pdf
34. Royal College of Physicians Intercollegiate Stroke Working Party. National clinical guideline for stroke, 3rd edition. Access date: 17/JUL/2009 http://www.rcplondon.ac.uk/pubs/contents/6ad05aab-8400-494c-8cf4-9772d1d5301b.pdf
35. Shinohara Y. Japanese guidelines for the management of stroke (in japanese). Access date: 17/JUL/2009 http:// www.jsts.gr.jp/index.html
36. Shinohara Y, Yamaguchi T. Outline of the japanese guidelines for the man-agement of stroke 2004 and subsequent revision. Int J Stroke. 2008;3:55-62
37. National Stroke Foundation 2007. Clinical guidelines for acute stroke manage-ment. Access date: 17/JUL/2009 http://www.strokefoundation.com.au/clinical-guidelines
92
38. National Stroke Foundation 2005 Clinical guidelines for stroke rehabilitation and recovery. Access date: 17/JUL/2009 http://www.strokefoundation.com.au/clinical-guidelines
39. Stroke Foundation New Zealand Inc. Life after stroke. New zealand guideline-for management of stroke. Access date: 17/JUL/2009 http://www.nzgg.org.nz/guidelines/0037/ACF291F.pdf
40. European stroke organisation. Guidelines for management of ischaemic stroke and transient ischaemic attack 2008. Cerebrovascular diseases. 2008;25:457-507
41. Quinn TJ, Paolucci S, Sivenius J, Walker MF, Toni D, Lees KR. Evidence-based stroke rehabilitation: An expanded guidance document from the european stroke organisation (eso) guidelines for management of ischaemic stroke and transient ischaemic attack 2008. Journal of rehabilitation medicine. 2009;41:99-111
42. Karolinska stroke update 2008. Karolinska stroke update 2008 concensus statement. Access date: 17/JUL/2009 http://www.strokeupdate.org/Cons_thrombolysis_2008.aspx
43. Socialstyrelsen. Strokesjukvård - vetenskapligt underlag 2009 (preliminär ver-sion). Access date: 31/MAY/2009. http://www.socialstyrelsen.se/NR/rdonlyres/32296EC6-D5D9-4B4F-9BB2-9E7725DEA68F/13284/vetenskapligt_underlag1.pdf
44. Sarti C, Rastenyte D, Cepaitis Z, Tuomilehto J. International trends in mortality from stroke, 1968 to 1994. Stroke. 2000;31:1588-1601
45. World Health Organization. The world 122 health report 2004 deaths by cause, sex and mortality stratum in WHO regions, a estimates for 2002. 2004:122
46. Appelros P, Karlsson GM, Seiger A, Nydevik I. Neglect and anosognosia after first-ever stroke: Incidence and relationship to disability. Journal of rehabilita-tion medicine. 2002;34:215-220
47. The National Board of Health and Welfare (Socialstyrelsen). Causes of death in Sweden. 2008
48. Feigin VL, Lawes CM, Bennett DA, Barker-Collo SL, Parag V. Worldwide stroke incidence and early case fatality reported in 56 population-based studies: A systematic review. Lancet Neurology. 2009;8:355-369
49. Foulkes MA, Wolf PA, Price TR, Mohr JP, Hier DB. The stroke data bank: Design, methods, and baseline characteristics. Stroke. 1988;19:547-554
50. Bonita R, Beaglehole R. Explaining stroke mortality trends. Lancet. 1993;341:1510-1511
93
51. Glader E-L. Stroke care in sweden. Hospital care and patient follow-up based on riks-stroke, the national quality register for stroke care. Department of Pub-lic Health and Clinical Medicine. 2003
52. Riks-stroke. Analyserade rapport riks-stroke 2006. Access date: 17/JUL/2009 http://www.riks-stroke.org/content/analyser/Rapport06.pdf
53. Appelros P, Högerås N, Terént A. Case ascertainment in stroke studies: The risk of selection bias. Acta neurologica Scandinavica. 2003;107:145-149.
54. Hallström B, Jönsson AC, Nerbrand C, Petersen B, Norrving B, Lindgren A. Lund stroke register: Hospitalization pattern and yield of different screening methods for first-ever stroke. Acta neurologica Scandinavica. 2007;115:49-54
55. Barnes MP. Features of the upper motor neurone syndrome. In: Barnes MP, Johnson GR, eds. Upper motor neurone syndrome and spasticity: Clinical management and neurophysiology. Cambridge: Cambridge University Press; 2001:2.
56. Kandel ER, Schwartz JH, Jessel TM. Principles of neural science. Mc Graw-Hill Medical; 2000.
57. Pandyan AD, Gregoric M, Barnes MP, Wood D, Van Wijck F, Burridge J, Hermens H, Johnson GR. Spasticity: Clinical perceptions, neurological realities and meaningful measurement. Disability and rehabilitation. 2005;27:2-6
58. Malhotra S, Pandyan AD, Day CR, Jones PW, Hermens H. Spasticity, an im-pairment that is poorly defined and poorly measured. Clinical rehabilitation. 2009
59. Lance JW. The control of muscle tone, reflexes, and movement: Robert wartenberg lecture. Neurology. 1980;30:1303-1313.
60. Royal College of Physicians. Spasticity in adults: Management using botulinum toxin. National guidelines. Access date: 17/JUL/2009 http://www.rcplondon.ac.uk/pubs/contents/6988a14a-1179-4071-8f56-dc2a865f0a43.pdf
61. The British Pain Society. Intrathecal drug delivery for the management of pain and spasticity in adults; recommendations for best clinical practice. Access date: 17/JUL/2009 http://www.britishpainsociety.org/book_ittd_main.pdf
62. Wissel J, Ward AB, Erztgaard P, Bensmail D, Hecht MJ, Lejeune TM, Schnider P, Altavista MC, Cavazza S, Deltombe T, Duarte E, Geurts AC, Gra-cies JM, Haboubi NH, Juan FJ, Kasch H, Katterer C, Kirazli Y, Manganotti P, Parman Y, Paternostro-Sluga T, Petropoulou K, Prempeh R, Rousseaux M, Slawek J, Tieranta N. European consensus table on the use of botulinum toxin type a in adult spasticity. Journal of rehabilitation medicine. 2009;41:13-25
94
63. Jean-Michel G. Pathophysiology of spastic paresis. I: Paresis and soft tissue changes. Muscle & Nerve. 2005;31:535-551
64. Knutsson E, Richards C. Different types of disturbed motor control in gait of hemiparetic patients. Brain. 1979;102:405-430
65. Sköld C, Levi R, Seiger A. Spasticity after traumatic spinal cord injury: Nature, severity, and location. Archives of physical medicine and rehabilitation. 1999;80:1548-1557
66. Whyte J, Robinson K. Pharmacological management. In: Glenn MB, Whyte J, eds. The practical management of spasticity in children and adults. Philadel-phia: Lea & Febiger 1990:337.
67. Rowland LP. Interruption of descending pathways to the spinal cord frequently produces spasticity. In: Kandel ER, Schwartz JH, Jessel TM, eds. Principles of neural science. New York: McGraw-Hill; 2000:730-735.
68. Brodmann K. Brodmann's localisation in the cerebral cortex. Singapore: World Scientific Publishing Co Pte Ltd; 2006.
69. Sheean G. Neurophysiology of spasticity. In: Barnes MP, Johnson GR, eds. Upper motor neurone syndrome and spasticity: Clinical management and neu-rophysiology. Cambridge: Cambridge University Press; 2001:12-78.
70. Denny-Brown D. The cerebral control of movement. Liverpool: Liverpool U.P.; 1966.
71. Burke D. Spasticity as an adaptation to pyramidal tract injury. Advances in neurology. 1988;47:401-423
72. van Gijn J. The babinski sign and the pyramidal syndrome. Journal of neurol-ogy, neurosurgery and psychiatry. 1978;41:865-873
73. Ashworth B. Preliminary trial of carisoprodol in multiple sclerosis. Practitio-ner. 1964;192:540-542
74. Bohannon RW, Smith MB. Interrater reliability of a modified ashworth scale of muscle spasticity. Physical therapy. 1987;67:206-207.
75. Gregson JM, Leathley M, Moore AP, Sharma AK, Smith TL, Watkins CL. Reliability of the tone assessment scale and the modified ashworth scale as clinical tools for assessing poststroke spasticity. Archives of physical medicine and rehabilitation. 1999;80:1013-1016
76. O'Dwyer NJ, Ada L, Neilson PD. Spasticity and muscle contracture following stroke. Brain. 1996;119 ( Pt 5):1737-1749
77. Pandyan AD, Price CI, Rodgers H, Barnes MP, Johnson GR. Biomechanical examination of a commonly used measure of spasticity. Clinical biomechanics. 2001;16:859-865

95
78. Platz T, Vuadens P, Eickhof C, Arnold P, Van Kaick S, Heise K. Repas, a summary rating scale for resistance to passive movement: Item selection, reli-ability and validity. Disability and rehabilitation. 2008;30:44-53
79. van der Salm A, Veltink PH, Hermens HJ, Ijzerman MJ, Nene AV. Develop-ment of a new method for objective assessment of spasticity using full range passive movements. Archives of physical medicine and rehabilitation. 2005;86:1991-1997
80. Bakheit AM, Maynard VA, Curnow J, Hudson N, Kodapala S. The relation between ashworth scale scores and the excitability of the alpha motor neurones in patients with post-stroke muscle spasticity. Journal of neurology, neurosur-gery and psychiatry. 2003;74:646-648
81. World Health Organization. International classification of functioning, disabil-ity and health. Access date: 21/NOV/2008. http://www.who.int/classifications/icf/en/
82. World Health Organization. Taxonomic and terminological issues. Interna-tional classification of functioning, disability and health. Geneva: World Health Organization; 2001:213.
83. World Health Organization. Table 1. An overview of icf. International classifi-cation of functioning, disability and health. Geneva: World Health Organiza-tion; 2001:11.
84. Rankin J. Cerebral vascular accidents in patients over the age of 60. Ii. Progno-sis. Scottish medical journal. 1957;2:200-215
85. van Swieten JC, Koudstaal PJ, Visser MC, Schouten HJ, van Gijn J. Interob-server agreement for the assessment of handicap in stroke patients. Stroke. 1988;19:604-607
86. Kasner SE. Clinical interpretation and use of stroke scales. Lancet neurology. 2006;5:603-612
87. Wilson L, Hareendran A. Structured interview for the modified rankin scale. Access date: 09/MAY/2009. http://www.psychology.stir.ac.uk/staff/lwilson/documents/MRS_Structured_Interview.pdf
88. Brown DL, Coffey CS. Stroke trials: A shift to shift analysis? Neurology. 2009;72:1292-1293
89. Saver JL, Gornbein J. Treatment effects for which shift or binary analyses are advantageous in acute stroke trials. Neurology. 2009;72:1310-1315
90. Mahoney FI, Barthel DW. Functional evaluation: The Barthel index. Md State Med J. 1965;14:61-65

96
91. Wade DT, Hewer RL. Functional abilities after stroke: Measurement, natural history and prognosis. Journal of neurology, neurosurgery and psychiatry. 1987;50:177-182
92. Brock K, Black S, Cotton S, Kennedy G, Wilson S, Sutton E, Rodgers H, Shaw L, Price C, van Wijck F, Barnes M, Graham L, Ford G, Shackley P, Steen N, Ashford S, Turner-Stokes L, Ownsworth T, Fleming J, Shum D, Kuipers P, Strong J, Lord S, McPherson KM, McNaughton HK, Rochester L, Weatherall M. Goal achievement in the six months after inpatient rehabilitation for stroke. Disability and rehabilitation. 2008;26:1-7
93. Ashford S, Turner-Stokes L. Goal attainment for spasticity management using botulinum toxin. Physiotherapy reseach international. 2006;11:24-34
94. Ko CK, Ward AB. Management of spasticity. British journal of hospital medi-cine. 1997;58:400-405
95. Katz RT. Management of spasticity. American journal of physical medicine & rehabilitation. 1988;67:108-116
96. Pinto Ode S, Polikar M, Debono G. Results of international clinical trials with lioresal. Postgraduate medical journal. 1972;48:Suppl 5:18-25
97. Duncan GW, Shahani BT, Young RR. An evaluation of baclofen treatment for certain symptoms in patients with spinal cord lesions. A double-blind, cross-over study. Neurology. 1976;26:441-446
98. Feldman RG, Kelly-Hayes M, Conomy JP, Foley JM. Baclofen for spasticity in multiple sclerosis. Double-blind crossover and three-year study. Neurology. 1978;28:1094-1098
99. Davidoff RA. Antispasticity drugs: Mechanisms of action. Annals of neurology. 1985;17:107-116
100. Wilson LA, McKechnie AA. Oral diazepam in the treatment of spasticity in paraplegia a double-blind trial and subsequent impressions. Scottish medical journal. 1966;11:46-51
101. Corbett M, Frankel HL, Michaelis L. A double blind, cross-over trial of valium in the treatment of spasticity. Paraplegia. 1972;10:19-22
102. Ward A, Chaffman MO, Sorkin EM. Dantrolene. A review of its pharmacody-namic and pharmacokinetic properties and therapeutic use in malignant hyper-thermia, the neuroleptic malignant syndrome and an update of its use in muscle spasticity. Drugs. 1986;32:130-168
103. Chyatte SB, Birdsong JH, Bergman BA. The effects of dantrolene sodium on spasticity and motor performance in hemiplegia. Southern medical journal. 1971;64:180-185

97
104. Ketel WB, Kolb ME. Long-term treatment with dantrolene sodium of stroke patients with spasticity limiting the return of function. Current medical re-search and opinion. 1984;9:161-169
105. Lapierre Y, Bouchard S, Tansey C, Gendron D, Barkas WJ, Francis GS. Treatment of spasticity with tizanidine in multiple sclerosis. The Canadian journal of neurological sciences. 1987;14:513-517
106. Nance PW, Bugaresti J, Shellenberger K, Sheremata W, Martinez-Arizala A. Efficacy and safety of tizanidine in the treatment of spasticity in patients with spinal cord injury. North american tizanidine study group. Neurology. 1994;44:S44-51
107. Smith C, Birnbaum G, Carter JL, Greenstein J, Lublin FD. Tizanidine treatment of spasticity caused by multiple sclerosis: Results of a double-blind, placebo-controlled trial. US tizanidine study group. Neurology. 1994;44:S34-42
108. A double-blind, placebo-controlled trial of tizanidine in the treatment of spas-ticity caused by multiple sclerosis. United kingdom tizanidine trial group. Neu-rology. 1994;44:S70-78
109. Hassan N, McLellan DL. Double-blind comparison of single doses of ds103-282, baclofen and placebo for suppression of spasticity. Journal of neurology, neurosurgery and psychiatry. 1980;43:1132-1136
110. Bass B, Weinshenker B, Rice GP, Noseworthy JH, Cameron MG, Hader W, Bouchard S, Ebers GC. Tizanidine versus baclofen in the treatment of spasticity in patients with multiple sclerosis. The Canadian journal of neurological sci-ences. 1988;15:15-19
111. Medici M, Pebet M, Ciblis D. A double-blind, long-term study of tizanidine ('sirdalud') in spasticity due to cerebrovascular lesions. Current medical re-search and opinion. 1989;11:398-407
112. Bes A, Eyssette M, Pierrot-Deseilligny E, Rohmer F, Warter JM. A multi-centre, double-blind trial of tizanidine, a new antispastic agent, in spasticity associated with hemiplegia. Current medical research and opinion. 1988;10:709-718
113. Nance PW, Shears AH, Nance DM. Clonidine in spinal cord injury. Canadian medical association journal. 1985;133:41-42
114. Maynard FM. Early clinical experience with clonidine in spinal spasticity. Paraplegia. 1986;24:175-182
115. Scott AB. Botulinum toxin injection into extraocular muscles as an alternative to strabismus surgery. Journal of pediatric ophthalmology and strabismus. 1980;17:21-25
116. Penn RD, Kroin JS. Continuous intrathecal baclofen for severe spasticity. Lan-cet. 1985;2:125-127

98
117. Du X, Sourbutts J, Cruickshank K, Summers A, Roberts N, Walton E, Holmes S. A community based stroke register in a high risk area for stroke in north west england. Journal of epidemiology and community health. 1997;51:472-478
118. Jerntorp P, Berglund G. Stroke registry in Malmö, Sweden. Stroke. 1992;23:357-361
119. Appelros P, Nydevik I, Seiger A, Terént A. High incidence rates of stroke in Örebro, Sweden: Further support for regional incidence differences within Scandinavia. Cerebrovascular diseases. 2002;14:161-168
120. Terént A. Trends in stroke incidence and 10-year survival in Söderhamn, Swe-den, 1975-2001. Stroke. 2003;34:1353-1358
121. Barnes MP, Kent RM, Semlyen JK, McMullen KM. Spasticity in multiple sclerosis. Neurorehabilitation and neural repair. 2003;17:66-70
122. Goodin DS. Survey of multiple sclerosis in Northern California. Northern cali-fornia ms study group. Multiple sclerosis. 1999;5:78-88
123. Noreau L, Proulx P, Gagnon L, Drolet M, Laramee MT. Secondary impair-ments after spinal cord injury: A population-based study. American journal of physical medicine & rehabilitation. 2000;79:526-535
124. Wichers MJ, Odding E, Stam HJ, van Nieuwenhuizen O. Clinical presentation, associated disorders and aetiological moments in cerebral palsy: A dutch popu-lation-based study. Disability and rehabilitation. 2005;27:583-589
125. Wedekind C, Lippert-Gruner M. Long-term outcome in severe traumatic brain injury is significantly influenced by brainstem involvement. Brain injury. 2005;19:681-684
126. Merskey H, Bogduk N. Part iii: Pain terms, a current list with definitions and notes on usage. Classification of chronic pain, second edition. Seattle: IASP Press; 1994:209-214.
127. Bond MR, Pilowsky I. Subjective assessment of pain and its relationship to the administration of analgesics in patients with advanced cancer. Journal of psy-chosomatic research. 1966;10:203-208
128. Price DD, McGrath PA, Rafii A, Buckingham B. The validation of visual ana-logue scales as ratio scale measures for chronic and experimental pain. Pain. 1983;17:45-56
129. Herr KA, Mobily PR. Comparison of selected pain assessment tools for use with the elderly. Applied nursing research. 1993;6:39-46
130. Bowsher D. Central pain: Clinical and physiological characteristics. Journal of neurology, neurosurgery and psychiatry. 1996;61:62-69

99
131. Price CIM, Curless RH, Rodgers H. Can stroke patients use visual analogue scales? Stroke. 1999;30:1357-1361
132. Crook J, Rideout E, Browne G. The prevalence of pain complaints in a general population. Pain. 1984;18:299-314
133. Brattberg G, Thorslund M, Wikman A. The prevalence of pain in a general population. The results of a postal survey in a county of Sweden. Pain. 1989;37:215-222
134. Breivik H, Collett B, Ventafridda V, Cohen R, Gallacher D. Survey of chronic pain in europe: Prevalence, impact on daily life, and treatment. European jour-nal of pain. 2006;10:287-333
135. Magni G, Moreschi C, Rigatti-Luchini S, Merskey H. Prospective study on the relationship between depressive symptoms and chronic musculoskeletal pain. Pain. 1994;56:289-297
136. Fishbain DA, Cutler R, Rosomoff HL, Rosomoff RS. Chronic pain-associated depression: Antecedent or consequence of chronic pain? A review. The Clinical Journal of Pain. 1997;13:116-137
137. Gureje O, Von Korff M, Simon GE, Gater R. Persistent pain and well-being: A world health organization study in primary care. JAMA. 1998;280:147-151
138. McWilliams LA, Cox BJ, Enns MW. Mood and anxiety disorders associated with chronic pain: An examination in a nationally representative sample. Pain. 2003;106:127-133
139. Hackett ML, Anderson CS. Predictors of depression after stroke: A systematic review of observational studies. Stroke. 2005;36:2296-2301
140. Langhorne P, Stott DJ, Robertson L, MacDonald J, Jones L, McAlpine C, Dick F, Taylor GS, Murray G. Medical complications after stroke: A multicenter study. Stroke. 2000;31:1223-1229
141. Gamble GE, Barberan E, Laasch HU, Bowsher D, Tyrrell PJ, Jones AK. Post-stroke shoulder pain: A prospective study of the association and risk factors in 152 patients from a consecutive cohort of 205 patients presenting with stroke. European journal of pain. 2002;6:467-474
142. McLean DE. Medical complications experienced by a cohort of stroke survi-vors during inpatient, tertiary-level stroke rehabilitation. Archives of physical medicine and rehabilitation. 2004;85:466-469
143. Ratnasabapathy Y, Broad J, Baskett J, Pledger M, Marshall J, Bonita R. Shoul-der pain in people with a stroke: A population-based study. Clinical rehabilita-tion. 2003;17:304-311
144. Lindgren I, Jönsson AC, Norrving B, Lindgren A. Shoulder pain after stroke: A prospective population-based study. Stroke. 2007;38:343-348

100
145. Andersen G, Vestergaard K, Ingeman-Nielsen M, Jensen TS. Incidence of central post-stroke pain. Pain. 1995;61:187-193
146. Appelros P. Prevalence and predictors of pain and fatigue after stroke: A popu-lation-based study. International journal of rehabilitation research. 2006;29:329-333
147. Jönsson AC, Lindgren I, Hallstrom B, Norrving B, Lindgren A. Prevalence and intensity of pain after stroke a population-based study focusing on patients' per-spectives. Journal of neurology, neurosurgery and psychiatry. 2005;77:590-595
148. Evers SMAA, Struijs JN, Ament AJHA, van Genugten MLL, Jager JC, van den Bos GAM. International comparison of stroke cost studies. Stroke. 2004;35:1209-1215
149. Ghatnekar O, Persson U, Glader EL, Terént A. Cost of stroke in Sweden: An incidence estimate. International journal of technology assessment in health care. 2004;20:375-380
150. Jorgensen HS, Nakayama H, Raaschou HO, Olsen TS. Acute stroke care and rehabilitation: An analysis of the direct cost and its clinical and social determi-nants : The Copenhagen stroke study. Stroke. 1997;28:1138-1141
151. Palmer AJ, Valentine WJ, Roze S, Lammert M, Spiesser J, Gabriel S. Over-view of costs of stroke from published, incidence-based studies spanning 16 in-dustrialized countries. Current medical research and opinion. 2005;21:19-26
152. Persson U, Silverberg R, Lindgren B, Norrving B, Jadback G, Johansson B, Puranen BI. Direct costs of stroke for a Swedish population. International jour-nal of technology assessment in health care. 1990;6:125-137
153. Evers SM, Goossens ME, Ament AJ, Maarse JA. Economic evaluation in stroke research. An introduction. Cerebrovascular diseases. 2001;11:82-91
154. Evers SM, Ament AJ, Blaauw G. Economic evaluation in stroke research : A systematic review. Stroke. 2000;31:1046-1053
155. Porsdal V, Boysen G. Costs of health care and social services during the first year after ischemic stroke. International journal of technology assessment in health care. 1999;15:573-584
156. Porsdal V, Boysen G. Direct costs during the first year after intracerebral hem-orrhage. European journal of neurology. 1999;6:449-454
157. Wallesch C-W, Maes E, Lecomte P, Bartels C. Cost-effectiveness of botulinum toxin type a injection in patients with spasticity following stroke: A german perspective. European Journal of Neurology. 1997;4:S53-57
158. Radensky PW, Archer JW, Dournaux SF, O'Brien CF. The estimated cost of managing focal spasticity: A physician practice patterns survey. Neurorehabili-tation and neural repair. 2001;15:57-68

101
159. Ward A, Roberts G, Warner J, Gillard S. Cost-effectiveness of botulinum toxin type a in the treatment of post-stroke spasticity. Journal of rehabilitation medi-cine. 2005;37:252-257
160. Milholland AV, Wheeler SG, Heieck JJ. Medical assessment by a delphi group opinion technic. The New England journal of medicine. 1973;288:1272-1275
161. Allergan. Botox economic spasticity trial (best). Access date: 09/JAN/2009. http://clinicaltrials.gov/ct2/show/NCT00549783
162. Landstingsförbundet. Statistik om hälso- och sjukvård samt regional utveckling 2003. Verksamhet och ekonomi i landsting och regioner. Access date: 13/MAY/2009. http://brs.skl.se/brsbibl/kata_documents/doc35987_1.pdf
163. Stålhammar D, Starmark JE, Holmgren E, Eriksson N, Nordstrom CH, Fedders O, Rosander B. Assessment of responsiveness in acute cerebral disorders. A multicentre study on the reaction level scale (rls 85). Acta Neurochir (Wien). 1988;90:73-80
164. Starmark JE, Stålhammar D, Holmgren E. The reaction level scale (rls85). Manual and guidelines. Acta Neurochir (Wien). 1988;91:12-20
165. Brott T, Adams H, Jr, Olinger C, Marler J, Barsan W, Biller J, Spilker J, Hol-leran R, Eberle R, Hertzberg V. Measurements of acute cerebral infarction: A clinical examination scale. Stroke. 1989;20:864-870
166. Meyer BC, Hemmen TM, Jackson CM, Lyden PD. Modified national institutes of health stroke scale for use in stroke clinical trials: Prospective reliability and validity. Stroke. 2002;33:1261-1266
167. Adams HP, Jr., Davis PH, Leira EC, Chang KC, Bendixen BH, Clarke WR, Woolson RF, Hansen MD. Baseline nih stroke scale score strongly predicts outcome after stroke: A report of the trial of org 10172 in acute stroke treat-ment (toast). Neurology. 1999;53:126-131
168. Lyden P, Brott T, Tilley B, Welch KM, Mascha EJ, Levine S, Haley EC, Grotta J, Marler J. Improved reliability of the nih stroke scale using video training. Ninds tpa stroke study group. Stroke. 1994;25:2220-2226
169. Woo D, Broderick JP, Kothari RU, Lu M, Brott T, Lyden PD, Marler JR, Grotta JC. Does the national institutes of health stroke scale favor left hemi-sphere strokes? Ninds t-pa stroke study group. Stroke. 1999;30:2355-2359
170. Vachris MA, Thomas J. International price comparisons based on purchasing power parity. Monthly Labor Review Online. 1999;122:3-12
171. Organisation for economic co-operation and development (OECD). Purchasing power parities for gdp, 2003. Access date: 12/JUL/2009. http://stats.oecd.org/wbos/Index.aspx?datasetcode=SNA_TABLE4
102
172. Petrie A, Sabin C. Medical statistics at a glance. Oxford: Blackwell Science; 2001.
173. Kirkwood BR, Sterne JA. Medical statistics. Oxford: Blackwell Science; 2003.
174. Field A. Discovering statistics using SPSS. London: Sage publication; 2005.
175. Malmgren R, Warlow C, Bamford J, Sandercock P. Geographical and secular trends in stroke incidence. Lancet. 1987;2:1196-1200
176. Sudlow CL, Warlow CP. Comparing stroke incidence worldwide: What makes studies comparable? Stroke. 1996;27:550-558
177. Hill AB. The environment and disease: Association or causation? Proceedings of the Royal society of medicine. 1965;58:295-300
178. Platz T, Eickhof C, Nuyens G, Vuadens P. Clinical scales for the assessment of spasticity, associated phenomena, and function: A systematic review of the lit-erature. Disability and rehabilitation. 2005;27:7-18
179. Wade DT. Goal setting in rehabilitation: An overview of what, why and how. Clinical rehabilitation. 2009;23:291-295
180. Bouwens SF, van Heugten CM, Verhey FR. The practical use of goal attain-ment scaling for people with acquired brain injury who receive cognitive reha-bilitation. Clinical rehabilitation. 2009;23:310-320
181. Turner-Stokes L. Goal attainment scaling (gas) in rehabilitation: A practical guide. Clinical rehabilitation. 2009;23:362-370
182. Rodgers H, Shaw L, Price C, van Wijck F, Barnes M, Graham L, Ford G, Shackley P, Steen N. Study design and methods of the botuls trial: A random-ised controlled trial to evaluate the clinical effect and cost effectiveness of treating upper limb spasticity due to stroke with botulinum toxin type a. Trials. 2008;9:59
183. Ashford S, Turner-Stokes L. Management of shoulder and proximal upper limb spasticity using botulinum toxin and concurrent therapy interventions: A pre-liminary analysis of goals and outcomes. Disability & Rehabilitation. 2009;31:220-226
184. Ownsworth T, Fleming J, Shum D, Kuipers P, Strong J. Comparison of individ-ual, group and combined intervention formats in a randomized controlled trial for facilitating goal attainment and improving psychosocial function following acquired brain injury. Journal of rehabilitation medicine. 2008;40:81-88
185. Lord S, McPherson KM, McNaughton HK, Rochester L, Weatherall M. How feasible is the attainment of community ambulation after stroke? A pilot ran-domized controlled trial to evaluate community-based physiotherapy in subacute stroke. Clinical rehabilitation. 2008;22:215-225

103
186. Wade D. Stroke rehabilitaion: The evidence. In: Greenwood Jea, ed. Handbook of neurological rehabilition. Hove, East Sussex: Psychology Press; 2003:487-504.
187. Brashear A, Gordon MF, Elovic E, Kassicieh VD, Marciniak C, Do M, Lee CH, Jenkins S, Turkel C. Intramuscular injection of botulinum toxin for the treatment of wrist and finger spasticity after a stroke. The New England journal of medicine. 2002;347:395-400.
188. Pathak MS, Nguyen HT, Graham HK, Moore AP. Management of spasticity in adults: Practical application of botulinum toxin. European journal of neurol-ogy. 2006;13 Suppl 1:42-50
189. Sheean G. Is spasticity painful? European journal of neurology. 2009;16:157-158
190. Luengo-Fernandez R, Gray AM, Rothwell PM. Costs of stroke using patient-level data. A critical review of the literature. Stroke. 2009;40:e18-e23
191. Lundström E, TeréntA, Borg J. Prevalence of disabling spasticity 1 year after first-ever stroke. European journal of neurology. 2008;15:533-539
192. Wahlgren N. NIH stroke scale form. Access date: 09/MAY/2009. http://www.acutestroke.org/index.php?module=ContentExpress&func=display&ceid=28&meid=6#
193. Cassel G. Abnormal deviations in international exchange. The Economic Jour-nal. 1918
194. Fregart K, Jonung L. Makroekonomi : Teori, politik och institutioner. Lund: Studentlitteratur; 2005.
195. The People's Bank of China. Objective of the monetary policy. Access date: 12/JUL/2009. http://www.pbc.gov.cn/english/detail.asp?col=6630&ID=21
196. US Department of Treasure. Major foreign holders of treasure securities hold-ings. Access date: 12/JUL/2009. http://www.treas.gov/tic/mfhhis01.txt
197. Board of Governors of the Federal Reserve System. Foreign exchange rates (annual) 2003. Access date: 12/JUL/2009. http://www.federalreserve.gov/releases/g5a/20040102/
198. World Bank. Relative prices and exchange rates. Access date: 12/JUL/2009. http://devdata.worldbank.org/wdi2005/Table5_7.htm

-�� �)������ ����.�)������������ �������������� ������������������� ������� ����������������������������
�,��* �/� ���) �� /� 0��(.� �� ��,�)�
- ,�����. ,������) ���1 /� 0��(.� �� ��,�)�2 �����.��)�����2 � (�(�..� � �(11��� �� � )(1+�� �� ������3 - ��4����� �� /� ��1�.�� ,������) ��� ��� � 1�5�� �4�,�/�������/ .+�����2 4/.� /� �(11��� �.�)� � ,��+(�,)��)��)�..� /��(6/ /� ����� �6�. 7�1���/�)����(11���� �� �����.� �������)� ���1 /� 0��(.� ����,�)�3 89��� � :�)(���2 "##!2 /� ����� 4�� �(+.�/�,(),�� /� .� ;7�1���/�)��� �(11���� �� �����.��������)� ���1 /� 0��(.� �� ��,�)�<3=
���+(�)* �(+.���)�3((3��(�)*)+)*��*((*,��� #� '�
������������������� ���������� �
����