spatial and temporal determinants of forest...
TRANSCRIPT

1
SPATIAL AND TEMPORAL DETERMINANTS OF FOREST FIRES ON THE AMAZONIAN DEFORESTATION FRONTIER: IMPLICATIONS FOR CURRENT AND
FUTURE CARBON EMISSIONS
By
ANE AUXILIADORA COSTA ALENCAR
A DISSERTATION PRESENTED TO THE GRADUATE SCHOOL OF THE UNIVERSITY OF FLORIDA IN PARTIAL FULFILLMENT
OF THE REQUIREMENTS FOR THE DEGREE OF DOCTOR OF PHILOSOPHY
UNIVERSITY OF FLORIDA
2010

2
© 2010 Ane Auxiliadora Costa Alencar

3
To my parents and grandparents

4
ACKNOWLEDGMENTS
I would like to thank my advisor Dr. Daniel Zarin, for being supportive,
understanding, and providing me with essential guidance during the most important
moments of my academic life. I would also like to thank Dr. Greg Asner from the
Carnegie Institute at Stanford University for the excitement, the infrastructure, and the
intellectual and mentoring support kindly given to me during this time. Many thanks to
other members of my committee, Jack Putz, Wendell Cropper, and Chuck Wood, for
being so important to the development of my research and helping me to have a real
interdisciplinary experience.
Special thanks to Jennifer Balch, Paulo Brando, David Knapp, Daniel Nepstad,
Claudia Stickler and all the other researchers from the Amazon Environmental
Research Institute, Woods Hole Research Center and Carnegie Institute at Stanford
University, for their comments and valuable contributions to my dissertation. I also thank
the support of the NSF-DDRIG award 0727220, the NASA NESSF program grant
NNX07AN76H and NSF DEB-0410315, the Compton Foundation, the Tropical
Conservation and Development Program, the Florida Brazil Program, and the Amazon
Conservation Leadership Initiative Program at University of Florida. Without them, the
academic development I achieved and the completion of this research would not have
been at all feasible.
Finally, I thank my parents João and Erenice Alencar, brother, sisters and nieces
for always supporting my choices and being patient with my long absences. I thank all
my friends in Gainesville, specially the Brazilian community that helped me to feel close
to home. I also thank my dearest friends Isabel Castro, Candice Nelms, Lucimar Souza,
Iran Rodriguez, Angelina Howell and Raquel Dieguez, who helped me overcome such

5
challenging times. I feel, at last, thankful for the great people in my life and for all the
opportunities I was given.

6
TABLE OF CONTENTS
page
ACKNOWLEDGMENTS .................................................................................................. 4
LIST OF TABLES ............................................................................................................ 8
LIST OF FIGURES .......................................................................................................... 9
LIST OF ABBREVIATIONS ........................................................................................... 12
ABSTRACT ................................................................................................................... 13
CHAPTERS
1 INTRODUCTION .................................................................................................... 15
2 TEMPORAL VARIABILITY OF FOREST FIRES IN EASTERN AMAZON .............. 24
Introduction ............................................................................................................. 24 Methods .................................................................................................................. 27
Study Area and Data ........................................................................................ 27 Data .................................................................................................................. 28 Spectral Properties of Forest Fires ................................................................... 29 Mapping Forest Burn Scars (CLAS-BURN) ...................................................... 31 Burn Scar Temporal Variability and Relationship to Drought ............................ 34
Results .................................................................................................................... 35 The Spectral Properties of Forest Fires ............................................................ 35 Burn Scar Index (BSI) Maps ............................................................................. 36 Temporal Variability of Forest Fires .................................................................. 36 Burned Area and ENSO Events ....................................................................... 37
Discussion .............................................................................................................. 39 Conclusions ............................................................................................................ 43
3 CHANGING FOREST FIRE REGIMES IN THE BRAZILIAN AMAZON .................. 54
Introduction ............................................................................................................. 54 Materials and Methods............................................................................................ 58
Study Sites ....................................................................................................... 58 Data .................................................................................................................. 59 Fire Extent and Size ......................................................................................... 60 Fire Frequency and Interval .............................................................................. 61 Fire Seasonality ................................................................................................ 62 Fire Effects and Intensity .................................................................................. 62
Results .................................................................................................................... 63 Fire Extent ........................................................................................................ 63

7
Fire Size and Number ...................................................................................... 64 Fire Frequency and Interval .............................................................................. 65 Fire Seasonality ................................................................................................ 67 Fire Effects ....................................................................................................... 68
Discussion .............................................................................................................. 69 Conclusions ............................................................................................................ 73
4 FRAGMENTATION, DROUGHT AND FUTURE CARBON EMISSIONS FROM AMAZON FOREST FIRES ..................................................................................... 88
Introduction ............................................................................................................. 88 Materials and Methods............................................................................................ 91
Forest Type Case Studies ................................................................................ 91 Anthropogenic Landscape Characteristics and Forest Fires ............................ 92 Landscape Biophysical Characteristics and Forest Fires ................................. 94 Forest Fire Risk ................................................................................................ 95 Forest Fire Emissions ....................................................................................... 96
Results .................................................................................................................... 97 Deforestation and Forest Fires ......................................................................... 97 Roads and Forest Fire ...................................................................................... 98 Anthropogenic and Biophysical Landscape Variables and Fire Frequency ...... 99 Forest Fire and Climatic Conditions ............................................................... 100 Forest Fire Risk and the Potential for Fire Spread ......................................... 101 Forest Fire Emissions ..................................................................................... 103
Discussion ............................................................................................................ 104 Conclusions .......................................................................................................... 108
5 CONCLUSION ...................................................................................................... 123
Broader Implications of Future Amazonian Forest Fires ....................................... 127 Economic Incentives to Reduce Forest Degradation Caused by Fires ................. 131
LIST OF REFERENCES ............................................................................................. 134
BIOGRAPHICAL SKETCH .......................................................................................... 152

8
LIST OF TABLES
Table page 1-1. Definitions of main processes related to forest and carbon loss ......................... 23
2-1. Landsat imagery used in the multi-temporal analysis of forest burn scars in the Eastern Brazilian Amazon. ........................................................................... 44
2-2. Confusion matrix for forest burn scar mapping results and field validation. ........ 45
2-3. Forest area per burn frequency and average fire return interval and the percentage of forest area burned that was subsequently deforested. ................ 45
3-1. Principal characteristics of each of three forest types encountered in the eastern Amazon basin. ....................................................................................... 74
3-2. Annual burned and deforested areas from 1983 to 2007 for dense, open, and transitional forests. ............................................................................................. 74
3-3. Spatial and temporal main fire regime characteristics by study sites .................. 75
3-4. Linear regression models between forest canopy cover (PV), non-photosynthetic vegetation (NPV) and mean fire frequency (MFF) for three forest types (dense, open and transitional forests). ............................................ 76
4-1. Carbon density and proportion of carbon loss compared to unburned forest by distinct burn frequencies (1 time, 2 times and ≥ 3 times) by forest type. .... 110
4-2. Pearson correlation between fire frequency and anthropogenic (fragmentation, distance from roads and clearings) and biophysical (average PAW from 1996 - 2005) landscape characteristics. .......................................... 111
4-3. Logistic models resulting from the relationship between the integrated fire scar maps for alternate climate conditions in dense, open and transitional forest sites. ....................................................................................................... 112
4-4. Estimated CO2 emissions from deforestation and forest fires for the three forest types during the last 24 years ................................................................. 113
4-5. Estimated area at risk of burning, area burned and CO2 emissions by forest type and climatic conditions for the Brazilian Amazon. ..................................... 113

9
LIST OF FIGURES
Figure page 2-1. Landsat TM 5 false color composite of bands 5, 4, 3 (RGB) from September
13, 2007 of the study area. ................................................................................. 46
2-2. Diagram explaining the generation of the fire scar maps using CLAS-BURN. ... 47
2-3. Sample image (12x12km) demonstrating results from the (A) photosynthetic vegetation - PV, (B) non-photosynthetic vegetation - NPV and (C) shade/burn - SB Fractions retrieved from CLAS-BURN. ....................................................... 48
2-4. Mean spectral signature of recent burned areas (6 to 10 months after the fire event; Red line), old burn scar areas (18 to 22 months after the fire event; Green line) and undisturbed forest areas (Black line). ........................................ 49
2-5. Fractions cover (photosynthetic vegetation - PV, non-photosynthetic vegetation - NPV and shade/burn – SB) and burn scar index (BSI) trajectory from 1983 to 2006. ............................................................................................. 50
2-6. Distribution of burn scar index (BSI) values extracted from the sample according to forest burn condition (old burns = 18- 22 months after the fire; recent burn = 6-10 months after the fire). ........................................................... 50
2-7. (A) Forest areas affected by fire that are still standing and were deforested during 1983-2007 ............................................................................................... 51
2-8. Forest area burned, average annual Multivariate ENSO index (MEI) rank, and total annual rainfall. ..................................................................................... 52
2-9. Relationship between area burned with total annual rainfall (A) and number of days without rain during the 3 driest months of the year (Aug/Sep/Oct). ........ 53
3-1. Study sites location by forest type (A – Dense forest, B- Open forest and C – Transitional forest) showing the spatial distribution of the forest areas affected by fire and deforestation from 1983 to 2007. ........................................ 77
3-2. Annual distribution of forest area and proportion of the forest area affected by fire in the (A) Dense, (B) Open and (C) Transitional forests. .............................. 78
3-3. Forest area burned (A) and proportion of forest area burned by forest type and (B) by year .................................................................................................. 79
3-4. (A) Proportion of total area burned and (B) average annual area burned by fire size and forest type. ..................................................................................... 80

10
3-5. Proportion of the burned area affected by different burn frequencies by forest type. .................................................................................................................... 81
3-6. Spatial distribution of the forest areas affected by fire in different frequencies from 1983 to 2007 for (A) dense forest, (B) open forest and (C) transitional forest. ................................................................................................................. 82
3-7. Proportion of the forest area burned more than once by fire interval and forest type (A – Dense forest, B – Open forest ,and C – Transitional forest). ..... 83
3-8. Monthly box plot distribution of hot pixel counts and total monthly rainfall from June to November for the period of 1992 to 2007 by forest type (A and B – Dense forest; C and D– Open forest ; E and F– Transitional forest). ........... 84
3-9. Tendency of hot pixel increase for the two months of highest fire incidence in dense (A), open (B) and transitional forest (C). .................................................. 85
3-10. Linear regression model between satellite-based forest canopy cover (PV) and mean fire frequency (MFF) including data from the three forest types in this study (dense, open and transitional forests; R2 =0.65; P< 0.0001). ............. 86
3-11. Distribution of satellite-based forest canopy cover estimates by mean fire frequency in dense (A), open (B), and transitional (C) forests. ........................... 87
4-1. Study sites located along the PA-150 and BR-158 road corridor representing a gradient of forest structure (IBGE 2004) and soil plant available water- PAW (Nepstad et al. 2004).. ............................................................................. 114
4-2. Total annual rainfall anomaly from 1984 to 2008 for the three study sites (A) Dense forest, (B) Open forest and (C) Transitional/ Seasonal forest.. .............. 115
4-3. Scheme of forest fire risk probability surface calculation for the wet, average and dry years climatic conditions, integrating 24 years of burn scar maps. ...... 116
4-4. Proportion of the area burned by fire frequency within each km distance from the forest clearings in (A) Dense, (B) open and (C) transitional forest sites. .... 117
4-5. Proportion of the area burned by fire frequency within each km distance from roads in (A) Dense, (B) open and (C) transitional forest sites. ......................... 118
4-6. Relationship between proportion of the total area burned and distance from federal, state and municipal roads in (A) Dense, (B) open and (C) transitional forest sites. ....................................................................................................... 119
4-7. Integrated area burned (in red) from years of high total annual precipitation (Wet), average precipitation (Average), and low precipitation (Dry), for the dense (A), open (B) and transitional (C) forest sites. ........................................ 120
11
4-8. Forest fire probability maps developed for (A) wet and (B) average and (C) dry years, .......................................................................................................... 121
4-9. Proportion of the area burned by forest type in wet, average and dry rainfall years. ................................................................................................................ 122

12
LIST OF ABBREVIATIONS
BSI Burn Scar Index, an index developed to map forest fire burn scars
CLAS Carnegie Landsat Analysis System
CLAS-BURN Carnegie Landsat Analysis System to map forest fire burn scars
ENSO El Niño Southern Oscillation
FC Fire cycle
FRI Fire return interval
GPS Global Positioning System
MBA Mean annual burned area
MEI Multivariate ENSO index
MFF Mean fire frequency
MFR Maximum fire recurrence
MMFS Mean annual maximum fire size
MNFS Mean annual number of fire scars
NAO North Atlantic Oscillation
NPV Non-photosynthetic vegetation
ONI Oceanic Niño Index
PV photosynthetic vegetation
SB Shade/Burn Fraction of a pixel covered by the spectral response of fire and the shade fraction

13
Abstract of Dissertation Presented to the Graduate School of the University of Florida in Partial Fulfillment of the Requirements for the Degree of Doctor of Philosophy
SPATIAL AND TEMPORAL DETERMINANTS OF FOREST FIRES ON THE
AMAZONIAN DEFORESTATION FRONTIER: IMPLICATIONS FOR CURRENT AND FUTURE CARBON EMISSIONS
By
Ane Auxiliadora Costa Alencar
December 2010
Chair: Daniel Zarin Cochair: Francis E. Putz Major: Forest Resources and Conservation
Widespread forest fires in Amazonia were historically rare and associated only
with extreme droughts. In contrast, recent deforestation, fragmentation, and degradation
have increased forest susceptibility to fires and promoted changes in regional fire
regimes. These changes demonstrate the importance of fire as a driver of landscape
transformation in a scenario of a warmer climate and higher anthropogenic pressure.
Historical forest fire data are fundamental to determine the degree to which land use
change and climate conditions, particularly droughts, have affected fires in the region
and their associated carbon emissions. In this study, 24 years (1983-2007) of annual
forest fire scar maps and 16 years of monthly hot pixel data (1992-2007) were used to
explore the main characteristics and changes in the fire regimes of ~5.8 million ha of
dense, open, and transitional forests in the eastern portion of the Amazon Basin. Over
this period forest fires affected 15% (0.3 million ha), 44% (1 million ha), and 46% (0.6
million ha) of dense, open, and transitional forest area, respectively. During recent years
there was an increasing trend in total forest area burned and individual fire scar size in
14
open and transitional forests, while in dense forest, fires were mostly coincident with
strong ENSO events. Forest fires were on average twice as frequent in transitional and
open forest than in dense forest, with longer average return intervals for the latter. In all
three forest types seasonality changed in very dry years, with burn events delayed
about a month, and increased total area burned, size of individual burn scars, and fire
intensity. The study regions are already experiencing major changes in fire regimes
related to decreasing regional rainfall and increasing ignition sources and
fragmentation. Such changes indicate enhanced forest susceptibility to new fires, with
committed emissions amounting to an average of 76% of the annual CO2 emissions
from deforestation for the entire period, and with potential to be 3 times higher in years
of extreme drought. These findings suggest that there will be large increases in forest
fire CO2 emissions in a future of drier climate and enhanced human pressure on the
remaining Amazon forests.

15
CHAPTER 1 INTRODUCTION
Projections of global climate change have raised scientific and public awareness
about the fate of the world’s ecosystems in terms of changes in precipitation,
temperature, seasonal drought and forest fires (IPCC 2007). All of these changes are
expected to affect the structure and composition of natural vegetation (Cochrane and
Barber 2009), along with its distribution (Salazar et al. 2007), and productivity (Nemani
et al. 2003), which all amplify the effects of climate change through changes in the
natural carbon cycle (Heimann and Reichstein 2008). The Amazon has an important
role in this context. Accounting for half of the world’s tropical forests and one tenth of
the total terrestrial carbon stocks, the region is expected to experience temperature
increases and moderate to severe reductions in precipitation(Cox et al. 2000, Cox et al.
2004, Cox et al. 2008). A warmer and drier Amazonian climate, as predicted by climate
vegetation models, is likely to lead to drought-induced forest “die back” (Huntingford et
al. 2008), widespread occurrence of forest and deforestation fires (Poulter et al. 2009),
and further increases in atmospheric CO2 and consequent warming (Costa and Foley
2000).
The effects of global warming on Amazon forests, such as drought and forest fires,
can be intensified by deforestation and land-use change and other processes that affect
the depletion of forest carbon stocks (Table 1-1). Deforestation promotes further
warming and decreases in regional precipitation through changes in surface roughness,
air mass convection, and increased aerosols from smoke plumes due to anthropogenic
burning (Koren et al. 2004, Artaxo et al. 2005, Da Silva et al. 2008). Moreover,
conversion of Amazon forests to grass-dominated landscapes can impact extra-tropical
16
regions, influencing the seasonal rainfall pattern of Eurasian and North American
regional climates (Gedney and Valdes 2000, Werth and Avissar 2002, Snyder 2010).
The coupled effects of climate and land-use change may contribute to accelerating the
reduction of regional forest cover through forest degradation and “die back” (Betts et al.
2008).
Deforestation fires (i.e., fires set for the purpose of clearing forest lands) represent
the main source of ignition for anthropogenic forest fires in the region (Cochrane 2003).
From 1980-2005, the intensification of human activities in the Amazon promoted high
deforestation rates and provoked changes in landscape configuration due to forest
fragmentation (Nepstad et al. 2001, Wood and Porro 2002). Deforestation was
accelerated by road infrastructure and globalization of regional production. Roads
penetrating the rainforest facilitate human access to forest resources, thereby
intensifying exploitation and land occupation and, thus, the spread of deforestation and
fire (Carvalho et al. 2001, Laurance et al. 2001, Nepstad et al. 2001). The expansion of
Amazonian soybean and beef exports in global markets drove deforestation as more
and more forestland was converted to these uses (Nepstad et al. 2006a, Nepstad et al.
2009, Zaks et al. 2009).
Even though deforestation rates decreased dramatically in the past four years
(decreasing from 27,772 km2 in 2004 to an average of 11,578 km2 yr from 2006 to
2009), fire occurrence (i.e. forest fires and accidental fires in pasture and crop fields)
has the potential to increase. Although the extent of new cleared areas has decreased
in size over this time period, the number of new small clearings is markedly higher. In
2004, new small clearings (< 60 ha) represented 20% of the area deforested; today,
17
they represent 72%. It is very likely that this pattern of deforestation is linked to
smallholders and government-sponsored settlers and is likely to continue to increase,
since more settlements are planned for the region (Pacheco 2009). This will also
increase the risk of ignition to surrounding forests, since the main production tool used
by these agents of deforestation is fire. More sources of ignition in fragmented
landscape have the potential to generate forest fires even if deforestation is reduced.
In this context of climate change, accelerated deforestation, and high forest
fragmentation, the main threat to Amazon forests and regional economic and social
sustainability is uncertainty regarding the degree of future forest degradation caused by
recurrent forest fires and logging (Table 1-1). Massive de-population of native
indigenous populations associated with European colonization (Sanford et al. 1985) left
large tracts of undisturbed dense forests in the Amazon that were resistant to forest
fires even under drought conditions. This resistance is due to their ability to maintain
dense leaf canopies by absorbing moisture stored deep in the soil and maintaining the
internal humid microclimate (Uhl and Kauffman 1990, Nepstad et al. 1994, Nepstad et
al. 1995). This “natural fire break” characteristic is embedded in the logic of swidden
agriculture and fire management in the Amazon, which uses fire as the main agent of
transformation of forest biomass to livestock and crop production fields (Nepstad et al.
1999a). Over time, however, the use of management fires promotes the expansion of
low maintenance and low productivity pastures which occupy about 70% of the
deforested area in the region (Kaimowitz et al. 2004, Foley et al. 2007).Furthermore,
progressive degradation and fragmentation of the landscape through such fires have
reduced the resistance of forests to fire as the indiscriminate spread of forest fires and

18
the high chance of accidental fires in the landscape act as disincentives to fire-free land-
uses, such as perennial crops and mechanized cattle ranching and crop fields, that
usually require larger investments and higher-value production (Nepstad et al. 2001,
Margulis 2003).
The extent of anthropogenic forest fires in tropical forests seems to be strongly
associated extreme drought caused by ENSO events (Siegert et al. 2001, Alencar et al.
2004b), and other climatic phenomena such as the North Atlantic Oscillation (Marengo
et al. 2008, Zeng et al. 2008). Droughts such as the ones in 1998 and 2005 promote
canopy openness, reducing the leaf area index (LAI) which increases incoming solar
radiation and the amount of fuel material (Ray et al. 2005, Nepstad et al. 2007)and tree
mortality (Brando et al. 2008), and promote changes in phenological responses and
“greening-up” (Saleska et al. 2007, Asner and Alencar 2010). These extreme drought
years also correlate positively with higher fire activity and burns (Aragão et al. 2007).
There are indications that droughts are becoming more frequent and intense in the
region (Trenberth and Hoar 1997, Timmermann et al. 1999).
The effects of fire in tropical forests include increasing vulnerability of forests to
recurrent fire occurrence (Nepstad et al. 1995, Cochrane et al. 1999, Alencar et al.
2004b), change in structure and composition (Cochrane 2003), damage to faunal
populations (Barlow et al. 2002, Peres et al. 2003), and increases in both direct and
committed CO2 emissions (Alencar et al. 2006). All of these effects also contribute to
decreasing the value of forests to society and create incentive for substituting forest with
other land uses. Moreover, escaped deforestation and forest fires also generate
economic costs to society estimated in 0.2 percent of the Amazon GDP (Mendonça et

19
al. 2004). These costs include airport closures and an increase in road accidents due to
excessive smoke. In addition, loss of infrastructure (i.e. fences), agriculture and
livestock production, and increasing incidence of smoke-induced respiratory illness are
also considered in the calculation of economic loss (Nepstad et al. 1999a, Barbosa and
Fearnside 2000, Mendonça et al. 2004).
Forest fire science is still under-developed in the Amazon region. Most studies
investigate the effects forest fires from an ecological perspective in terms of impacts on
mortality, structure and composition (Cochrane and Schulze 1999, Gerwing 2002,
Barlow et al. 2003, Haugaasen et al. 2003, Balch et al. 2008, Barlow and Peres 2008,
Balch et al. 2009). Very few studies deal with the spatial and temporal dimensions of
forest fires in the region (Cochrane et al. 1999, Alencar et al. 2004b), and only a few
attempt to address relationships between forest fires and land-use change (Holdsworth
and Uhl 1997, Nepstad et al. 1999b). There are no comprehensive studies that integrate
all aspects of forest fire regimes, including frequency, interval, seasonality, and burn
intensity, nor do any investigate differences in fires regimes in distinct forest types.
Finally, to date there is no model that integrates the components of ignition and
flammability status of the forest to predict forest fire risk under extreme climatic
scenarios.
Another poorly understood aspect of forest fire spread in the Amazon is the
threshold at which land-use change and deforestation start to play a dominant role in
driving forest fires in the absence of an extreme drought event, or even if such a
threshold exists. It is possible that the eastern Amazon landscape has already crossed
the tipping point where biophysical conditions such as climate and vegetation structure

20
start to play a smaller role in determining forest fire occurrence and spread, and
anthropogenic deforestation and fragmentation maintain the fire-prone landscape.
Observed changes in local fire regimes combined with remaining uncertainties about
interactions between different landscape and climate elements underscore the
increasing importance of fire as driver of current and future landscape transformation
under a scenario of warmer climate and higher anthropogenic pressure throughout the
Amazon.
The study presented here responds to several of these questions such as: What is
the actual area affected by forest fires and what is the spatial and temporal variation of
forest fires in eastern Amazon? How different fire is affecting the three main Amazon
forest types (i.e. dense, open and transitional)? What are the main undergoing changes
in fire regimes in these forest types in relation to frequency, interval, seasonality, and
burn intensity, and how they contribute to forest degradation? What are the main
determinants of forest fire occurrence? How they interact with extreme climatic
conditions? What would be the contribution of forest fires to CO2 emissions under
extreme climatic scenarios?
These questions above are key to contribute to increasing the overall
understanding of current and future changes in forest fire regimes in a portion of the
Amazon region that is already highly deforested and undergoing major changes in
seasonal drought patterns in response to local and global climate regime change. In
addition, the present study addresses questions related to the role of forest fires and
forest degradation in stimulating deforestation, revisits the fire feedback recurrence
hypothesis to include areas with relatively low anthropogenic impacts, the role of

21
fragmentation in altering the likelihood of forest fires, and describes the impacts of
temporal climate variability in promoting large-scale forest fires. All of these questions
were addressed based on relationships between past forest fires and biophysical and
human landscape characteristics in three distinct landscapes along the eastern border
of the Amazon’s “Arc of Deforestation.” These 3 regions represent gradients of seasonal
drought, forest structure, and fragmentation in the portion of the Amazon basin most
threatened by climate change and anthropogenic pressure (Soares Filho et al. 2006,
Malhi et al. 2008, Malhi et al. 2009, Soares Filho et al. 2010).
The analyses carried out for this study are presented in three chapters, including a
systematic and quantitative examination of the interactions among the biophysical and
human-related variables and their influence on the spatial distribution, extent, timing,
and effect of forest fire occurrence. The biophysical elements include variations in forest
structure (Alencar et al 2006; IBGE 2001) and plant available water (Nepstad et al.
2004), whereas the human-related elements incorporate deforestation, fragmentation,
and the likelihood of ignition. Chapter 2 presents a novel methodology to map high
resolution satellite-based forest fire scars from a long time-series. Chapter 3 builds on
the information acquired from the historical burn scar dataset to explore changes in fire
regimes in three different forest types of the eastern Amazon. Chapter 4 uses the fire
regime information to derive spatial and temporal relationships between fire, landscape
fragmentation, and drought to estimate CO2 emissions under distinct climate extremes.
This work is based on 24 years (1984-2008) of forest burn scar maps based on
each of 3 Landsat scenes. The study period was chosen to include dry and wet years
and to capture the influence of phenomena such as El Nino and other climatic
22
variations. These maps were derived from a new algorithm called CLAS-BURN,
developed specifically for this study and derived from a satellite image-based sub-pixel
fraction analysis approach described in Chapter 2. These fire scars were used to
investigate recent changes in fire regime such as major deviations in fire extent,
frequency, interval, seasonality, and effects on canopy cover as seen by satellite
images as described in Chapter 3. In addition, the burn scars were further used to
identify the set of conditions under which fire occurred, generating logistic functions
which were subsequently used to develop predictive models that explain the spatial and
temporal distribution of understory fire in the region. These models were used to (1)
identify areas at higher risk for such fires, (2) simulate future scenarios of understory
fires under alternate climate conditions, and (3) estimate current and potential CO2
committed emissions, as presented in Chapter 4. In addition to increasing the accuracy
of area and CO2 emission estimates associated with forest fires in the region, this work
provides key contributions to the understanding of forest fire feedback dynamics with
deforestation, fragmentation, and climate, which is critical for determining levels of
forest degradation and ecological tipping points, and for helping to promote more
effective fire prevention and control public policies.
Lastly, the results of this study also have implications for policies for Reducing
Emissions from Deforestation and (Forest) Degradation (REDD) (Gullison et al. 2007,
Nepstad et al. 2009, Strassburg et al. 2009), improving understanding and the potential
for monitoring the second “D” in REDD, which is often neglected or analyzed together
with the first “D”, deforestation (Aragão and Shimabukuro 2010).

23
Table 1-1. Definitions of main processes related to forest and carbon loss Definition Causes References
Deforestation or forest clear cut
Long term loss of more than 30% of forest canopy cover
Cattle ranching, Crop production, and Road expansion
(FAO 2001) (Putz and Redford 2010) (Griscom et al. 2009a)
Degradation Loss of carbon, biodiversity and/or function through processes derived from reduction of 10 to 30% of the forest canopy cover
Logging and Anthropogenic forest fires
(FAO 2001) (Putz and Redford 2010) (Griscom et al. 2009a)
Logging Selective harvest of economic valuable timber
Conventional high intensity harvest, and reduced impact logging
(Pereira et al. 2002) (Johns et al. 1996)
Anthropogenic Forest fires
Understory or surface fires that eventually get to the overstory canopy depending on the frequency and intensity
Escaped fires from agriculture fields or anthropogenic related activities such as logging, hunting
(Nepstad et al 1999) (Alencar et al 2004) (Arima et al. 2007)
Wildfires Natural ignited fires understory or crown fires
Naturally caused by lightening
(Sanford et al. 1985) (Meggers 1994)
24
CHAPTER 2 TEMPORAL VARIABILITY OF FOREST FIRES IN EASTERN AMAZON
Introduction
Forest fires in the Amazon Basin are known to be naturally associated with
extreme drought events, such as the Mega-El Niños that have affected the region since
pre-Columbian times (Sanford et al. 1985, Meggers 1994). In the past, Amazonian
forest fires were rare due to small numbers of anthropogenic ignition sources and the
ability of intact old-growth forests to maintain sufficiently moist microclimates to prevent
fire spread even during dry seasons (Goldammer 1990, Uhl and Kauffman 1990). In
contrast, with intensification of human activities associated with deforestation and
logging over the past 30 years in the Amazon, coupled with increased numbers of
ignition sources, especially fires escaping from neighboring agricultural fields, fires have
become much more frequent and widespread across the Basin (Uhl and Kauffman
1990, Cochrane 2001, Nepstad et al. 2001).
In addition to deforestation and uncontrolled logging, extreme droughts associated
with the El Niño Southern Oscillation (ENSO) and other sea surface anomalies have
rendered fire one of the major forces behind tropical forest impoverishment (Nepstad et
al. 1999b, Cochrane 2003). For example, during the severe drought of 1997/1998,
forest fires affected an area of ~39,000 km2 in the Brazilian Amazon, about two times
larger than the area lost by deforestation during those years (Alencar et al. 2006).
Once a forest patch has burned, the likelihood of being burned again increases.
Recurrent and subsequent forest fires can promote changes in forest structure and
composition, killing many large trees and leading to further degradation and the
establishment of light-demanding species (Cochrane and Schulze 1999, Barlow et al.

25
2003, Haugaasen et al. 2003, Blate 2005). In contrast, if a forest area burns too
frequently, such as often occurs in the transitional forest along the fringe of Amazonia, a
lack of fuel can actually decrease forest flammability (Balch et al. 2008) unless the area
is invaded by African pasture grasses or native bamboos (Veldman et al. 2009).
Although the impacts of recurrent fires on forest structure have been measured,
the long history of previous fires, including extent and variability, has not be adequately
documented. Historical data on the location and extent of forest fires can be derived
from burn scar maps retrieved from remote sensing images, which are fundamental to
determining the extent of the areas recurrently burned. Moreover, the ability to map
forest burn scars over time is central to understanding changes in the spatial and
temporal variability of such fires and determining the vulnerability of forests to new fire
events (Kennedy et al. 2007). Once mapped, forest burn scars can also be used to
reveal the drivers and landscape characteristics that influence forest fire occurrence and
extent (Alencar et al. 2004b).
Although remote sensing products have been developed to map and monitor fire
frequency (Dwyer et al. 2000, Eva and Lambin 2000, Van der Werf et al. 2004, Riaño
et al. 2007), none have been used to provide long-term and high spatial resolution
understory fire burn scar maps in tropical forest areas. Temporal analyses of moderate
and coarse spatial resolution of multi-spectral remote sensing products have been used
as a consistent method to capture and map forest fire scars over time, mainly in non-
tropical parts of the globe (Goetz et al. 2006, Kennedy et al. 2007, Loboda et al. 2007,
Röder et al. 2008). These maps were usually retrieved from change detection routines
of band ratios, vegetation indexes, and unsupervised or supervised classification
26
analysis, associated with post-fire responses from NIR and SWIR spectral channels
(Tansey et al. 2008, Giglio et al. 2009). In Amazonia, most of the information on fire
location and frequency has been based on satellite thermal data at high temporal but
coarse spatial resolutions (Setzer and Pereira 1991, Prins et al. 1998, Justice et al.
2002, Schroeder et al. 2005). While these data are useful for indicating areas where fire
activity mostly related to deforestation and land use management is occurring, they are
not reliable enough to provide the area burned or to indicate the occurrence of
understory fires since they cannot detect changes in temperature under the canopy
(Eva and Lambin 1998, Giglio et al. 2006).
To capture the real extent of forest fires over a period of time and relate that to
annual changes in climatic conditions, annual burn scar maps are needed. The
ephemeral characteristic of the fire spectral response signal (up to 1 or 2 years after the
fire) can lead to loss of fire information crucial to the determination of the temporal
variability of forest fire. Up-to-date forest burn scar maps have only been developed for
single dates or discontinuous time-series and only for a few areas in the Amazon basin
(Cochrane and Souza Jr. 1998, Nelson and Irmão 1998, Barbosa and Fearnside 1999,
Cochrane et al. 1999, Aragão et al. 2007, Shimabukuro et al. 2009). However, none
provide long annual time-series analysis of estimates of forest fires based on forest burn
scars. An historic Basin-wide estimate of burned area is still lacking, and a long annual
time-series analysis of forest burn scars has yet to be developed.
For this Chapter, I developed a method to map historical forest burn scars was
developed based on high-resolution remote sensing data that can be expanded to the
rest of the Basin. A compilation of historical Landsat satellite imagery was prepared,

27
specifically selected to include dry and wet years and to capture the effects of climatic
phenomena such as ENSO, to examine the temporal distribution and extent of forest
fires and the rate of deforestation of areas degraded by fires in a fragmented forest area
in the eastern Amazon Basin. Burn scar extent, average frequency and fire return
interval represent three characteristics of fire regimes that are critical to understanding
the role of fire in tropical forest degradation. This information is also key to enhancing
the accuracy of carbon flux estimates under future scenarios of climate change and
more frequent forest fires.
Methods
Study Area and Data
The study area is represented by Landsat scene path/row 223/62 located in the
eastern portion of the Brazilian Amazon. This region, which is dissected by the
highways BR-010 (Belém-Brasilia) and the parallel PA-150, contains one of the oldest
and most important logging centers in the Amazon (Figure 2-1). The area is dominated
by tall evergreen dense forest (25-35 m tall), with aboveground forest biomass
averaging 360 Mg ha-1 (Gerwing 2002). The climate is humid tropical, with average
rainfall of 2200 mm yr-1 and a distinct dry season between June and November (Villar et
al. 2009). The topography is hilly and dominated by clay red-yellow Latosols along
hilltops and sandy and yellow Latosols in low-lying areas (RADAMBRASIL 1981). The
forest has been extensively but fairly lightly logged and highly fragmented by mosaics of
cattle ranching and agricultural settlements mainly in the eastern and western edges of
the study scene (Verissimo et al. 1992); in 2007 only 55% of the original forest was still
standing. Although located in one of the most deforested and highly logged areas of the
28
Amazon Basin, it is in this study area where some of the largest forest fragments in the
eastern part of the Basin are found.
Data
I compiled 23 images in consecutive years acquired from the Landsat 5 Thematic
Mapper (TM) and Landsat 7 Enhanced Thematic Mapper Plus (ETM+) sensors (Table
2-1). The images were selected to detect fires that occurred from 1983 to 2006 (except
1986). Thus, for each year of the time series, one image was selected to map the
previous burn year. The period used for the image selection was between late May and
early August, which represents the beginning of the dry season when there is little
cloud cover and is prior to the burning season, which brings hazy conditions (Asner
2001). Few images (1988, 1998, 2002 and 2007) were acquired as late as September
due to the lack of cloud free images earlier than the early burning seasons of those
years (Table 2-1). The use of September images did not compromise the results since
the peak of burning in this area is at the end of the dry season (October/November).
This time series incorporates data from dry and wet years, making it possible to
capture the influence of severe droughts such as those associated with ENSO events.
The selection of the images used to capture forest fires during ENSO events was based
on the agreement between the results of the ENSO indexes: Oceanic Niño Index (ONI)
and the Multivariate ENSO index (MEI) (Wolter and Timlin 1998, Xue et al. 2003).
These indexes are derived from a series of measurements that include tropical Pacific
sea surface and atmospheric conditions. According to them, the strong ENSO events in
the last three decades occurred in 1982/1983, 1991/1992 and 1997/1998, while
moderate ENSO events occurred in 1986/1987, 1994/1995 and 2002/2003
(http://ggweather.com/enso/oni.htm). Thus in this study, the forest fires that occurred
29
during strong ENSO years were captured by the 1984, 1993, and 1999 images, while
the images of 1988, 1996 and 2004 captured the forest fires that occurred during
moderate ENSO events.
The Landsat images were co-registered based on a 2001 geo-orthoreferenced
image used by Asner et al. (2004). The image co-location accuracies were less than
one pixel. The data were calibrated to top-of-atmosphere radiance using the published
channel response coefficients and the known solar zenith angles at the time of
acquisition (Asner et al. 2005). The conversion of radiance to apparent surface
reflectance allows assessment of the temporal variability of radiative energy in each
wavelength for each pixel location, as well as among different pixel locations (Vermote
et al. 1997). The images were converted to apparent at surface reflectance using 6S on
each scene. 6S works best with an estimate of aerosol optical thickness and column
water vapor. In addition, monthly averages of aerosol optical thickness and column
water vapor from MODIS were used for the month in which each image was collected.
For scenes that were collected when MODIS data were not available, the month from
the closest year of available data was used.
Spectral Properties of Forest Fires
Changes in the post fire spectral properties such as quality of fuel combustion,
rates of regeneration and tree mortality are extensively documented in the burn severity
literature for non-tropical forest ecosystem (Diaz-Delgado et al. 2003, Van Wagtendonk
et al. 2004, French et al. 2008). Although the post fire ecological effects have been well
documented for the region, long term changes in the spectral response due to fire
effects in the Amazon tropical forest still need to be improved. The existing short term
understory forest fire spectral data suggests that, spectral response of forest fires in the

30
Amazon rainforest is ephemeral, decreasing rapidly the ability to be captured by the
multispectral sensors more than one year after the burn event (Souza et al. 2005) . This
happens since the spectral changes in a recently burned standing tropical forest are
expected to be a product of the quality of fuel combustion (Cochrane and Schulze 1999,
Balch et al. 2009), decreases in LAI from fire-caused pulses of leaf loss (Ray et al.
2005), and immediate killing of some trees (Haugaasen et al. 2003). These three
elements affect the amount of ash/charcoal on the forest floor and cause changes in
forest moisture content (Eva and Lambin 1998) and the fraction of live and dead
biomass covering the soil (Souza et al. 2003). During the wet season following the fire,
the recovery of the vegetation commences with pioneer colonization (Cochrane and
Schulze 1999, Barlow and Peres 2008), and the early fire spectral responses begin to
disappear.
The time period in which burn scars are detectable can be prolonged depending
on the intensity of the burn. Fire intensity affects fuel consumption, and promotes
change in soil color, canopy openness, tree mortality, char height and other post-fire
characteristics that are commonly used to estimate burn severity with remote sensing
modeled data (De Santis and Chuvieco 2007). Long-term spectral signals (1-3 yr) of
previously burned forest can be observed as a result of delayed tree mortality and
homogeneity of post-fire recruitment, which also probably vary with fire intensity.
The spectral bands most sensitive to combustion (charcoal and ash) and
changes in green vegetation are found in the near and mid-infrared (Chuvieco et al.
2002). These bands (0.7 to 0.9µm for NIR and 1.0 to 2.6 µm for MIR) have been widely
used to map burn scars and to assess burn severity, mostly in non-tropical areas, using
31
normalized differences and band ratios that are sensitive to changes in vegetation and
moisture content (Eidenshink et al. 2007, Hudak et al. 2007, Lozano et al. 2007). The
burn scar field and map dataset was used to identify the spectral bands that would
respond best in identifying recent and old burn scars, and confirm that the spectral
properties of fire effects widely documented for non-tropical forest areas are also
suitable to be applied to the Amazon dense forest.
Mapping Forest Burn Scars (CLAS-BURN)
Twenty-three years of consecutive burn scars were mapped using spectral mixture
analysis techniques. The images were calibrated using the Carnegie Landsat Analysis
System (CLAS), a system developed for atmospheric correction and fractional cover
mapping of Landsat data (Asner et al. 2005a). This system was originally used to
detect disturbances in forest canopy mainly caused by logging (Asner et al. 2004, Asner
et al. 2005b) but can handle large datasets in a fast, comprehensive and comparable
way, making it ideal for long time-series analyses. CLAS is based on a Monte Carlo
mixture modeling approach to select endmembers that determine the fractions of a pixel
that contain photosynthetic vegetation (PV), non-photosynthetic vegetation (NPV), and
bare soil. The bare soil substrate fraction in CLAS was substituted with a shade fraction
named shade/burn, to distinguish the canopy disturbances caused by fire from those
caused only by logging. This adaptation was done to decrease the detection of logging
disturbances associated with the soil and NPV fractions, and to enhance the detection
of burned areas. Different from PV, NPV and bare soil fraction that represent real
biophysical elements, shade/burn is an “apparent” fraction used here to indicate an area
that has been burned or is not receiving direct sunlight. The shade/burn endmember is
defined in the new CLAS algorithm as having zero reflectance in all spectral bands.

32
The land cover types associated with this endmember include shade and areas that are
severely burned. Thus, the Shade/burn fraction is the result from the enhanced shade
promoted by the increased canopy gaps from dead burned trees, and dark burned soil
signal. The shade fraction has already been used to map forest burn scar (Shimabukuro
et al. 2009) due to its sensitivity to capture the response of resulting burn materials (ash
and charcoal), as well as its ability to detect the heterogeneity of the forest canopy
resulting from the fire. The heterogeneity of the burned forest canopy is a result of the
increase in the shade response caused by many new irregular canopy gaps formed by
leaf shedding and dead standing trees due to fire (Cochrane and Schulze 1999). As a
result, the shade fraction captures the geometry and borders of the burned forest areas.
This method for creating a new set of fractions to map forest burn scars is called
CLAS-BURN. In CLAS-BURN the soil fraction is replaced by a shade/burn (SB) fraction
changing the relative distribution of the NPV proportion in burned areas. In CLAS-BURN
part of the NPV and the soil responses in the original CLAS fractions were assigned to
the new SB fraction, increasing the relative importance of this third fraction in
comparison to the others to detect burn scars. The fraction results from CLAS-BURN
are used to create an index image for each year that becomes the main source of burn
scar mapping (Figure 2-2). This index called burn scar index (BSI) creates an image
that is based on the normalized difference between PV, NPV and SB (Figure 2-2 and 2-
3), according to the following formula:
𝑩𝑺𝑰 =𝑷𝑽 − 𝑵𝑷𝑽 + 𝑺𝑩𝑷𝑽 + 𝑵𝑷𝑽 + 𝑺𝑩
The 23 Burn Scar Index (BSI) images generated from CLAS-BURN had their
forest areas annually masked to eliminate from the analysis evidence of burning in

33
deforested areas. The annual forest masks were retrieved from unsupervised
classification using the ISO-data algorithm in ENVI ® (ITT Inc., Boulder CO USA). This
classification routine was used to separate and mask out the forest areas covered by
clouds and lost by deforestation, resulting in a layer of observed forest for each year of
the time series used to retrieve the burned forest area. The burned forest area
calculated for each year was normalized by the average observed forest areas for the
period of the analysis.
Once masked, the BSI image was passed to a classification routine using a pre-
determined threshold (Figure 2-2). This threshold was identified based on the variation
of 26 samples of 9 pixels each, selected randomly and distributed over the 23 images.
These samples generated 598 observations classified as unburned forest, recently
burned forest (less than a year after the fire), and old burned forest (between one and
two years after the fire). The classified map resulting from the slicing routine was then
analyzed with a series of contextual filters based on morphology and convolution
(closing and median, kernel size 3x3), to decrease the sensitivity to point disturbances
(Figure 2-2 and 2-3). This filter routine eliminated the noise caused by the single
classified burned pixels within the unburned forest.
The burn scar maps were validated using burned forest information collected in
the field (Figure 2-1; total of 89 GPS points, 62 unburned forest points and 27 burned
forest points). The burned forest areas were located using GPS and the year of burn
was acquired through interviews with landowners during the summer of 2007. The burn
scar data set used in Nepstad et al. (1999) and Cochrane et al. (1999) was also used to
assess the accuracy of the fire scar mapping before 1996 (60 interviews and GPS

34
points from the eastern and western part of the scene along the BR-010 and PA-150
roads). About half of the burned forest mapped in the field was used to determine the
BSI threshold while the other half was used to validate the burn scar maps.
Burn Scar Temporal Variability and Relationship to Drought
The annual maps of forest burn scars, when combined with climate data, can be
used to determine the effects of drought on the occurrence and extent of forest fire. The
frequency and duration of drought, along with the structure of the native vegetation, are
known to influence forest flammability and fire spread. Drought reduces the amount of
water in the soil available to the plants, promotes leaf abscission which reduces leaf
area index (LAI) and increases canopy openness, thereby increasing both solar
insolation reaching the forest interior and loads of fine fuel on the surface (Nepstad et
al. 2004, Brando et al. 2008). Extreme droughts can cause tree mortality, further
increasing fuel loads and enhancing forest susceptibility to fire (Nepstad et al. 2007).
The extent of understory fires in tropical forests is known to be strongly associated
with extreme drought events related to the ENSO (Siegert et al. 2001, Page et al. 2002,
Alencar et al. 2006). ENSO inhibits rainfall and increases temperatures in the Eastern
Amazon, thereby prolonging and intensifying the dry season (Ropelewski and Halpert
1987, Halpert and Ropelewski 1992, Ronchail et al. 2002).
To capture the extent of the annual drought in the study area, data on annual
precipitation extracted from a weather station near the eastern edge of the study area
(2o 25’34” S ; 47o 31’58” W) was used from the Brazilian Water Agency network dataset
(ANA 2009). These data were combined with the annual burn scar maps to assess the
relationship between annual area burned and drought. This relationship was used to
determine the strength of climatic influence, including ENSO events, related to drought

35
and forest fires as well as to seek a threshold of rainfall at which forests are more likely
to burn extensively.
Results
The Spectral Properties of Forest Fires
The most significant changes in the spectral responses for pre- and post-fire
events in this Amazon forest were captured by the infrared (IR) bands. These results
indicate that spectral properties concepts used to identify the post forest fire effects in
other ecosystem can also be applied to tropical dense forest (French et al. 2008). Of all
the IR bands, the near-IR (Band 4) showed the biggest changes in reflectance for
recent burns, decreasing considerably when compared to unburned forest (Figure 2-4).
This signal is completely lost one year following fires, probably due to fast recruitment of
new vegetation or leaf flushing by surviving trees after fire-damaged leaves fall.
Conversely, shortwave-IR-1 (SWIR-1; Band 5 also known as Mid infrared) increases in
reflectance in response to both recent and old burned forest scars when compared to
unburned forest (Figure 2-4). Since this band is sensitive to water content, this signal
persists longer than near-IR-4, perhaps because it takes longer to recover the moisture
content of soils and vegetation if compared to an unburned forest signal. In addition, as
already demonstrated in other ecosystems (Eva and Lambin 1998, Fraser et al. 2000),
this band is very sensitive to energy absorption by ash and charcoal. Lastly, the SWIR-2
(Band 7) is more sensitive to changes from recent to old burns than the SWIR-1 and is
also more capable of distinguishing old burn areas from unburned forests (Figure 2-4).
This capacity of Band 7 is probably due to the effects of soil dryness (Nearya et al.
1999) as well as the heterogeneity of the canopy gap shadow caused by fire-induced
tree mortality.

36
Burn Scar Index (BSI) Maps
The BSI retrieved from CLAS-BURN enhanced the response of areas recently
burned as compared with the areas burned in previous years, giving a better estimation
of the forest area affected by fire each year (Figure 2-5). Also this algorithm appears to
be sensitive to areas burned two years prior to the image capture. Analysis of variance
(ANOVA) run on the 26 profiles set up to extract historic information and to acquire the
trajectory of change in the BSI image indicated a significant difference between pixels
burned one and two years before imaged (F < 0.001) (Figure 2-6). BSI values > 65%
seem to capture the natural variability signal of undisturbed forest. The BSI method
demonstrated accurate classification of 88.9% (Kappa coefficient 0.84) of the burned
areas and 95.16% of unburned forest that were mapped in the field in 1996 and
2007(Table 2-2).
The total forest area burned at least once between 1983 and 2006 (mapped
annually from the 1984 to the 2007 image), was 333,345 ha, representing 15% of the
existing forest area at the beginning of the period (Table 2-3), and 13% of the standing
forest area in 2007,while the total area burned over the period (including the areas that
burned more than once) was 458,840 ha (Table 2-3).The average annual burned forest
area was 20,267 ha, ranging from 190 ha in 1984 to 113,040 ha in 1992 (Table 2-3).
Temporal Variability of Forest Fires
These results indicate a low fire frequency for most of the area burned but shorter
fire return interval for this type of ecosystem, where from the 1983 to 2006, 72% of the
burned forests were affected by fire at least once, while 20% burned twice in the same
period. In addition, there were forest areas (0.1% of the total burned area) that burned
more than 6 times over the 23-yr period (Table 2-3; Figure 2-7A). This frequency

37
pattern and the average annual forest area burned for this region suggests a fire return
interval of 82 years. These results show that 92% of the forest areas affected by fire
burned once or twice during this period, indicating a frequency compatible with fire-
dependent vegetation such as some sub-tropical pine forests, but a very high fire
frequency and shorter return interval for dense moist forest, which historically burned
only at 400-1000 yr intervals (Thonicke et al. 2001).
Approximately 38% of the burned forest was subsequently deforested, which
represents 19% of the total area deforested during the period of analysis (Table 2-3;
Figure 2-7B). Although this rate was higher for the forest areas that were burned twice
(45%), it was similar for the areas that burned 3 or 4 times during this period (average
41% and 35% respectively), while decreasing in the forest areas that burned more than
5 times ( < 20%) (Table 2-2). These results suggest a weak relationship between fire
frequency and the likelihood of a forest being cleared in this region.
Burned Area and ENSO Events
Maps of burned areas revealed four peaks (1983, 1987/1988, 1991/1992 and
1997/1998) of relatively large areas burned compared with subsequent years during the
1980s and 1990s (Figure 2-8). Except for the peak in 1987/1988, which was considered
a moderate ENSO year, these peaks were associated with periods of strong ENSO
years. These peaks also correlate with the peaks of the average annual MEI rank
retrieved from the Multivariate ENSO index and lower rainfall years (Figure 2-8). The
average burned area for strong ENSO years was 63,116 ha/year, an area three times
higher than that which burned during moderate ENSO years (19,860 ha/year). While
there was a significant difference between the average area burned during strong and

38
moderate ENSO years (H = 8.0, df = 3; P = 0.046), no difference was found between
moderate ENSO years and average rainfall years.
Although strong ENSO events played a major role in the occurrence and extent of
forest fires in the 1980s and 1990s, their influence declined during the 2000s. In fact,
after the strong ENSO of 1997/1998, the relative extent of burned forest was more
evenly distributed through the subsequent years, with a peak in 2005-2006, which
although not an ENSO year, experienced the largest drought in recorded recent history
in the Amazon (Marengo et al. 2008, Zeng et al. 2008). Additionally, during the 2000s,
the annual average rainfall was generally lower than in the 1980s and early 1990s,
resulting in less overall variation between drier and wetter years (Figure 2-8).
Although ENSO is known to reduce rainfall and increase temperatures in the
eastern Amazon Basin, the influence of the phenomena in promoting local drought can
vary. To capture and analyze the effects of local variation of ENSO-caused drought on
forest fires, the annual rainfall was combined with the annual burned area. The
relationship between the annual area burned and local climatic drought indicators (total
annual rainfall and number of days without rain during the dry season) demonstrates a
triangular distribution in which the greater variation of the area burned occurred during
the years of lower amount of rainfall and longer dry seasons (Figure 2-9). In both cases,
droughts during strong ENSO years and years prior to these major events had a major
contribution in explaining the extent of area burned. These extreme drought events
helped to define a threshold in the exponential negative relationship between fire and
local drought climatic indicators such as total annual rainfall. This threshold indicates
the likelihood that a forest will burn given a shortage in that year’s precipitation. A

39
noteworthy exception was during the strong ENSO of 1982-1983 in which forest fires
were not extensive.
Discussion
Historical data on the extent and location of forest fires is fundamental to
understanding fire frequency and for determining the relationship between fires and
climate. Such data cannot be derived using remote sensing techniques developed to
map forest degradation from logging and fire (Souza et al. 2005) because the two types
of disturbances are not easily distinguished. In contrast, CLAS-BURN transforms
multispectral remote sensing information in a way to allow forest burn scars to be
mapped on an annual basis. This new combination of photosynthetic vegetation (PV),
non-photosynthetic vegetation (NPV), and shade/burn (SB) fractions decreases the
signal of dead vegetative material in the NPV fraction and enhances the new SB
fraction when the area is burned. The normalized difference from these fractions
creates a burn scar index (BSI) image that, when classified by a defined threshold,
generates compatible annual forest burn scar maps.
The trajectory of burn scars and deforestation for each pixel indicates a low
frequency within the period of analysis for most of the area burned (72% of that area
was burned only once during1983-2006) but an extremely short return interval for a
moist tropical forest (82 yrs). The fire frequency and return interval indicate that once a
forest is burned, the likelihood of being burned again increases by 28%. Admittedly, fire
events prior to this time-series are unknown and can increase the frequency and reduce
the fire return interval. Nevertheless, even considering that most of the forest area that
burned during this period burned only once, more than 20% of the area burned twice,
indicating a much frequent and shorter average return interval than the natural
40
background rate of every 400 to 1000 years. These results suggest that in this region
fires are now 5 to 11 times more frequent than what is believed to be the natural fire
frequency (Thonicke et al. 2001). In addition, 8% of burned forests, mostly located along
the major roads where ignition sources and fragmentation are high (Nepstad et al. 2001,
Cochrane 2003, Alencar et al. 2004b), experienced high fire frequencies (> 5 times over
this period) which are similar to those expected on Brazilian savannas (Hoffmann et al.
2003). These changes in fire frequency suggest an important anthropogenic influence
on local fire regimes and perhaps a shift in vegetation structure, favoring a more shrub-
like vegetation dominated by light-demanding and fire-resistant species (Balch et al.
2009), and reduced rates of biomass accumulation (Zarin et al. 2005).
These results also elucidate and set some boundaries for the positive feedback
hypothesis in fragmented forest of the Amazon Basin, which states that once a forest is
burned, the likelihood of burning again will be higher (Cochrane et al. 1999). These
results suggest that the higher frequencies posited by this hypothesis (Cochrane and
Schulze 1999), are not common in the landscape since it only happened on average in
a small fraction of the study area ( < 0.1% of the burned forest had burned every 2 or 3
yr); apparently the rapid cyclical pattern of forest fires pertains mostly to areas close to
main roads (87% of the area burned more than 5 times was within 7 km from the main
paved roads, PA-158 and BR-010). In addition, the fire return interval or fire rotation of
82 years is 6 to 12 times higher than what was estimated by Cochrane et al. (1999) for
two portions of the same study area. This difference may be explained by the location
where the Cochrane study was developed being up to 10km from the main roads where
the majority of fire is concentrated.
41
Analysis of annual burn scar maps revealed that the largest forest area burned
occurred during strong ENSO events in the 1980s and 1990s (Figure 2-8). This
tendency could not be tested for 2000-2006 since no strong ENSO event was recorded
for the period. However, large proportion of the burned area mapped for the recent
years (2000-2006) demonstrated that even in the absence of strong ENSO events this
landscape has become more flammable. These findings may be related to the very
strong but short duration droughts caused by the ENSO events of 1982/1983 and
1987/1988, which were followed by very wet years, helping the soils to recharge before
the next dry period (Zeng et al. 2008). In contrast, the ENSO-related drought of
2002/2003 was not considered a strong one but was prolonged and followed by only
average rainfall year in 2004 (Villar et al. 2009). A result of this combination of factors
was an accumulated deficit in plant available water that was exacerbated by the
extreme drought of 2005, which was caused by a distinct climatic phenomena (the
North Atlantic Ocean Anomaly; Zeng et al. 2008, Marengo et al. 2008). A period of
several dry years may affect inter-annual soil water accumulation and create a deficit in
plant available water even in deeper soil layers (Jipp et al. 1998), even if the period
includes a year of average rainfall, increasing forest flammability and decreasing the
ability of the forest to resist future milder droughts.
The important influence of strong ENSO events on burned area gives some
support to the argument that climate acts as a major driving force of fire behavior
(Marlon et al. 2008). That said, not all ENSO events helped to explain the total area
burned in a particular year. The 1982/1983 ENSO, for example, was the strongest in
recent history but promoted an annual area burned in this region similar to the ones of

42
current weak ENSO and some non-ENSO years. This finding can be explained by a
combination of variables that include other climatic influences such as previous wet
years enhancing soil water storage, but also a limitation of ignition sources and
fragmentation characteristic of early agriculture frontier stages given that 78% of the
original forest was standing in 1983 compared to only 55% in 2006.
In addition to the influence of the ENSO and other climatic phenomena, the
observed increase of burned area in recent years may also be a response to
anthropogenic landscape changes including increases in deforestation, forest
fragmentation, and ignition sources, which are all known to have major influences on
the susceptibility of forest to fire (Cochrane and Laurance 2002, Alencar et al. 2004b).
Human-induced increases in forest susceptibility to fire are likely exacerbated by global
climate change, which is expected to increase temperatures and change patterns of
rainfall in the Amazon Basin (Malhi and Wright 2004). Increases in the frequency and
lengths of droughts (Cox et al. 2008) will have especially strong impacts given that
longer droughts are associated with higher fire frequencies (Aragão et al. 2008). In
addition, climatic events other than those associated with ENSO, such as the North
Atlantic Oscillation, have important effects on temperatures and rainfall in the eastern
Amazon (Zeng et al. 2008).
The combined effects of land-use change and severe droughts resulted in massive
carbon emissions from forest fires through both direct biomass combustion and
committed emissions due to post-fire tree mortality (Schimel and Baker 2002,
Haugaasen et al. 2003). During ENSO years, forest fires in the Brazilian Amazon can
double regional carbon emissions from intentional deforestation, accounting for 0.329

43
Pg in the 1998 ENSO year (Alencar et al. 2006). Emissions from Amazonian forest fires
may increase in a scenario of stronger and more frequent ENSO events (Trenberth and
Hoar 1997, Timmermann et al. 1999), coupled with increased forest fragmentation due
to continued deforestation and land use change, can create a future of high scale
landscape forest degradation in the region.
Conclusions
Long-term fine resolution burn scar mapping is key to understanding the
relationship between forest fires and climate. These burn scars can be assessed using
CLAS-BURN, a spectral mixture analysis technique that includes sub-pixel fraction
endmembers that capture the responses from combustion materials and vegetation
heterogeneity caused by increased shade of the gaps of fire-affected dead trees, as
well as the amount of ash and charcoal. The forest fire maps for this study area in the
Eastern Amazon Basin showed that 72% of the burned area was burned only once,
while 28% was burned at least two times during a period of 23 yrs, with a total of 15% of
the forest area affected by fire. These results indicate that forest fires are less frequent
when studied at a broader scale rather than only within a few kilometers along major
roads (Cochrane et al. 1999).
The history of burn scars also indicates a correlation with strong ENSO years and
the extreme 2005 non-ENSO drought. This suggests a strong connection between
forest fire occurrence and extreme droughts, while also suggesting a future of high
forest susceptibility to fire in a warmer climate, where even several consecutive mild dry
seasons can affect the forest susceptibility to fire. However, human influences on
regional and local climate promoted by land use change and its influence on forest
susceptibility burning remains poorly understood. Forest fragmentation, coupled with an

44
increase in ignition sources, may enhance the effects of climate-induced drought on the
risk of forest fires in this part of the Amazon.
Table 2-1. Landsat imagery used in the multi-temporal analysis of forest burn scars in
the Eastern Brazilian Amazon.
# Sensor Date Forest area (ha) Deforested and clouds (ha)
1 TM Jul 27 1984 2,253,081 615,559 2 TM Jun 28 1985 1,913,491 973,570 3 TM May 17 1987 1,914,644 970,206 4 TM Sep 08 1988 2,107,427 737,300 5 TM Aug 10 1989 2,059,107 822,082 6 TM Jul 28 1990 1,983,725 902,249 7 TM Aug 16 1991 2,103,006 776,980 8 TM Aug 02 1992 1,509,356 1,329,216 9 TM Jun 02 1993 1,677,319 1,091,449 10 TM Jun 21 1994 1,617,652 1,268,586 11 TM Jun 08 1995 1,963,878 908,736 12 TM May 25 1996 1,370,324 1,514,967 13 TM May 28 1997 1,738,133 1,140,576 14 TM Sep 20 1998 1,223,280 1,620,786 15 ETM Jul 13 1999 1,715,275 1,084,928 16 ETM Jul 31 2000 1,779,392 1,055,797 17 ETM Aug 03 2001 1,773,260 1,090,522 18 ETM Sep 07 2002 1,698,789 1,145,213 19 ETM May 21 2003 1,424,780 1,452,297 20 TM May 15 2004 1,631,050 1,230,951 21 TM Aug 06 2005 855,667 2,028,041 22 TM Aug 09 2006 1,474,600 1,358,073 23 TM Sep 13 2007 1,418,846 1,426,809
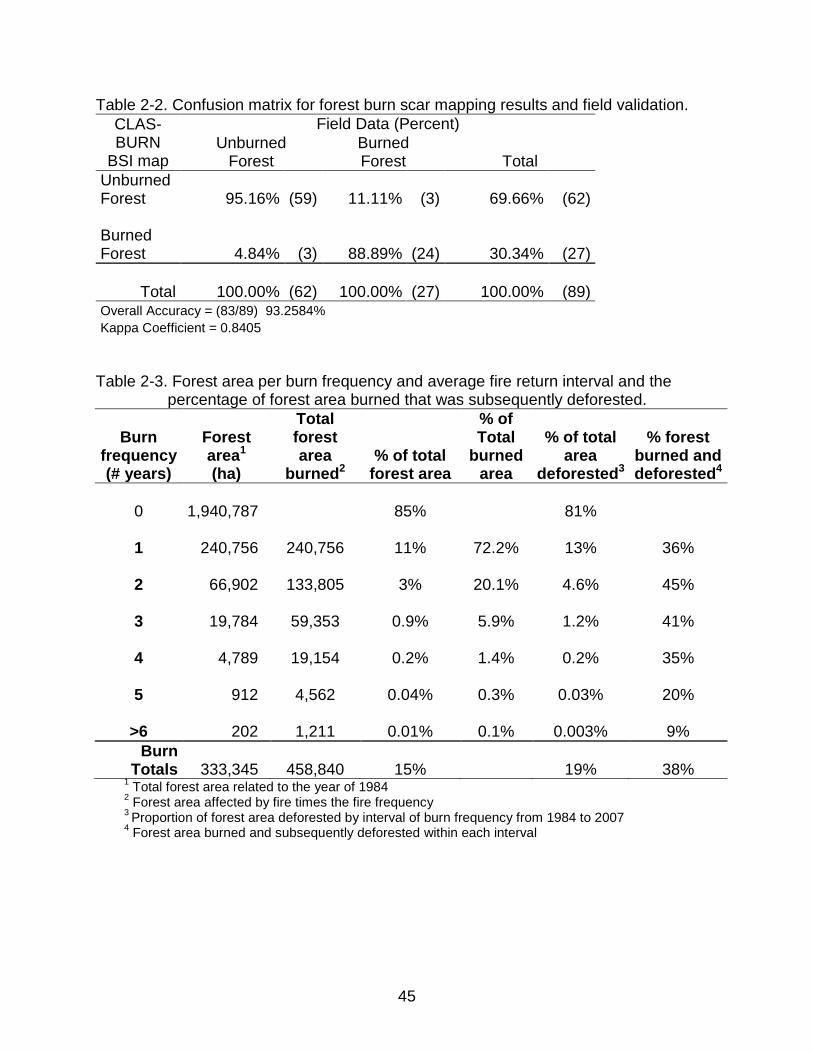
45
Table 2-2. Confusion matrix for forest burn scar mapping results and field validation. CLAS-BURN
BSI map
Field Data (Percent) Unburned
Forest Burned Forest Total
Unburned Forest 95.16% (59) 11.11% (3) 69.66% (62) Burned Forest 4.84% (3) 88.89% (24) 30.34% (27)
Total 100.00% (62) 100.00% (27) 100.00% (89)
Overall Accuracy = (83/89) 93.2584% Kappa Coefficient = 0.8405
Table 2-3. Forest area per burn frequency and average fire return interval and the percentage of forest area burned that was subsequently deforested.
Burn frequency (# years)
Forest area1 (ha)
Total forest area
burned2 % of total
forest area
% of Total
burned area
% of total area
deforested3
% forest burned and deforested4
0
1,940,787
85% 81%
1
240,756 240,756 11% 72.2% 13% 36%
2
66,902 133,805 3% 20.1% 4.6% 45%
3
19,784 59,353 0.9% 5.9% 1.2% 41%
4
4,789 19,154 0.2% 1.4% 0.2% 35%
5
912 4,562 0.04% 0.3% 0.03% 20%
>6
202 1,211 0.01% 0.1% 0.003% 9% Burn
Totals
333,345 458,840 15% 19% 38% 1 Total forest area related to the year of 1984 2 Forest area affected by fire times the fire frequency 3 Proportion of forest area deforested by interval of burn frequency from 1984 to 2007 4 Forest area burned and subsequently deforested within each interval

46
Figure 2-1. Landsat TM 5 false color composite of bands 5, 4, 3 (RGB) from September 13, 2007 of the study area showing land uses (pasture and agriculture fields in magenta; and forested areas in green) and sites where forest fire data were collected in the field (red open circles).

47
Figure 2-2. Diagram explaining the generation of the fire scar maps using CLAS-BURN,
where PV, NPV and SB stand for photosynthetic vegetation, non-photosynthetic vegetation, and Shade/Burn fractions respectively; BSI is Burn Scar Index and ISO-Data is the unsupervised classification algorithm used to map clouds and deforestation.
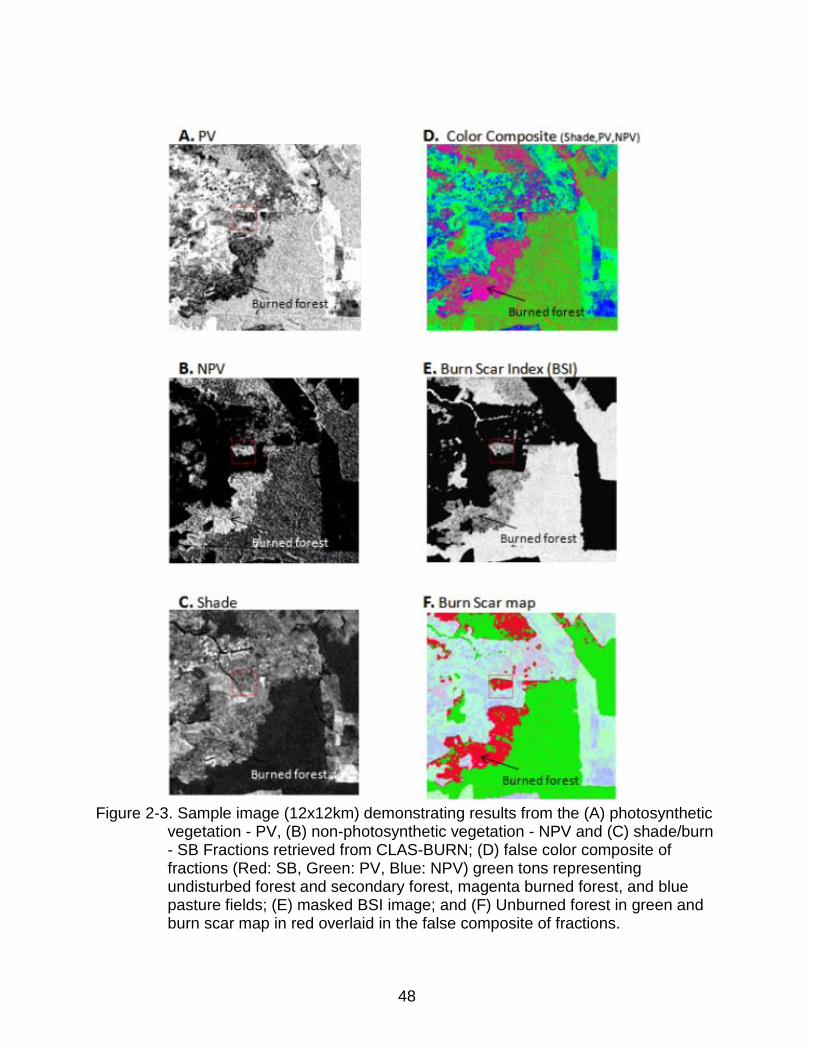
48
Figure 2-3. Sample image (12x12km) demonstrating results from the (A) photosynthetic
vegetation - PV, (B) non-photosynthetic vegetation - NPV and (C) shade/burn - SB Fractions retrieved from CLAS-BURN; (D) false color composite of fractions (Red: SB, Green: PV, Blue: NPV) green tons representing undisturbed forest and secondary forest, magenta burned forest, and blue pasture fields; (E) masked BSI image; and (F) Unburned forest in green and burn scar map in red overlaid in the false composite of fractions.

49
Figure 2-4. Mean spectral signature of recent burned areas (6 to 10 months after the fire
event; Red line), old burn scar areas (18 to 22 months after the fire event; Green line) and undisturbed forest areas (Black line).

50
Figure 2-5. Fractions cover (photosynthetic vegetation - PV, non-photosynthetic
vegetation - NPV and shade/burn – SB) and burn scar index (BSI) trajectory from 1983 to 2006 forest conditions of one sample subset (F = forest; B= recent burned scar; O = old burn scar/ regrowth after burn). The shaded area represents the threshold of the recent burned scars used to create the burn scar maps. The discontinuity accounts for the years where this representative sample subset was covered by clouds.
Figure 2-6. Distribution of burn scar index (BSI) values extracted from the sample
according to forest burn condition (old burns = 18- 22 months after the fire; recent burn = 6-10 months after the fire).

51
A
B Figure 2-7. (A) Forest areas affected by fire that are still standing and were deforested
during 1983-2007, indicating that most of the area burned that was subsequently deforested was along main roads. (B) Spatial distribution of forest fire frequencies indicating that the highest frequencies were along main roads.

52
Figure 2-8. Forest area burned, average annual Multivariate ENSO index (MEI) rank
(shade areas represent ENSO years where the MEI rank is above the average annual index mean), and total annual rainfall (shade areas represent drier years with rainfall below the mean). The strong ENSO years (1982/1983, 1991/1992 and 1997/1998) as defined by the Oceanic Niño Index (ONI) is coincident with three of the five peaks above the average annual MEI index mean.
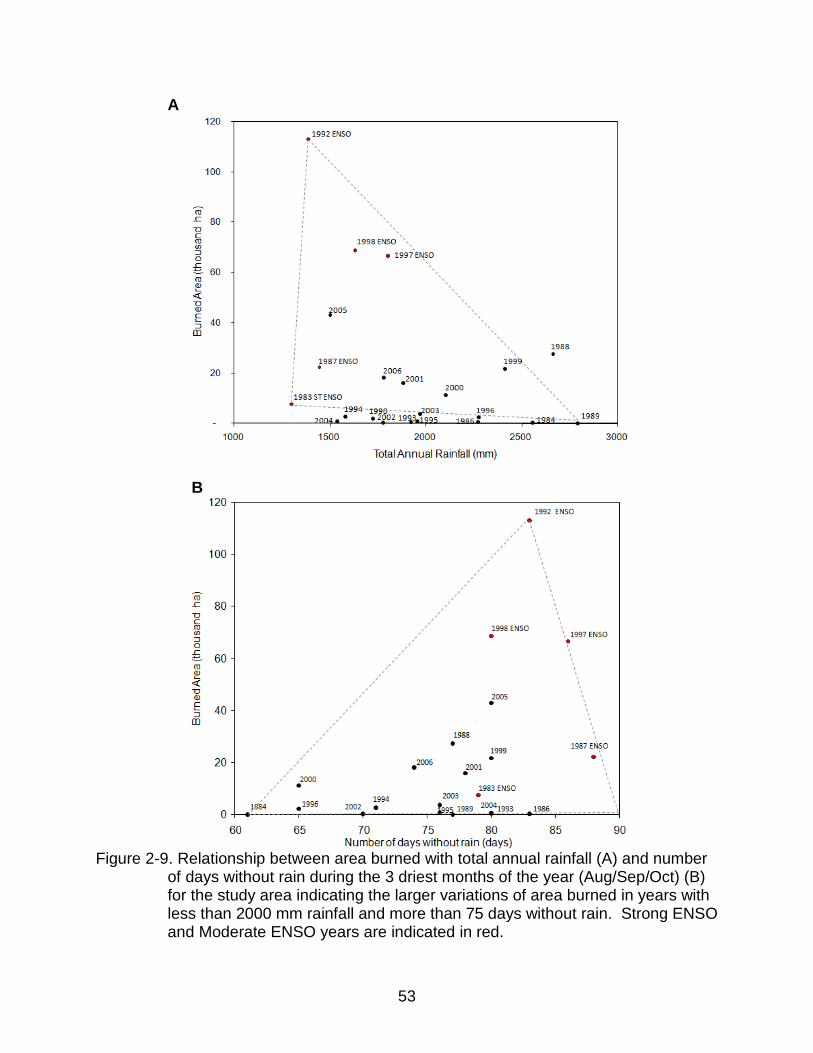
53
A
B
Figure 2-9. Relationship between area burned with total annual rainfall (A) and number
of days without rain during the 3 driest months of the year (Aug/Sep/Oct) (B) for the study area indicating the larger variations of area burned in years with less than 2000 mm rainfall and more than 75 days without rain. Strong ENSO and Moderate ENSO years are indicated in red.

54
CHAPTER 3 CHANGING FOREST FIRE REGIMES IN THE BRAZILIAN AMAZON
Introduction
Fire is one of the main ecological agents of disturbance and transformation of
terrestrial ecosystems (Thonicke et al. 2001, Bowman et al. 2009), serving to shape the
structure and composition of natural landscapes (Chazdon 2003, Bond et al. 2005).
Besides being a natural component of various vegetation types, fire also represents one
of the main tools for agricultural production (Nepstad et al. 1999a, Eva and Lambin
2000, Mouillot and Field 2005, Vayda 2006). The changes produced by fire at the
landscape level depend on its intensity, frequency, and the degree to which the burned
areas are ecologically fire-dependent (Whelan 1995).
Besides intensity and frequency, a full description of a fire regime includes
consideration of other spatial and temporal characteristics such as extent, seasonality,
and severity. These factors, when analyzed together, help explain the role and pattern
of fire occurrence in time and space (Bond and Keeley 2005). These characteristics
have major influences on fire behavior that, together with climate, affect the quality,
quantity, continuity and moisture content of fuels (Goldammer and Price 1998), helping
determine the sensitivity and dependency of the ecosystems to this natural and
anthropogenic agent of transformation (Shlisky et al. 2009).
Fire extent is an important spatial component of a fire regime because it
determines the post-fire continuity of fuel (Falk et al. 2007). This fire regime
characteristic includes the total area affected by fire as well as its size. These two fire
extent metrics can have different outcomes in terms of patchiness and heterogeneity of
the fuel, with profound influences on future fire behavior (Turner et al. 2003).

55
At the same time, fire extent is closely related to fire frequency and intensity since
this time-related characteristic is dependent on fuel productivity and the necessary time
between fires for fuels to build up enough to carry fire (Balch et al. 2008). Thus one fire
can either increase or decrease the amount of fuel and the flammability of the burned
area, resulting in patchier or more extensive subsequent burns (Baker 1995). Fire
frequency can be expressed either as the fire return interval or the actual length of time
between two fires (Johnson and Gutsell 1994); the first expression represents the
expected fire period or fire cycle of a region, the second represents the actual interval
between fires for a specific area. Fire cycle is calculated using the average burn rate of
an specific area to estimate how long would take for this area to burn (Cochrane et al.
1999)
The season during which a fire burns influences its likely extent and patchiness.
Fires in the late dry season, for example, tend to be intense because so much dry fuel
is available (Cochrane 2009). Fires in this season are also likely to be less patchy and
to spread more easily, resulting in larger and more homogeneous burns (Brown et al.
1999). Of all the fire regime characteristics, fire season is the one that is most closely
affected by climate and climate variation (Riaño et al. 2007). Fire seasonality is
affected by the strength and length of droughts, which can influence leaf shedding, plant
growth, timing of green up, and fuel moisture (Nepstad et al. 2007, Saleska et al. 2007,
Brando et al. 2008).
The suite of fire regime characteristics together influence the intensity and severity
of fires. A fire at the end of an extreme dry season can be more intense, affect larger
patches, and open the path to more frequent fires. Conversely, an area burned many

56
times can exert a positive influence on the intensity of fire since it can change the
quality of fuel and it moisture contents (Goldammer 1990). All these fire regime
characteristics also depend on the availability of ignition sources. Where ecosystems
are dependent on fire, ignition is mostly natural and dependent on climate, while in other
regions where natural fires are rare, ignition is mainly anthropogenic (Shlisky et al.
2009).
The natural fire return interval for forests of the Amazon Basin is estimated to be
400-1000 years (Thonicke et al. 2001). These fires were correlated with rare extreme
droughts that affected the same area only once or twice per millennium (Sanford et al.
1985, Meggers 1994, Bush et al. 2008). Due to the rarity of natural fires in the region,
Amazon forests are characterized as sensitive to fire and do not depend on fire to
maintain their structure and function (Shlisky et al. 2009).
Although historical extents of fires in the Amazon Basin are not known, other
aspects of the fire regime in the region have been studied. For example, it is known that
forest fires affect the structure of Amazonian forests (Barbosa and Fearnside 1999,
Gerwing 2002, Barlow et al. 2003, Haugaasen et al. 2003), reducing biomass and
changing forest composition (Cochrane et al. 1999, Barlow and Peres 2008). Different
frequencies and fire intensities differentially affect tree mortality fuel quality, and fuel
availability (Uhl and Kauffman 1990, Cochrane and Schulze 1999, Pinard et al. 1999,
Balch et al. 2008), and may lead to grass invasion (Balch et al. 2009, Veldman et al.
2009). Forest fires respond to local microclimatic conditions (Ray et al. 2005), and
behave differently under extreme regional climate conditions (Alencar et al. 2006,
Aragão et al. 2007).

57
Even though different aspects of the fire regimes of some Amazonian forests have
been documented, there is still a gap in understanding of the spatial and temporal
changes in fire regimes in Amazonian landscapes in response to the expansion of
human activities and climate change. Anthropogenic ignitions are increasing in the
region as a function of population growth, infrastructure development, land use change,
and deforestation (Nepstad et al. 1999b, Cochrane 2003). Moreover, extreme drought
events are becoming more frequent (Timmermann et al. 1999, Cobb et al. 2003). The
combination of climatic and anthropogenic effects is expected to cause major shifts in
fire regimes (Goldammer and Price 1998, Lavorel et al. 2007, Marlon et al. 2008).
Changes in fire regimes can influence future fires by changing fuel availability,
continuity, and moisture content, promoting plant mortality and depleting soil seed
reserves. A fire prone landscape also creates a disincentive for investments in fire free
production systems, helping to perpetuate fire in the landscape.
This Chapter analyzes the main fire regime characteristics including fire extent,
frequency and seasonality, as well as the effects of some of these properties on
changes in canopy cover of three major forest types in the Amazon Basin. I assess how
these fire regime changes vary among vegetation types, and consider how they have
evolved over the years. Fire regime characteristics such as frequency and return
interval, extent and size, and a proxy to fire intensity are based on a 24-yr time series
derived from Landsat burn scar maps developed using the methodology presented in
Chapter 2, while the seasonality is based on measures of monthly hot pixel indications
of ignitions for a 16-yr time series. These elements of the fire regime will provide
information about the probability of forest fires and may help to answer questions about
58
the future of Amazonian forest fires in response to escalating rates of deforestation,
forest degradation, and climate change.
Materials and Methods
Study Sites
This study focuses on three forest types located along the PA-150 and BR-158
highways, which together form one of the major road corridors of the eastern border of
the Amazonian Arc of Deforestation. The study sites were selected to represent a
gradient of threatened forest types by deforestation and climate change. These areas
were delimited by the Landsat scenes (path and row) 223/62, 224/66 and 224/68
representing landscapes dominated by dense, open, and transitional forest types,
respectively (Figure 3-1).
These three vegetation types differ in structure and composition (RADAMBRASIL
1981). While the dense forest has a closed canopy of tall trees (25-35 m), the open
forest has only scattered trees of about the same height emerging above a more open
canopy. The transitional forest is shorter (15- 25 m tall) than open forest, but has a more
homogeneous closed canopy. The average above-ground biomass for these three
vegetation types range from 350 ton ha-1 in dense forest, to 250 ton ha-1 in open forest
and 200 ton ha-1 in transitional forest (Saatchi et al. 2007).
The three study areas are located in distinct climatic regions following a drought
gradient. While the dense forest site receives an average annual rainfall of 2,200 mm,
the open and transitional forest are much drier receiving in average 1,700 mm and
1,300 mm of rain per year, respectively. The dry season in the whole region is from
June to November but with peaks in different months for the three regions, reaching the
dense forest site in September-October, the open forest site in August-September, and

59
the transitional forest site in July-August (Villar et al. 2009). The soil under these
vegetation types are different as well, with predominantly yellow latosols in dense forest,
podzols in open forest, and a mixture of red-yellow latosols and podzols in the
transitional forest (RADAMBRASIL 1981).
The study region has experienced extensive deforestation and land use,
principally for cattle ranching, with slash-and-burn agriculture near the settlements
(Fearnside 2005). Logging is a major economic activity, particularly in the dense forests
(Verissimo et al. 1992, Uhl et al. 1997), with fewer species being harvested from the
open and transitional forests (Lentini et al. 2005). Recently, large scale mechanized
farming of soybeans, rice and corn has started mainly in the dense and transitional
forest study sites (Alencar et al. 2004a, Morton et al. 2006). Collectively these
processes have resulted in landscape mosaics in which only 71%, 45% and 50% of the
original dense, open, and transitional forest, respectively, remain standing (Table 3-1).
Data
Two types of remote sensing derived datasets were used in this analysis of recent
changes in fire regimes in eastern Amazon. One is based on annual fire scar maps
derived from multispectral high resolution imagery, while the other is monthly hot pixel
counts retrieved from thermal coarse resolution imagery. These datasets were used to
calculate fire extent, frequency, interval, and effects, and to evaluate changes in fire
seasonality, respectively.
Annual burn scar maps were acquired from 72 Landsat 5 Thematic Mapper (TM)
and Landsat 7 Enhanced Thematic Mapper Plus (ETM+) imagery covering a time series
from 1983 to 2007 using images from the dates 1984 to 2008. The burn scar maps were
compiled in a GIS to derive the extent, frequency, and interval of each area burned

60
during the period of analysis. This imagery dataset was radiometrically calibrated,
converted to reflectance, and co-registered and geo-rectified according to the
procedures described in Asner et al. (2005b) and Chapter 2.The burn scar maps were
constructed using the CLAS-Burn spectral unmixing fraction routine and the Burn Scar
Index algorithm (Chapter 2). This routine and algorithm accurately classified 89%, 79 %
and 88 % of the landscape burn scars from 2006 and 2007 that were visited in the field
in the dense, open, and transitional forest study sites. CLAS-Burn was also used to
generate the photosynthetic vegetation fraction (PV), the base for the analysis of fire
effects (Asner et al. 2005b).
The monthly hot pixel data used to calculate the intra-annual variability of fire
seasonality for the study areas were derived from the NOAA 11, 12, and 15 satellites.
This database included 16 years of monthly dry season fire counts (June to November)
from the period of 1992 to 2007 for the three study sites. These data are part of the
national fire database available at the Brazilian National Space Agency (INPE) webpage
(http://www.dpi.inpe.br/proarco/bdqueimadas/). In addition, total and monthly rainfall
were acquired for gauge stations located within 30 km of each study site (ANA 2009).
Fire Extent and Size
Fire extent along with the sizes and numbers of fire scars are important spatial
characteristics of a fire regime that account for the amplitude of the burned area as well
as the patchiness and heterogeneity of the burn. The extent of the forest area burned
was calculated using the compiled annual burn scar maps derived from CLAS-BURN for
the three forest sites, representing the total area affected by fire during the 24 yrs of
analysis. For all the sites, savanna and other types of non-forested vegetation were
extracted from the analysis (Figure 3-1). The annual burn maps were used to generate

61
the number of individual fire scars per year as well as the associated area burned in
each fire (i.e., the size of each individual fire scar). Descriptive statistics were
calculated for the individual fire scars to assess the main difference between the forest
sites and the temporal changes occurring within each site.
Fire Frequency and Interval
Fire frequency and interval are the main temporal domains of a fire regime. They
account for the number of times in which fire affected the same area within the period of
analysis as well as the period between fire events affecting the same area. These two
characteristics are important to determine fire intensity and the potential for vegetation
recovery. Just like the mean annual area burned, the mean number of fire scars and the
mean fire scar size, frequency and interval data were retrieved from the annual burn
scar time-series. These burn scar maps were stacked into a singular frequency map for
each study site with the proportion of the area burned at each frequency calculated
generating a probability distribution. The mean fire frequencies (MFF) for dense, open,
and transitional forest were also calculated from the relationship between the total area
burned by the end of the observation period and the sum of the annual total area
burned during that same period. The fire interval was also retrieved for each burned
pixel in the time-series for each site, creating a distribution of the area burned
assembled by the time since last fire. Fire cycle (FC) or rotation, expressing the length
of time necessary for the study areas to burn based on the average annual burned area,
was also calculated as an indication of a fire return interval. In addition, the pixel-based fire
interval dataset of the three forest sites combined was also used to evaluate the
proportion of area burned by consecutive or recurrent fires.
62
Fire Seasonality
The season in which a fire occurs can greatly affect its intensity and size. Fire
seasonality is assessed for the three study sites using a monthly hot pixel time series
derived from NOAA 11, 12, and 15. Due to the difficulties of acquiring monthly high
resolution multispectral image without clouds to map forest burn scars, I used hot pixels
as a proxy for forest fires seasonality since they represent the actual time when ignition
took place (Schroeder et al. 2005). Two measurements of seasonality were extracted
from this dataset, one that describes the average peak of fire activity in the regions of
interest for the past 24 years and the other which reveal any tendency for that peak to
have shifted in time over the observation period.
Fire Effects and Intensity
Fire intensity, together with extent and size, accounts for a key spatial domain of
a fire regime because it determines the rate of recovery and the likelihood of future
burns. Some studies in the Amazon have related fire intensity with fire frequency, which
is directly related to the amount of fuel available for future burns (Uhl and Kauffman
1990, Cochrane and Schulze 1999, Pinard et al. 1999, Balch et al. 2008). I evaluated
fire effects as a proxy for fire intensity by taking into account the impacts of different
burn frequencies on forest canopy cover, as retrieved from satellite-based estimates.
Fraction of forest canopy cover was used by Asner et al. (2004, 2005b) to quantify the
impacts on canopy openness of different intensities of selective logging. These satellite
estimates of forest canopy cover have a strong inverse relationship with canopy gap
fraction measured in the field (Asner et al. 2004). These satellite-derived measurements
were generated from a sub-pixel fraction algorithm called Carnegie Landsat Analysis
System (CLAS) that decomposes a pixel into fractions of photosynthetic vegetation or
63
forest canopy cover (PV), non-photosynthetic vegetation (NPV), and soil (Asner et al.
2004). The Asner et al. (2005) approach was used to derive satellite-based forest
canopy cover from the PV fraction retrieved from CLAS-BURN spectral mixing analysis
(Chapter 2).
The impacts of different fire frequencies on forest canopy cover were measured for
the three forest types in this study. Measurements of satellite-based forest canopy cover
(PV) were extracted for seven levels of fire frequencies (burned from 0 to 6 times) using
a random sampling routine and the 2007 images for all study sites. The samples located
over a forest area that were burned in 2006 were removed from the sampling groups to
avoid the strong signal of recent burned materials such as charcoal and ashes (Chapter
2). These measurements generated a probability distribution of fire effects that varied
with the frequency of burns.
Results
Fire Extent
Over the 1983-2007 period, fires burned large portions of the eastern Amazon
forests, but the extent varied with forest type and year. Based on these study sites,
dense forest was the forest type least affected by fire, burning three times less
frequently than open and transitional forests during the study period. Forest fires burned
an area of 0.33 billion hectares of dense forest compared to 1 billion hectares of open,
and 0.56 billion hectares of transitional forests, representing, respectively, 15%, 44%,
and 41% of the standing forests in these study sites (Table 3-2 and Table 3-3).
While the forests were burning during the 24 yr observation period, 29% of dense,
54% of open, and 50% of transitional forests were lost to deforestation; 19%, 39%, and
38% of the deforested area in these three forest types, respectively, was burned one or

64
more years prior to clearing (Table 3-2). These results suggest that the proportions of
the deforested area burned in these three study sites (6% dense, 21% open, and 19%
transitional), were not significant to explain deforestation (Fisher’s exact test, P = 0.63,
0.45 and 0.7).
The area affected by forest fires varied substantially among years. The annual
distribution of area burned indicates an increase in forest area affected by fire over the
last 10 years in all the sites (Figure 3-2), demonstrating an increasing extent of forest
fires in the eastern part of the Amazon Basin (Figure 3-3A). This increase was mostly
driven by the recent large areas burned in open and transitional forests (Figure 3-3B).
Although less dense forest burned than open or transitional forest, it was the forest type
with greatest between year variation in area burned (Table 3-3). While there were 70
and 100 fold differences between the minimum and the maximum area burned annually
for transitional and open forest, for dense forest the ratio was 1200 (Table 3-3). The
mean annual burned area (MBA) was 19,900 ha, 104,700 ha, and 80,000 ha for dense,
open, and transitional forests, respectively (Table 3-3). Within the dense forest site, the
average annual burned area was 35% smaller than the annual deforestation rate,
whereas the average forest area burned in open and transitional forest was 70% and
180% larger than the annual area deforested, respectively (Table 3-3).
Fire Size and Number
The size and number of individual fires varied substantially among years in the
three forest types. In general, the number of fire scars as well as the size of individual
fire scars varied more in the dense forest than in the other forest types (Table 3-3).
While the mean number of fire scars (MNFS) were similar in dense and transitional
forest (774 and 720 individual fire scars on average), they were ~70% higher in the

65
open forest (1247 fire scars on average). The mean maximum fire size (MMFS) - the
average size of the largest fire scar in each year - was 1,311 ha in dense forest which
is about 10 times smaller than the maximum fire sizes in the other forest types (Table 3-
3).
Despite the between year variability, about 80 to 90% of the annual fire scars were
less than 100 ha. Although the majority of the fire scars were relativity small, they
burned different proportions of the landscape (Figure 3-4). Larger fires (> 1000 ha)
burned larger areas in transitional and open forests than in dense forests (Figure 3-4A).
In contrast, small fires (< 100 ha) burned larger proportions of dense forests than other
forest types. Medium size fires (100 – 1000 ha) also affected a large area of dense
forest but, on average, burned approximately the same proportions of transitional and
open forest (Figure 3-4B).
When the results of fire extent, size, and number in the three forest types are
compared, major tendencies and differences are revealed. One difference is that in
transitional forest there were more large individual fires and less between-year variation.
In contrast, the open forest had a more evenly distributed burned area by fire scar size,
albeit with some fires that were larger than those in transitional forest. Although dense
forest burned mainly during ENSO years, the fires were mostly smaller than in the other
forest types.
Fire Frequency and Interval
Even though all the sites showed exponential decreases in the proportion of the
area burned as frequency increased, fire was generally less frequent in dense forest
than in the other forest types (Figure 3-5). Although the majority of the forest area
burned just once in all sites, in dense forest this proportion was 72% while, in open and
66
transitional forests only 45% and 30% of the area burned just once. The second most
frequent forest fires were the ones that burned the same areas twice; such fires affected
similar proportions of all the forest types (20%, 24%, and 22% in dense, open, and
transitional forests). Most of the areas that faced high fire frequencies are located along
major roads, and near human settlements and fire prone vegetation type (e.g. Savanna)
(Figure 3-6). These results suggest that dense forest is least likely to have its forest
burned more than once, whereas transitional forest burned with much higher
frequencies, up to 12 times over the 24 year observation period (0.5% of de total area
burned). These frequency distributions expressed as mean fire frequencies (MFF) are
1.4 times for dense, 2.3 times for open, and 3.1 times for transitional forests during the
period of analysis (Table 3-3).
The fire cycle, which represents the number of years in which the existing forest
landscape would be burned considering the same burn rate and no overlapping fires
(Cochrane et al. 1999), were 82 yr, 15 yr, and 11 yr for dense, open and transitional
forests, respectively, in a scenario of no deforestation (Table 3-3). If future forest losses
by deforestation are taken into account, fire cycles would decrease to 30, 8, and 5 yr in
dense, open, and transitional forests, respectively.
In all three study areas, most second fires occurred in the year after the first fire
(Figure 3-7). Higher frequencies of five years fire return interval were observed in dense
forest, which is coincident with ENSO periods. Transitional forest presented a peak of
higher frequencies after three years of the last fire, what can be related to the time
expected for fuel to build up and carry a fire in this type of forest (Balch et al. 2008). The
measured time since last fire also was used to depict the maximum number of years

67
over which the same forest patch burned consecutively. The records for consecutive fire
recurrence were 3 yr in dense forest, 9 yr in open forest, and 6 yr in transitional forest.
Fire Seasonality
Forest fire seasonality measured using monthly hot pixel counts showed that the
sum of the total fire season hot pixel counts for each year was positively correlated with
the total annual area deforested (R2 = 0.25; P < 0.0001). That correlation became
stronger when the annual burned forest area was added (R2 = 0.35; P < 0.0001). In
addition, monthly hot pixel counts were negatively correlated with monthly total rainfall
in the three forest types, but only significant in the dense forest region (R2 = 0.29; P<
0.037). Hot pixel counts were much higher in open forest than in dense or transitional
forests (Figure 3-8). In addition, fire seasonality, as measured by the ignition sources
peaks, differed in the three forest types (Figure 3-8A, B and C). This peak usually
precedes the raining season and therefore tends to be influenced by the length of the
dry season (Figure 3-8D, E and F). Based on the fire peak assumption, dense forest
had October and November as the months with highest hot pixel counts from 1992 to
2007, different from both open and transitional forests for which the peaks were in
August and September (Figure 3-8).
Historical analysis of changes in the total percentage of annual hot pixel counts
for the two months with highest fire activity demonstrated a slight shift in the period of
burns for the three forest types (Figure 3-9). In dense forest, the hot pixel counts were
lower in October than November. In comparison, fire activity in the open site decreased
in August and then increased substantially in September. Concurrently, the transitional
forest also witnessed a strong decrease in August fire counts, but much less increase in

68
September. All these results suggest that the peak of fire activity is shifting towards later
months when it is drier, which will have major impact on fire extent, size, and effects.
Fire Effects
The effects of different mean fire frequencies (MFF) on satellite-based measures
of canopy cover (PV) for the three forest sites showed a negative relationship between
canopy cover and fire frequency (Figure 3-10; PV = 0,937127 - 0,0221221*MFF; R2
=0,65; P < 0.0001). Although PV generally decreased with increases in fire frequency,
the relationships were remarkably different among the forest sites (Figure 3-11).
The distribution of canopy cover by fire frequency in the dense forest
demonstrated a very prominent impact of fire frequency on canopy cover for the highest
frequencies reported (burned 4, 5, and >6 times). Despite the strong statistical
relationship between canopy cover and fire frequency in this forest type (Table 3-4; P-
value < 0.0001), satellite-based measurements of forest canopy cover failed to
differentiate impacts of old lower burn frequencies (1-3 times burned) from the unburned
forest canopy cover (Figure 3-11A). In contrast, there was a strong positive relationship
between fire frequency and the amount of non-photosynthetic vegetative material, as
expressed by the satellite measured NPV fraction for this type of forest (Table 3-4; P <
0.0002).
Fire frequency in open forest was weakly but still significantly affected by forest
canopy cover (Table 3-4; P < 0.0001). In this forest type, the distribution of canopy
cover by frequency significantly declined only after the fourth burn, with the effect on
canopy cover being very evident for forests burned >6 times.
Transitional forest showed the largest effect of fire frequency on canopy cover.
Although the canopy cover difference between the unburned and once burned areas

69
was small for this type of forest, higher fire frequencies had substantial effects (Figure
3-11C). These responses resulted in a strong relationship between fire frequency and
forest canopy cover among the forest types (Table 3-4; P< 0.001).
Discussion
Climate change and local human activities are important drivers of change in fire
regimes all over the globe (Lavorel et al. 2007, Power et al. 2008, Bowman et al. 2009).
Logging and large scale conversion of tropical forests to other land uses come with
large increases in ignition sources as well as changes in the quality and availability of
fuel, which together influence forest susceptibility to fire (Nepstad et al. 2001, Cochrane
2003). In addition, emissions from anthropogenic fires in the tropics have a positive
feedback with global warming as well as regionally promoting severe droughts (Silva
Dias et al. 2002, Andreae et al. 2004, Artaxo et al. 2005, Costa and Yanagi 2006, Cox
et al. 2008). If changes in climate and rates of tropical deforestation and forest
degradation continue, forest fires are expected to increase in a landscape that
otherwise would be naturally fire resistant. Although several studies have estimated the
impacts of such changes, there is still a gap in understanding of the recent changes in
Amazonian forest fire regime proprieties, as well as how these properties have changed
over time and among distinct Amazonian forest types.
Based on this 24-yr analysis of annual forest fires in dense, open, and transitional
forests, fire regimes have changed dramatically in the eastern portion of the Amazonian
arc of deforestation. Once naturally rare in tropical forest landscapes, forest fires have
burned larger areas and increased in frequency, resulting in a substantial expansion of
the standing forest area being degraded by fire. In addition, forest fires show different
patterns and relationships with climate in the three forest types studied.

70
Recent increases in the annual area burned in eastern Amazon are mostly driven
by the vulnerability of the transitional and open forests to fire, even in non-ENSO years
(Alencar et al. 2006). This decoupling may be a result of current warmer weather and
decreasing rainfall, mainly during the dry season, in the eastern Amazon (Malhi et al.
2008). Cumulative annual rainfall reduction can exacerbate the impact of consecutive
droughts on forest flammability (Nepstad et al. 2004). Moreover, this region has suffered
from forest fragmentation and high rates of deforestation during the study period
(Chomitz and Thomas 2001, Pacheco 2009), which greatly increased the ignition
sources and the vulnerability of standing forest to fire (Alencar et al. 2004b).
Spatial and temporal fire regime properties are interconnected, with changes in
one affecting the other. Spatial fire regime properties such as extent of the area burned,
size and number of individual burn scars, and fire intensity are influenced by the
temporal fire regime domains such as frequency, interval, and seasonality (Falk et al.
2007). As precipitation decreases the length of the dry season typically increases and
the timing of anthropogenic ignitions for deforestation and pasture and crop
management shifts to later in the season. Fires ignited late in the dry season of a dry
year are more likely to spread into standing forest, which is itself more susceptible to
fire at such times (Nepstad et al. 2004).
In the study sites, fires are occurring later in the dry season and with greater
variability in extreme dry years, increasing the potential for extensive forest fires both in
total area annually burned and the size of individual burns. Open forest followed by
transitional forest sites were the ones most affected by changes in fire seasonality, as
reflected in more area burned and with fire scars 10 times larger on average than in
71
dense forest. These differences may result from increases in ignition sources in open
and transitional forests related to large scale deforestation, as well as to higher natural
vulnerability to fire of such forests compared to dense forest, which is more humid and
less seasonal.
Although the dense forest site was the most forested, with larger continuous forest
fragments, it burned 66% less than open and transitional forests. Nevertheless, when
dense forest was subjected to an extreme drought related to a strong ENSO event,
1200 times more forest burned than in years of average precipitation (Chapter 2).This
amount of variation is much larger than observed in the other forest types, which
indicates that with a warmer climate and more severe droughts, this forest is likely to
suffer more extensive and more frequent forest fires.
The extent, size, and number of fires are all correlated with each other and with
fire intensity and frequency as well because they affect the conditions of the fuel. Thus,
landscapes with fewer fires and with large fire scars are expected to burn more
intensely. This study confirms the reported relationship between frequency and fire
effects as measured on the basis of changes in canopy cover (Cochrane and Schulze
1999, Barlow and Peres 2008), but also showed that fire effects in transitional forest
are particularly severe if they are burned many times.
Open and transitional forests only showed substantial decreases in canopy cover,
as measured by satellite images when they were burned four or five times. This can be
a reflection of the recurrence of fire, which is high for transitional and open forests and
low for dense forest where most of the recurrent fires are happening in the following
year and then just returning after five years. The five years measured fire interval for

72
dense forest is coincident with the average ENSO return interval (Xue et al. 2003) and
the conditions needed for fuel to be flammable in this type of forest (Uhl and Kauffman
1990, Cochrane and Schulze 1999, Ray et al. 2005, Balch et al. 2008). The high fire
recurrence rates for transitional and open forests are spatially dependent on the
proximity to ignition sources. While subsequent fires in open forest are spatially
associated with settlements (78% of the consecutive fires happened within 10 km from
settlements); recurrent fires in transitional forests are located on the border with
Savanna ecosystem (Figure 3-1C) which naturally experience higher fire frequencies.
My results indicate that hot pixels correlate with forest fires as well as with
deforestation (as previously shown by Aragão et al. 2008). My results also suggest that
deforestation itself may not be a result of prior degradation from fire, but rather driven
primarily by other factors in the study regions: The proportion of the area burned by
forest fires that was subsequently deforested was less than 50% (38% - 48%) for all
three forest types, indicating that most burned area was not subsequently cleared. And,
correspondingly, the proportion of the area deforested that was burned was less than
40% (19% - 39%) for all forests, indicating that most cleared area was not previously
burned.
In sum, the coupled effects of a drier climate in the future, with more ignition
sources in more fragmented landscapes can decrease the fire resistance of even dense
evergreen forest. These changes are already underway, as demonstrated by this study,
with changes in major spatial and temporal domains of fire regimes in eastern
Amazonia. If proactive fire policies are not enacted that reduce deforestation, forest

73
degradation, and ignition sources, the emissions from forest fires in the region will likely
double or even triple due to more frequent and intense burns.
Conclusions
In the Amazon Basin it is difficult to know how much standing forest is degraded
by forest fires each year. This 24-yr time series of forest fire scars, derived from annual
satellite-based measurements, help to elucidate some of the critical fire regime
proprieties and draw some conclusions about the likely future of tropical forest
landscapes subjected to climate change and anthropogenic fires. This study revealed
that forest fire activities have already increased at least partially in response to
decreased rainfall and increased deforestation, forest fragmentation, and forest
degradation. Forest fires were also demonstrated to affect different proportions of
standing forest depending on its type, with transitional forest the most subject to larger
and more frequent burns even in less dry years.
The contributions of climate change and other human driven factors to forest
susceptibility to fire vary among forest types. On one hand, dense forest is very
sensitive to changes in climate, although landscape changes such as fragmentation can
exacerbate this susceptibility. In contrast, the fire regimes of transitional and open
forests, although sensitive to changes in climate and drought, are more sensitive to
increases in ignition sources and are less resistant but more resilient to fire, as
demonstrated by larger areas burned, at higher frequencies, and at shorter fire interval.
Increasing forest fires causes large scale forest degradation and enhances
biomass emissions to rates three or four times the annual deforestation emissions from
some forest types. Policies that address fire reduction and control are needed in the
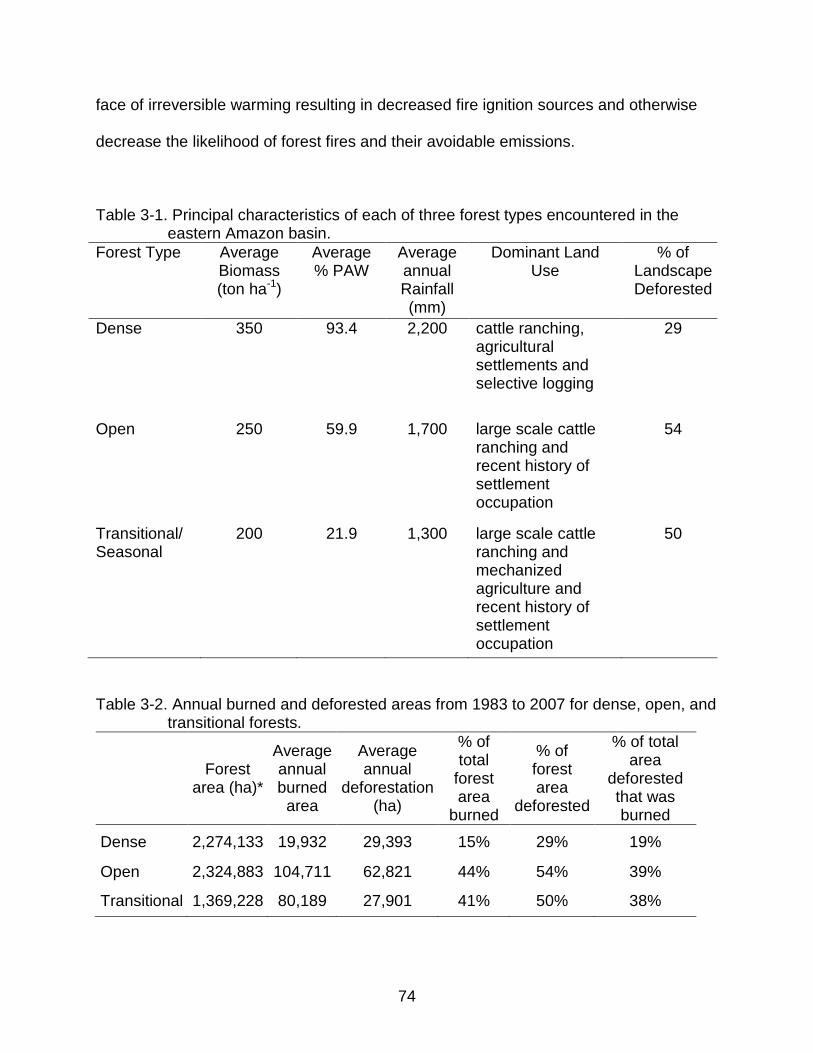
74
face of irreversible warming resulting in decreased fire ignition sources and otherwise
decrease the likelihood of forest fires and their avoidable emissions.
Table 3-1. Principal characteristics of each of three forest types encountered in the eastern Amazon basin.
Forest Type Average Biomass (ton ha-1)
Average % PAW
Average annual Rainfall (mm)
Dominant Land Use
% of Landscape Deforested
Dense 350 93.4 2,200 cattle ranching, agricultural settlements and selective logging
29
Open 250 59.9 1,700 large scale cattle ranching and recent history of settlement occupation
54
Transitional/ Seasonal
200 21.9 1,300 large scale cattle ranching and mechanized agriculture and recent history of settlement occupation
50
Table 3-2. Annual burned and deforested areas from 1983 to 2007 for dense, open, and transitional forests.
Forest area (ha)*
Average annual burned
area
Average annual
deforestation (ha)
% of total
forest area
burned
% of forest area
deforested
% of total area
deforested that was burned
Dense 2,274,133 19,932 29,393 15% 29% 19%
Open 2,324,883 104,711 62,821 44% 54% 39%
Transitional 1,369,228 80,189 27,901 41% 50% 38%
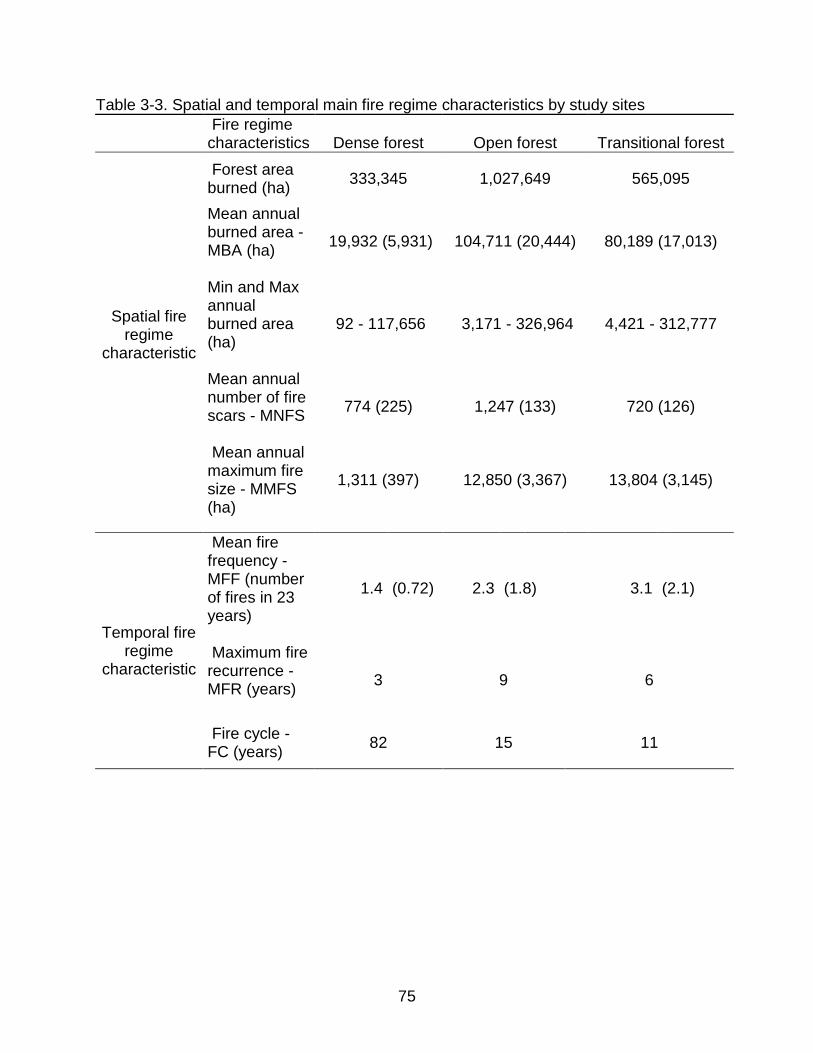
75
Table 3-3. Spatial and temporal main fire regime characteristics by study sites
Fire regime characteristics Dense forest Open forest Transitional forest
Spatial fire regime
characteristic
Forest area burned (ha) 333,345 1,027,649 565,095
Mean annual burned area - MBA (ha)
19,932 (5,931) 104,711 (20,444) 80,189 (17,013)
Min and Max annual burned area (ha)
92 - 117,656 3,171 - 326,964 4,421 - 312,777
Mean annual number of fire scars - MNFS
774 (225) 1,247 (133) 720 (126)
Mean annual maximum fire size - MMFS (ha)
1,311 (397) 12,850 (3,367) 13,804 (3,145)
Temporal fire regime
characteristic
Mean fire frequency - MFF (number of fires in 23 years)
1.4 (0.72) 2.3 (1.8) 3.1 (2.1)
Maximum fire recurrence -MFR (years)
3 9 6
Fire cycle -FC (years) 82 15 11

76
Table 3-4. Linear regression models between forest canopy cover (PV), non-photosynthetic vegetation (NPV) and mean fire frequency (MFF) for three forest types (dense, open and transitional forests).
Dense Open Transition PV vs. MFF
Slope 0.020
0.011
0.035
Intercept 0.933
0.923
0.956
R2 0.790*
0.768 *
0.903*
NPV vs. MFF
Slope
0.025
0.017
0.029
Intercept 0.037
0.027
0.046
R2 0.951*
0.933*
0.949*
*significant relationships P < 0.001
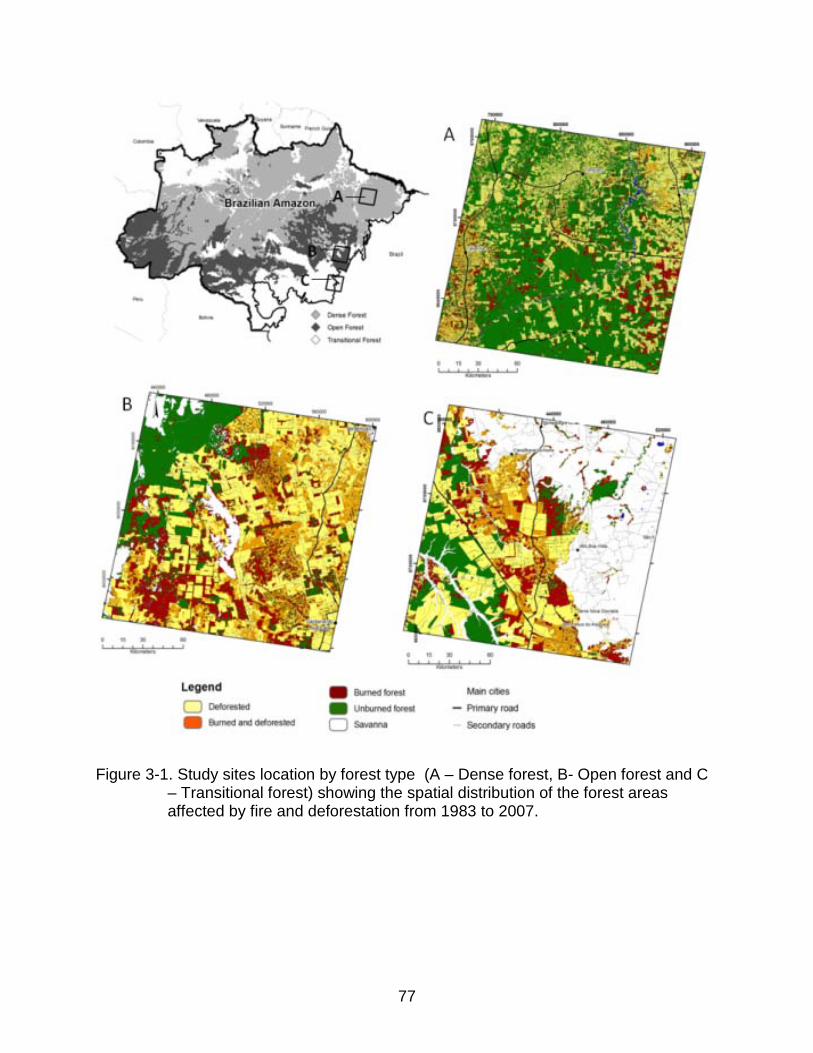
77
Figure 3-1. Study sites location by forest type (A – Dense forest, B- Open forest and C – Transitional forest) showing the spatial distribution of the forest areas affected by fire and deforestation from 1983 to 2007.
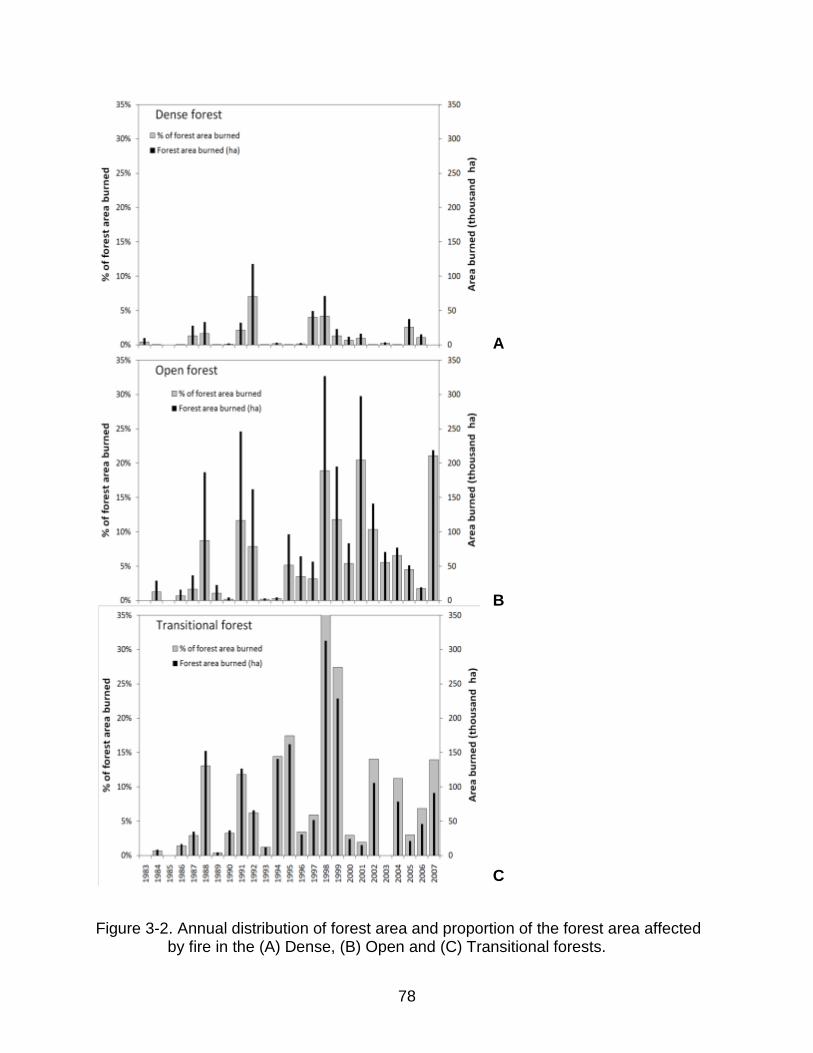
78
A B C
Figure 3-2. Annual distribution of forest area and proportion of the forest area affected by fire in the (A) Dense, (B) Open and (C) Transitional forests.
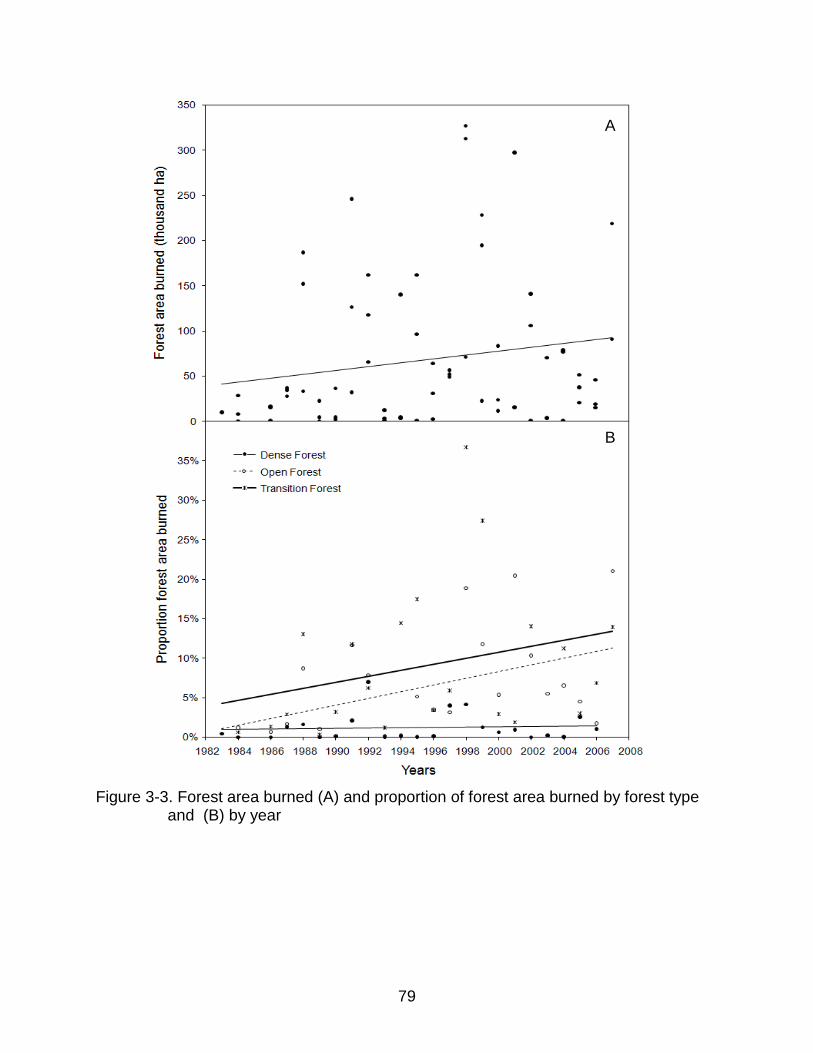
79
Figure 3-3. Forest area burned (A) and proportion of forest area burned by forest type
and (B) by year
A B
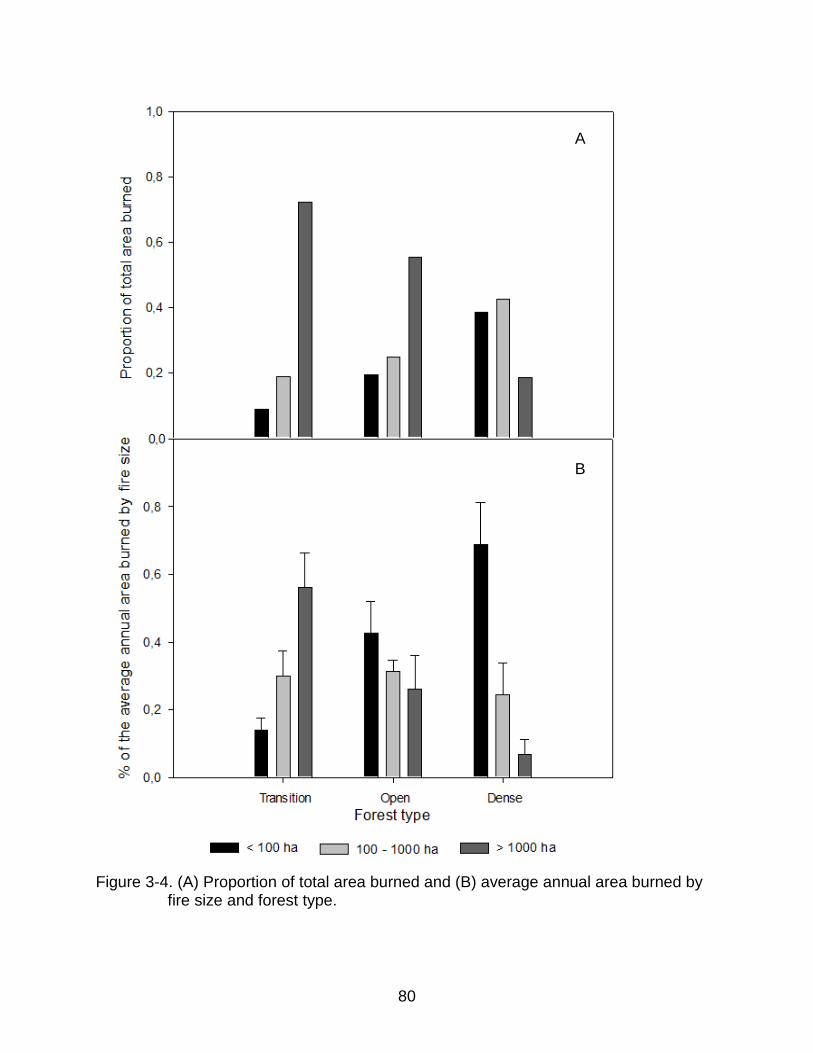
80
Figure 3-4. (A) Proportion of total area burned and (B) average annual area burned by
fire size and forest type.
A B
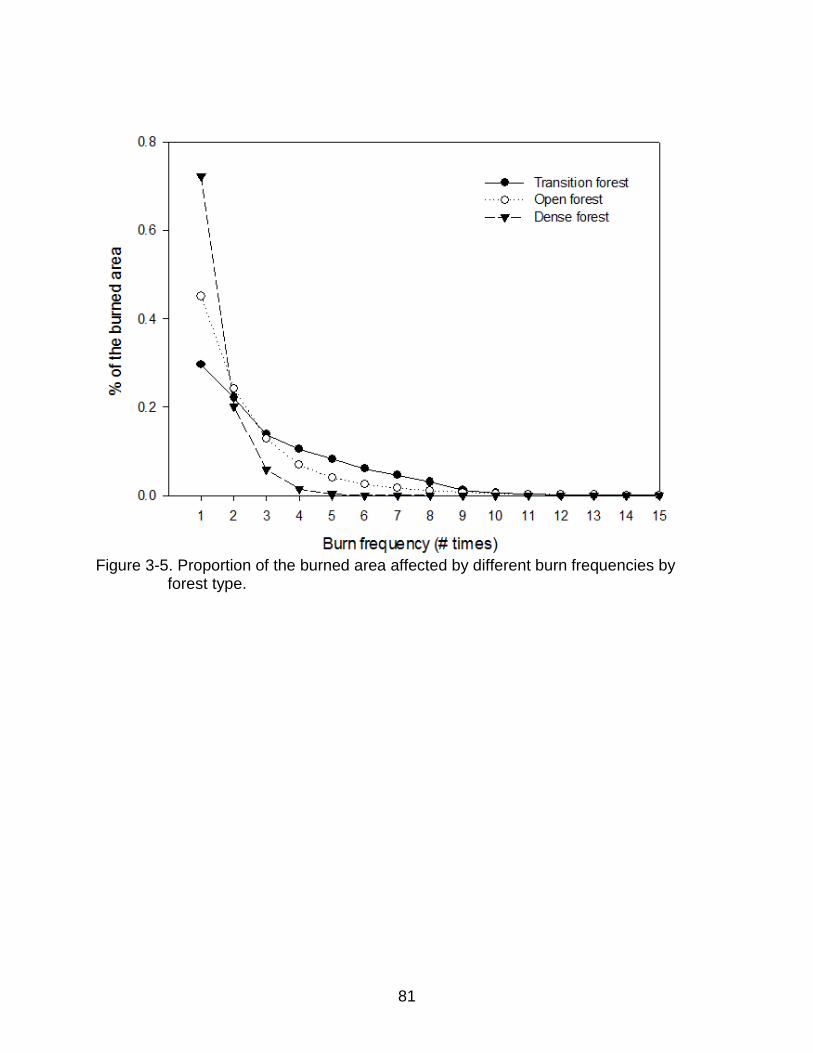
81
Figure 3-5. Proportion of the burned area affected by different burn frequencies by
forest type.
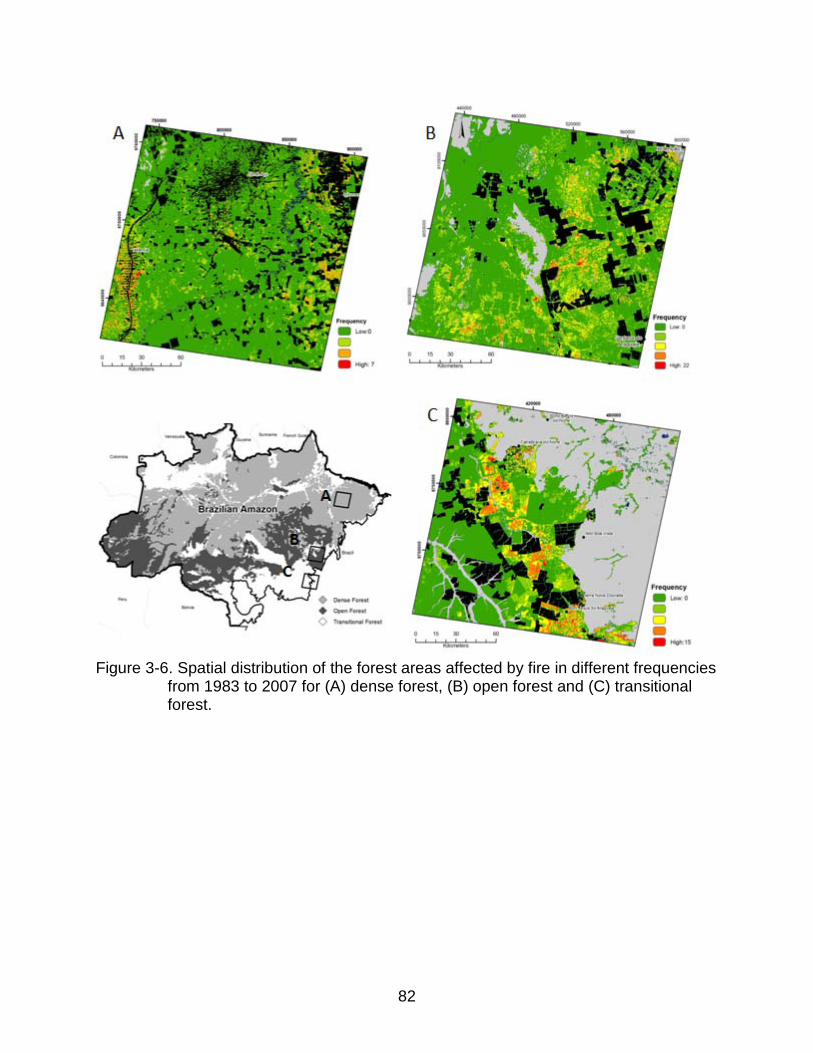
82
Figure 3-6. Spatial distribution of the forest areas affected by fire in different frequencies
from 1983 to 2007 for (A) dense forest, (B) open forest and (C) transitional forest.
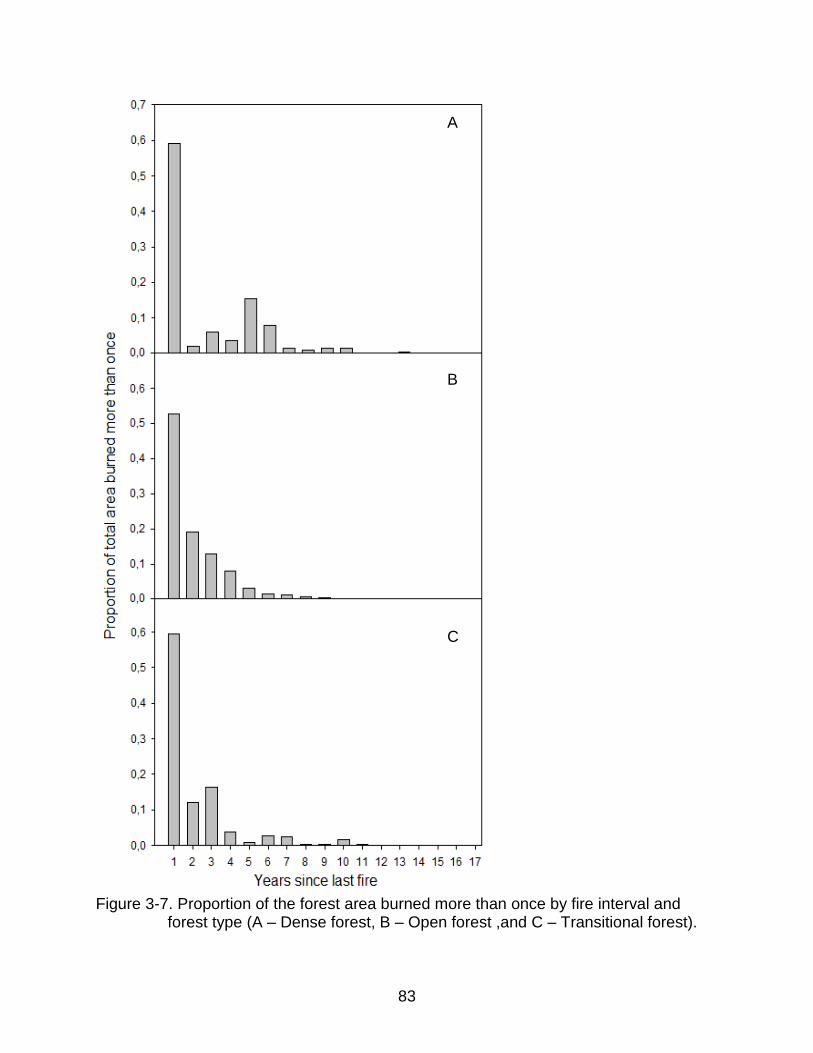
83
Figure 3-7. Proportion of the forest area burned more than once by fire interval and
forest type (A – Dense forest, B – Open forest ,and C – Transitional forest).
A B C

84
Figure 3-8. Monthly box plot distribution of hot pixel counts and total monthly rainfall
from June to November for the period of 1992 to 2007 by forest type (A and B – Dense forest; C and D– Open forest ; E and F– Transitional forest). Grey lines represent the grand means.
A B C D E F
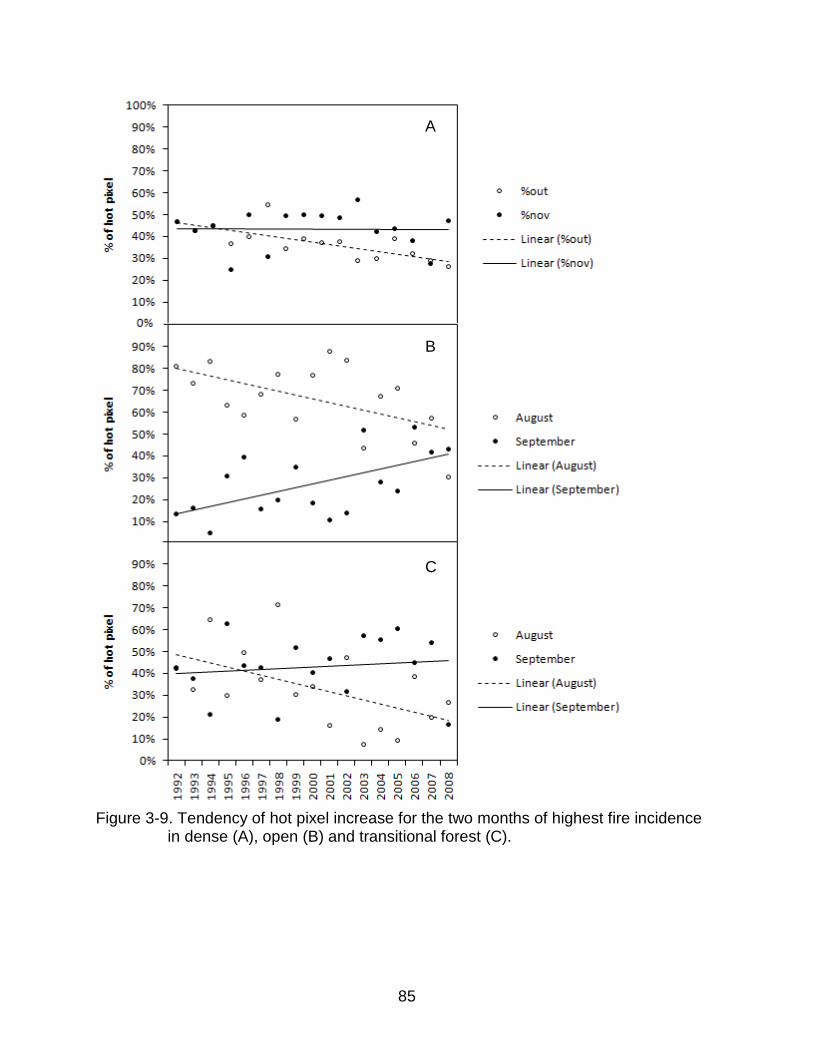
85
Figure 3-9. Tendency of hot pixel increase for the two months of highest fire incidence
in dense (A), open (B) and transitional forest (C).
A B C

86
Figure 3-10. Linear regression model between satellite-based forest canopy cover (PV) and mean fire frequency (MFF) including data from the three forest types in this study (dense, open and transitional forests; R2 =0.65; P< 0.0001).
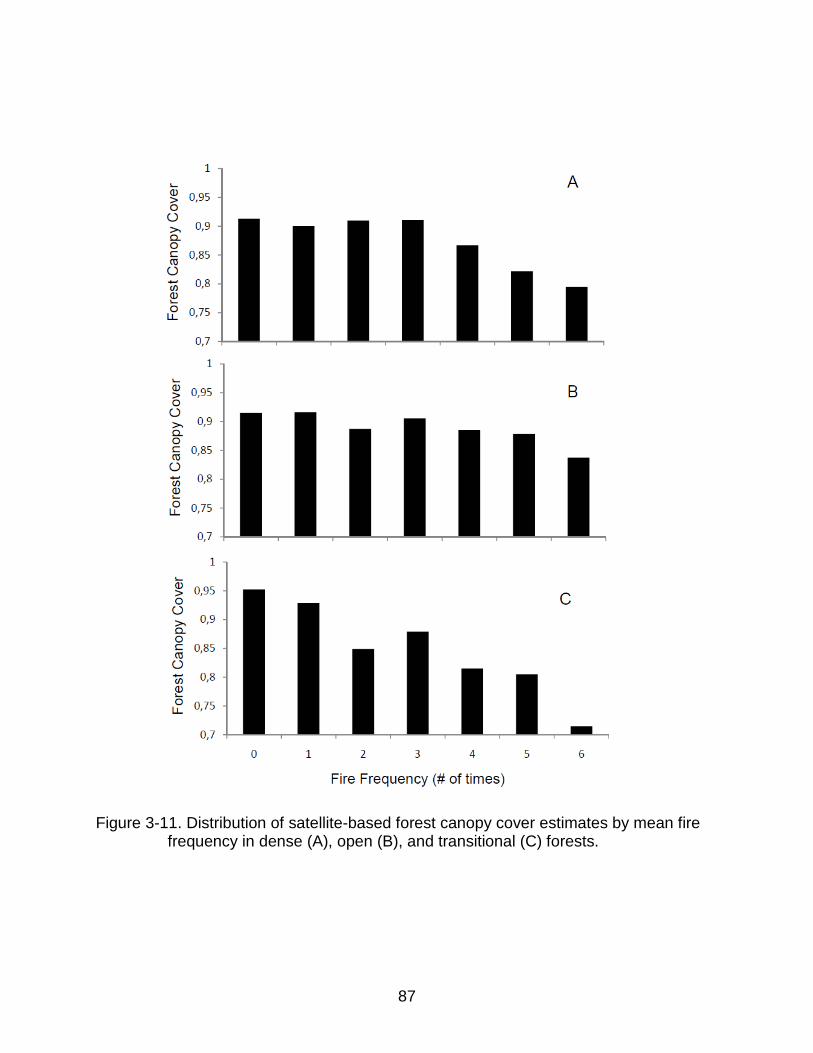
87
Figure 3-11. Distribution of satellite-based forest canopy cover estimates by mean fire frequency in dense (A), open (B), and transitional (C) forests.

88
CHAPTER 4 FRAGMENTATION, DROUGHT AND FUTURE CARBON EMISSIONS FROM
AMAZON FOREST FIRES
Introduction
From 1977 to 2009, 18% of the Brazilian Amazon’s forest cover has been lost to
deforestation. During this period, forest conversion to pasture and agriculture released
about 13 Pg of CO2 to the atmosphere at an average annual rate of 0.7- 1.4 Pg from
deforestation (Nepstad et al. 2009). During this two-decade period, deforestation
averaged 17,034 km2/yr reaching peaks of 29,059 km2 and 27,772 km2 in 1994 and
2004, respectively (INPE 2010), accounting for 75% of Brazil’s reported CO2 emissions
during the same period.
Despite the alarming historical rates, deforestation in the Amazon has declined to
its lowest level in twenty years since 2006, reaching 8,500 km2 in the 2008-2009 period
(Nepstad et al. 2009). Nevertheless, despite this dramatic decrease in deforestation
rates, CO2 emissions associated with land-use change in the Amazon may continue to
increase. The current deforestation fronts are moving towards the Amazon forest
interior where carbon stocks are thought to be higher and the per hectare emissions are
also potentially higher (Loarie et al. 2009). In addition, emissions associated with forest
fires (often the result of land-clearing or –management activities) (Nepstad et al. 1999a)
still need to be better documented and understood. The development of a system to
monitor understory forest fires, similar to those developed to monitor fire in open land
(Giglio et al. 2009), is still needed to identify the extent of forest degradation by fire and
its associated emissions.
The relationship between deforestation and forest fires goes beyond the provision
of ignition sources. Deforestation caused by land use change also generates forest
89
fragmentation which affects the resistance of forests to escaped, land-use related fires.
Deforestation promotes change in forest edges, exposing them to increased solar
radiation and a drier microclimate, favoring structural changes and enhancing their
susceptibility to fire (Ferreira and Laurance 1997, Cochrane 2001, Laurance et al.
2002). Fragmentation exposes more forest edges to such conditions increasing the area
affected by this edge effect (Broadbent et al. 2008). Once an edge is burned, the
likelihood of repeated fire increases in subsequent years, enlarging the area exposed to
edge effects (Cochrane and Laurance 2002). Smaller fragments are also more
susceptible to fire, and the larger the ratio of edge-affected-area-to-fragment-size, the
higher the chance that the fragment will completely burn (Alencar et al. 2004b). In
addition, fragmented landscapes produce more sources of fire ignition.
In addition to the dominant role of forest fragmentation and the presence of ignition
sources, several other elements affect the spread of forest fires. The forest interior also
has to present the proper conditions in terms of fuel and drier climate to carry the fire for
longer distances inside the forest (Ray et al. 2005). In this context, the forest edge
cannot be treated from the perspective of an edge-interior dichotomy, but as a
continuum of changes that are heavily influenced by the lateral penetration of warm air
from surrounding cleared lands. This lateral penetration of warm air, increases the
internal forest vapor pressure deficit (VPD), causing forests to be more flammable along
the edges, even when the buffered forest interior has not yet achieved the VPD
necessary for fire to spread (Balch et al. 2008).
These conditions are usually controlled by climatic variations, such as extreme
drought events or consecutive years of moderate drought. Extreme and consecutive

90
droughts can deplete the plant available water in the soil, promoting water stress to the
plants and consequently canopy openness by leaf shedding, allowing more solar
radiation to reach the forest interior and impact local microclimate, enhancing its
flammability (Nepstad et al. 2004). Other disturbances of the forest interior, such as
logging, can also affect the forest microclimate, increase fuel material and make the
forest more susceptible to burning (Holdsworth and Uhl 1997). Smaller forest fragments
surrounded by ignition sources in dry years provide the necessary fuel quality, ignition
potential, and climate conditions for forest fires to spread.
The combined result of deforestation, forest fragmentation, and severe drought
have played a major role in carbon emissions from forest fires in the Brazilian Amazon
through both direct biomass combustion and committed emissions from post-fire tree
mortality (Nepstad et al. 1999b, Schimel and Baker 2002, Haugaasen et al. 2003,
Alencar et al. 2006). Committed emissions also account for the loss of carbon that
eventually will be released to the atmosphere through decomposition (Fearnside 1997).
During the 1997 and 1998 ENSO years, forest fires in the Brazilian Amazon were
estimated to double the regional carbon emissions from deforestation, accounting for up
to 0.3 Pg (Nepstad et al. 1999b, Alencar et al. 2006). Emissions from Amazonian forest
fires can increase in a scenario of stronger and more frequent ENSO events or other
climatic phenomena that promote change in rainfall patterns and lengthen and/or
intensify drought periods. These climatic phenomena are expected to vary in frequency
and intensity as a consequence of changes in global climate (Trenberth and Hoar 1997,
Timmermann et al. 1999).

91
Although CO2 emissions from Amazon forest fires have received increased
attention from the scientific community in recent years, there is still little understanding
of their variability and contribution to total annual CO2 emissions, or their relationship to
biophysical and anthropogenic landscape characteristics. This Chapter uses a 24-year
history of forest fire from three study sites located in the eastern Amazon presented in
Chapter 3 to quantify and understand the relationship between fires, climate,
biophysical and anthropogenic landscape characteristics. The three regions were
chosen to represent a gradient of drought, forest types, and deforestation, and are
located in one of the most fragmented and climatically threatened regions of the basin
(Malhi et al. 2008, Asner et al. 2010). The biophysical elements used in this study
include forest type (RADAMBRASIL 1981) and plant available water in the soil (Nepstad
et al. 2004), whereas the land-use elements include measures of fragmentation and
degradation as well as the likelihood of ignition. These relationships are used to
determine the forest area at risk of understory fires in different drought conditions, as
well as to estimate the past and future CO2-equivalent emissions committed to the
atmosphere by Amazon forest fires. This study provides essential information to
improve the accuracy of regional net carbon flux projections under a future of climate
change, land use and forest fragmentation.
Materials and Methods
Forest Type Case Studies
I selected three regions located in the eastern portion of the Amazon arc of
deforestation as case studies to estimate the forest fire history and derive its
relationships with deforestation, fragmentation and climate conditions. These regions
were delimited by the Landsat scenes path and row 223/62, 224/66 and 224/68,

92
representing landscapes dominated by dense, open and transitional forest types (IBGE
2004), with biomass ranging from 350 ton ha-1 to 200 ton ha-1, respectively (Saatchi et
al. 2007). The selection of these scenes also took into account a 5-yr average map of
soil plant available water (PAW; Nepstad et al. 2004) and the average total annual
rainfall for the last 20 years. These sites were selected in a way to represent different
land uses and a gradient of biomass and drought conditions (Figure 4-1; Table 3-1).
The land use history of the three study sites was determined based on a 24-yr
satellite-based time series analysis using the spectral mixing model algorithm CLAS-
BURN and the Burn Scar Index (BSI) to map annual deforestation and forest burn scars
(Chapters 2 and 3). These regions also represent distinct land use characteristics, with
the dense forest site (29% deforested) dominated by a mosaic of cattle ranching,
agricultural settlements, and selective logging (Uhl et al. 1997, Faminow 1998, Margulis
2003, Lentini et al. 2005); the open forest site (54% deforested) characterized by a
longer history of large scale cattle ranching and recent history of settlement occupation
(Mahar 1989, Schmink and Wood 1992, Chomitz and Thomas 2001, Pacheco 2009);
and the transitional forest site (50% deforested) with similar occupation history of the
open forest site but including large-scale mechanized agriculture and intensive cattle
ranching (Alencar et al. 2004a, Morton et al. 2006, Nepstad et al. 2006b).
Anthropogenic Landscape Characteristics and Forest Fires
The relationships between deforestation, fragmentation and forest fires were
derived from 72 annual deforestation and burn scar maps derived from the 24-yr time
series for the three study sites (Chapter 2 and 3). These maps were combined in a GIS
to investigate how local spatial characteristics such as fragmentation and proximity to

93
ignition sources may have contributed to fire occurrence and frequency in these regions
for the past three decades.
The deforestation maps were used to create two sets of maps which represented
the degree of landscape fragmentation and the proximity to the forest edge. The
fragmentation maps were based on the density of deforested areas and the size and
shape of the forest fragments to generate a forest fragment index map. The proximity to
ignition sources or forest edges was assessed by calculating the linear distance from
roads and the borders of deforested areas to the forest interior.
The proximity to forest clearings was then related to the annual forest burn scar
maps to assess whether forest areas located at the edge of fragments are more
susceptible to burning than areas in the core of the forest fragments (Cochrane 2001,
Alencar et al. 2004b). The forest fire scar maps were also associated with proximity to
roads to derive this relationship and test its difference from proximity to clearings. This
analysis provided the proportion of the forest area burned for each distance increment
from roads and clearings for each study site in drier, average and wetter years. These
distance maps were also combined with a fire frequency map assembled for each study
site based on the 24-yr burn scar maps, to indicate the relationship between proximity to
forest edge and roads with the likelihood of more frequent fires.
The fragmentation maps were also combined with the forest burn scar maps and
the burn frequency map to test the assumption that fragmented portions of the
landscape burn more and more frequently than less fragmented areas. This analysis
provided proportions of the area burned in low, medium and high fragmented areas for
the study sites.

94
Landscape Biophysical Characteristics and Forest Fires
Landscape biophysical characteristics are represented in this study by the forest
flammability model developed by Nepstad et al. (2004). This model integrates 1494 soil
texture profiles with climatic data such as rainfall, temperature, and relative humidity, to
estimate the plant available water (PAW) up to 10-m soil depth. The PAW represents a
proxy for forest flammability since it indicates the level of drought stress to which the
forest is subjected. Thus, the forest flammability maps are strongly driven by severe
droughts, since they reduce the water entering in the system by decreasing rainfall, at
the same time that the rate of water leaving the system through evapotranspiration
increases, consequently reducing the water stored in the soil and available to plants
during the dry season (PAW). The consequences of low PAW include leaf shedding and
reductions in leaf area index (LAI) and increased canopy openness, which increases
solar radiation reaching the forest floor, thereby increasing the understory temperature
and the vapor pressure deficit (VPD) (Ray et al. 2005). Leaf shedding also constitutes
an increase in fuel load (Nepstad et al. 2001).
Average monthly PAW maps generated by Nepstad et al. (2004) from 1996 to
2001, updated through 2005, were used to indicate the drought status of the forest for
three sets of climate conditions. These maps were averaged using the 4 driest month
(July to October) for the wet, average rainfall and dry years defined based on the upper
and lower 10% average rainfall anomaly from the period of analysis (Figure 4-2).
The forest burn scar maps were used to capture the variability over time of the
relationship between forest fire occurrence, landscape characteristics (anthropogenic
and biophysical), and annual climatic conditions. The anthropogenic landscape
characteristics are represented by fragmentation and proximity to ignition sources,
95
whereas the biophysical landscape characteristics are represented by the plant
available water (PAW). The derived relationships between anthropogenic and
biophysical characteristics with historical fire occurrence were used to develop and test
three understory forest fire risk models. These models were developed for different
climatic conditions representing levels of drought divided in wetter, average rainfall and
drier years.
Forest Fire Risk
The individual relationships among forest fires and landscape characteristics were
integrated for the years with a positive rainfall anomaly defined as positive deviations of
more than 10% from the average rainfall for the entire period, representing the wetter
years. The average rainfall years included those years within a 10% deviation from the
average rainfall baseline. Drier years were defined as those years with negative
anomaly with a deviation larger than 10% from the average annual rainfall for the period
(Figure 4-2).
The predictive forest fire risk model for each forest type was developed based on
logistic regressions that used the integrated fire occurrence maps for distinct climate
conditions as dependent variables and the biophysical flammability maps and the
integrated landscape characteristics maps as independent variables (Figure 4-3). The
probability functions retrieved from specific anthropogenic and biophysical
characteristics were incorporated in ArcGIS and extrapolated to similar landscapes in
the Amazon creating spatially and temporally explicit probability surfaces. In the process
of developing these statistical predictive models, half of the fire scars mapped were
used to build the probability model while the other half was used to validate the ability of
the model to indicate spatially the areas under higher risk of forest fire occurrence.

96
Forest Fire Emissions
Forest fire CO2 emissions were calculated for the study sites using the main type
of forest retrieved from a vegetation map (IBGE 2004) as a basis to calculate the carbon
stocks. The average carbon stocks for each forest type were retrieved from Saatchi et
al. (Saatchi et al. 2007). The forest emissions from each forest site were calculated
using the area burned by different frequencies assuming rates of mortality and carbon
loss from Cochrane and Schulze (1998) for all forest types. The proportion of carbon
loss by each fire frequency category and for each forest type were calculated at 1-km
distance intervals from the forest clearings identified in the 2007 images. The CO2
emissions resulting burned forests that were deforested between 1983 and 2007 were
not accounted for in this calculation, under the assumption that they were already
accounted for in the deforestation emissions.
Future emission scenarios of understory forest fire were based on a probability
map estimated as a function of changes in forest flammability, road infrastructure,
fragmentation, and ignition sources. These maps were calculated for wetter, average,
and drier rainfall scenarios. In these scenarios the wetter condition was based on the
average PAW for the wet years, whereas the average and drier scenarios were based
on the average PAW of the average rainfall years and the average PAW for the dry
years, respectively. The emissions for each type of forest for these three climatic
scenarios were extrapolated to the rest of the Brazilian Amazon. This extrapolation was
done using the areas indicated as having a higher probability of burning, derived from
the PAW maps for three climatic conditions, fragmentation index map and proximity to
roads, combined with the percentage of area burned in different frequencies from the
clearings (Table 4-1). The areas of higher probability of burn ( > 80% probability) for
97
wet, average and dry years were used to estimate the area at risk of burning. While the
estimated area burned was calculated using the areas under risk that were within the
first 5km from a forest clearing.
Results
Deforestation and Forest Fires
Forest fires are spatially dependent on deforestation, with 97% of fire incidence
and area burned observed within 1- and 2-km of forest clearings. In addition, 92% of
forest fires occurred in highly fragmented areas. On average, 87.6% of burns occurred
within the first kilometer, 9.5% within the second kilometer, and 2.2% in the third
kilometer from forest clearings. The majority of area burnt within 1-km of forest clearings
was concentrated in the dense and transitional forest types, with 92% and 91% of fires
occurring in this area. Open forest had a greater extent of forest fire spread, with 81% of
the total area burned occurring within the first kilometer of clearings; the longest
distance of fire spread from forest edge (15-km) was also observed for this forest type.
By contrast, fire occurrence was observed up to 5-km from the forest edge in dense
forest, and up to 8-km in transitional forest. This is consistent with previous results from
Alencar et al. (2006) and provides further evidence that the proximity to clearings is an
important predictor of forest fire occurrence.
Fire is also more frequent in the forest edge compared with the forest interior. The
majority of the area that burned within the first 3- or 4-km from the forest edge burned
once, twice or more than three times (Figure 4-4). However, the proportion of the area
burned at different frequencies was distinct among the forest sites. Within all the forest
sites, transitional forest was the vegetation type that had the largest portions of forest
edge burned with higher frequency. In dense forest, only 15% of the forest area within

98
the first kilometer from the clearings was burned, of which 11% burned just once. The
proportion of the forest area burned within the first kilometer away from clearings was 3
or 4 times higher in the other forest types, presenting larger portions of the area burned
more than three times during the period of analysis. The proportion of forest burned
twice was similar among all forest types, suggesting that the likelihood of recurrent fires
is higher within the first kilometer from the forest edge independent of the vegetation
type.
Roads and Forest Fire
Roads are the second anthropogenic landscape variable that can be used to
predict forest fires. Although roads are related to deforestation, its relationship with
forest fire is not as strong as it is with deforestation in terms of fire frequency (Figure 4-
5). The influence of roads on forest fires extends as far as 10 km in all study sites, with
96% and 99% of the area burned in dense and transitional forest burned within 10 km of
a major road and 85% of the open forest burned up to this distance from all government
roads (Figure 4-6).
In spite of the fact that more forest area is burned within the first kilometer from
federal, state and municipal roads (mainly in dense and transitional forests), the
proportion of the area burned is high even beyond 10-km from the government roads.
Forest fires can occur up to 20km from government roads in the dense and transitional
forest site, whereas in the open forest site no significant difference was detected
between the proportion of area burned within each kilometer further from roads. This
can be explained by the type of deforestation pattern in this region, which is
characterized by large clearings with incipient road access pushing the forest edge

99
further away from the government roads, since the private roads did not enter in this
analysis (Brandão Jr. and Souza Jr. 2006).
Anthropogenic and Biophysical Landscape Variables and Fire Frequency
From the four continuous anthropogenic and biophysical variables selected to test
and predict the relationship between forest fire occurrence and frequency,
fragmentation was the only variable that correlated positively with fire frequency, with
frequency increasing as density of forest fragments increased (Table 4-2). The other
variables, including distance from roads and clearings and average PAW, were
negatively correlated with frequency suggesting that areas closer to government roads,
near forest edges, and with lower average PAW are likely to be subject to higher fire
frequencies than areas with less road accessibility, increased distance from
deforestation patches, and with less sources of ignition, as well as areas with
biophysical conditions more suited for withstanding long drought events (i.e., high
capacity to hold water in the soil).
Fragmentation and distance from clearings were the variables that significantly
correlated with fire frequency in all forest types. The other variables, such as distance
from roads and average PAW, were significantly correlated with fire frequency only in
open and transitional forests. The statistically insignificant correlation between fire
frequency and average PAW in the dense forest indicates that unlike distance from
clearings and fragmentation, PAW may exert large influence on the temporal variation
of fire rather than on its spatial patterns in this forest type. At the same time, the lack of
significance in the correlation between distance to roads and fire frequency in this site
may be a result of the increasing importance of private farm roads—distinct from official
government roads—in explaining the reoccurrence of forest fires.
100
Among the anthropogenic landscape characteristics, distance from clearings and
fragmentation were strongly correlated in all forest sites. This interdependency can be
explained by the fact that the source of both of these variables is the annual
deforestation maps. Distance from roads also correlated significantly with fragmentation
and distance from clearings in all sites but the dense forest sites, suggesting a possible
effect of non-official roads on deforestation in this region, which in other regions is
captured by the proximity to official federal, state, and municipal roads.
The distance from clearings and roads represent two distinct scales of fire
prediction. While the first has a proximal correlation with fire distribution (microscale),
the second acts as a landscape-level correlation or mesoscale determinant of forest fire
distribution. These variables are correlated among themselves. There is a very tight
spatial correlation with fire and distance to clearing, whereas the distribution of clearings
is highly correlated with roads.
Forest Fire and Climatic Conditions
Three forest fire predictive models for distinct drought conditions were developed
for each study site based on the aggregated burn scars maps during years of high
precipitation (Wet), average annual rainfall (Average), and low precipitation (Dry). The
wet years accounted for an average increase in rainfall of 841 mm more than in the
average rainfall years (1676 mm), while the dry years accounted for an average of 386
mm less than the average annual precipitation.
Analysis of variance indicated significant difference between the area burned
among wet, average, and dry years in all forest sites (Figure 4- 7; F < 0.0001). These
differences were larger in dense forest than at the other sites, where the amount of area
burned during wet years was 21 times smaller than average years (from 379 ha to

101
8,005 ha) and 129 times smaller than dry years (from 379 ha to 48.967 ha). For open
forest, the difference was four times smaller between the wet and the average rainfall
years and 13 times smaller between wet and dry years (16,756 ha, 71,341 ha and
221,866 ha in wet, average and dry years respectively); while for transitional forest
these differences were three and 11 times smaller (14,452 ha, 49,071 ha and 164,936
ha respectively during wet, average and dry years). This means that wet years had an
area that was 0.8%, 7.6%, and 8.8% of the average area burned in dry years for dense,
open and transitional forests, respectively. These numbers lead to the conclusion that a
20% decrease in rainfall from the average precipitation years represents an increase in
area burned of 6.1, 1.2 and 2.5 times for dense, open and transitional forests.
Conversely, a 20% increase in rainfall from the average rainfall represents a decrease
of 1.8, 1.9 and 1.1 times in the area burned consecutively in these three forest sites.
Forest Fire Risk and the Potential for Fire Spread
The fire scar dataset integrated by climatic conditions was used to generate forest
fire probability surfaces based on logistic functions that were a product of: (i) forest
flammability and biophysical characteristics integrated in monthly plant available water
maps and (ii) degree of fragmentation and presence of ignition sources provided by
road accessibility and deforestation clearings. Due to the dependency between the
fragmentation density variable and distance from clearings, the distance from clearings
variable was excluded from the prediction models. The probability models developed for
each forest type and climatic conditions used half of the fire scars to build the model
and half to validate it. Model results had Relative Operating Characteristic (ROC) values
varying from 0.58 for the Wet climate condition in dense forest, to 0.78 for the Average
climate condition in transitional forest (Table 4-3). The ROC is a model validation

102
method that calculates the agreement between the probability surface (forest fires risk
maps) and the location of measured fire occurrence (portion of burn scars not used in
the model). Models with ROC closer to 0.5 are considered random and with low location
predictability (Mason and Graham 1999). In addition, stepwise forward logistic
regression based on 1000 random sample points distributed over the study areas
indicated fragmentation (FRAGM) and PAW as the most important variables to these
models.
These functions were applied to the entire Amazon 2008 fragmentation density
map (INPE 2010), road distance map (SIPAM 2004) and average PAW maps (Nepstad
et al. 2009) for each set of climate conditions to identify the areas at higher risk for
understory fires (Figure 4-8). The forest fire predictions under different climatic
conditions indicated that 10,007 km2, 70,415 km2 and 363,456 km2 of the Brazilian
Amazon forest could be susceptible to burning in wet, average, and dry years,
respectively, considering just the areas with a higher probability of forest fires (p > 80%).
This represents an increase in the area susceptible to forest fires that is 36 times larger
in dry years if compared with wet years. These models also suggest that 9% of the
dense forest will be susceptible to fire in dry years, in contrast to 13.7% and 16.2% of
open and transitional forests. These proportions decrease to 0.1%, 0.5% and 0.6% in
wet years and 1.2%, 4% and 2.7% in average rainfall years for dense, open and
transitional forests, respectively (Figure 4-9). Higher probabilities found along the
eastern portion of the Amazon in wet years and along the arc of deforestation in
average rainfall years indicate that fragmentation is playing a more important role than
climatic conditions in explaining forest fire occurrence. Perhaps these areas have

103
reached the tipping point where the abundance of ignition sources and the increased
forest degradation are majority anthropogenic driven.
Forest Fire Emissions
The results of the forest fire probability maps for the three climate scenarios were
used to estimate the amount of potential CO2 emissions from forest fires using the
emissions calculated from the forest fire scar dataset for the three main forest types in
the Amazon as a basis. The burn scars maps of dense, open and transitional forests
suggested that in average 6, 23 and 20 Tg yr-1 of CO2, respectively, were committed to
the atmosphere during this period by forest fires (Table 4-4). When analyzed in distinct
climate conditions, the CO2 emissions of such fires were 2 to 18% smaller than the
average burned area for the wet years, 40 to 60% smaller in the average rainfall years,
and 2 times higher for the dry years (Table 4-4), indicating that the dry years are
elevating the average burned area by forest fires and consequently its emissions. As a
result, while the average burned area by forest fire emission was 83% of the average
annual deforestation emissions, the committed emissions from forest fires during the dry
years (7 out of 24 yr) in all sites together were 76% more than the average annual
deforestation-driven CO2 emissions.
The forest fire-driven CO2 emissions from the Brazilian Amazon were calculated
based on an estimated annual burned area defined by the areas under high fire risk and
the proportion of area burned by different frequencies within the first 5 kilometers of
forest clearings and within 10km of major government roads. These proportions were
derived from the relationship between the integrated burn scars from each set of climate
conditions and the distance from forest edge for each of the forest sites. The estimated
area burned was 35%, 25%, and 14% of the area of highest forest fire risk under wet,
104
average and dry climate conditions, respectively (Table 4-4). The calculation of the CO2
emissions took into account the biomass reduction for each frequency based on Table
4-1.
When extrapolated to the other areas of the Amazon covered by dense, open and
transitional forests that are close to roads and in fragmented landscapes, the committed
CO2 emissions from forest fires reaches 0.43 Pg of CO2 yr-1 in average rainfall years
(Table 4-5). This number may triple during years of extreme drought (e.g ENSO) and be
reduced by 84% during wet years (below the last two decades average rainfall). The
CO2 emissions estimated from Dry years are about the same as the higher estimate of
CO2 emissions by deforestation (1.4 Pg CO2 yr-1) (Nepstad et al. 2009).
Discussion
Forest fires are important sources of CO2 emissions in the Brazilian Amazon.
These emissions are strongly associated with biophysical and anthropogenic forces
such as drought and fragmentation. In this study, drought is represented by PAW ,
which integrates changes in canopy openness by leaf shedding due to water stress,
reduction of leaf area index and increase in VPD (Nepstad et al. 2004, Ray et al. 2005),
thereby impacting the quantity and quality of the fuel load (Nepstad et al. 2001), which
accounts for the flammability status of the standing forests. Fragmentation and distance
from roads and clearings account for the pressure of anthropogenic changes over the
forest as well as the availability of ignition sources.
From all these variables, it is suggested that fragmentation has a major impact on
the spatial distribution of forest fires, with 92% of the study area burned in highly
fragmented areas or with high concentration of forest fragments. The majority of forest
fires were concentrated within 1 or 2 km of the forest clearings and within 10km of major

105
roads. These results corroborate the findings of Alencar et al. (2006) and Cochrane and
Laurance (2002), both of which found high proportions of area burned within the first
few kilometers of the forest edge (an average of 2.4 km, up to 4km), and corresponds
with the distance of forest desiccation found by Briant et al. (2010).
Unlike PAW, which is a more temporal forest fire predictor, and proximity to roads,
which is essentially a spatial predictor, fragmentation represents both the temporal and
spatial dimensions of forest fires. Fragmentation has been suggested in the literature as
an important process for increasing the forest area under influence of edge effect and
promoting changes in forest composition and structure by altering the forest
microclimate (Laurance et al. 2002), therefore impacting its flammability. This influence,
derived from tree mortality and damage, has been found to impact forest within100 to
400 m from the forest edge (Harper et al. 2005), which represents about 10-40% of the
area impacted by fire in the study sites. Conversely, the fact that fire was observed to
penetrate further into the forest in all study sites suggests that the length of the edge
effect for this type of disturbance may be sensitive to local climatic changes such as the
ones promoted by extreme droughts. This highlights the important interactions between
fragmentation and drought effects in expanding the edge effect as a fire spread
facilitator.
The age of the forest fragments represents the temporal effect influencing the
magnitude and distance of the edge influence, since the relationship between distance
and edge influence becomes weaker at older forest edges compared with newer forest
edges (Harper et al. 2005). In addition to age, this relationship may also be affected by
the frequency of fire and its correlated intensity which may promote the gradual
106
increase in the extent of the edge influence. This may explain the observation that the
highest forest fire frequencies are located at the immediate edge of the forest fragments
found in this study, enhancing the effects of forest edge in causing forest degradation.
The higher frequencies found on the edges of forest clearings presented in this
study also suggest that different forest types may be subject to distinct distance edge
influences. For example, forest fires were demonstrated to be more frequent on the
border of transitional forests, which are also more affected by seasonal droughts in
comparison with the border of dense forests. This suggests that the length of the edge
effect from the border to the forest interior increases from North to South in the eastern
Amazon along a seasonal drought length gradient.
The matrix of land-uses surrounding the forest fragments may also exert important
impact on the forest area influenced by the edge effect (Laurance et al. 2002, Harper et
al. 2005), and thus affect likelihood to of forest fire. Alencar et al. (2004b) found that the
smaller fragments have higher burn probabilities than larger fragments, mainly in years
of anomalous droughts, which may reflect the relationship between the amount of forest
edge area exposed and the likelihood of being exposed to more sources of ignition, in
addition to the enhanced impact of the edge effect described above.
Roads are another important variable for explaining forest fires since they are
important predictors of deforestation (Kaimowitz and Angelsen 1998), and therefore
related to forest fragmentation. Roads open access to forest resources, often beginning
with logging, and subsequently leading to deforestation and forest conversion to
extensive land uses such as cattle ranching and slash and burn agriculture (Soares-
Filho et al. 2004). This variable assumes that characteristics of surrounding land uses

107
that use fire as a management tool, such as cattle ranching and slash and burn
agriculture, would also contribute to the likelihood of an escaped fire to happen. This
study suggests that roads influence forest fire occurrence within a distance of up to
10km. This distance can be much higher in open forest or in areas with large private
deforestation patches where access is based on private roads that are not part of the
official roads dataset, thus underestimating the impact of roads to predict forest fires.
Based on the importance of fragmentation and PAW as spatial and temporal
predictors of forest fires, a prediction model was developed to identify areas of higher
forest fire risk under three climatic scenarios including wet, average and dry years. This
model, based on the relationships between fragmentation, distance to roads clearings
and PAW and the integrated forest fire maps for three forest study sites in eastern
Amazon, was used to estimate the forest fire-driven CO2 emissions for the entire basin
covered by dense, open and transitional forest types.
The importance of the temporal forest flammability domain (PAW) was tested
when the spatial predictors (fragmentation and distance from roads) were fixed in the
model. This routine indicated that, under similar fragmentation conditions, differences in
PAW had a significant impact on the forest area under high risk of fire. The dry years
generated an area of fire risk 36 times larger than the wet years. On the contrary, the
impact of fragmentation was identified in some areas of the arc of deforestation such as
the northern part of Mato Grosso state along BR163, and the eastern and southeastern
part of Para state, where even in wet years the risk of forest fires was high due to a high
degree of fragmentation.

108
These models revealed that even when dense forest had the least amount of area
burned, this type of forest was more susceptible to strong droughts than the other forest
types analyzed. The 20% decrease in rainfall may represent an increase of 6 times the
area burned in dense forest compared with the open and transitional forests that
suffered increase of 1.2 and 2.5 times in the area burned if compared with the average
rainfall years. This may be an indication that the resistance of dense forest to fire may
be strongly affected by small changes in rainfall, making this type of forest more
susceptible to future changes in climate and fragmentation.
These results have serious implications for current and future regional land use
related CO2 emissions, since results from the fire scar analysis indicate that the average
annual forest fire committed emissions were 76% of the average deforestation emission
during the period of analysis. The extrapolation of the relationship between
fragmentation, proximity to ignition sources and forest flammability suggests that the
CO2 emissions from forest fires were about as high as the average annual deforestation
emission of 1.4 Pg of CO2 (Houghton 2005).
Finally, this research helps to elucidate the contribution of forest fires in the
Amazon where approximately 30,000 km of new forest edges are created every year
(Brian et al. 2010), and where standing forests are highly threatened by climatic and
anthropogenic changes. Additionally, it indicates what the future of the region might be if
the high level of forest fragmentation associated with the increase in extremes droughts
became a reality, increasing forest fires, forest degradation and CO2 emissions.
Conclusions
This study demonstrates that besides the difference between the biophysical and
anthropogenic variables in explaining forest fire occurrence, they also have distinct roles

109
in explaining the temporal and spatial domain of fire occurrence. While PAW, as an
indicator of forest flammability, is a good temporal predictor of forest fire, fragmentation
is an important spatial predictor. Thus, it is important that fire models incorporate both
temporal and spatial predictors to capture variations not only in the biophysical
susceptibility of the forest to fire but also in the availability of ignition sources.
Even though in the study sites the area burned in dry years was 76% higher than
in average rainfall years, the estimated area burned based on forest flammability and
fragmentation predictors suggest that forest fires can burn an area that is more than two
times higher in dry years than in average rainfall years. In addition, distinct forest types
present different outcomes of area burned even under similar PAW and fragmentation
conditions. Large areas of transitional and open forests are burned even in average
rainfall years, while dense forest is highly susceptible to fire mostly during dry years.
Fire frequency correlates positively with fragmentation and negatively with PAW in all
forest sites, except dense forest. In dense forest, fragmentation and distance from
clearings were the variables that significantly correlated with fire frequency, whereas all
the other variables correlated significantly with fire frequency in the other forest sites
including PAW.
In this context, forest fires are becoming important sources of CO2 emissions,
tending to exceed the region’s levels of deforestation-driven CO2 emissions not only in
the dry years. This scenario of low deforestation and high forest fire occurrence is
representative of the 2009/2010 period, in which despite a significant reduction in
deforestation (from 12,911 km 2 to 7,964 km2), the region suffered one of the strongest

110
droughts in recent history and the number of hot pixels was more than 200 times higher
than the same period in the previous year.
Finally, application of the models presented in this study can inform public policy
by highlighting the spatial and temporal contexts that enhance the susceptibility of
Amazonian landscapes to forest fires. This research can help to direct understory fire
prevention and control efforts to the areas under highest fire risk in the Amazon, as well
as areas that are going through major processes of forest degradation due to high fire
frequency and fragmentation.
Table 4-1. Carbon density and proportion of carbon loss compared to unburned forest by distinct burn frequencies (1 time, 2 times and ≥ 3 times) by forest type.
Forest type Frequency (# of times)
Carbon density1 (ton/ha)
Carbon loss2 (%)
Dense 0 163 1 150 8 2 116 23
≥ 3 52 55
Open 0 120 1 111 8 2 85 23
≥ 3 38 55
Transition 0 135 1 125 8 2 96 23
≥ 3 43 55 1Carbon density for the unburned forest (frequency 0) was estimated based on the average biomass value extracted from Saatchi et al. (2007). 2Proportion of carbon loss was based on the study by Cochrane and Schulze (1998) where for once burned, twice burned and multiple burns was identified the loss of trees > 10 cm dbh.
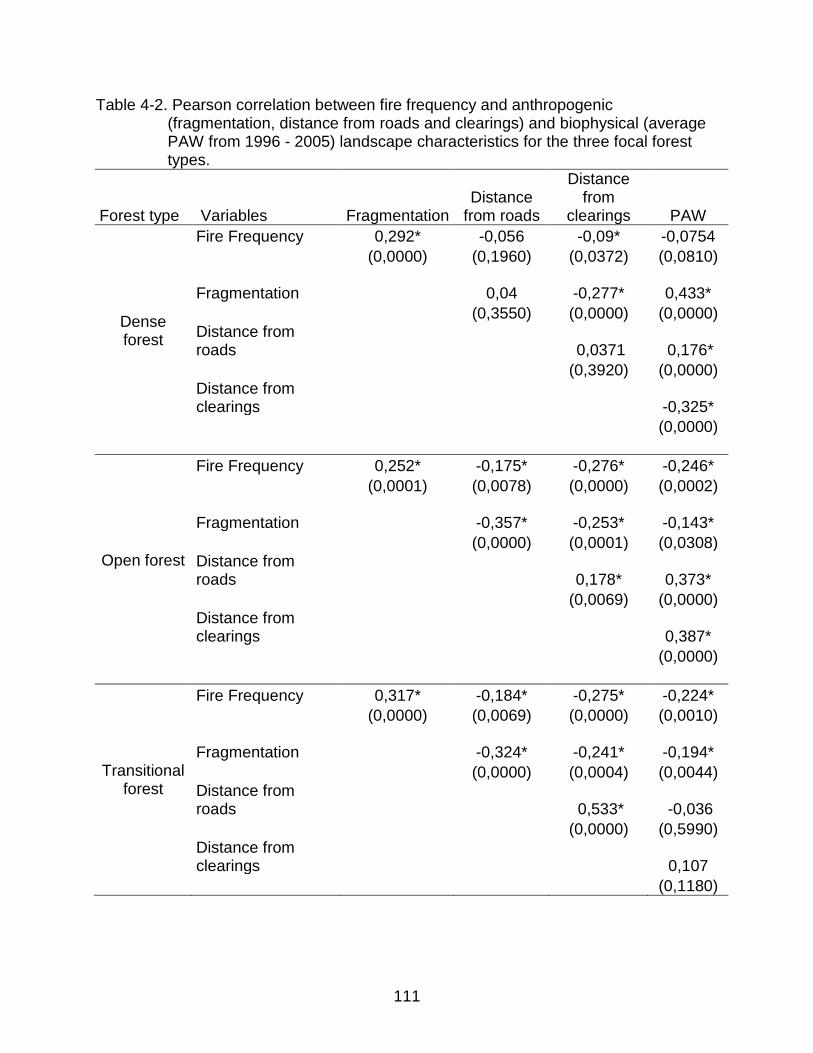
111
Table 4-2. Pearson correlation between fire frequency and anthropogenic (fragmentation, distance from roads and clearings) and biophysical (average PAW from 1996 - 2005) landscape characteristics for the three focal forest types.
Forest type Variables Fragmentation Distance
from roads
Distance from
clearings PAW
Dense forest
Fire Frequency 0,292* -0,056 -0,09* -0,0754 (0,0000) (0,1960) (0,0372) (0,0810)
Fragmentation
0,04 -0,277* 0,433* (0,3550) (0,0000) (0,0000) Distance from roads
0,0371 0,176*
(0,3920) (0,0000) Distance from clearings -0,325* (0,0000)
Open forest
Fire Frequency 0,252* -0,175* -0,276* -0,246* (0,0001) (0,0078) (0,0000) (0,0002)
Fragmentation
-0,357* -0,253* -0,143* (0,0000) (0,0001) (0,0308) Distance from roads
0,178* 0,373*
(0,0069) (0,0000) Distance from clearings 0,387* (0,0000)
Transitional forest
Fire Frequency 0,317* -0,184* -0,275* -0,224* (0,0000) (0,0069) (0,0000) (0,0010)
Fragmentation
-0,324* -0,241* -0,194* (0,0000) (0,0004) (0,0044) Distance from roads
0,533* -0,036
(0,0000) (0,5990) Distance from clearings 0,107
(0,1180)
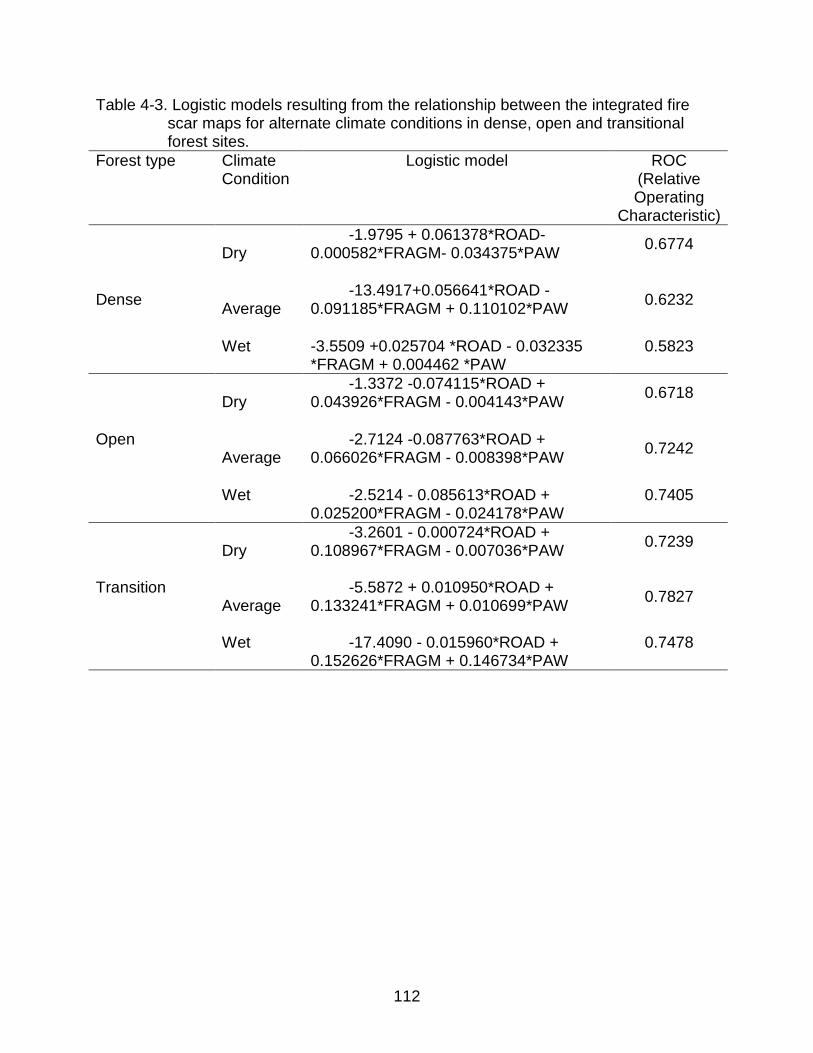
112
Table 4-3. Logistic models resulting from the relationship between the integrated fire scar maps for alternate climate conditions in dense, open and transitional forest sites.
Forest type Climate Condition
Logistic model ROC (Relative Operating
Characteristic)
Dense
Dry -1.9795 + 0.061378*ROAD-
0.000582*FRAGM- 0.034375*PAW
0.6774
Average -13.4917+0.056641*ROAD -
0.091185*FRAGM + 0.110102*PAW
0.6232
Wet -3.5509 +0.025704 *ROAD - 0.032335 *FRAGM + 0.004462 *PAW
0.5823
Open
Dry -1.3372 -0.074115*ROAD +
0.043926*FRAGM - 0.004143*PAW
0.6718
Average -2.7124 -0.087763*ROAD +
0.066026*FRAGM - 0.008398*PAW
0.7242
Wet -2.5214 - 0.085613*ROAD + 0.025200*FRAGM - 0.024178*PAW
0.7405
Transition
Dry -3.2601 - 0.000724*ROAD +
0.108967*FRAGM - 0.007036*PAW
0.7239
Average -5.5872 + 0.010950*ROAD +
0.133241*FRAGM + 0.010699*PAW
0.7827
Wet -17.4090 - 0.015960*ROAD + 0.152626*FRAGM + 0.146734*PAW
0.7478

113
Table 4-4. Estimated CO2 emissions from deforestation and forest fires for the three forest types during the last 24 years
Forest types
Deforestation-driven CO2 emissions1
(Tg yr-1)
Forest fire-driven committed CO2 emissions2 (Tg yr-1)
Average annual area
burned Wet years Average
years Dry years Dense 17.6 6.0 0.1 2.4 14.7
Open 27.6 23.0 3.7 15.7 48.8
Transition 13.8 19.9 3.6 12.2 40.9
59.0 48.8 7.4 30.2 104.3 1 The CO2 emissions for each forest type were calculated using the Saatchi et al. (2007) biomass map, in which the average biomass value for each vegetation type was converted to Carbon and multiplied by the annual area deforested, and then converted to CO2. 2 The committed CO2 emissions from forest fires was based on the average tree mortality due to forest fires reported on literature (Alencar et al 2006), not including yet the released emissions during the fire itself.
Table 4-5. Estimated area at risk of burning, area burned and CO2 emissions by forest type and climatic conditions for the Brazilian Amazon.
Forest Type
Area total by forest
type (thousand
km2)
Estimated area at risk of burning (thousand km2)
Estimated area burned
(thousand km2)
Estimated emission
(Pg CO2 yr-1)
WET AVE DRY WET AVE DRY WET AVE DRY
Dense 1,783.8 2.4 21.3 160.3 0.3 2.2 6.1 0.01 0.07 0.18
Open 884.5 4.5 35.6 121.3 1.6 10.2 22.3 0.04 0.22 0.49
Transition 504.7 3.1 13.5 81.8 1.6 5.5 23.5 0.04 0.14 0.58
Total 3,172.9 10.0 70.4 363.5 3.5 18.0 51.9 0.08 0.43 1.25

114
Figure 4-1. Study sites located along the PA-150 and BR-158 road corridor representing a gradient of forest structure (IBGE 2004) and soil plant available water- PAW (Nepstad et al. 2004). (A) dense forest study site representing low and medium PAW; (B) open forest study site representing low and medium PAW and (C) transitional forest study site representing mainly medium PAW.

115
Figure 4-2. Total annual rainfall anomaly from 1984 to 2008 for the three study sites (A) Dense forest, (B) Open forest and (C) Transitional/ Seasonal forest. Shaded areas indicate the interval of 10% positive and negative anomalies defining the average rainfall years.

116
Figure 4-3. Scheme of forest fire risk probability surface calculation for the wet, average and dry years climatic conditions, integrating 24 years of burn scar maps from (A) dense forest, (B) open forest and (C) transitional/seasonal forest as dependent variables and distance from clearings and roads, fragmentation and PAW as independent variables.
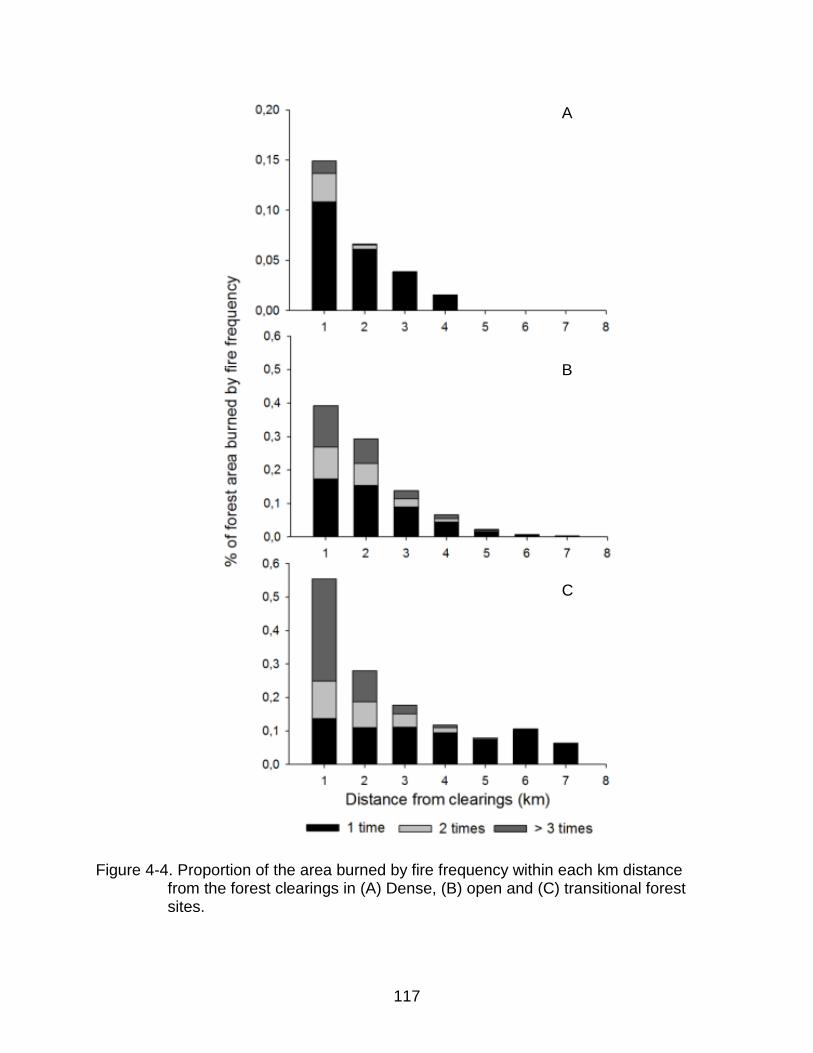
117
Figure 4-4. Proportion of the area burned by fire frequency within each km distance from the forest clearings in (A) Dense, (B) open and (C) transitional forest sites.
A B C
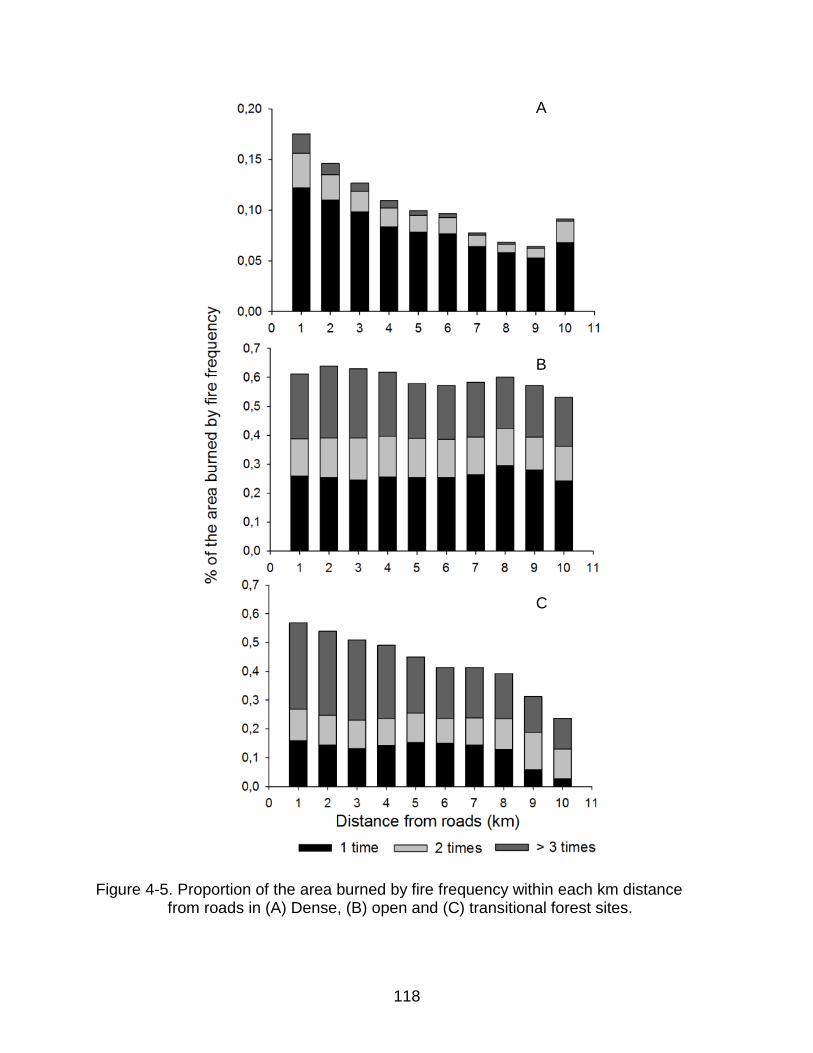
118
Figure 4-5. Proportion of the area burned by fire frequency within each km distance from roads in (A) Dense, (B) open and (C) transitional forest sites.
A B C
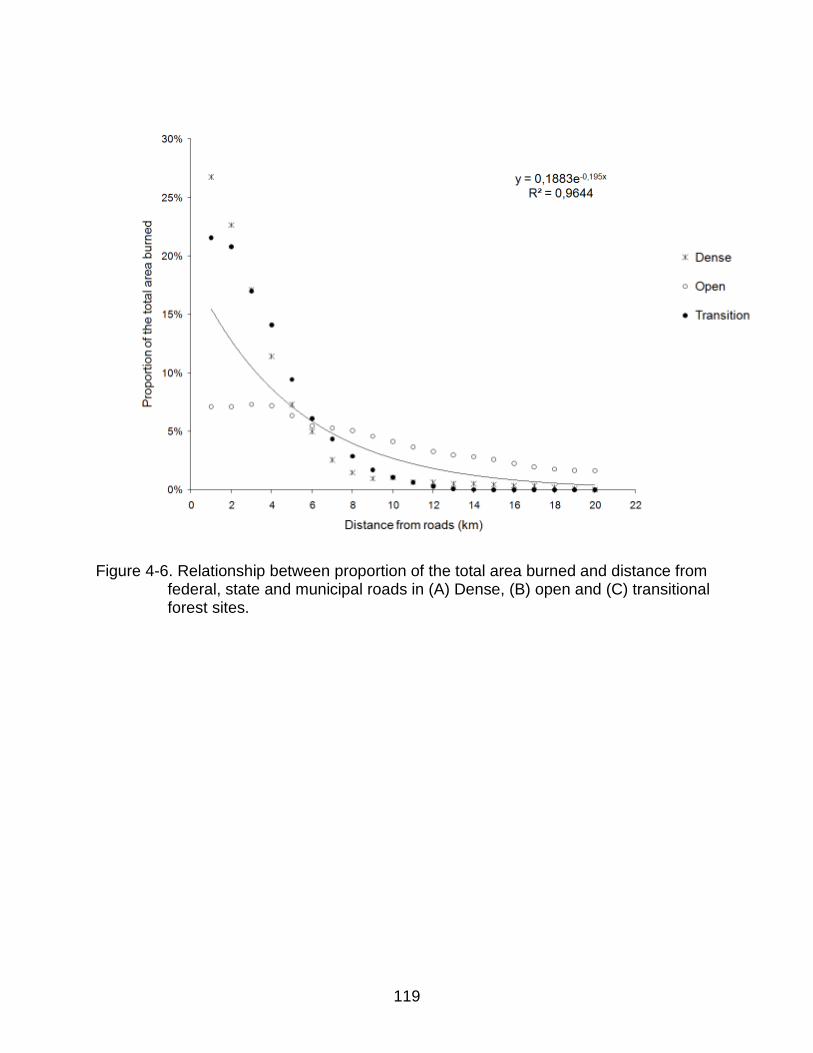
119
Figure 4-6. Relationship between proportion of the total area burned and distance from federal, state and municipal roads in (A) Dense, (B) open and (C) transitional forest sites.
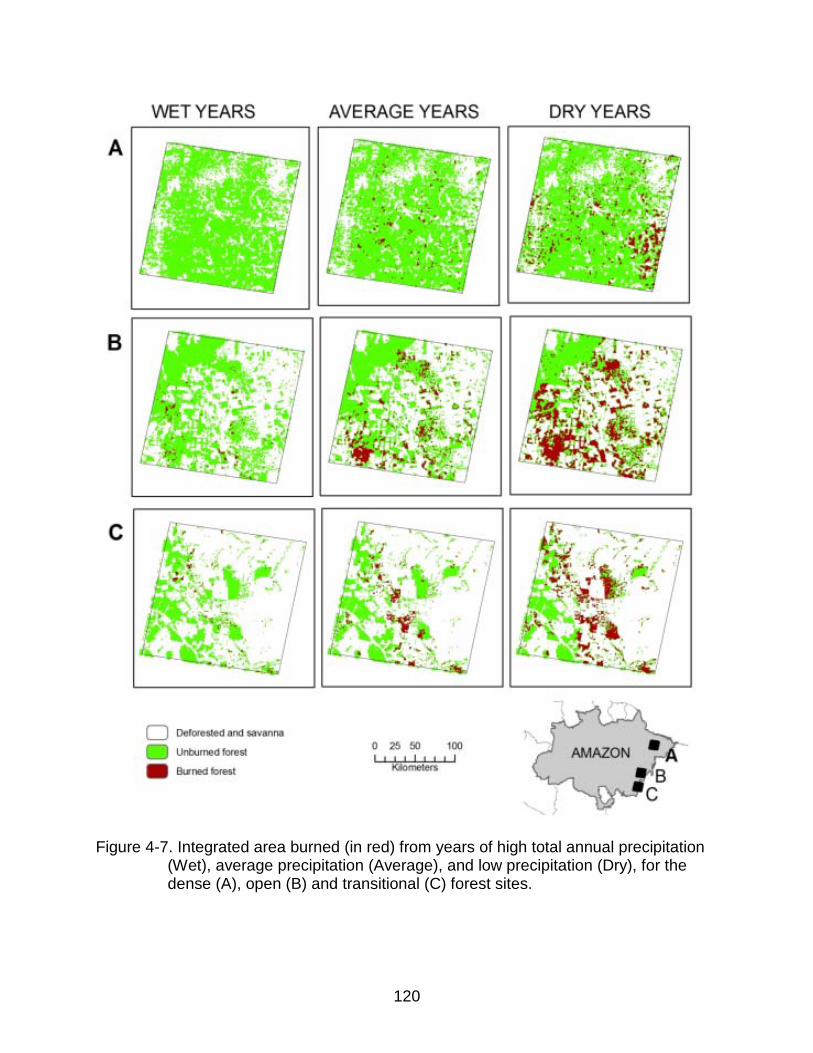
120
Figure 4-7. Integrated area burned (in red) from years of high total annual precipitation (Wet), average precipitation (Average), and low precipitation (Dry), for the dense (A), open (B) and transitional (C) forest sites.

121
Figure 4-8. Forest fire probability maps developed for (A) wet and (B) average and (C) dry years, based on forest flammability (PAW), fragmentation index and proximity to ignition sources (roads). High probabilities are observed in average and wet years, indicating that in these areas fragmentation has had a major role in increasing forest fire probability.
A B C

122
Figure 4-9. Proportion of the area burned by forest type in wet, average and dry rainfall years.

123
CHAPTER 5 CONCLUSION
Loss of tropical forest due to degradation by anthropogenic forest fire, impacts
biodiversity, global carbon cycle, and the development of economic strategies based on
fire-free land uses (Nepstad et al. 2001, Foley et al. 2007, Betts et al. 2008). Naturally,
forest fires are rare events whose occurrence is determined by severe droughts in the
Amazon humid forest (Sanford et al. 1985, Uhl and Kauffman 1990). However, with
global warming and the expansion of human activities affecting landscape configuration
and breaking the resistance of the forest to escaped anthropogenic ignited fires, the
regime of this previously infrequent natural disturbance has changed (Cochrane 2003,
Cochrane and Barber 2009). Today, the spatial characteristics of the landscape,
including the history of human induced forest disturbances and exposure to sources of
ignition, may explain the increase in frequency and extent of forest fires even in years of
low precipitation (Alencar et al. 2004b). A future of fire-dominated landscapes creates
serious implications for human health, regional economies, and ecosystem recovery,
which need to be taken into account in the development of mechanisms to reduce and
mitigate forest degradation such as REDD (Reducing Emissions from Deforestation and
Degradation) (Griscom et al. 2009a, Sasaki and Putz 2009, Putz and Redford 2010).
This study represents the first effort to quantify the spatial and temporal
relationships between historic forest fire occurrence and anthropogenic landscape
characteristics along a gradient of drought, vegetation structure, and fragmentation in
the Amazon region. It presents an analysis of forest fire behavior and degradation in the
eastern Amazon region, a region already considered to be going through considerable
decrease in precipitation and increase in temperature due to local deforestation and

124
global climate change (Malhi et al. 2008, Malhi et al. 2009).The long-term time series of
forest fire scars developed in this study were used to test the relationship between
forest fires, drought, forest structure, deforestation, and fragmentation, and indicate
areas at potential risk for forest fire under alternative sets of climate conditions.
To achieve this objective, I developed a methodology to consistently map annual
forest fire scars in dense forests from a long time-series (24 yr) based on remote
sensing satellite images, as explained in Chapter 2. Subsequently, I expanded the
forest fire scar mapping technique to other two forest types in eastern Amazon (open
and transitional forests) to investigate forest fire regime proprieties such as extent,
frequency, interval, seasonality, and effect, as described in Chapter 3. The temporal
and spatial characteristics derived from the analysis of fire regime proprieties were then
used to estimate the consequences of forest fires for CO2 emissions (Chapter 4).
The results of the studies presented in Chapter 2 and 3 indicate that the number of
individual fire scars and the extent of the area burned were positively correlated with
drought. Although dense forest had fewer and smaller forest fires than transitional and
open forests, in years of severe drought, this forest type became more susceptible to
fire compared to other forest types, independent of the quantity and quality of ignition
sources and the level of previous disturbances. In contrast, in years of average rainfall,
forest fires in humid dense forests depend on the degree of fragmentation and a high
concentration of ignition sources. In addition, strong ENSO events tend to provoke
heavier impacts on the dense forest region than on the other forest types.
Moreover, Chapter 3 also suggests that forest fires are becoming more frequent at
the fringe of the Amazon forest, occurring every 82, 15, and 11 yrs for dense open and
125
transitional forests respectively, representing intervals that are 5 an 90 times more
frequent than the natural fire returning interval between 400 and 1000 years (Thonicke
et al. 2001). In spite of the major changes in fire frequency in these highly fragmented
landscapes, the majority areas burned in all three forest types burned only once,
indicating that the likelihood of a burned area to burn again is smaller than that
suggested by Cochrane and Schulze (1999). A smaller proportion of the landscape (in
each forest type) burned more than 3 times, suggesting that the positive feedback
hypothesis applies only for relatively smaller portions of the landscape or occurs in
longer cycles than originally postulated. Thus, although the area affected by
consecutive and more frequent fires is relatively small, 70% of the area that burned
twice during the period of analysis burned again in subsequent years. This may be an
indication that there is a considerable increase in the flammability of the forest which
was suppose to burn every 400 to 1000 yrs. However, this flammability is lost after the
second year of recurrent fires, perhaps due to decrease in the quality and quantity of
the available fuel material.
Chapter 4 explains how deforestation and the degree of fragmentation
demonstrated to have strong influence on local spatial characteristics increasing the
likelihood of forest fire occurrence and spread. Deforestation-dependent land uses such
as cattle ranching, soy cultivation, and slash-and-burn agriculture create distinct
patterns of fragmentation. The size and shape of remaining forest fragments play an
important role in increasing the susceptibility of forests to fire, due to both the increase
in (1) the fragment proportion and area influenced by edge effects, and (2) the likelihood
of the presence of effective sources of ignition in close proximity. Another factor that

126
contributes to forest fire occurrence is proximity to main and secondary roads. Since
proximity to roads is positively correlated with area deforested, the forest areas closer to
main and secondary roads tend to be more affected by fires than areas further away
due to effects of fragmentation and source of ignition.
Although deforestation is positively correlated with forest fires, the fact that an area
was burned previously does not necessarily signify that it will be subsequently
deforested. Less than 50% of the area burned in various frequency classes was
subsequently deforested. This Chapter also suggests that forest fire-related emissions
represented an average of about 83% of the deforestation-induced emissions in the
three study sites. However, these emissions were much higher during dry years
increasing 76% more than the deforestation emissions. In addition, forest fire emissions
were 3.5 times higher in dry years than in years with average rainfall. When
extrapolated to other areas of the Amazon with the same forest type, fragmentation
level, and soil texture, the forest fire emissions were likely to be 3 times higher in dry
years than in average rainfall years.
In sum, these results suggest that the behavior of forest fires varies among forest
types and with space and time depending on the degree of fragmentation and intensity
of consecutive droughts. Structured investigation of the spatial and temporal
determinants of anthropogenic forest fires in the eastern Amazon imply as major
findings that: (1) severe droughts are the main temporal determinant of forest fires and
cause total carbon emissions that are 76% higher than average emissions associated
with deforestation alone; (2) since these are not wildfires but escaped fires from
anthropogenic land use sources, the spatial distribution of these fires revealed a pattern

127
where ~90% of the area burned occurs within 10 km of official roads, 1-2km of
deforested clearings, and within highly fragmented areas; (3) the spatial and temporal
characteristics of ENSO fires disproportionately impact dense forests; and finally, (4)
escaped forest fire emissions are historically large, especially in ENSO years, and
growing in importance as deforestation emissions drop and escaped fire emissions
increase, in association with the increasing importance of small slash-and-burn
clearings.
This research also enhances the knowledge of the limits and controls of forest
resistance and resilience that can be used to predict future forest fire occurrence within
major road corridors in the Amazon region under a variety of scenarios. Furthermore, it
provides information to help diminish the uncertainty of the region’s estimate net carbon
flux associated with forest degradation. Application of the models developed in this
study can inform public policy by highlighting the spatial and temporal contexts that may
enhance the susceptibility of Amazonian landscapes to forest fires and help to direct
understory fire prevention and control efforts to the areas subject to higher fire risk in
the Amazon. Finally, since most forest fires in the region currently are escaped fires,
this research highlights the increasing importance of managing fire with respect to
discussions of mechanisms, such as REDD, to provide economic incentives to reduce
the use of fire in land management.
Broader Implications of Future Amazonian Forest Fires
Climate change has raised increasing concerns about the future of tropical forests
in relation to more frequent and intense droughts and consequent widespread of forest
fires and forest die-back (Huntingford et al. 2008, Malhi et al. 2008). Amazon fires (i.e.,
deforestation fires and management fires) are estimated to contribute approximately

128
38% of total CO2 emissions originating from tropical deforestation (Van der Werf et al.
2010). Furthermore, as fire incidence increases, it maintains a positive feedback
process that generates more fire (Cochrane and Barber 2009) and more CO2 emissions
in the region. Thus, fire plays an important role in climate change (Betts et al. 2008,
Asner et al. 2010). Even if not entirely assured, the possibility of a fire-dominated future
scenario for the Amazon implies ecological, economic, and social costs that have to be
accounted for in a warmer future (IPCC 2007), with potential to intensify poverty and
economic inequality in the region.
At a regional and local scale, a landscape and climate more prone to fire can lead
to processes of further forest degradation, including losses of biodiversity, carbon and
functionality (Putz and Redford 2010), as well as promote economic losses that will
induce more fire-based land uses (Nepstad et al. 2001, Arima et al. 2007). From an
ecological point of view, recurrent fires in the non-fire-adapted forests of the Amazon
(Sanford et al. 1985, Goldammer 1990) affect carbon stocks by increasing the mortality
of large trees and promoting change in forest structure (Cochrane and Schulze 1998,
Haugaasen et al. 2003, Alencar et al. 2005, Balch et al. 2008, Barlow and Peres 2008).
These changes tend to affect harvestable timber species, as well as vines and
medicinal plants, generating economic costs to loggers and small producers that live on
these forest based resources (Nepstad et al. 2001, Peres et al. 2003, Shanley and Luz
2003), and serving to lower incentives to engage in better forest management practices
such as reduced impact logging, ultimately decreasing the value of forests for local
stakeholders (e.g. communities, loggers, ranchers).
129
Structural changes due to recurrent fires on forest substrates decrease sources of
foraging and prey for large vertebrates and some birds, affecting their abundance and
richness (Barlow et al. 2002, Peres et al. 2003). The economic effects of such impacts
on fauna are felt by local smallholder communities that rely heavily on some species as
an important part of their diet. The hydrological functionality of a forest degraded by
multiple fires may also be affected, potentially leading to reductions in
evapotranspiration, and subsequently, alterations in rainfall patterns (Nepstad et al.
2001). Changes in rainfall patterns affect local agriculture, mostly the annual crops that
depend on regular seasonal weather, such as cassava, corn, and rice, which are the
main subsistence crops of Amazon smallholders. In addition, the cost of protecting
these crops from accidental fires (for example, with fire breaks) in drier years increases.
Finally, a potential increase in frequency and intensity of fires may lead to major
changes in forest composition, transforming these forests into new fire-dominated low
biomass forests or grass-dominated vegetation (Balch et al. 2009, Malhi et al. 2009,
Veldman et al. 2009).
There are several other costs to society beyond carbon emissions and ecological
changes. Widespread anthropogenic forest fires can generate economic losses and
have major consequences for human health and implications for sustainable
economies. In 1998, an extreme dry year caused by ENSO, these costs were estimated
to reach US$102 million, with 10% of the costs related to respiratory illnesses and
morbidity, and approximately 55% related to losses of infrastructure (i.e., fences),
rentals of new pastures, and losses of livestock and cattle production (Seroa da Motta
et al. 2002, Mendonça et al. 2004). These losses represented an estimated loss of US$
130
11,000 per Amazonian farmer (Nepstad et al. 2001). Other costs include airport
closures, traffic accidents, and energy shortages due to fire in power-lines (Nepstad et
al. 1999a, Mendonça et al. 2004).
Landscapes with higher fire risk also lead to increasing fire-based land uses and
decreasing investments in land-use practices that rely on better productivity and more
capital, such as perennial crops, mechanized pastures, and crop fields (Simmons et al.
2004, Arima et al. 2007). The fire season of 2010—also an ENSO year—occurred in the
midst of what is considered to be one of the most intense and prolonged droughts in the
last 60 years, surpassing the 2005 drought. Fires during the 2010 burning season
burned down towns in Mato Grosso (e.g., Marcelandia), left many cities in the region in
a state of alert—including Brasilia, the Brazilian capital—and drove domestic prices of
meat up 60% compared to the first 4 months of 2010.
Fire risk and economic losses due to escaped fires have an important implication
for poverty and inequality in the region. The fire frontier is located in the most populated
rural portions of the Amazon (i.e., along the Arc of Deforestation). It is in these areas
that new and old government settlements have been typically been located. These
settlers and small producers currently represent the main sources of deforestation (72%
of deforestation in 2009 comes from small clearings, in contrast to 20% in 2004) (INPE
2010). These small producers are often the source of deforestation and management
fires, but also the main victims of the negative effects of their own fire-based production
system. In a scenario of more frequent and intensive drought, these producers would be
more likely to be affected by morbidity and respiratory ailments or to be subject to loss
of crops and livestock without other means to pay back bank loans than more
131
capitalized landowners in the region. Even though some individuals or groups of
smallholders are more organized and have even developed forecast mechanisms to
cope with extreme droughts (Simmons et al. 2004, Moran et al. 2006), in general this
tends to be the Amazon socio-economic group that is most likely to suffer the negative
effects of future climate change due to drought and fire spread. The probable
consequences of climate change and widespread fires affecting Amazon small
producers have important implications for increasing poverty and inequalities in the
region, raising concerns regarding the vulnerability and adaptation potential of the
poorest economic group in the region.
Economic Incentives to Reduce Forest Degradation Caused by Fires
Since most of the forest fires that lead to Amazon forest degradation are from
anthropogenic sources and climate change is an ongoing process, one option to
decrease fire and avoid or diminish the costs of escaped fires is increased investments
in more sustainable production strategies. These could be supported by economic
mechanisms to stimulate reductions in emissions from deforestation and forest
degradation (REDD). Even with the central role they currently play in regional land use-
based GHG emissions, Amazon small producers are less likely to receive economic
incentives to reduce deforestation and forest degradation (Lewis 2009), due to internal
structural obstacles (e.g., level of organization, management capacity, cohesion, lack of
access to technology) that make access to currently available REDD-based financial
resources (such as the Amazon Fund) challenging (Nepstad et al. 2009). If problems
like these are not resolved or other solutions to reduce fire-dependence developed, it
can be expected that fire frequencies near these settlements will increase, creating

132
landscapes dominated by degraded “empty” forests (Putz and Redford 2010), and
increase poverty in rural Amazonia.
In conclusion, financial incentives to reduce forest loss through deforestation and
forest degradation are needed to decrease anthropogenic forest fires in the Amazon,
particularly those caused by small producers. REDD programs designed to reduce
forest fire emissions from small producers and support non-fire-based land use
practices in the Amazon may represent one important strategy to decrease
anthropogenic forest fire risk in the region. The definition of baseline emissions will be
critical for the success of performance-based systems to reduce fire-related emissions.
In the case of forest degradation by fire, the baseline methodologies are still under
development. Although considerable effort and research have been invested in
developing approaches to establishing emissions baseline emissions for REDD they
have been almost exclusively focused on deforestation (Griscom et al. 2009b) and
emissions from degradation by logging (Griscom et al. 2009a), to the exclusion of forest
fire-related emissions.
The ability to track forest degradation and recovery of carbon in degraded forests
(including those degraded by fire) is important for the development of REDD programs.
Results of this work may have important implications for mapping of forest degradation
and improvement of land use emission estimates in a context where deforestation
emissions in the Amazon are decreasing, but emissions from forest fires may be
increasing. In addition, the ability to measure emissions from forest degradation due to
fire (and especially, repeated fires) may help to resolve issues related to the
“permanence” of forest carbon stocks that are part of REDD or similar avoided

133
deforestation mechanisms (Angelsen 2009, Stickler et al. 2009). Even in a scenario in
which countries do not intend reduce (or measure) emissions resulting from fire, they
will have to confront the risk that fires pose to the standing forest stock that represent
the primary source of carbon credits for avoided deforestation. In order to guarantee
these credits to investors and donors in the long-term, nations will have to implement
mechanisms that keep forests safe from fire-driven degradation. The development of
tools that identify fire-driven forest degradation as well as the risk of such degradation
can support the monitoring and verification of REDD programs and avoid current and
future slow forest loss by degradation due to fire.

134
LIST OF REFERENCES
Alencar, A., D. Nepstad, D. McGrath, P. Moutinho, P. Pacheco, M. D. C. Diaz, and B. Soares Filho. 2004a. Desmatamento na Amazônia: Indo Alem da Emergência Crônica. IPAM, Belém, PA. 90. http://www.ipam.org.br/.
Alencar, A., D. Nepstad, and P. Moutinho. 2005. Carbon emissions associated with
forest fires in Brazil. Pages 23-33 in P. Moutinho and S. Schwartzman, editors. Tropical deforestation and climate change. Instituto de Pesquisa ambiental da Amazônia and Environmental Defense, Belém, PA. http://www.ipam.org.br.
Alencar, A., D. Nepstad, and M. C. Vera Diaz. 2006. Forest understory fire in the
Brazilian Amazon in ENSO and non-ENSO Years: area burned and committed carbon emissions. Earth Interactions 10:1-17.
Alencar, A., L. Solorzano, and D. Nepstad. 2004b. Modeling Forest Understory Fires
in an Eastern Amazonian Landscape. Ecological Applications 14:S139-S149. ANA. 2009. HidroWeb: Sistema de Informações Hidrológicas. Agência Nacional de
Águas, Brasilia, DF. http://hidroweb.ana.gov.br/. Andreae, M. O., D. Rosenfeld, P. Artaxo, A. A. Costa, G. P. Frank, K. M. Longo, and
S.-D. M.A.F. 2004. Smoking Rain Clouds over the Amazon. Science 303:1337-1342.
Angelsen, A., editor. 2009. Realising REDD+: National Strategy and Policy Options.
CIFOR, Bogor, Indonesia. 363p. Aragão, L. E. O. C., Y. Malhi, N. Barbier, A. Lima, Y. E. Shimabukuro, L. O.
Anderson, and S. Saatchi. 2008. Interactions between rainfall, deforestation and fires during recent years in the Brazilian Amazonia. Phil. Trans. R. Soc. 363:1779-1785.
Aragão, L. E. O. C., and Y. E. Shimabukuro. 2010. The incidence of fire in
Amazonian Forests with implications for REDD. Science 328:1275-1278. Aragão, L. E. O. C., Y. E. Shimabukuro, A. Lima, Y. Malhi, and L. O. Anderson.
2007. Burn scars in Amazonian forests under extreme drought conditions. Pages 6605-6608 in Anais do XIII Simposio Brasileiro de Sensoriamento Remoto. INPE, Florianópolis, Brazil.
Arima, E., C. S. Simmons, R. Walker, and M. A. Cochrane. 2007. Fire in the
Brazilian Amazon: a spatially explicit model for policy impact analysis. Journal of Regional Science 47:541–567.
Artaxo, P., L. V. Gatti, A. M. C. Leal, K. M. Longo, S. R. Freitas, L. L. Lara, T. M.
Pauliquevis, A. S. Procopio, and L. V. Rizzo. 2005. Atmospheric Chemistry in
135
Amazonia: The forest and the biomass burning emissions controlling the composition of the Amazonian atmosphere. Acta Amazonica 35:185-196.
Asner, G. P. 2001. Cloud cover in Landsat observations of the Brazilian Amazon.
International Journal of Remote Sensing 22:3855-3862. Asner, G. P., and A. Alencar. 2010. Drought impacts on the Amazon forest: the
remote sensing perspective. New Phytologist 187:569–578. Asner, G. P., M. Keller, R. Pereira, J. C. Zweede, and J. N. M. Silva. 2004. Canopy
damage and recovery following selective logging in an Amazon forest: Integrating field and satellite studies. Ecological Applications 14:280-298.
Asner, G. P., D. E. Knapp, E. N. Broadbent, P. J. C. Oliveira, M. Keller, and J. N.
Silva. 2005a. Selective Logging in the Brazilian Amazon. Science 310:480 - 482. Asner, G. P., D. E. Knapp, A. N. Cooper, M. C. C. Bustamante, and L. O. Olander.
2005b. Ecosystem structure throughout the Brazilian Amazon from Landsat data and spectral unmixing. Earth Interactions 9:1-31.
Asner, G. P., S. R. Loarie, and U. Heyder. 2010. Combined effects of climate and
land-use change on the future of humid tropical forests. Conservation Letters 00:1-9.
Baker, W. L. 1995. Longterm response of disturbance landscapes to human
intervention and global change. Landscape Ecology 10:143-159. Balch, J. K., D. C. Nepstad, P. M. Brando, L. M. Curran, O. Portela, O. Carvalho Jr.,
and P. Lefebvre. 2008. Negative fire feedback in a transitional forest of southeastern Amazonia. Global Change Biology 14:1-12.
Balch, J. K., D. C. Nepstad, and L. M. Curran. 2009. Pattern and Process: Fire-
initiated grass invasion at Amazon transitional forest edges. Pages 481-497 in M. A. Cochrane, editor. Tropical Fire Ecology: Climate Change Land Use and Ecosystem Dynamics. Springer, New York.
Barbosa, R. I., and P. M. Fearnside. 1999. Incêndios na Amazônia Brasileira:
Estimativa da emissão de gases do efeito estufa pela queima de diferentes ecossistemas de Roraima na passagem do evento "El Niño" (1997/1998). Acta Amazonica 29:513-534.
Barbosa, R. I., and P. M. Fearnside. 2000. As Lições do Fogo. Ciência Hoje 27:35-
39. Barlow, J., T. Haugaasen, and P. C.A. 2002. Effects of ground fires on understory
bird assemblages in Amazonian forests. Biological Conservation 105:157-169.

136
Barlow, J., and C. A. Peres. 2008. Fire-mediated dieback and compositional cascade
in an Amazonian forest. Phil. Trans. R. Soc. 363:1787-1794. Barlow, J., C. A. Peres, B. O. Lagan, and T. Haugaasen. 2003. Large tree mortality
and the decline of forest biomass following Amazonian wildfires. Ecology Letters 6:6-8.
Betts, R., M. Sanderson, and S. Woodward. 2008. Effects of large-scale Amazon
forest degradation on climate and air quality through fluxes of carbon dioxide, water, energy, mineral dust and isoprene. Phil. Trans. R. Soc. 363:1873-1880.
Blate, G. M. 2005. Modest trade-offs between timber management and fire
susceptibility of a bolivian semi-deciduos forest. Ecological Applications 15:1649-1663.
Bond, W. J., and J. E. Keeley. 2005. Fire as a global 'herbivore': the ecology and
evolution of flammable ecosystems. TRENDS in Ecology and Evolution 20:387-394.
Bond, W. J., F. I. Woodward, and G. F. Midgley. 2005. The global distribution of
ecosystems in a world without fire. New Phytologist 165:525-538. Bowman, D. M. J. S., J. K. Balch, P. Artaxo, W. J. Bond, J. M. Carlson, M. Cochrane,
C. M. D'Antonio, R. S. DeFries, J. C. Doyle, S. P. Harrison, F. H. Johnston, J. E. Keeley, M. A. Krawchuk, C. A. Kull, J. B. Marston, M. A. Moritz, I. C. Prentice, C. I. Roos, A. C. Scott, T. W. Swetnam, G. R. Van der Werf, and S. J. Pyne. 2009. Fire in the earth system. Science 324:481-484.
Brandão Jr., A., and C. Souza Jr. 2006. Mapping Unofficial Roads with Landsat
Images: A New Tool to Improve the Monitoring of the Brazilian Amazon Rainforest. International Journal of Remote Sensing 27:177-189.
Brando, P. M., D. C. Nepstad, E. A. Davidson, S. E. Trumbore, D. Ray, and P.
Camargo. 2008. Drought effects on litterfall, wood production and belowground carbon cycling in an Amazon forest: results of a throughfall reduction experiment. Phil. Trans. R. Soc. 363:1839-1848.
Briant, G., V. Gond, and S. G. W. Laurance. 2010. Habitat fragmentation and the
desiccation of forest canopies: a case study from eastern Amazonia. Biological Conservation 143:2763-2769.
Broadbent, E. N., G. P. Asner, M. Keller, D. E. Knapp, P. J. C. Oliveira, and J. N.
Silva. 2008. Forest fragmentation and edge effects from deforestation and selective logging in the Brazilian Amazon. Biological Conservation 141:1745-1757.

137
Brown, P. M., M. R. Kauffman, and W. D. Shepperd. 1999. Long-term, landscape
patterns of past fire events in a montane ponderosa pine forest of central Colorado. Landscape Ecology 14:513-532.
Bush, M. B., M. R. Silman, C. McMichael, and S. Saatchi. 2008. Fire, climate change
and biodiversity in Amazonia: a late-Holocene perspective. Phil. Trans. R. Soc. 363:1795-1802.
Carvalho, G., A. C. Barros, P. Moutinho, and D. Nepstad. 2001. Sensitive
development could protect Amazonia instead of destroying it. Nature 409:131. Chazdon, R. L. 2003. Tropical forest recovery: legacies of human impact and natural
disturbances. Perspectives in Plant Ecology, Evolution and Systematics 6 51-71. Chomitz, K. M., and T. S. Thomas. 2001. Geographic patterns of land use and land
intensity in the Brazilian Amazon. World Bank Washington, D.C. 41p. Chuvieco, E., M. P. Martin, and A. Palacios. 2002. Assessment of different spectral
indices in the red-near-infrared spectral domain for burned land discrimination. Int. J. Remote Sensing 23:5103-5110.
Cobb, K. M., C. D. Charles, H. Cheng, and R. L. Edwards. 2003. El Niño/Southern
Oscillation and tropical Pacific climate during the last millennium. Nature 424:271-276.
Cochrane, M. 2009. Tropical fire ecology: climate change, land use and ecosystem
dynamics. Springer, New York, NY. 645p. Cochrane, M., A. Alencar, M. Schulze, C. Souza Jr, D. C. Nepstad, P. Lefebvre, and
E. Davidson. 1999. Positive Feedbacks in the Fire Dynamic of Closed Canopy Tropical Forest. Science 284:1837-1841.
Cochrane, M., and W. F. Laurance. 2002. Fire as a large-scale edge effect in
Amazonia forests. Journal of Tropical Ecology 18:311-325. Cochrane, M. A. 2001. Synergistic interactions between habitat fragmentation and
fire in evergreen tropical forests. Conservation Biology 15:1515-1521. Cochrane, M. A. 2003. Fire science for rainforests. Nature 421:913-919. Cochrane, M. A., and C. P. Barber. 2009. Climate change, human land use and
future fires in the Amazon. Global Change Biology 15:601-612. Cochrane, M. A., and M. D. Schulze. 1998. Forest fires in the Brazilian Amazon.
Conservation Biology 12:948-950.

138
Cochrane, M. A., and M. D. Schulze. 1999. Fire as a recurrent event in tropical
forests of the eastern Amazon: effects on forest structure, biomass, and species composition. Biotropica 31:2-16.
Cochrane, M. A., and C. M. Souza Jr. 1998. Linear mixture model classification of
burned forests in the eastern Amazon. International Journal of Remote Sensing 19:3433-3440.
Costa, M. H., and J. A. Foley. 2000. Combined Effects of Deforestation and Doubled
Atmospheric CO2 Concentrations on the Climate of Amazonia. Journal of Climate 13:18-34.
Costa, M. H., and S. N. M. Yanagi. 2006. Effects of Amazon deforestation on the
regional climate – Historical perspective, current and future research. Revista Brasileira de Meteorologia 21:1-12.
Cox, P. M., R. A. Betts, M. Collins, P. P. Harris, C. Huntingford, and C. D. Jones.
2004. Amazonian forest dieback under climate-carbon cycle projections for the 21st century. Theor. Appl. Climatol. 78:137-156
Cox, P. M., R. A. Betts, C. D. Jones, S. A. Spall, and I. J. Totterdell. 2000.
Acceleration of global warming due to carbon-cycle feedbacks in a coupled climate model. Nature 408:184-187.
Cox, P. M., P. P. Harris, C. Huntingford, R. A. Betts, M. Collins, C. D. Jones, T. E.
Jupp, J. A. Marengo, and C. A. Nobre. 2008. Increasing risk of Amazonian drought due to decreasing aerosol pollution. Nature 453:212-216.
Da Silva, R. R., D. Werth, and R. Avissar. 2008. Regional impacts of future land-
cover changes on the Amazon basin wet-season climate. Journal of Climate 21:1153-1170.
De Santis, A., and E. Chuvieco. 2007. Burn severity estimation from remotely
sensed data: Performance of simulation versus empirical models. Remote Sensing of Environment 108:422–435.
Diaz-Delgado, R., F. Lloret, and X. Pons. 2003. Influence of fire severity on plant
regeneration by means of remote sensing imagery. Int. J. Remote Sensing 24:1751-1763.
Dwyer, E., S. Pinnock, J. M. Grégoire, and J. M. C. Pereira. 2000. Global spatial and
temporal distribution of vegetation fire as determined from satellite observations. Int. J. Remote Sensing 21:1289–1302.

139
Eidenshink, J., B. Schwind, K. Brewer, Z. L. Zhu, B. Quayle, and S. Howard. 2007. A project for monitoring trends in burn severity. Journal of Fire Ecology 3:3-21.
Eva, H., and E. F. Lambin. 1998. Remote Sensing of Biomass Burning in Tropical
Regions: Sampling Issues and Multisensor Approach. Remote Sensing of Environment 64:292-315.
Eva, H. D., and E. F. Lambin. 2000. Fires and land-cover change in the tropics: a
remote sensing analysis at the landscape scale. Journal of Biogeography 27:765-776.
Falk, D. A., C. Miller, D. McKenzie, and A. E. Black. 2007. Cross-Scale Analysis of
Fire Regimes. Ecosystems 10:809-823. Faminow, M. D., editor. 1998. Cattle, Deforestation, and Development in the
Amazon: An Economic, Agronomic, and Environmental Perspective. CAB International, New York, NY. 272p.
FAO. 2001. Global forest resource assessment 2000. FAO, Rome, Italy. 140p.
http://www.fao.org/docrep/004/y1997e/y1997e00.HTM. Fearnside, P. M. 1997. Greenhouse Gases Emissions from Deforestation in
Amazonia: Net Committed Emissions. Climatic Change 35:321-360. Fearnside, P. M. 2005. Deforestation in Brazilian Amazonia: History, Rates, and
Consequences. Conservation Biology 19:680-688. Ferreira, L. V., and W. F. Laurance. 1997. Effects of forest fragmentation on mortality
and damage of selected trees in central Amazonia. Conservation Biology 11:797-801.
Foley, J., G. P. Asner, M. H. Costa, M. T. Coe, R. DeFries, H. K. Gibbs, E. A.
Howard, S. Olson, J. Patz, N. Ramankutty, and P. Snyder. 2007. Amazonia revealed: forest degradation and loss of ecosystem goods and services in the Amazon Basin. Frontiers in Ecology and the Environment 5:25-32.
Fraser, R. H., Z. Li, and R. Landry. 2000. Spot vegetation for characterizing boreal
forest fires. Int. J. Remote Sensing 21:3525–3532. French, N. H. F., E. S. Kasischke, R. J. Hall, K. A. Murphy, D. L. Verbyla, E. E. Hoy,
and J. L. Allen. 2008. Using Landsat data to assess fire and burn severity in the North American boreal forest region: an overview and summary of results. International Journal of Wildland Fire 17:443-462.
140
Gedney, N., and P. J. Valdes. 2000. The effect of Amazonian deforestation on the Northern Hemisphere circulation and climate. Geophys. Res. Lett. 27:3053–3056.
Gerwing, J. J. 2002. Degradation of forests through logging and fire in the eastern
Brazilian Amazon. Forest Ecology and Management 157:131-141. Giglio, L., I. Csiszar, and C. O. Justice. 2006. Global distribution and seasonality of
active fires as observed with the Terra and Aqua Moderate Resolution Imaging Spectroradiometer (MODIS) sensors. Journal of Geophysical Research 111:1-12.
Giglio, L., T. Loboda, D. P. Roy, B. Quayle, and C. O. Justice. 2009. An active-fire
based burned area mapping algorithm for the MODIS sensor. Remote Sensing of Environment 113 408-420.
Goetz, S. J., G. J. Fiske, and A. G. Bunn. 2006. Using satellite time-series data sets
to analyze fire disturbance and forest recovery across Canada. Remote Sensing of Environment 101:352–365.
Goldammer, J. G. 1990. Fire in Tropical Biota: Ecosystem Processes and Global
Challenges. Springer-Verlag, New York, NY. 497p. Goldammer, J. G., and C. Price. 1998. Potential impacts of climate change on fire
regimes in the tropics based on MAGICC and a GISS GCM-derived lightning model. Climatic Change 39:273-296.
Griscom, B., D. Ganz, N. Virgilio, F. Price, J. Hayward, R. Cortez, G. Dodge, J. Jack
Hurd, L. L. Frank, and B. Stanley. 2009a. The Hidden Frontier of Forest Degradatio: A Review of the Science, Policy and Practice of Reducing Degradation Emissions. The Nature Conservancy, Arlington, VA. 76p.
Griscom, B., D. Schoch, B. Stanley, R. Costez, and N. Virgilio. 2009b. Sensitivity of
amounts and distribution of tropical forest carbon credits depending on baseline rules. Environmental Science & Policy 12:897-911.
Gullison, R. E., P. C. Frumhoff, J. G. Canadell, C. B. Field, D. C. Nepstad, K.
Hayhoe, R. Avissar, L. M. Curran, P. Friedlingstein, C. D. Jones, and C. Nobre. 2007. Tropical Forests and Climate Policy. Science 316:985-986.
Halpert, M. S., and C. F. Ropelewski. 1992. Surface Temperature Patterns
Associated with the Southern Oscillation. Journal of Climate 5:577-593. Harper, K. A., E. Macdonald, P. J. Burton, J. Chen, K. D. Brosofske, S. C. Saunders,
E. S. Euskirchen, D. Roberts, M. S. Jaiteh, and P. Esseen. 2005. Edge influence

141
on forest structure and composition in fragmented landscapes. Conservation Biology 19:768-782.
Haugaasen, T., J. Barlow, and C. A. Peres. 2003. Surface wildfires in central
Amazonia: short-term impact on forest structure and carbon loss. Forest Ecology and Management 179:321-331.
Heimann, M., and M. Reichstein. 2008. Terrestrial ecosystem carbon dynamics and
climate feedbacks. Nature 451:289-292. Hoffmann, W. A., B. Orthen, P. P. Kielse, and V. Do Nascimento. 2003. Comparative
fire ecology of tropical savanna and forest trees. Functional Ecology 17:720-726. Holdsworth, A. R., and C. Uhl. 1997. Fire in Amazonian Selectively Logged Rain
Forest and the Potential for Fire Reduction. Ecological Applications 7:713-725. Houghton, R. A. 2005. Tropical deforestation as a source of greenhouse gas
emissions. Pages 13-21 in P. Moutinho and S. Schwartzman, editors. Tropical deforestation and climate change. Instituto de Pesquisa ambiental da Amazônia and Environmental Defense, Belém, PA.
Hudak, A. T., P. Morgan, M. J. Bobbitt, A. M. S. Smith, S. A. Lewis, L. B. Lentile, P.
R. Robichaud, J. T. Clark, and R. A. McKinley. 2007. The relationship of multispectral satellite imagery to immediate fire effects. Journal of Fire Ecology 3:64-90.
Huntingford, C., R. A. Fisher, L. Mercado, B. B. B. Booth, S. Sitch, P. P. Harris, P. M.
Cox, C. D. Jones, R. A. Betts, Y. Malhi, G. R. Harris, M. Collins, and P. Moorcroft. 2008. Towards quantifying uncertainty in predictions of Amazon ‘dieback’. Phil. Trans. R. Soc. 363:1857–1864.
IBGE. 2004. Mapa de Vegetação do Brasil. ftp://ftp.ibge.gov.br/. INPE. 2010. Monitoramento da Floresta Amazônica Brasileira por Satélite. Instituto
Nacional de Pesquisas Espaciais, São José dos Campos, SP. http://www.obt.inpe.br/.
IPCC. 2007. Climate change 2007: the physical science basis. IPCC, Cambridge,
UK and New York, USA. 996p. Jipp, P., D. C. Nepstad, D. K. Cassel, and C. Reis de Carvalho. 1998. Deep soil
moisture storage and transpiration in forests and pastures of seasonally-dry Amazonia. Climatic Change 39:395-412.
142
Johns, J. S., P. Barreto, and C. Uhl. 1996. Logging damage during planned and unplanned logging operations in the eastern Amazon. Forest Ecology and Management 89:59-77.
Johnson, E. A., and S. L. Gutsell. 1994. Fire frequency models, methods and
interpretations. Adv. Ecol. Res. 25:239–287. Justice, C. O., L. Giglio, S. Korontzi, J. Owens, J. T. Morisette, D. Roy, J.
Descloitres, S. Alleaume, F. Petitcolin, and Y. Kaufman. 2002. The MODIS Fire Products. Remote Sensing of Environment 83:244-262.
Kaimowitz, D., and A. Angelsen. 1998. Economic Models of Tropical Deforestation:
A Review. Centre for International Forestry Research, Jakarta, Indonesia. 139p. Kaimowitz, D., B. Mertens, S. Wunder, and P. Pacheco. 2004. Hamburger
Connection Fuels Amazon Destruction: Cattle ranching and deforestation in Brazil's Amazon. CIFOR, Bogor, Indonesia. 10p. http://www.cifor.cgiar.org/publications/pdf_files/media/Amazon.pdf.
Kennedy, R. E., W. B. Cohen, and T. A. Schroeder. 2007. Trajectory-based change
detection for automated characterization of forest disturbance dynamics. Remote Sensing of Environment 110:370-386.
Koren, I., Y. J. Kaufman, L. A. Remer, and J. V. Martins. 2004. Measurement of the
Effect of Amazon Smoke on Inhibition of Cloud Formation. Science 303:1342-1345.
Laurance, W. F., T. E. Lovejoy, H. L. Vasconcelos, E. M. Bruna, R. K. Didham, P. C.
Stouffer, C. Gascon, R. O. Bierregaard, S. G. Laurance, and E. Sampaio. 2002. Ecossystem Decay of Amazonian Forest Fragments: a 22- year investigation. Conservation Biology 16:605-618.
Laurance, W. L., M. A. Cochrane, S. Bergen, P. M. Fearnside, P. Delamônica, C.
Barber, S. D'Angelo, and T. Fernandes. 2001. The Future of the Brazilian Amazon. Science 291:438 - 439.
Lavorel, S., M. D. Flannigan, E. F. Lambin, and M. C. Scholes. 2007. Vulnerability of
land systems to fire: Interactions among humans, climate, the atmosphere, and ecosystems. Mitig Adapt Strat Glob Change 12:33-35.
Lentini, M., D. Pereira, D. Celentano, and R. Pereira. 2005. Fatos Florestais da
Amazonia 2005. IMAZON, Belém. 138p. http://www.imazon.org.br. Lewis, S. L. 2009. Carbon emissions: the poorest forest dwellers could suffer. Nature
462:567.

143
Loarie, S. R., G. P. Asner, and C. B. Field. 2009. Boosted carbon emissions from Amazon deforestation. Geophys. Res. Lett. 36:1-5.
Loboda, T., K. J. O'Neal, and I. Csiszar. 2007. Regionally adaptable dNBR-based
algorithm for burned area mapping from MODIS data. Remote Sensing of Environment 109:429–442.
Lozano, F. J., S. Suárez-Seoane, and E. de Luis. 2007. Assessment of several
spectral indices derived from multi-temporal Landsat data for fire occurrence probability modelling. Remote Sensing of Environment 107:533-544.
Mahar, D. J. 1989. Government Policies and Deforestation in Brazil's Amazon
Region. World Bank, Washington, D.C. 56p. Malhi, Y., L. E. O. C. Aragão, D. Galbraith, C. Huntingford, R. Fisher, P.
Zelazowskia, S. Sitche, C. McSweeneya, and P. Meir. 2009. Exploring the likelihood and mechanism of a climate-change-induced dieback of the Amazon rainforest. PNAS 106:20610–20615.
Malhi, Y., T. Roberts, R. A. Betts, T. J. Killeen, W. Li, and C. A. Nobre. 2008. Climate
Change, Deforestation, and the Fate of the Amazon. Science 319:169-172. Malhi, Y., and J. Wright. 2004. Spatial patterns and recent trends in the climate of
tropical rainforest regions. Phil. Trans. R. Soc. Lond. :311-329. Marengo, J. A., C. A. Nobre, J. Tomasella, M. D. Oyama, G. S. Oliveira, R. Oliveira,
H. Camargo, L. M. Alves, and I. F. Brown. 2008. The Drought of Amazonia in 2005. Journal of Climate 21.
Margulis, S. 2003. Causes of Deforestation in the Brazilian Amazon. World Bank,
Washington, DC. 77p. Marlon, J. R., P. J. Bartlein, C. Carcaillet, D. G. Gavin, S. P. Harrison, P. E. Higuera,
F. Joos, M. J. Power, and I. C. Prentice. 2008. Climate and human influences on global biomass burning over the past two millennia. Nature Geoscience 1:697-702.
Mason, S. J., and N. E. Graham. 1999. Conditional probabilities, relative operating
characteristics, and relative operating levels. Weather Forecasting 14:713-725. Meggers, B. J. 1994. Archeological evidence for the impact of Mega-Niño events of
Amazonia during the past two millennia. Climatic Change 28:321-338. Mendonça, M. J. C., M. C. Vera-Diaz, D. Nepstad, R. Seroa da Motta, A. Alencar, J.
C. Gomes, and R. A. Ortiz. 2004. The economic cost of the use of fire in the Amazon. Ecological Economics 49:89-105.
144
Moran, E., R. Adams, B. Bakoyéma, S. Fiorini, and B. Boucek. 2006. Human
Strategies for Coping with El Niño Related Drought in Amazônia. Climatic Change 77:343-361.
Morton, D., R. S. DeFries, Y. E. Shimabukuro, L. O. Anderson, E. Arai, F. d. B.
Espirito Santo, R. Freitas, and J. Morisette. 2006. Cropland expansion changes deforestation dynamics in the southern Brazilian Amazon. PNAS 103:14637–14641.
Mouillot, F., and C. B. Field. 2005. Fire history and the global carbon budget: a 1o x
1o firehistory reconstruction for the 20th century. Global Change Biology 11:398-420.
Nearya, D. G., C. C. Klopatekb, L. F. DeBanoc, and P. F. Ffolliottc. 1999. Fire effects
on belowground sustainability: a review and synthesis. Forest Ecology and Management 122:51-71.
Nelson, B. W., and M. N. Irmão. 1998. Fire penetration in standing Amazon forests.
Pages 1471-1482 Anais IX Simpósio Brasileiro de Sensoriamento Remoto. INPE, Santos, Brasil.
Nemani, R. R., C. D. Keeling, H. Hashimoto, W. M. Jolly, C. J. Tucker, R. B. Myneni,
and S. W. Running. 2003. Climate driven increases in global terrestrial net primary production from 1982 to 1999. . Science 300:1560-1563.
Nepstad, D., G. Carvalho, A. C. Barros, A. Alencar, J. P. Capobianco, J. Bishop, P.
Moutinho, P. Lefebvre, U. L. Silva Jr, and E. Prins. 2001. Road paving, fire regime feedbacks, and the future of Amazon forests. Forest Ecology and Management 154:395-407.
Nepstad, D., P. Lefebvre, U. Lopes da Silva, J. Tomasella, P. Schlesinger, L.
Solórzano, P. Moutinho, D. Ray, and J. Guerreira Benito. 2004. Amazon drought and its implications for forest flammability and tree growth: a basin-wide analysis. Global Change Biology 10:704-717.
Nepstad, D., S. Schwartzman, B. Bamberger, M. Santilli, D. Ray, P. Schlesinger, P.
Lefebvre, A. Alencar, E. Prinz, G. Fiske, and A. Rolla. 2006a. Inhibition of Amazon deforestation and fire by parks and indigenous lands. Conservation Biology 20:65-73.
Nepstad, D., B. Soares Filho, F. Merry, A. Lima, P. Moutinho, J. Carter, M. Bowman,
A. Cattaneo, H. Rodrigues, S. Schwartzman, D. McGrath, C. M. Stickler, R. Lubowski, P. Piris-Cabezas, S. Rivero, A. Alencar, O. Almeida, and O. Stella. 2009. The end of deforestation in the Brazilian Amazon. Science 326:1350-1351.

145
Nepstad, D. C., C. R. Carvalho, E. A. Davidson, P. Jipp, P. Lefebvre, G. H. Negreiros, E. D. d. Silva, T. Stone, S. Trumbore, and S. Vieira. 1994. The role of deep roots in the hydrological and carbon cycles of Amazonian forests and pastures. Nature 372:666-669.
Nepstad, D. C., P. Jipp, P. R. d. S. Moutinho, G. H. d. Negreiros, and S. Vieira.
1995. Forest recovery following pasture abandonment in Amazonia: canopy seasonality, fire resistance and ants. Pages 333-349 in D. Rapport, editor. Evaluating and monitoring the health of large-scale ecosystems. Springer-Verlag, New York, New York, USA.
Nepstad, D. C., A. G. Moreira, and A. Alencar. 1999a. Flames in the Rainforest:
Origins, Impacts and Alternatives to Amazonian Fires. The Pilot Program to Conserve of the Brazilian Rainforest, World Bank, Brasilia, Brazil.
Nepstad, D. C., C. M. Stickler, and O. T. Almeida. 2006b. Globalization of the
Amazon Soy and Beef Industries: Opportunities for Conservation. Conservation Biology 20:1595-1603.
Nepstad, D. C., I. M. Tohver, D. Ray, P. Moutinho, and G. Cardinot. 2007. Mortality
of large trees and lianas following experimental drought in an Amazon forest. Ecology 88:2259-2269.
Nepstad, D. C., A. Veríssimo, A. Alencar, C. Nobre, E. Lima, P. Lefebvre, P.
Schlesinger, C. Potter, P. Moutinho, E. Mendonza, M. Cochrane, and V. Brooks. 1999b. Large Scale impoverishment of Amazonian Forests by Logging and Fire. Nature 398:505-508.
Pacheco, P. 2009. Agrarian Reform in the Brazilian Amazon: Its Implications for
Land Distribution and Deforestation. World Development 37:1337-1347. Page, S. E., F. Siegert, J. O. Rieley, H. D. V. Boehm, A. Jaya, and S. Limin. 2002.
The amount of carbon released from peat and forest fires in Indonesia during 1997. Nature 420:61-65.
Pereira, R., Jr., J. C. Zweede, G. P. Asner, and M. M. Keller. 2002. Forest canopy
damage and recovery in reduced impact and conventional selective logging Eastern Pará, Brazil. Forest Ecology and Management 168:77-89.
Peres, C. A., J. Barlow, and T. Haugaasen. 2003. Vertebrate responses to surface
fires in a central Amazonian forest. Oryx 37:97-109. Pinard, M. A., F. E. Putz, and J. C. Licona. 1999. Tree mortality and vine proliferation
following a wildfire in a subhumid tropical forest in eastern Bolivia. Forest Ecology and Management 113:201-213.
146
Poulter, B., U. Heyder, and W. Cramer. 2009. Modeling the Sensitivity of the Seasonal Cycle of GPP to Dynamic LAI and Soil Depths in Tropical Rainforests. Ecosystems 12:517-533.
Power, M. J., J. Marlon, N. Ortiz, P. J. Bartlein, S. P. Harrison, F. E. Mayle, A.
Ballouche, R. H. W. Bradshaw, C. Carcaillet, C. Cordova, and S. Mooney. 2008. Changes in fire regimes since the Last Glacial Maximum: an assessment based on a global synthesis and analysis of charcoal data. Clim Dyn 30:887-907.
Prins, E. M., J. M. Feltz, W. P. Menzel, and D. E. Ward. 1998. An overview of
GOES-8 diurnal fire and smoke results for SCAR-B and 1995 fire season in South America. J. Geophys. Res. 103:31821–31835.
Putz, F. E., and K. H. Redford. 2010. The Importance of Defining ‘Forest’: Tropical
Forest Degradation, Deforestation, Long-term Phase Shifts, and Further Transitions. Biotropica 42:10-20.
RADAMBRASIL. 1981. Levantamento de Recursos Naturais 1973-1984.in D. N. d.
P. Mineral, editor. IBGE, Rio de Janeiro. Ray, D., D. Nepstad, and P. Moutinho. 2005. Micrometeorological and canopy
controls of fire susceptibility in forested Amazon landscape. Ecological Applications 15:1664-1678.
Riaño, D., J. A. Moreno Ruiz, D. Isidoro, and S. L. Ustin. 2007. Global spatial
patterns and temporal trends of burned area between 1981 and 2000 using NOAA-NASA Pathfinder. Global Change Biology 13:40-50.
Röder, A., J. Hill, B. Duguy, J. A. Alloza, and R. Vallejo. 2008. Using long time series
of Landsat data to monitor fire events and post-fire dynamics and identify driving factors. A case study in the Ayora region (eastern Spain). Remote Sensing of Environment 112:259–273.
Ronchail, J., G. Cochonneau, M. Molinier, J. L. Guyot, A. G. M. Chaves, V.
Guimarães, and E. Oliveira. 2002. Interannual rainfall variability in the Amazon Basin and sea-surface temperatures in the equatorial pacific and the tropical Atlantic Oceans. Int. J. Climatology 22:1663-1686.
Ropelewski, C. F., and M. S. Halpert. 1987. Global and Regional Scale Precipitation
Patterns Associated with the El Niño/Southern Oscillation. Monthly Weather Review 115:1606-1626.
Saatchi, S. S., R. A. Houghton, R. C. Dos Santos Alvala, J. V. Soares, and Y. Yu.
2007. Distribution of aboveground live biomass in the Amazon basin. Global Change Biology 13:816–837.

147
Salazar, L. F., C. A. Nobre, and M. D. Oyama. 2007. Climate change consequences on the biome distribution in tropical South America. Geophysical Research Letters 34:1-6.
Saleska, S. R., K. Didan, A. R. Huete, and H. R. Rocha. 2007. Amazon Forests
Green-Up During 2005 Drought. Science (10.1126/science.1146663):1-2. Sanford, R. L., J. Saldarriaga, K. Clark, C. Uhl, and R. Herrera. 1985. Amazon rain-
forest fires. Science 227:53-55. Sasaki, N., and F. E. Putz. 2009. Critical need for new definitions of "forest" and
"forest degradation" in global climate change agreements. Conservation Letters 2:226-232.
Schimel, D., and D. Baker. 2002. The wildfire factor. Nature 420:29-30. Schmink, M., and C. Wood. 1992. Contested Frontiers in Amazonia. Columbia
University Press, New York, NY. 387p. Schroeder, W., J. T. Morisette, I. Csiszar, L. Giglio, D. Morton, and C. O. Justice.
2005. Characterizing Vegetation Fire Dynamics in Brazil through Multisatellite Data: Common Trends and Practical Issues. Earth Interactions 9:1.
Seroa da Motta, R., M. J. C. Mendonça, D. Nepstad, M. C. Vera Diaz, A. Alencar, J.
C. Gomes, and R. A. Ortiz. 2002. O Custo Econômico Do Fogo Na Amazônia. IPEA, Rio de Janeiro. 1-42.
Setzer, A. W., and M. C. Pereira. 1991. Amazonia Biomass Burnings in 1987 and an
Estimate of Their Tropospheric Emissions. Ambio 20:19-22. Shanley, P., and L. Luz. 2003. The Impacts of Forest Degradation on Medicinal Plant
Use and Implications for Health Care in Eastern Amazonia. BioScience 53:573-584.
Shimabukuro, Y. E., V. Duarte, E. Arai, R. M. Freitas, A. Lima, D. M. Valeriano, I. F.
Brown, and M. L. R. Maldonado. 2009. Fraction images derived from Terra Modis data for mapping burnt areas in Brazilian Amazonia. Int. J. Remote Sensing 30:1537-1546.
Shlisky, A., A. Alencar, M. Manta, and L. M. Curran. 2009. Overview: Global fire
regime conditions, threats,and opportunities for fire management in the tropics. Pages 65-83 in M. A. Cochrane, editor. Tropical fire ecology: Climate Change, Land Use, and Ecosystem Dynamics. Springer, New York.

148
Siegert, F., G. Ruecker, A. Hinrichs, and A. A. Hoffmann. 2001. Increased damage from fires in logged forests during droughts caused by El Nino. Nature 414:437-440.
Silva Dias, M. A. F., S. Rutledge, P. Kabat, P. L. Silva Dias, C. Nobre, G. Fisch, A. J.
Dolman, E. Zipser, M. Garstang, O. Manzi, J. D. Fuentes, H. R. Rocha, J. Marengo, A. Plana-Fattori, L. D. A. Sa´, R. C. S. Alvala´, M. O. Andreae, P. Artaxo, R. Gielow, and L. Gatti. 2002. Cloud and rain processes in a biosphere-atmosphere interaction context in the Amazon Region. Journal of Geophysical Research 107:39 31-18.
Simmons, C. S., R. T. Walker, C. H. Wood, E. Arima, and M. Cochrane. 2004.
Wildfires in Amazonia: A pilot study examining the role of farming systems, social capital, and fire contagion. Journal of Latin American Geography 3:81-95.
Snyder, P. K. 2010. The Influence of Tropical Deforestation on the Northern
Hemisphere Climate by Atmospheric Teleconnections. Earth Interactions 14:1-34.
Soares-Filho, B., A. Alencar, D. Nepstad, G. Cerqueira, M. d. C. Diaz, S. Rivero, L.
Solorzano, and E. Voll. 2004. Simulating the Response of Deforestation and Forest Regrowth to Road Paving and Governance Scenarios Along a Major Amazon Highway: The Case of the Santarém-Cuiabá Corridor. Global Change Biology 10:745-764.
Soares Filho, B., P. Moutinho, D. Nepstad, A. Anderson, H. Rodrigues, R. Garcia, L.
Dietzsch, F. Merry, M. Bowman, L. Hissa, R. Silvestrini, and C. Maretti. 2010. Role of Brazilian Amazon protected areas in climate change mitigation. PNAS 107:10821-10826.
Soares Filho, B., D. C. Nepstad, L. M. Curran, G. C. Cerqueira, R. A. Garcia, C.
Azevedo-Ramos, E. Voll, A. McDonald, P. Lefebvre, and P. Schlesinger. 2006. Modelling conservation in the Amazon basin. Nature 440:520-523.
Souza, C., L. Firestone, L. M. Silva, and D. Roberts. 2003. Mapping forest
degradation in the Eastern Amazon from SPOT 4 through spectral mixture models. Remote Sensing of Environment 87:494–506.
Souza, C. M., D. A. Roberts, and M. A. Cochrane. 2005. Combining spectral and
spatial information to map canopy damage from selective logging and forest fires. Remote Sensing of Environment 98:329–343.
Stickler, C. M., D. C. Nepstad, M. T. Coe, D. G. McGrath, H. O. Rodrigues, W. S.
Walker, B. Soares Filho, and E. Davidson. 2009. The potential ecological costs and cobenefits of REDD: a critical review and case study from the Amazon region. Global Change Biology 15:2803–2824.

149
Strassburg, B., R. K. Turner, B. Fisher, R. Schaeffer, and A. Lovett. 2009. Reducing
emissions from deforestation—The ‘‘combined incentives’’ mechanism and empirical simulations. Global Environmental Change 19:265-278.
Tansey, K., J. M. Grégoire, P. Defourny, R. Leigh, J. Pekel, E. van Bogaert, and E.
Bartholomé. 2008. A new, global, multi-annual (2000–2007) burnt area product at 1 km resolution. Geophys. Res. Lett. 35:1-6.
Thonicke, K., S. Venevsky, S. Sitch, and W. Cramer. 2001. The role of fire
disturbance for global vegetation dynamics: coupling fire into a Dynamic Global Vegetation Model. Global Ecology & Biogeography 10:661-677.
Timmermann, A., J. Oberhuber, A. Bacher, M. Esch, M. Latif, and E. Roeckner.
1999. Increased El Niño frequency in a climate model forced by future greenhouse warming. Nature 395:694-697.
Trenberth, K. E., and T. J. Hoar. 1997. El Niño and climate change. Geophysical
Research Letters 24:3057-3060. Turner, M. G., S. L. Collins, A. L. Lugo, J. J. Magnuson, S. T. Rupp, and F. J.
Swanson. 2003. Disturbance Dynamics and Ecological Response: The Contribution of Long-Term Ecological Research. BioScience 53:46-56.
Uhl, C., P. Barreto, A. Verissimo, E. Vidal, P. Amaral, A. C. Barros, C. Souza, J.
Johns, and J. Gerwing. 1997. Natural resource management in the Brazilian Amazon: An integrated research approach. Bioscience 47:160-168.
Uhl, C., and J. B. Kauffman. 1990. Deforestation, fire susceptibility, and potential tree
responses to fire in the eastern Amazon. Ecology 71:437-449. Van der Werf, G. R., J. T. Randerson, J. Collatz, L. Giglio, P. S. Kasibhatla, A. F.
Arellano Jr., S. C. Olsen, and E. S. Kasischke. 2004. Continental-Scale Partitioning of Fire Emissions During the 1997 to 2001 El Niño/La Niña Period. Science 303:73-76.
Van der Werf, G. R., J. T. Randerson, L. Giglio, J. Collatz, M. Mu, P. S. Kasibhatla,
D. C. Morton, R. S. DeFries, Y. Jin, and T. T. Van Leeuwen. 2010. Global fire emissions and the contribution of deforestation, savanna, forest, agricultural, and peat fires (1997–2009). Atmos. Chem. Phys. Discuss. 10:16153-16230.
Van Wagtendonk, J. W., R. R. Root, and C. H. Key. 2004. Comparison of AVIRIS
and Landsat ETM+ detection capabilities for burn severity. Remote Sensing of Environment 92:397-408.

150
Vayda, A. P. 2006. Causal explanation of Indonesian forest fires: concepts, applications and research priorities. Human Ecology 34:615-635.
Veldman, J. W., B. Mostacedo, M. Peña-Claros, and F. E. Putz. 2009. Selective
logging and fire as drivers of alien grass invasion in a Bolivian tropical dry forest. Forest Ecology and Management 258:1643-1649.
Verissimo, A., P. Barreto, and M. Mattos. 1992. Logging impacts and prospects for
sustainable forest management in an old Amazonian frontier: the case of Paragominas. Forest Ecology and Management 55:169-184.
Vermote, E. F., D. Tanré, J. L. Deuzé, M. Herman, and J.-J. Morcrette. 1997.
Second Simulation of the Satellite Signal in the Solar Spectrum, 6S: An Overview. IEEE Transactions on Geoscience and Remote Sensing 35:675-686.
Villar, J. C. E., J. Ronchail, J. L. Guyot, G. Cochonneau, F. Naziano, W. Lavado, E.
De Oliveira, R. Pombosag, and P. Vauchelh. 2009. Spatio-temporal rainfall variability in the Amazon basin countries (Brazil, Peru, Bolivia, Colombia, and Ecuador). International Journal of Climatology 29:1574-1594.
Werth, D., and R. Avissar. 2002. The local and global effects of Amazon
deforestation. Journal of Geophysical Research 107:55 51-58. Whelan, R. J. 1995. The ecology of fire. Cambridge University Press, Cambridge,
UK. 346. Wolter, K., and M. S. Timlin. 1998. Measuring the strength of ENSO events - how
does 1997/98 rank? Weather 53:315-324. Wood, C., and R. Porro. 2002. Deforestation and land use in the Amazon. University
of Florida, Gainesville, Fl. 400p. Xue, Y., T. M. Smith, and R. W. Reynolds. 2003. Interdecadal Changes of 30-Yr SST
Normals during 1871–2000. Journal of Climate 16:1601-1612. Zaks, D. P. M., C. C. Barford, N. Ramankutty, and J. A. Foley. 2009. Producer and
consumer responsibility for greenhouse gas emissions from agricultural production—a perspective from the Brazilian Amazon. Environ. Res. Lett. 4:1-12.
Zarin, D. J., E. A. Davidson, E. Brondizio, I. C. G. Vieira, T. Sá, T. Feldpausch, E. A.
G. Schuur, R. Mesquita, E. Moran, P. Delamonica, M. J. Ducey, G. C. Hurtt, C. Salimon, and M. Denich. 2005. Legacy of fire slows carbon accumulation in Amazonian forest regrowth. Frontiers in Ecology and the Environment 3:365-369.

151
Zeng, N., J. Yoon, J. Marengo, A. Subramaniam, C. A. Nobre, A. Mariotti, and J. D. Neelin. 2008. Causes and impacts of the 2005 Amazon drought. Environmental Research Letters 3:1-9.
152
BIOGRAPHICAL SKETCH
Ane Auxiliadora Costa Alencar received her BA in geography from the Federal
University of Pará in 1995. Three years later, Ane went to USA to start her graduate
studies at Boston University where she received a MdA. in Environmental Remote
Sensing and GIS in 2000. For the past 17 years Ane has worked on conservation-
related issues at the Amazon Environmental Research Institute (IPAM), a NGO based
in Belém, Pará, Brazil, the city in which she was born. Her work experience includes
improving understanding of fire effects and land use changes in the Amazon that are
promoted by the expansion of the road network. Ane’s research career started in 1993
when she joined IPAM to create a soil profile database that was used to demystify the
role of deep roots in the Amazon forest ecosystem. Three years later she helped to
coordinate a World Bank project that aimed to describe and quantify the extent, nature,
causes, and history of fire in Amazonia. This project offered her the opportunity to travel
to several locations along the Amazon Arc of Deforestation and to build the basis of her
knowledge as a fire scientist. In 2000, Ane became research coordinator of a regional
land use planning project along the BR-163 Highway, in Central Amazonia. This project
generated the first participatory framework for planning a road infrastructure in the region,
having as major result the first governmental sustainable regional plan for a road corridor
in Brazil. This fire and road planning experience merged in Ane’s PhD research at
University of Florida, which she started in 2005. Ane plans to continue working on the
effects of infrastructure development, land use change, and fire on the future of
Amazonian forest, helping decision and public policy makers to promote conservation in
this important forested ecosystem.