spatial and temporal oscillations of primary …apjor.com/downloads/1102201848.pdf · ......
TRANSCRIPT

Asia Pacific Journal of Research
ISSN (Print): 2320-5504
ISSN (Online): 2347-4793
www.apjor.com Vol: I. Issue LVIV, January 2018
305 305 305
SPATIAL AND TEMPORAL OSCILLATIONS OF PRIMARY PRODUCTION AND
PHYSICOCHEMICAL CHARACTERISTICS IN A TROPICAL RAMSAR SITE (COCHIN
BACKWATERS-SOUTH WEST COAST OF INDIA).
1Geo Joseph,
2Dr. M.S. Francis,
3Parvathy V Mavelil &
4Tintu Jose Manicketh.
1,3 & 4
Research Scholar, Department of Botany,
2Research Guide, Former Head of the Department of Botany,
Sacred Heart College, Thevara, Cochin: 682013,
Mahatma Gandhi University Research Centre kottayam, PIN: 686560, Kerala, India.
ABSTRACT
Estuaries are sited among the most productive biomes of the world. cochin backwater is the largest and most productive tropical
positive estuarine system situated at the south west coast of India. The present investigation analysed spatiotemporal variations of
primary production, physicochemical characteristics and nutrients in the estuary. The ANOSIM result identified significant
variation in primary production, physicochemical parameters and nutrients across the station groups (R=0.36) and month groups
(R=0.20). Two-Way ANOVA results of net primary production, Physicochemical parameters (temperature, light
transparency,dissolved oxygen, pH and salinity) and nutrients (nitrate, nitrite, phosphate and silicate) showed significant
spatiotemporal variations in the estuary. Implication of nutrient status confirmed that the nutrient limitation did not occur in
cochin backwaters and it was mainly influenced by the river discharge, influx of marine water and intense human activities. The
SIMMPER analysis identified surface temperature, dissolved oxygen, pH and salinity as the most important physicochemical
parameters contributing more than 70 percentages on each month in the ecosystem except in June and August where salinity was
not contributing. The results unravelled significant monthly correlation existed among the water quality parameters in the
estuary. The correlation of water quality parameters that are important for the water quality variation for one month may not be
important for another month. Further detailed research studies are required for explaining the reasons for such relationships. The
present study confirmed the great dynamism, high monthly fluctuation of primary production, physicochemical parameters and
nutrients in the cochin backwaters.
Keywords: Cochin backwaters, Primary production, Physicochemical parameters, Nutrients
1. Introduction
Estuaries rank among the most beneficial and significant ecological system on earth. An estuary is a semi- enclosed coastal body
of water that extends to the effective limit of tidal influence, within which sea water entering from one or more free connections
with in the open sea or other saline coastal body of water is significantly diluted with fresh water derived from land drainage and
can sustain euryhaline biological species from either part or the whole of their life cycle (Perillo 1995). To understand the ecology
of an estuary, an interdisciplinary approach linking the physical phenomena with chemical and biological properties are essential
(Shivaprasad et al. 2013). The coastal waters exhibited complex dynamism in physicochemical characteristics due to river flow,
upwelling, atmospheric deposition, vertical mixing and anthropogenic sources (Nirmal Kumar et al. 2012). Water quality always
defined in terms of chemical, physical and biological contents. Temperature, rainfall, pH, salinity, dissolved oxygen and carbon
dioxide are the important physical and chemical parameters influencing the aquatic environment (Lawson 2011). In tropical
estuaries tidal variations and nutrient dynamics is more pronounced than in temperate estuaries (Nirmal et al. 2009). The most
important parameter of estuarine environment is nutrients and they tremendously influence growth, reproduction and metabolic
activities of estuarine organisms (Anitha & Sugirtha 2013). Streams, lakes and estuaries get vast sum of nutrients from the land
and results in algal blooms which leads to hypoxia in the ecosystem (Conley et al. 2002). One way to assess the impact of human
activities on environment is to compare the seasonal changes in physical and chemical water properties in anthropogenically
disturbed and undisturbed estuaries (Arbor 2002). Primary producers assemblage, carbon and nitrogen storage capacity at great
Asia Pacific Journal of Research
ISSN (Print): 2320-5504
ISSN (Online): 2347-4793
www.apjor.com Vol: I. Issue LVIV, January 2018
306 306 306
extent were altered by eutrophication in coastal estuaries at local and regional scales (Schmidt et al. 2012). The hydrological,
geomorphological and biochemical changes in the estuary had important consequences for the biodiversity in the estuarine
ecosystem (Patrick et al. 2005).
The backwaters are responsible for rich fisheries potential of Kerala and support as much biological productivity and diversity as
tropical rainforests. Cochin backwater is the largest and most productive tropical positive estuarine system situated at the tip of the
northern vembanad lake extending between 90
40’and 100 12’N and 76
0 10’and 76
0 30’E. The estuary has gone through serious
environmental changes by land reclamation, dredging activities and urbanisation (Menon et al. 2000). Further it is the largest
ramsar site on the south west coast of India (Asha et al. 2016). Cochin estuary tides are mixed semidiurnal type with an average
tide range of 1m (Qasim & Gopinathan 1969). In cochin backwaters the seasonal fluctuation in salinity controls the distribution
and abundance of micro and mesozooplankton. Further the phytoplankton community was in general dominated by diatoms at
high saline conditions (Madhu et al. 2007). The large amount of effluents from both economic and domestic sectors caused
eutrophication of the cochin backwaters (Martin et al. 2012). The ecological unbalancing due to industrialisation, rapid
urbanization and agricultural wastes are alarming in cochin estuary (Joseph & Ouseph 2010). The heavy metal accumulation in
cochin estuary places the ecosystem as an impacted estuaries in the world (Balachndran et al. 2005).
ANOSIM (Analysis of similarity) and SIMPER (Similarity percentage analysis) are statistical tools applied recently in
environmental and biological research (Rees et al. 2004; Perus et al. 2004). The present study explored above tools for the water
data analysis. The primary aim of the present study is to check monthly spatiotemporal variations of primary production and
physicochemical characteristics in the cochin backwaters and to identify the most important physicochemical parameters that are
influencing the monthly variations of water quality. This study also analyses monthly correlation between primary production and
physicochemical parameters and correlation among physicochemical parameters in the tropical estuary.
2 Materials and methods
2.1 Study area
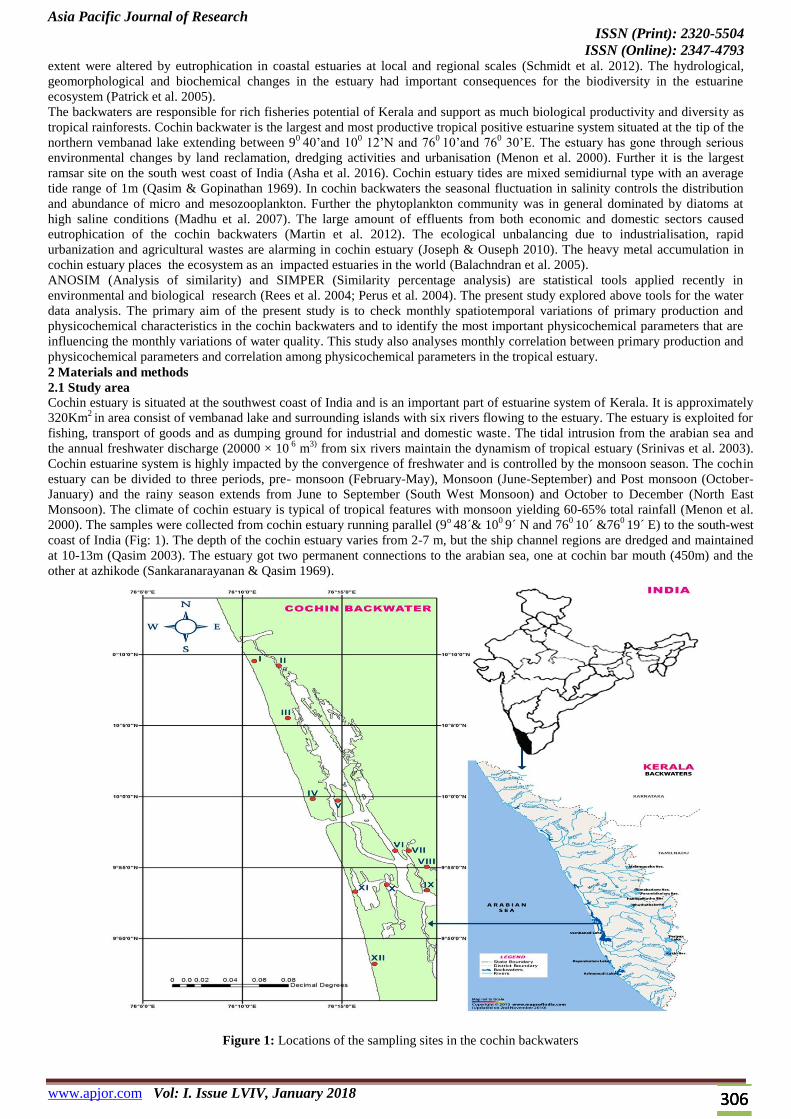
Cochin estuary is situated at the southwest coast of India and is an important part of estuarine system of Kerala. It is approximately
320Km2 in area consist of vembanad lake and surrounding islands with six rivers flowing to the estuary. The estuary is exploited for
fishing, transport of goods and as dumping ground for industrial and domestic waste. The tidal intrusion from the arabian sea and
the annual freshwater discharge (20000 × 10 6 m
3) from six rivers maintain the dynamism of tropical estuary (Srinivas et al. 2003).
Cochin estuarine system is highly impacted by the convergence of freshwater and is controlled by the monsoon season. The cochin
estuary can be divided to three periods, pre- monsoon (February-May), Monsoon (June-September) and Post monsoon (October-
January) and the rainy season extends from June to September (South West Monsoon) and October to December (North East
Monsoon). The climate of cochin estuary is typical of tropical features with monsoon yielding 60-65% total rainfall (Menon et al.
2000). The samples were collected from cochin estuary running parallel (9o 48´& 10
0 9´ N and 76
0 10´ &76
0 19´ E) to the south-west
coast of India (Fig: 1). The depth of the cochin estuary varies from 2-7 m, but the ship channel regions are dredged and maintained
at 10-13m (Qasim 2003). The estuary got two permanent connections to the arabian sea, one at cochin bar mouth (450m) and the
other at azhikode (Sankaranarayanan & Qasim 1969).
Figure 1: Locations of the sampling sites in the cochin backwaters
Asia Pacific Journal of Research
ISSN (Print): 2320-5504
ISSN (Online): 2347-4793
www.apjor.com Vol: I. Issue LVIV, January 2018
307 307 307
2.2 Sampling
Monthly data of Net Primary Production (NPP) and physicochemical parameters were collected from twelve stations covering the
cochin backwater (CBW) ecosystem during May 2015 to April 2016. The NPP of the CBW ecosystem was estimated according to
the dark and light bottle method (Strickland & Parsons 1972). The surface water temperature was recorded using a 0-50oC
precision thermometer and pH by eco tester PH1. The light transparency of the water column was measured by using the secchi
disc (Strickland & Parsons 1972) and the salinity by a handheld refractometer (RHS-10 ATC ERMA). The dissolved oxygen
(DO) was analysed by voltammetric method using digital portable dissolved oxygen meter (VSI Model: VSI-15). The range of the
instrument was in between 0 to 20 mg/l and the accuracy was ±0.3 mg/l ± 1 digit. The surface water samples were collected in
500 ml Tarsons narrow mouth bottles (Code: 583140) for the nutrients analysis (nitrate, nitrite, phosphate and silicate) and
analysed within 6 hours of collection based on a standard protocol using UV-1800 Shimadzu spectrophotometer (APHA 2005).
2.3. Data Analysis The analysis of similarities (ANOSIM) was conducted to test statistically significant variation in primary production and
physicochemical parameters during the study period on selected stations. The test was conducted by plymouth routines in
multivariate ecological research (PRIMER v6) statistical software (Clarke & Gorley 2005) and the variables were pre-treated into
square roots. The resemblance was calculated with Bray-Curtis Similarity formula. Further the data was tested with Two-Way
Analysis of variance (ANOVA) for statistical significance of temporal and spatial influence on primary production and
physicochemical parameters. The statistical test was conducted by using IBM SPSS statistics 22 with alpha 0.05 and equal variance
assumed was a tukey. SIMPER analysis was performed on PRIMER 6 software using resemblance S17 Bray Curtis similarity
formula. The test was performed in order to distinguish the percentage of contribution of physicochemical parameters in each
months and the cut off for low contribution was fixed as 90%. The Pearson correlation was carried out by IBM SPSS Statistics 22
with the data to check correlation between the primary production and water quality parameters, correlation among water quality
parameters during the study period.
3. Results and discussion
3.1 ANOSIM The spatiotemporal variations of primary production and physicochemical characteristics play crucial role in the functioning of
estuarine ecosystem. The ANOSIM result identified a strong difference in the primary production and physicochemical parameters
across the stations and months. The test for difference between month groups R value obtained was 0.36 and station groups R value
was 0.20, at significance level of sample statistic 0.1% and number of permutations 999. The result uncovers more statistically
prominent variation in month groups than station groups in the primary production and physicochemical characteristics in CBW.
The result of the present investigation demonstrates complex spatial and temporal variations of primary production and
physicochemical parameters in the ecosystem.
3.2. Primary Production Estuaries and coastal marine ecosystem are considered as the most productive biomes of the world (Robert et al. 1993).
Phytoplankton primary production in estuaries play vital and an essential role in element cycling, water quality and food supply to
heterotrophs (Stefan et al. 2005). The primary production of an estuarine ecosystem is directly influenced by the nutrient loading
and light penetration in the water column (Kaberi et al. 2012). The primary production of CBW varied from time to time and station
to station due to the influence of freshwater from the rivers and sea water from the inshore areas (Nair et al. 1975). The primary
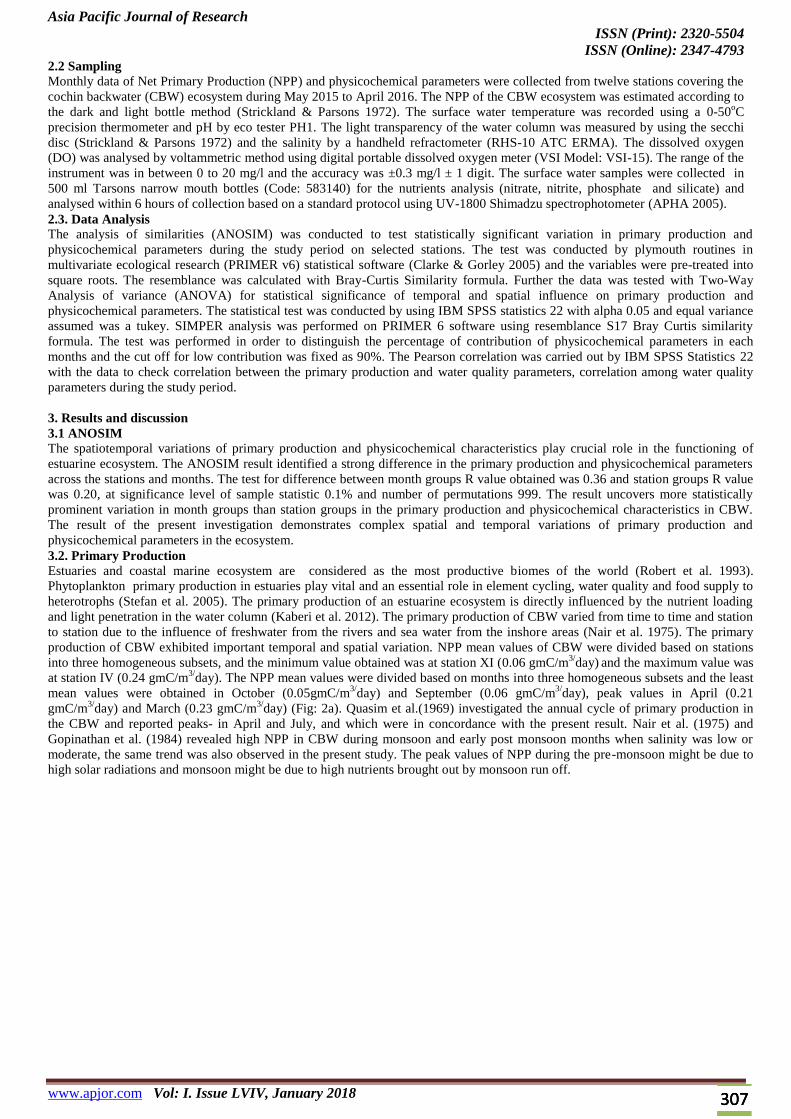
production of CBW exhibited important temporal and spatial variation. NPP mean values of CBW were divided based on stations
into three homogeneous subsets, and the minimum value obtained was at station XI (0.06 gmC/m3/
day) and the maximum value was
at station IV (0.24 gmC/m3/
day). The NPP mean values were divided based on months into three homogeneous subsets and the least
mean values were obtained in October (0.05gmC/m3/
day) and September (0.06 gmC/m3/
day), peak values in April (0.21
gmC/m3/
day) and March (0.23 gmC/m3/
day) (Fig: 2a). Quasim et al.(1969) investigated the annual cycle of primary production in
the CBW and reported peaks- in April and July, and which were in concordance with the present result. Nair et al. (1975) and
Gopinathan et al. (1984) revealed high NPP in CBW during monsoon and early post monsoon months when salinity was low or
moderate, the same trend was also observed in the present study. The peak values of NPP during the pre-monsoon might be due to
high solar radiations and monsoon might be due to high nutrients brought out by monsoon run off.
Asia Pacific Journal of Research
ISSN (Print): 2320-5504
ISSN (Online): 2347-4793
www.apjor.com Vol: I. Issue LVIV, January 2018
308 308 308
Figure 2: Displayed primary production and physicochemical parameters means for station and month groups in homogenous
subsets (Tukey HSDa.b
) based on observed means (Alpha 0.05)
3.3. Physicochemical Parameters
The physicochemical parameters of water maintain nutritional balance in an aquatic ecosystem (James et al. 2013). Temperature is
an important water quality parameter which affects the chemical and biological reactions in aquatic ecosystem and exhibited high
seasonal fluctuation (George & Atakpa 2015). The atmospheric temperature of cochin backwaters is increasing over the years due
to climatic change (Asha et al. 2016). The maximum average atmospheric temperature of cochin backwaters ranges from 28 to 34
0C
and minimum from 20 to 250C (Sankaranarayanan & Qasim 1969). In the present investigation, the surface air temperature mean
values were divided into four homogeneous subsets based on stations and the lowest mean value was recorded at station X
(32.080C) and highest was at station VI (34.08
0C). The surface temperature of CBW highly influenced by the months and the mean
values were divided into seven homogeneous subsets (Fig: 2b). The lowest mean values were recorded in December (31.42 0C) and
January (31.67 0
C), highest in April (34.17 0
C) and May (35.58 0
C) (Soman et al. 1988). The high surface air temperature in April

Asia Pacific Journal of Research
ISSN (Print): 2320-5504
ISSN (Online): 2347-4793
www.apjor.com Vol: I. Issue LVIV, January 2018
309 309 309
and May could be attributed to the intensity of high solar radiation and evaporation. The recorded low surface air temperature
values in December and January could be due to the strong land sea breeze and precipitation (Govindasamy et al. 2000; Achary et
al. 2014; Asha et al. 2016).
Light limitation is one of the major factor regulating the growth of phytoplankton in the aquatic ecosystem (Cloern 1999). Living
and non living suspended particulate matter concentration normally influences the light penetration depth of an estuary.
Furthermore light is rapidly attenuated in estuarine waters because of the high concentration of suspended particles (Bijoy et al.
2014). The light transparency of the CBW showed significant temporal and spatial variations. Light transparency mean values were
separated based on stations into six homogeneous subsets, and the minimum value was recorded at station XII (0.42 m) and
maximum was at station III (1.03 m). The light transparency mean values were separated based on months into four homogeneous
subsets. The lowest mean values were recorded in monsoon months, July and June (0.046 m) and highest mean values were
recorded in November (0.78m) and September (0.70 m) (Fig: 2c). The highest values in September and November were similar to
the earlier studies from cochin estuary (Renjith et al. 2004) and might be due to high solar radiations. The lowest values in
monsoon months were due to the heavy discharge of fresh water sediments from the rivers and low solar radiations (Anila et al.
2007). Sankaranarayanan and Qasim( 1969) reported the secchi disc visibility range from 0.5 to 1.5m at cochin estuary and this
trend was repeated in the present study. Dissolved Oxygen (DO) is a vital ecological parameter for the survival of aquatic life and
DO strongly influence the solubility of inorganic nutrients. Furthermore, it helps to change the redox potential of the medium
(Ajibare 2014). DO level in natural water body is determined by the physical, chemical and biochemical activities occurring at
surface and sub surface levels (Mohammad et al. 2013). The DO mean values of CBW were divided based on stations into five
homogeneous subsets, and the minimum mean value obtained was at station VIII (6.09 mg/l) and maximum was at station XII
(10.88 mg/l). The DO mean values were divided based on the months into three homogenous subsets. The lowest mean values were
observed in August (6.64 mg/l) and January (6.70 mg/l), highest in March (8.48 mg/l) and May (10.13 mg/l) (Fig: 2d). The DO
values observed in CBW found to be consistent with the results in Tapi estuarine area of Gulf of Khambhat (Basil et al. 2012). In
the present study, the pre-monsoon and monsoon months observed highest DO values compared to post monsoon months. The
highest DO values in the ecosystem during the study period might be due to higher photosynthetic activity, inputs from the
atmosphere, higher solubility of oxygen in the lower salinity surface water, the river influx and tidal mixing (Anila et al. 2007;
Jayachandran et al. 2012).
The chemical parameters exhibited clear distinction in mean values during the study period and exhibited marked variations with
respect to spatiotemporal variables. The pH of an aquatic ecosystem is a vital pointer of the water quality and degree of
contamination in the ecosystem (APHA 1995). During the whole study period, the pH value in CBW was in alkaline range. The pH
mean values were divided into six homogeneous subsets based on stations and the minimum mean value obtained was at station
VIII (7.12) and maximum was at XII station (8.98). The pH mean values were divided based on months into three homogenous
subsets and the lowest values were obtained in October (7.49) and December (7.53), highest in May and July (8.69) (Fig: 2e). The
obtained results of pH values compares favourably with the Basil et al. (2012). The surface water hydrogen ion concentration
showed considerable fluctuation in spatial scale (formed six homogeneous subsets) than months (three). The increased pH values in
the ecosystem during pre-monsoon and monsoon months could be attributed to the high rate of primary production, undersaturation
of CO2 which increased the pH of the ecosystem and buffering capacity of the sea water (Geetha et al. 2006). In estuarine
ecosystem, salinity is the major limiting factor controlling the distribution of living organisms (Damotharan et al. 2010). The
salinity of brackish water habitats (estuaries, backwaters and mangroves) changes due to the influx of freshwater from land run off
caused by monsoon or by tidal variations (Vengadesh et al. 2009). A clear distinction can be observed in the surface water salinity
of the CBW. The salinity mean values CBW were divided based on stations into four homogeneous subsets and the minimum mean
value recorded was at station VII (8.05 ppt) and maximum was at station I (24.47 ppt). In the present investigation water with
higher salinity was found at stations near to the sea mouth and lower salinity was found at stations which are away from the sea
(Martin et al. 2012). The salinity mean values of CBW were divided based on months into seven homogeneous subsets and the
lowest mean values were recorded in August (2.86 ppt) and June (2.94 ppt), highest in April (27.83 ppt) and March (27.39 ppt) (Fig:
2f). The surface water salinity was maximum in pre-monsoon months whereas it was almost zero in monsoon and moderately high
in post-monsoon months. The highest salinity in the pre-monsoon months were due to the influence of sea water, and high fresh
water river discharge in monsoon months were responsible for the lower surface water salinity (Qasim 2003).
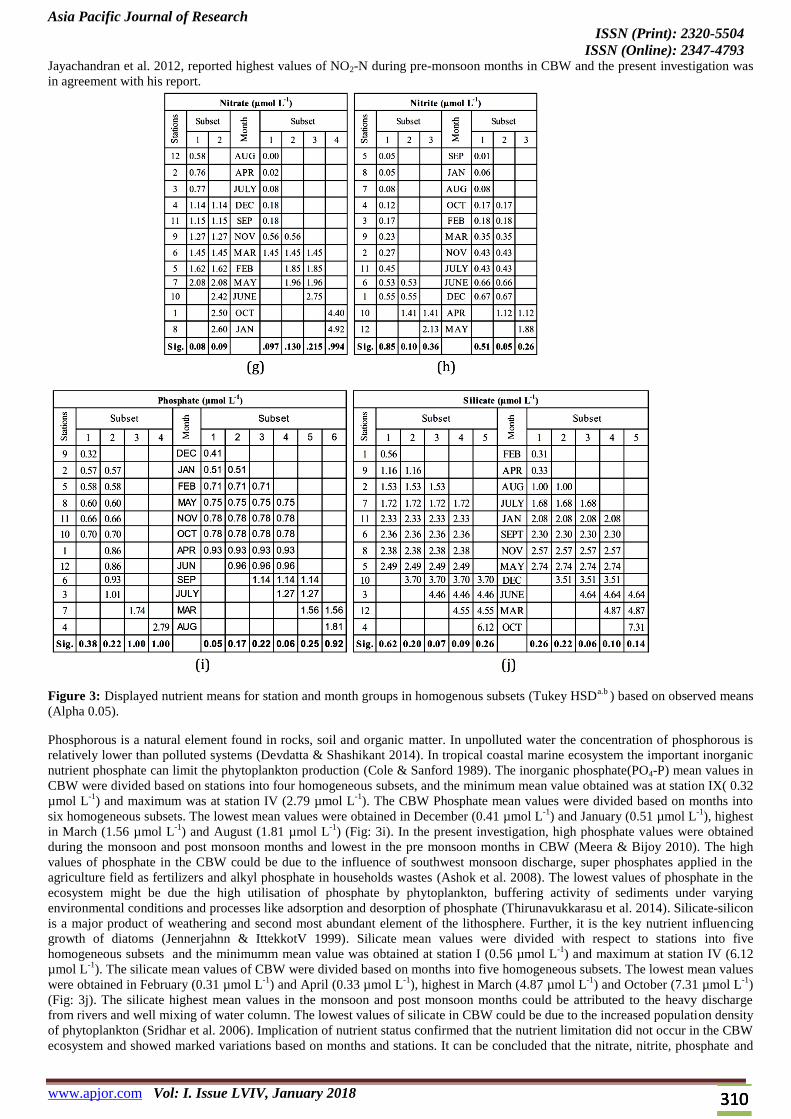
3.4. Nutrients The macronutrients such as nitrogen (N), phosphorous (P) and silicate (Si) are the most important elements for phytoplankton
growth and reproduction (Bijoy et al. 2014). The worldwide nitrogen cycle has been broadly changed by human activities than by
natural processes (Vitousek 1994). Nitrates are the most oxidised forms of nitrogen and finished result of aerobic decomposition of
organic nitrogenous matter (Ramalingam et al. 2011). Nutrient status of CBW exhibited high fluctuations in temporal and spatial
scales. The nitrate (NO3-N) mean values were divided based on stations into two homogeneous subsets and the minimum mean
value obtained was at station XII (0.58 µmol L-1
) and maximum was at VIII (2.60 µmol L-1
). The nitrate mean values of CBW were
divided based on months into four homogeneous subsets. The lowest mean value was obtained in August (0.00) and April (0.02
µmol L-1
), highest in October (4.40 µmol L-1
) and January (4.92 µmol L-1
) (Fig: 3g). The lowest values of nitrate in the CBW could
be attributed to the extensive utilisation by phytoplankton for growth and development, the highest values in the ecosystem might
be due to the fresh water discharge, oxidation of ammonia and land runoff (Govindasamy et al. 2000; Vengadesh et al. 2009;
Sankaranarayanan & Qasim 1969). The Nitrite (NO2-N) mean values of CBW were divided based on stations into three
homogeneous subsets. The minimum mean value obtained was at station V (0.05 µmol L-1
) and maximum was at station XII (2.13
µmol L-1
). The nitrite mean values were divided based on months into three homogenous subsets. The lowest mean value was
obtained in September (0.01 µmol L-1
) and January (0.06 µmol L-1
), highest in April (1.12 µmol L-1
) and May (1.88 µmol L-1
) (Fig:
3h). The lowest values of the nitrite in the ecosystem might be due to the less freshwater inflow and high salinity
(Sankaranarayanan & Qasim 1969). High nitrite in the ecosystem might be due the high decomposition of organic nitrogen.
Asia Pacific Journal of Research
ISSN (Print): 2320-5504
ISSN (Online): 2347-4793
www.apjor.com Vol: I. Issue LVIV, January 2018
310 310 310
Jayachandran et al. 2012, reported highest values of NO2-N during pre-monsoon months in CBW and the present investigation was
in agreement with his report.
Figure 3: Displayed nutrient means for station and month groups in homogenous subsets (Tukey HSDa.b
) based on observed means
(Alpha 0.05).
Phosphorous is a natural element found in rocks, soil and organic matter. In unpolluted water the concentration of phosphorous is
relatively lower than polluted systems (Devdatta & Shashikant 2014). In tropical coastal marine ecosystem the important inorganic
nutrient phosphate can limit the phytoplankton production (Cole & Sanford 1989). The inorganic phosphate(PO4-P) mean values in
CBW were divided based on stations into four homogeneous subsets, and the minimum mean value obtained was at station IX( 0.32
µmol L-1
) and maximum was at station IV (2.79 µmol L-1
). The CBW Phosphate mean values were divided based on months into
six homogeneous subsets. The lowest mean values were obtained in December (0.41 µmol L-1
) and January (0.51 µmol L-1
), highest
in March (1.56 µmol L-1
) and August (1.81 µmol L-1
) (Fig: 3i). In the present investigation, high phosphate values were obtained
during the monsoon and post monsoon months and lowest in the pre monsoon months in CBW (Meera & Bijoy 2010). The high
values of phosphate in the CBW could be due to the influence of southwest monsoon discharge, super phosphates applied in the
agriculture field as fertilizers and alkyl phosphate in households wastes (Ashok et al. 2008). The lowest values of phosphate in the
ecosystem might be due the high utilisation of phosphate by phytoplankton, buffering activity of sediments under varying
environmental conditions and processes like adsorption and desorption of phosphate (Thirunavukkarasu et al. 2014). Silicate-silicon
is a major product of weathering and second most abundant element of the lithosphere. Further, it is the key nutrient influencing
growth of diatoms (Jennerjahnn & IttekkotV 1999). Silicate mean values were divided with respect to stations into five
homogeneous subsets and the minimumm mean value was obtained at station I (0.56 µmol L-1
) and maximum at station IV (6.12
µmol L-1
). The silicate mean values of CBW were divided based on months into five homogeneous subsets. The lowest mean values
were obtained in February (0.31 µmol L-1
) and April (0.33 µmol L-1
), highest in March (4.87 µmol L-1
) and October (7.31 µmol L-1
)
(Fig: 3j). The silicate highest mean values in the monsoon and post monsoon months could be attributed to the heavy discharge
from rivers and well mixing of water column. The lowest values of silicate in CBW could be due to the increased population density
of phytoplankton (Sridhar et al. 2006). Implication of nutrient status confirmed that the nutrient limitation did not occur in the CBW
ecosystem and showed marked variations based on months and stations. It can be concluded that the nitrate, nitrite, phosphate and
Asia Pacific Journal of Research
ISSN (Print): 2320-5504
ISSN (Online): 2347-4793
www.apjor.com Vol: I. Issue LVIV, January 2018
311 311 311
silicate in cochin estuary is mainly influenced by the river discharge, influx of marine water and intense human activities (Joseph &
Ouseph 2010).
3.5 Identification of important monthly water quality parameters SIMPER analysis was carried out to identify the most influencing physicochemical parameters in determining the months as
temporal factor. The analysis of the data confirmed that the major physicochemical parameters contributing the monthly variations
of CBW was the surface temperature, DO, pH and the salinity. The surface temperature, DO, pH and salinity were contributing
more than 74 percentages on each month in the CBW except in June and August, where salinity was not contributing. The above
parameters are the most influential parameters controlling the distribution and abundance of flora and fauna of estuarine ecosystem
(Geetha & Bijoy Nandan 2014; Menon et al. 2000). The light transparency highly contributed to the CBW during the October
(4.54%), November (5.54%), January (3.98%), February (3.70%) and April (3.49%). The transperancy was contributing the pre and
post monsoon months of the ecosystem because the estuary was settled down after the monsoon and light was less attenuated. The
nutrients contributing the monthly variations within the ninety percentage cut off were inorganic nitrate, phosphate and silicate.
During October (11.54%) and January (9.91%) nitrate was contributing high on the estuary and phosphate was contributing to May
(4.01%), June (4.36%), July (6.54%), August (6.52%), September (6.21%) and March (4.65%). Silicate contribution towards May
(3.95%), June (6.15%), December (4.87%) and March (6.70%) months of CBW were found high. The result highlights that the
above important macro nutrients were influencing the monthly variations in the CBW. It can be concluded that the physicochemical
parameters and nutrients were contributing at high percentage to the significant monthly variation in the ecosystem.
3.6 Correlation of water quality parameters The present investigation recorded strong correlation among physiochemical parameters and NPP in the ecosystem. NPP of the
CBW had significant positive correlation with transparency in January (r2=0.68). The positive correlation of NPP with light
transperancy suggest the direct influence of light penetration in the primary production of the ecosystem (Robin et al. 2012).
Positive correlation was found between the NPP and DO in July (r2=0.58), October (r
2=0.59) and March (r
2=0.58). The positive
correlation of NPP and DO confirmed the effect of photosynthetic activity and thereby evolved oxygen in the estuary. In May
(r2=0.61) and March (r
2=0.64) a positive correlation was observed between NPP and pH. In March, a positive correlation (r
2=0.70)
was observed between NPP and nitrite. Valid positive correlation was observed between NPP and phosphate in November
(r2=0.85) and April (r
2=0.72). NPP had a positive correlation with silicate in October (r
2=0.71). The positive correlation of NPP
with nutrients indicates that nutrient inputs in the estuary positively influenced the primary production of the CBW.
Temperature had a negative correlation (r2=-0.61) with transparency in July and a positive correlation (r
2=0.63) with DO in
January. The positive correlation between DO and temperature could be interpreted as an effect of high solar radiations in the
ecosystem which increased the light transperancy and primary production of the ecosystem resulting high DO. Temperature had a
positive correlation with nitrite in August (r2=0.65) and November (r
2=0.75). Strong negative correlation between temperature and
silicate was found in February (r2= -0.63). Transparency had a positive correlation with salinity in July (r
2=0.60). The positive
correlation of transparency with salinity in July might be due to the sea water influx in the estuary. Transparency had positive
correlation with nitrate in September (r2=0.74), November (r
2=0.70). Transparency had positive correlation with nitrite in
September (r2=0.60), and had a positive correlation with phosphate in September (r
2=0.88), October (r
2=0.81) and January
(r2=0.59). Transparency had positive correlation (r
2=0.72) with silicate in November. The positive correlation of transperancy with
nutrients occurred mainly in monsoon and post monsoon months. This could have occurred due to the high solar radiations and
heavy nutrients discharge from rivers in to the estuary. DO had a positive correlation with pH in May (r2=0.63), June (r
2=0.59)
July (r2=0.74) and March (r
2=0.66). The Strong positive correlation between DO and pH might be due to the high photosynthetic
activity in the ecosystem (Frieder et al. 2012). A strong positive correlation (r2=0.65) was found between DO and salinity in
February. A strong positive correlation was found between DO and nitrite in March (r2=0.60) and a negative correlation in
January (r2=-0.61). DO had positive correlation (r
2=058) with silicate in July and a negative correlation with silicate in October
(r2=-0.63) and April (r
2=-0.76). The strong positive correlation of DO with nutrients might be due to the high photosynthetic
activity during pre monsoon and monsoon months due to rich nutrients in the estuary.
pH had positive correlation with salinity in December (r2=0.62), January (r
2=0.69), February (r
2=0.66) and march (r
2=0.68)
indicating the influx of marine water in to the estuary during the pre and post monsoon months (Joseph & Ouseph 2010). pH had
positive correlation with nitrate in November (r2=0.65), December (r
2=0.58), January (r
2=0.69) and April (r
2=0.65). pH had
positive correlation with nitrite in December (r2=0.65), February (r
2=0.80) and March (r
2=0.63), and had a negative correlation
with silicate in May (r2=-0.59). Salinity had a positive correlation with nitrite in June (r
2=0.72)) and a negative correlation with
nitrate in January (r2=-0.63). Nirmal kumar et al. (2009) reported negative correlation of nitrate with salinity in Tapi estuary.
Salinity had positive correlation with phosphate in June (r2=0.66) and August (r
2=0.66), indicating the source of phosphorous in
these months were from the sea (Robin et al. 2012). Negative correlation of salinity with phosphate (r2=-0.60) and silicate (r
2=-
0.60) in November (r2=-0.60) indicates that sea water was not the source for nutrients in November (Joseph & Ouseph 2010).
Nitrate had positive correlation with nitrite in May (r2= 0.69), June (r
2=0.75) and April (r
2=0.59). Nitrate had a positive correlation
with phosphate in May (r2=0.58), June (r
2=0.82) and September (r
2=0.59) (Nirmal et al., 2009), and had positive correlation with
silicate in May (r2=0.59) and March (r
2=0.66). Nitrite had positive correlation with phosphate in June (r
2=0.67) and positive
correlation with silicate in May (r2=0.74). Phosphate had positive correlation with silicate in February (r
2=0.96). Significant
positive correlation of nutrients in pre monsoon and monsoon months indicates that river flow might be the common source for
the nutrients in the estuary. The result of present study revealed that the correlation of water quality parameters that are important
for the water quality variation for one month may not be important for another month. The present study unveiled statistically
significant monthly correlation existed in the CBW, but more scientific research studies are required for explaining the reasons for
such relationships.
The present investigation confirmed the great dynamism, high monthly variation of primary production and physicochemical
parameters in the cochin backwaters. The large input of nutrients and high fluctuations of primary production in the ecosystem

Asia Pacific Journal of Research
ISSN (Print): 2320-5504
ISSN (Online): 2347-4793
www.apjor.com Vol: I. Issue LVIV, January 2018
312 312 312
during the study period indicate anthropogenic impacts on the ecosystem. The backwater ecosystem faces serious environmental
threats by human activities. The present information of primary production and physicochemical characteristics of the ecosystem
would serve as useful tool for the monitoring and management of the cochin estuary.
Acknowledgements The study was supported by Kerala State Biodiversity Board, kerala, India. The authors are thankful to the Principal and Head,
Department of Botany, Sacred Heart College Thevara, Cochin for providing necessary facilities to carry out the work.
4) References 1. Achary, M.S. et al., 2014. Nutrient dynamics and seasonal variation of phytoplankton assemblages in the coastal waters of
southwest Bay of Bengal. Environmental Monitoring and Assessment, 186(9), pp.5681–5695.
2. Ajibare, A.O., 2014. Assessment of Physico-Chemical Parameters of Waters in Ilaje Local Government Area of Ondo State,
Nigeria. International Journal of Fisheries and Aquatic Studies IJFAS, 1(5), pp.84–92. Available at:
www.fisheriesjournal.com.
3. Anila, K.K.S., Azis Abdul, P.K. & Natarajan, P., 2007. Water quality of the Adimalathura Estuary , southwest coast of India.
Jounal of Marine Biology, 49(June), pp.1–6.
4. Anitha, G. & Sugirtha, P.K., 2013. Physicochemical characteristics of water and sediment in Thengapattanam estuary ,
southwest coastal zone , Tamilnadu , India. , 4(3), pp.205–222.
5. APHA, 2005. American Public Health Association Standard Methods for examination of the examination of water analysis and
waste-water, 21st edition.,
6. APHA, 1995. Standard methods for the examination of water and waste water 19th ed., Washington, DC,: American Public
Health Association.
7. Arbor, A., 2002. Temporal and Spatial Differences in Salinity and Water Chemistry in SW Florida Estuaries : Effects of
Human-impacted Watersheds. , 25(3), pp.393–408.
8. Asha, C. V. et al., 2016. Ecosystem analysis of the degrading Vembanad wetland ecosystem, the largest Ramsar site on the
South West Coast of India — Measures for its sustainable management. Regional Studies in Marine Science, 8(October),
pp.408–421.
9. Ashok, prabu V, Rajkumar, M. & Perumal, P., 2008. Seasonal variations in physico-chemical characteristics of Pichavaram
mangroves , southeast coast of India. Journal of Environmental Biology, 29(6), pp.945–950.
10. Balachndran, K.K. et al., 2005. Heavy Metal Accumulation in a Flow Restricted , Tropical Estuary. Estuarine, Coastal and
Shelf Science, 65, pp.361–370.
11. Basil, G., Nirmal, K.J.I. & Rita, N.K., 2012. Study on the Influence of Hydrochemical Parameters on Phytoplankton
Distribution Along Tapi Estuarine Area of Gulf of Khambhat , India. The Egyptian Journal of Aquatic Research, 38(3),
pp.157–170. Available at: http://dx.doi.org/10.1016/j.ejar.2012.12.010.
12. Bijoy, N.S., Jayachandran, P.R. & Sreedevi, O.K., 2014. Spatio-Temporal Pattern of Primary Production in a Tropical Coastal
Wetland (Kodungallur-Azhikode Estuary), South West Coast of India. Coastal Development, 17(2). Available at:
http://dx.doi.org/10.4172/1410-5217.1000392.
13. Clarke, K.R. & Gorley, R.N., 2005. PRIMER 6: Getting Started with v6,
14. Cloern, J.E., 1999. The relative inporatnce of light and nutrient limitation of phytoplankton growth: A simple index of coastal
ecosystem sensitivity to nutrients enrichment. Aquatic Ecology, 33, pp.3–15.
15. Cole, C. V & Sanford, R.L., 1989. Biological aspects of the Phosphorus cycle. In In Proc. Symp. on phosphorous requirements
for sustainable agriculture in Asia and Oceania, SCOPE/UNEP.
16. Conley, D.J. et al., 2002. Hypoxia in the Baltic Sea and basin-scale changes in phosphorus biochemistry. In Environmental
Science and Technology, 36(24), pp.5315–5320.
17. Damotharan, P. et al., 2010. Seasonal variation of physicochemical characteristics in point calimere coastal waters south east
coast of India. Middle-East J. Sci. Res, 6(4), pp.333–339.
18. Devdatta, L. & Shashikant, P., 2014. Present Status of Water Quality of Ulhas River Estuary , Vasai Coastal Area ,Thane,
Maharashtra, India. International Journal of Pure and Applied Bioscience, 2(1), pp.209–212.
19. Frieder, C.A. et al., 2012. High temporal and spatial variability of dissolved oxygen and pH in a nearshore California kelp
forest. Biogeosciences, 9, pp.3917–3930.
20. Geetha, P.N. & Bijoy Nandan, S., 2014. Ecology , Diversity , and Abundance of Macrobenthic Crustaceans in Cochin Estuary ,
India. Research Journal of Recent Science, 3, pp.137–148.
21. Geetha, R., Chandramohanakumar, N. & Mathews, L., 2006. Seasonal and tidal impact on the organic compounds and nutrients
distribution in tropical mangroves , Kerala , India. Chemistry and Ecology, 22(January), pp.29–45.
22. George, U.U. & Atakpa, E.O., 2015. Seasonal Variation In Physico-Chemical Characteristics Of Cross River Estuary, South
Eastern Nigeria. Nature and Science, 13(12), pp.86–93.
23. Gopinathan, C.P., Nair, P.V.R. & Nair, A. k K., 1984. Quantitative ecology of phytoplankton in the Cochinbackwaters. Indian
Journal of Fisheries, 31, pp.325–336.
24. Govindasamy, C. et al., 2000. Seasonal variation in physico-chemical properties and primary production in the coastal water
biotopes of Coromandel coast. Indian Journal of Environmental Biology, 21, pp.1–7.
25. James, P.U., John, E.U. & Aniekan J, O., 2013. Spatial Variation in Physico-Chemical Parameters of Eastern Obolo Estuary,
Niger Delta , Nigeria. Journal of Environment and Earth Science, 3(12), pp.163–172.
26. Jayachandran, P.R., Nandan, S.B. & Sreedevi, O.K., 2012. Water quality variation and nutrient characteristics of Kodungallur-
Azhikode. Indian Journal of Geo- Marine Sciences, 41(April), pp.180–187.
27. Jennerjahnn, T.C. & IttekkotV, 1999. Changes in organic matter from surface waters to continental slop sediments off the Sao
Francisco River eastern Brasil. Marine Geology, 161, pp.121–140.
28. Joseph, S. & Ouseph, P.P., 2010. Assessment of nutrients using multivariate statistical techniques in estuarine systems and its
management implications: A case study from Cochin Estuary, India. Water and Environment Journal, 24(2), pp.126–132.
29. Kaberi, C. et al., 2012. Physicochemical and biological factors controlling water column metabolism in Sundarbans estuary,
India. Aquatic Biosystems, 8(1), p.26. Available at: http://aquaticbiosystems.biomedcentral.com/articles/10.1186/2046-9063-8-26.

Asia Pacific Journal of Research
ISSN (Print): 2320-5504
ISSN (Online): 2347-4793
www.apjor.com Vol: I. Issue LVIV, January 2018
313 313 313
30. Lawson, E.O., 2011. Physico-Chemical Parameters and Heavy Metal Contents of Water from the Mangrove Swamps of Lagos
Lagoon, Lagos, Nigeria. Advances in Biological Research, 5(1), pp.8–21.
31. Madhu, N. V et al., 2007. Monsoonal impact on planktonic standing stock and abundance in a tropical estuary ( Cochin
backwaters – India ). Estuarine, Coastal and Shelf Science, 73, pp.54–64.
32. Martin, G.D. et al., 2012. Toxic Metals Enrichment in the Surficial Sediments of a Eutrophic Tropical Estuary (Cochin
Backwaters, Southwest Coast of India). The Scientific World Journal, 2012, pp.1–17. Available at:
http://www.hindawi.com/journals/tswj/2012/972839/.
33. Meera, S. & Bijoy, N.S., 2010. Water quality status and Primary productivity of Valanthakad Backwater in Kerala. Indian
Journal of Marine Sciences, 39(November 2007), pp.105–113.
34. Menon, N.N., Balchand, A.N. & Menon, N.R., 2000. Hydrobiology of the Cochin backwater system – a review. Hydrobiologia,
430, pp.149–183.
35. Mohammad, M.R. et al., 2013. Water Quality of the World’s Largest Mangrove Forest. Canadian Chemical Transactions, 1(2),
pp.141–156. Available at: http://canchemtrans.ca/uploads/journals/CCT-2013-0018.pdf.
36. Nair, P. V et al., 1975. A study on primary production in the Vembanad Lake 7(1)., Bulletin: Department of Marine Science
University Cochin.
37. Nirmal, kumar J.I. et al., 2009. Assessment of spatial and temporal fluctuations in water quality of a tropical permanent
estuarine system-Tapi, West System Coast India. Applied ecology and environmental research., 7(3), pp.267–276.
38. Nirmal Kumar, I.J. et al., 2012. Assessment of water physico-chemical characteristics and statistical evaluation of Narmada
Estuarine Region, Gujarat, India. Journal of Water and Land Development, 16, pp.43–48. Available at:
http://www.degruyter.com/view/j/jwld.2012.16.issue-1/v10025-012-0023-y/v10025-012-0023-y.xml.
39. Patrick, M. et al., 2005. The Scheldt estuary: A description of a changing ecosystem. Hydrobiologia, 540(1–3), pp.1–11.
40. Perillo, G.M.E., 1995. Chapter 2 Definitions and Geomorphologic Classifications of Estuaries. Developments in Sedimentology,
53, pp.17–47.
41. Perus, J. et al., 2004. Coastal marine zoobenthos as an ecological quality element : a test of environmental typology and the
European Water Framework Directive. Coastline Reports, 4, pp.27–38.
42. Qasim, S.Z., 2003. Indian Estuaries. Allied publication Pvt Ltd.,Heriedia Marg, Ballard Estate ,Mumbai, p.259.
43. Qasim, S.Z. & Gopinathan, C.K., 1969. Tidal cycles and the environmental features of Cochin backwater(A tropical estuary).
In proceedings of the Indian academy of sciences, Bangalore.
44. Quasim, S.Z. et al., 1969. Organic production in tropical estuary. Poceedings of Indian Academy of Science, 59, pp.51–94.
45. Ramalingam, M., Subramanian, A. & Abdul, H.M.S., 2011. Seasonal variations of physico-chemical properties of the Great
Vedaranyam Swamp, Point Calimere Wildlife Sanctuary, South-east coast of India. African Journal of Environmental Science
and Technology, 5(9), pp.673–681. Available at: http://www.ajol.info/index.php/ajest/article/view/72066.
46. Rees, G.N. et al., 2004. Ordination and significance testing of microbial community composition derived from terminal
restriction fragment length polymorphisms : application of multivariate statistics. Antonie van Leeuwenhoek, 86, pp.339–347.
47. Renjith, K.R. et al., 2004. Primary production and fishery potentials of the Panagad region in the Cochin estuarine system.
Jounal of Marine Biological Association, India, 44, pp.126–132.
48. Robert, C., Michael, K.M. & Walter, R.B., 1993. Predictability, Scale, and Biodiversity in Coastal and Estuarine Ecosystems:
Implications for Management. Ambio, 22(2), pp.88–96. Available at: http://www.jstor.org/stable/4314052.
49. Robin, R.S. et al., 2012. Assessment of Hydrogeochemical Characteristic in an Urbanized Estuary using Environmental
Techniques. Journal of Geo-sciences, 2(4), pp.81–92. Available at: http://article.sapub.org/10.5923.j.geo.20120204.03.html.
50. Sankaranarayanan, V.N. & Qasim, S.Z., 1969. Nutrients of the Cochin Backwater in relation to environmental characteristics.
Marine Biology, 2(3), pp.236–247.
51. Schmidt, A.L. et al., 2012. Regional-scale effects of eutrophication on ecosystem structure and services of seagrass beds. ,
57(5), pp.1389–1402.
52. Shivaprasad, A. et al., 2013. Seasonal stratification and property distributions in a tropical estuary (Cochin estuary, west coast,
India). Hydrology and Earth System Sciences, 17(1), pp.187–199.
53. Soman, M.K., Krishnakumar, K. & Singh, N., 1988. Decresing trend in the rainfall of Kerala. Current Science, 57, pp.7–12.
54. Sridhar, R. et al., 2006. Water quality and phytoplankton characteristics in the Palk Bay, southeast coast of India. Journal of
Environmental Biology, 27(3), pp.561–566.
55. Srinivas, K. et al., 2003. Currents in the Cochin estuarine system [southwest coast of India] during March 2000. Indian Journal
of Marine Sciences, 32(2), pp.123–132.
56. Stefan, V.D. et al., 2005. Spatial and temporal patterns of water quality along the estuarine salinity gradient of the Scheldt
estuary ( Belgium and The Netherlands): resuts of an integrated monnitoring approach. Hydrobiologia, 540, pp.29–45.
57. Strickland, J.D.. & Parsons, T.R., 1972. A practical handbook of sea water analysis. Bull. Fish. Res. Board Can. 167.,
58. Thirunavukkarasu, K. et al., 2014. Physico-Chemical Characteristics of Kottakudi and Nari Backwaters, South East of Tamil
Nadu. Journal of Earth Science & Climatic Change, 5(5). Available at: https://www.omicsonline.org/open-
access/physicochemical-characteristics-of-kottakudi-and-nari-backwaters-south-east-of-tamil-nadu-2157-
7617.1000199.php?aid=27012.
59. Vengadesh, P.N. et al., 2009. Seasonal variations of plankton diversity in the Kaduviyar estuary, Nagapattinam, southeast coast
of India. Journal of Environmental Biology, 30(6), pp.1035–1046.
60. Vitousek, P.M., 1994. Beyond global warming: Ecology and global change. Ecology, 75, pp.1861–1876.