spatial and temporal reasoning for ambient … and temporal reasoning for ambient intelligence...
TRANSCRIPT
Spatial and Temporal Reasoning for Ambient Intelligence Systems COSIT 2009 Workshop Proceedings Mehul Bhatt, Hans W. Guesgen (Eds.)
SFB/TR 8 Report No. 020-08/2009 Report Series of the Transregional Collaborative Research Center SFB/TR 8 Spatial Cognition Universität Bremen / Universität Freiburg

Contact Address: Dr. Thomas Barkowsky SFB/TR 8 Universität Bremen P.O.Box 330 440 28334 Bremen, Germany
Tel +49-421-218-64233 Fax +49-421-218-64239 [email protected] www.sfbtr8.uni-bremen.de
© 2009 SFB/TR 8 Spatial Cognition
COSIT 2009
Workshop proceedings
Spatial and Temporal Reasoningfor
Ambient Intelligence Systems
International Conference on Spatial Information TheoryAber Wrac’h, France
September 21, 2009

Space, Time and Ambient Intelligence
COSIT 2009

Organizing and Editorial CommitteeMehul BhattSFB/TR 8 Spatial CognitionUniversity of BremenP.O. Box 330 440, 28334 Bremen, GERMANY
T +49 (421) 218 64 237F +49 (421) 218 98 64 [email protected]
Hans W. GuesgenSchool of Engineering and Advanced TechnologyMassey UniversityPrivate Bag 11222, Palmerston North 4442, NEW ZEALAND
T +64 (6) 356 9099 extn 7364F +64 (6) 350 [email protected]
Advisory and Program CommitteeAbdul Sattar (Griffith University, Australia)Andre Trudel (Acadia University, Canada)Antony Galton (University of Exeter, UK)Björn Gottfried (University of Bremen, Germany)Christian Freksa (University of Bremen, Germany)Diane Cook (Washington State University, USA)Frank Dylla (University of Bremen, Germany)Jochen Renz (Australian National University, Australia)Lars Kulik (University of Melbourne, Australia)Lina Khatib (PSGS/NASA Ames Research Center, USA)
i

COSIT 2009

Invited ParticipationSmart Future Initiative, GERMANY
SIEMENS AG — Corporate Technology, Munich, GERMANY
Organizing InstitutionsSFB/TR 8 Spatial Cognition, University of Bremen and University of Freiburg(GERMANY)
Massey University (NEW ZEALAND)
Funding InstitutionSFB/TR 8 Spatial Cognition, University of Bremen and University of Freiburg(GERMANY)
ii

COSIT 2009
Contents
PrefaceMehul Bhatt and Hans Guesgen iv
Invited TalksNorbert Streitz vMichael Pirker vi
Contributions
1 Spatio-Temporal Outlier Detection in Environmental DataTao Cheng and Berk Anbaroglu 1
2 Spatio-Temporal and Context Reasoning in Smart HomesSook-Ling Chua, Stephen Marsland and Hans Guesgen 9
3 An Ontology for Qualitative Description of ImagesZoe Falomir, Ernesto Jiménez-Ruiz, Lledo Muserosand M. Teresa Escrig 21
4 Qualitative Spatial and Terminological Reasoning in theAmbient Domain
Joana Hois, Frank Dylla and Mehul Bhatt 32
5 A Continuous-based Model for the Analysis of Indoor SpacesXiang Li, Christophe Claramunt and Cyril Ray 44
iii

COSIT 2009
Preface
Welcome to the Workshop on Spatial and Temporal Reasoning for Ambient In-telligence Systems at the International Conference on Spatial Information Theory2009 in France. The workshop is a first in line of what promises to be a successfulseries of events focusing on both theoretical as well application-centered ques-tions pertaining to spatial and temporal reasoning in the domain of intelligent andsmart environments, or ambient intelligence in general.
A wide-range of application domains within the fields of ambient intelligence andubiquitous computing environments require the ability to represent and reasonabout dynamic spatial and temporal phenomena. Real world ambient intelligencesystems that monitor and interact with an environment populated by humans andother artefacts require a formal means for representing and reasoning with spatio-temporal, event and action based phenomena that are grounded to real aspects ofthe environment being modelled. A fundamental requirement within such applica-tion domains is the representation of dynamic knowledge pertaining to the spatialaspects of the environment within which an agent, system or robot is functional.At a very basic level, this translates to the need to explicitly represent and reasonabout dynamic spatial configurations or scenes and desirably, integrated reasoningabout space, actions and change. With these modelling primitives, primarily theability to perform predictive and explanatory analyzes on the basis of availablesensory data is crucial toward serving a useful intelligent function within suchenvironments.
The emerging fields of ambient intelligence and ubiquitous computing will bene-fit immensely from the vast body of representation and reasoning tools that havebeen developed in Artificial Intelligence in general, and the sub-field of Spatialand Temporal Reasoning in specific. There have already been proposals to ex-plicitly utilise qualitative spatial calculi pertaining to different spatial domains formodelling the spatial aspect of an ambient environment (e.g., smart homes and of-fices) and also to utilize a formal basis for representing and reasoning about space,change and occurrences within such environments. Through this workshop, andits successor events in the future, we aim to bring together academic and industrialperspectives on the application of artificial intelligence in general, and reasoningabout space, time and action in specific, for the domain of smart and intelligentenvironments.
Mehul BhattHans Guesgen(Workshop Co-Chairs)
iv

COSIT 2009
Invited Talk
Designing Information, Communication, and Experiences in Ubiquitous Hy-brid Worlds
"It seems like a paradox but it will soon become reality: The rate at which com-puters disappear will be matched by the rate at which information technology willincreasingly permeate our environment and our lives". This statement by Streitz &Nixon illustrates that new challenges for designing the interaction of humans withcomputers embedded in everyday objects will arise. While disappearance is a ma-jor aspect, "smart" artefacts are also characterized by sensors collecting data aboutthe environment, the devices and humans acting in this context in order to provideambient intelligence-based support. The resulting issues are discussed based onthe distinction between "system-oriented, importunate smartness", implying moreor less automatic behaviour of smart environments, and "people-oriented, em-powering smartness", where the empowering function is in the foreground. Thelatter approach can be summarized as "smart spaces make people smarter" whichis achieved by keeping "the human in the loop" and empowering people to be incontrol, making informed decisions and taking actions. Whatever type of smart-ness will be employed, representations of people, content and contexts play acentral role. Last but not least, privacy issues in sensor-based smart environmentsare being discussed ranging from being a legal and moral right to becoming acommodity and privilege. The approaches and concepts will be illustrated withexamples taken from different research projects ranging from smart rooms overcooperative buildings to hybrid cities.
Norbert StreitzSenior Scientist and Strategic AdvisorSmart Future Initiative (previously Fraunhofer-IPSI)GERMANY
v

COSIT 2009
Invited Talk
Spatial and Temporal Modeling for AmI Systems: Industrial Applications
The talk presents two ongoing research projects at Siemens Corporate Researchand Technology in the domain of Ambient Assisted Living (AAL) and PublicSurveillance. One key feature in both domains is the ability to detect and identifyspecific behavioral patterns of persons. While AAL applications mainly focus onproviding assistance functionalty to the user, Public Surveillance applications aimat detecting (and possibly preventing) potentially dangerous situations. To this endadequate models (e.g. of human behavior or processes) have to be constructed,taking into account spatial context and temporal dependencies. These models canbe evaluated using standard approaches such as DL-reasoning, whereas alternativemethods (e.g. graph-based spatial reasoning, or abductive reasoning) may turn outto be more flexible and performant.
Michael PirkerCorporate TechnologySIEMENS AG, MunichGERMANY
vi

COSIT 2009
Spatio-Temporal Outlier Detection in Environmental Data
Tao Cheng Berk Anbaroğlu
Department of Civil, Environmental and Geomatic Engineering University College London
Gower Street, WC1E 6BT London United Kingdom
{tao.cheng, b.anbaroglu}@ucl.ac.uk
Abstract. Spatio-temporal outliers are occurrences that can reveal significant information about the phenomena under investigation. They are detected after comparing their non-spatial attributes with their spatio-temporal neighbours. One of the important definitions that need to be made is the spatio-temporal neighbourhood of an instance. There can be no universally applicable definition of the spatio-temporal neighbourhood (STN), but rather the definition should be based on empirical results in order to improve the quality of the decision making related to the spatial phenomena. Here we address this issue by defining STNs using Space-Time Autoregressive Integrated Moving Average (STARIMA). The method is illustrated using spatio-temporal outlier detection in Chinese annual temperature data.
Keywords: Spatio-temporal outlier, spatio-temporal neighorhood, STARIMA
1 Introduction
Massive data with both spatial and temporal dimensions are collected with increasing use of sensors so that data mining on this complex data structure is gaining popularity. Spatio-temporal outlier (STO) is an instance whose non-spatial attribute is significantly different from its spatio-temporal neighbourhood (STN). Their occurrences can reveal significant information about the phenomena under investigation. For example, all distinct natural events can be regarded as STOs such as big forest fires, earthquakes and volcanic activities, traffic accidents, hurricanes and floods. To have a better understanding or for better modelling of the spatial phenomena, STOs should be detected.
Most of the general outlier detection algorithms can be adapted to spatio-temporal domain but bearing one thing in mind: STOs are not global but local, in terms of their spatio-temporal neighbourhoods (STNs). This locality arises because of the spatial and temporal correlation, which need to be taken into account to when dealing with spatio-temporal phenomena.
COSIT 2009COSIT 2009
1
STO detection can be examined under distance, wavelet analysis, clustering, visualization and graph based approaches.
Distance based outlier detection find outliers based on distances between instances. Adam et. al. [1] constructed spatial neighbourhood using Voronoi polygons and semantic neighbourhood using similarity coefficients, which were considered as STNs of an instance. However, temporal neighbourhood of an instance had not been involved in the definition of STN. Furthermore, predefined parameters as threshold values to define semantic similarity are intuitive. Similarly, Yuxiang et. al. [3] used descriptive statistics to detect spatial and temporal outliers separately. They also defined spatial neighbourhood intuitively and spatial and temporal dimensions were not considered as a whole.
Wavelet analysis based methods use wavelet transformation to detect STOs, which are considered as instances having high wavelet power. If the wavelet value of an instance exceeds a threshold, then that instance is regarded as a suspicious outlier. Barua and Alhajj [2] used wavelet transformation to detect outliers in sea surface temperature. However, it was not mentioned on choosing the threshold value. Since temporal dimension was not considered, only spatial outliers were found. Lu and Liang [4] detected spatial outliers in meteorological streaming data by using wavelet transform to latitudes of the data so that suspicious spatial outliers could be detected. Then, competitive fuzzy edge detector was used to find the boundary of the outlier region. Finally, center of the outlier region was found by fuzzy weighted average and tracked in the streaming data. They found spatial outlier trend rather than combining space-time to detect STOs.
Clustering approach detects STOs as instances which are not lying in any cluster. Birant and Kut [5] detected STOs by a three step procedure. First a clustering algorithm is applied (i.e. DBSCAN [12]) to detect possible spatial outliers as the instances which are not clustered. Second, possible spatial outliers are validated using statistical measures. Third, verified spatial outliers were checked in time. If the spatial outlier is different from its temporal neighbourhood, which is defined as consecutive time units, it is validated as STO. However, how to construct the spatial neighbourhood for statistical analysis in step two is not very clear in their approach. Cheng and Li [6] proposed a four step method for detecting STOs which is very similar but classification was conducted to form regions that have semantic meaning at different resolutions. In their approach, last step was achieved (i.e. comparison of the height values of possible outliers in consecutive time frames) based upon visual checking and simple calculation. In addition, both spatial and temporal neighbourhood definitions are made intuitively.
Visualization based methods mostly rely on visualization and also statistical analysis. Jin et. al. [8] detected real time traffic incidents using incrementally learning ability which considers user feedbacks. They generated spatial-temporal traffic models for each day-of-week using historical data based on occupancy of road. STOs were detected by comparing real time traffic data and with the models and if the difference was greater than a threshold an alarm was triggered. Alarm triggering in consecutive time frames indicates a high possibility of an incident. However, more
2

generic approach for spatial neighbourhood should be derived, since in their case study all sensors are lined up along one freeway.
Graph based STO detection methods rely on graph theory and mostly represents the data in a graph. Li et. al. [7] detected temporal outliers in traffic data where spatial adjacencies were not taken into account. Road network was represented as a directed graph where vertices represent street intersections and edges represent road segments. Updating the temporal neighbourhood vector was based on the idea that: if two edges are historically similar in terms of feature values then current dissimilarity will be noted much and vice versa. In other words, big rewards and penalties come from previously stable trends. Main limitation of their research is that it did not consider the spatial nature of the data. Also, selecting the required parameters was done intuitively without giving any description on how to choose them. Kou et. al [9] proposed two graph-based spatial outlier detection algorithms. Edges represent the distance between two instances and nodes represent the instances. First algorithm detects point outliers by cutting the highest value edges (i.e. most distant instances) of the graph until user defined m outliers were found, where an outlier is defined as an node which has no edges connected to it. Proposed approach identifies outliers in order so that outliers were ranked. Most probable outlier will be detected first. Second algorithm detects region outliers by investigating the similarity between the possible outlier region and in its neighbours and also similarity in the region itself. But in many cases it cannot be known how many outliers the population have and also forcing each object to have “k neighbours” may mislead.
Most of the researches discussed above either did not consider spatial or temporal dimension of the data or did not use experimental findings when defining STN. This paper is motivated from this common judgment about defining the STNs. In order to capture the real information and to make more reliable decisions, STNs of an instance should be defined based on explanatory analysis. In this research, STN is defined by STARIMA and outliers are detected using statistical analysis.
Outline of the paper is as follows: next section explains how to derive the STN based on STARIMA. Third section discusses the proposed methodology for detecting STOs and explains the case study and fourth section concludes the paper with future work.
2 Deriving Space-Time Neighbourhoods (STN)
2.1 Definition of STO
STO is an instance whose non-spatio-temporal attribute value is significantly different from than its spatio-temporal neighbourhood (STN). This section will discuss on STN derivation, next section will discuss what is meant by “significantly different”.
Figure 1 shows an example of grid data, where attribute values of each grid square can be either ‘x’ or ‘o’. Centre grid is detected as spatial outlier in both Figure 1a and 1b. However, spatial outlier is validated as a STO only in Figure 1a, since it is also different from its temporal neighbours. In Figure 1b there is a spatial outlier trend
3
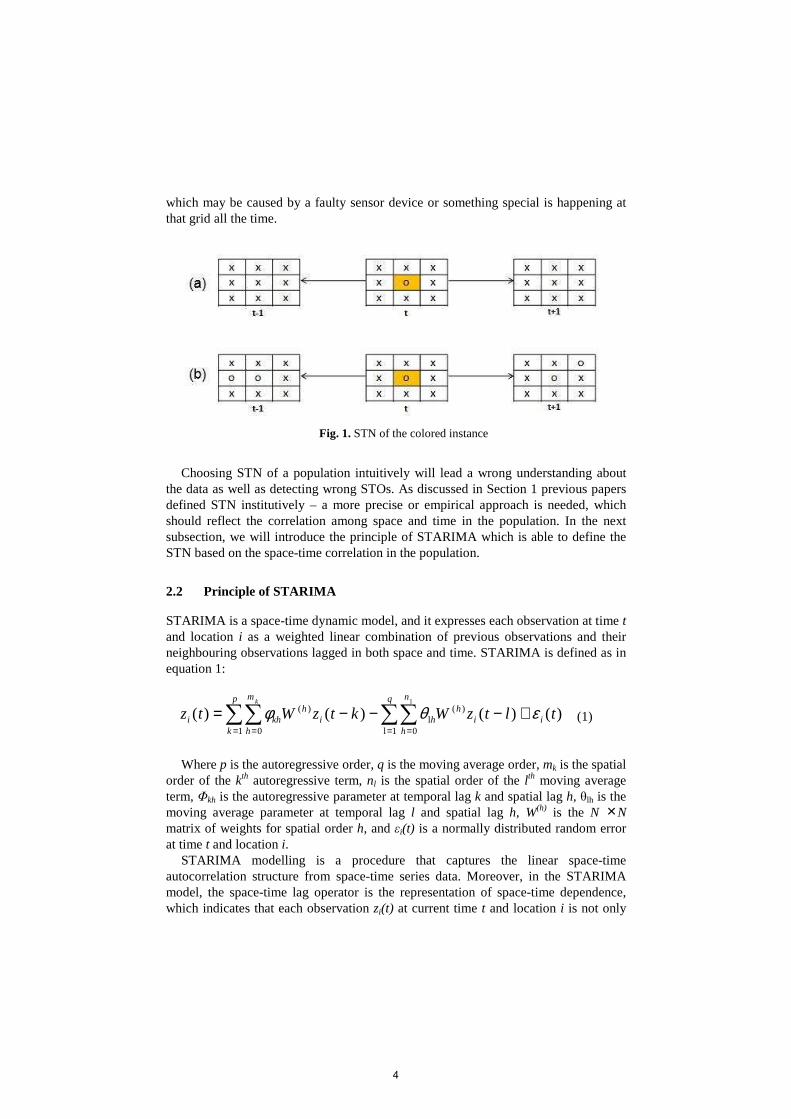
which may be caused by a faulty sensor device or something special is happening at that grid all the time.
Fig. 1. STN of the colored instance
Choosing STN of a population intuitively will lead a wrong understanding about
the data as well as detecting wrong STOs. As discussed in Section 1 previous papers defined STN institutively – a more precise or empirical approach is needed, which should reflect the correlation among space and time in the population. In the next subsection, we will introduce the principle of STARIMA which is able to define the STN based on the space-time correlation in the population.
2.2 Principle of STARIMA
STARIMA is a space-time dynamic model, and it expresses each observation at time t and location i as a weighted linear combination of previous observations and their neighbouring observations lagged in both space and time. STARIMA is defined as in equation 1:
(1)
Where p is the autoregressive order, q is the moving average order, mk is the spatial
order of the kth autoregressive term, nl is the spatial order of the lth moving average term, Φkh is the autoregressive parameter at temporal lag k and spatial lag h, θlh is the moving average parameter at temporal lag l and spatial lag h, W(h) is the N × N matrix of weights for spatial order h, and εi(t) is a normally distributed random error at time t and location i.
STARIMA modelling is a procedure that captures the linear space-time autocorrelation structure from space-time series data. Moreover, in the STARIMA model, the space-time lag operator is the representation of space-time dependence, which indicates that each observation zi(t) at current time t and location i is not only
∑ ∑∑∑= = ==
+−−−=p
k
q n
hii
hhi
m
h
hkhi tltzWktzWtz
k
1 1l 0
)(l
0
)(l
)()()()( εθφ
4

influenced by the previous time series at the location, but also impacted by the previous time series of its spatial neighbours [14].
The space-time dependence is measured by the space-time autocorrelation function (ST-ACF) and space-time partial autocorrelation function (ST-PACF). From the calculation of ST-ACF and ST-PACF, we are able to define the time lag (temporal neighbour) and the space lag (spatial neighbour at particular time lag).
2.3 Defining STN based upon space-time lags
The autoregressive order p and the moving average order q of the STARIMA model are chosen provisionally after an examination of the space-time autocorrelation (ST-ACF) and space-time partial autocorrelation functions (ST-PACF)
In the conventional STARIMA model, the spatial hierarchical orders are defined in discrete-space data, and equal weights are assumed for the hth order neighbours in the spatial weight matrix [10, 13]. However, the space-time series of environmental data usually have three special features: 1) nonlinear and nonstationary spatial trends, 2) stronger spatial correlation, and 3) anisotropic spatial distributions of the raw data sets. Definition of the spatial hierarchical orders and equal weights will result in 1) the computational costs of ST-ACF and ST-PACF becoming enormous; and 2) space-lag order mk or nl
at each time-lag of the STARIMA model being difficult to decide. To simplify the calculation of the ST-ACF and ST-PACF, semivariogram scaled weights are chosen to measure the spatial variance in the space-time series of environmental data. Semivariogram-based analysis is able to evaluate spatial and temporal variations, and it can determine the magnitude of spatial dependence and the range of spatial autocorrelation among data. The instances within the range are spatially autocorrelated, whereas instances outside the range are considered independent. In other words, the instances within the range can be considered as spatial neighbours.
3 STO Detection for Space-Time Series
Three steps are proposed in order to detect STOs. First step is to define the time-lag based upon ST-ACF and ST-PACF, and space-lag based upon semivariogram, which define the range of STN. Then possible STOs are identified based on time series analysis of observations at individual instances. The third step is to define the STNs of the possible outliers and validate them based on statistical analysis. We illustrate these three steps in Chinese annual temperature data.
3.1 Data
Data used is the annual average temperature (degree/year) of China. Data is gathered from 193 stations which have 52 year observations from 1951 to 2002. The stations which have more missing than observed values are not considered in the following analysis. There were still missing values in the remaining 137 stations and are not
5
interpolated to have more realistic results. More detailed explanation about the data may be found in [11].
First spatial neighbourhood was determined as 1550km by using isotropic semivariogram model. Second by using space-time autocorrelation and partial autocorrelation functions of STARIMA, space lag is determined as 1 and temporal lag is determined as 2. Thus, STN of an instance covers two previous year observations of the instances whose distance with other instances’ distance is less than 1550km.
3.2 Time Series Analysis
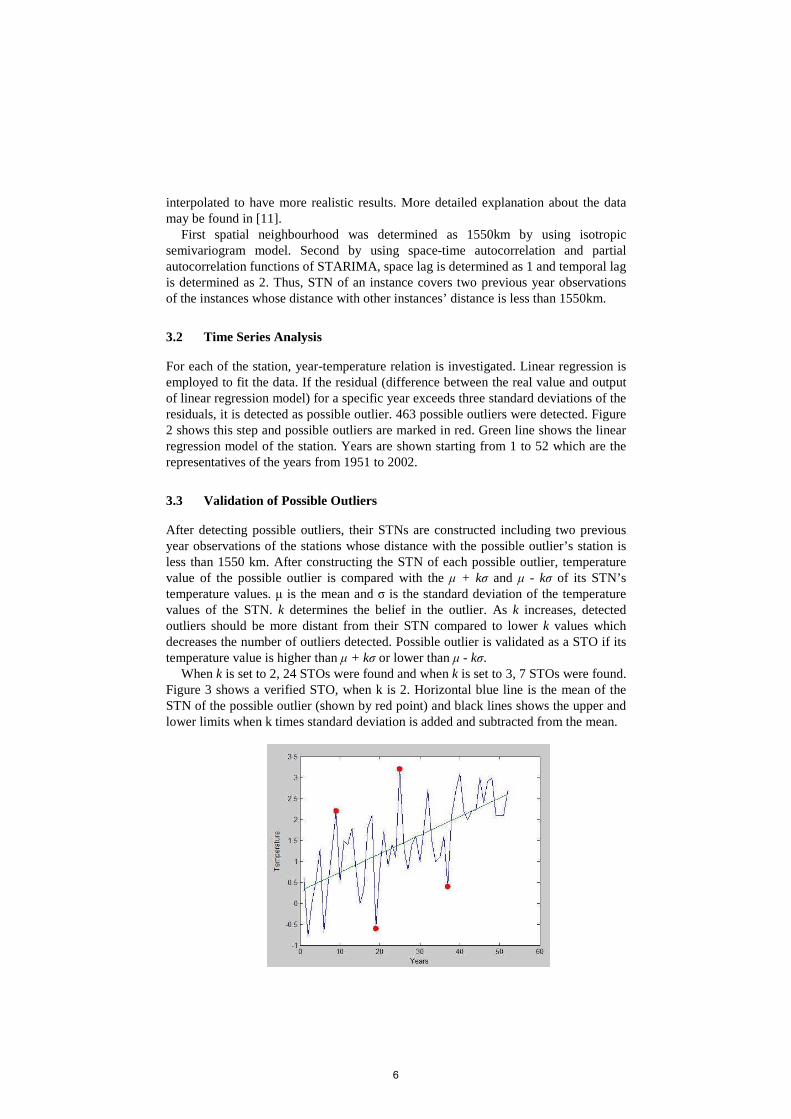
For each of the station, year-temperature relation is investigated. Linear regression is employed to fit the data. If the residual (difference between the real value and output of linear regression model) for a specific year exceeds three standard deviations of the residuals, it is detected as possible outlier. 463 possible outliers were detected. Figure 2 shows this step and possible outliers are marked in red. Green line shows the linear regression model of the station. Years are shown starting from 1 to 52 which are the representatives of the years from 1951 to 2002.
3.3 Validation of Possible Outliers
After detecting possible outliers, their STNs are constructed including two previous year observations of the stations whose distance with the possible outlier’s station is less than 1550 km. After constructing the STN of each possible outlier, temperature value of the possible outlier is compared with the µ + kσ and µ - kσ of its STN’s temperature values. µ is the mean and σ is the standard deviation of the temperature values of the STN. k determines the belief in the outlier. As k increases, detected outliers should be more distant from their STN compared to lower k values which decreases the number of outliers detected. Possible outlier is validated as a STO if its temperature value is higher than µ + kσ or lower than µ - kσ.
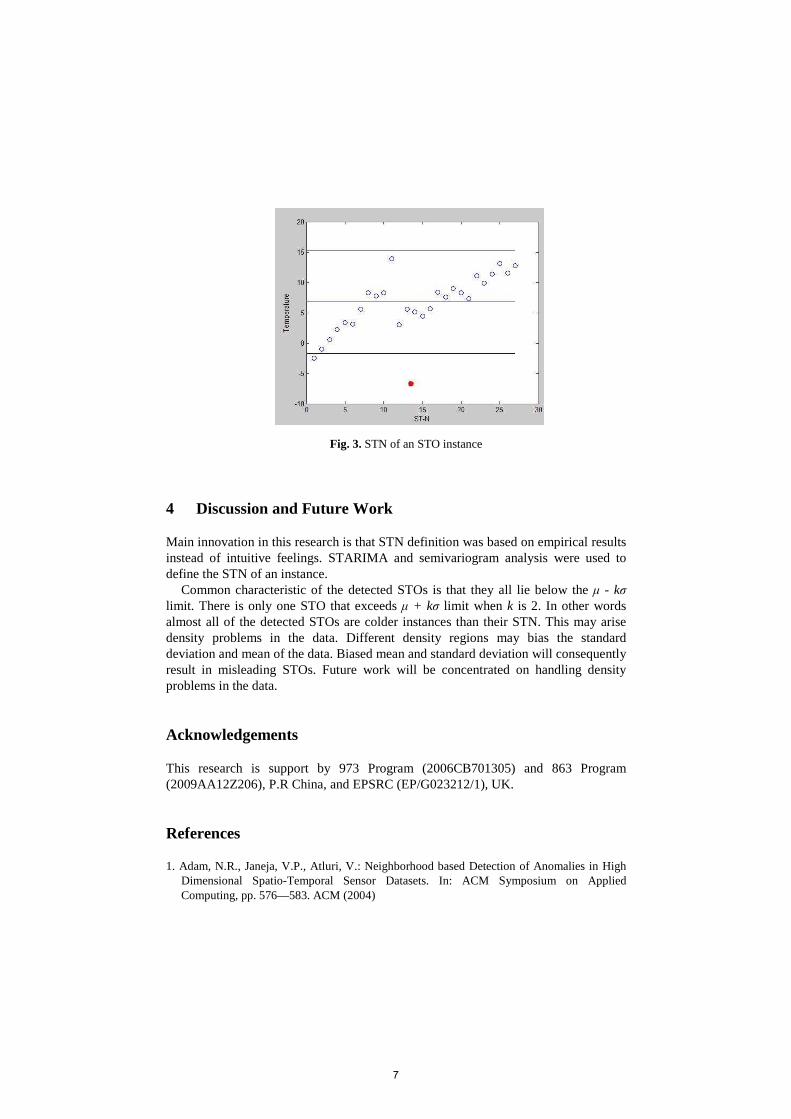
When k is set to 2, 24 STOs were found and when k is set to 3, 7 STOs were found. Figure 3 shows a verified STO, when k is 2. Horizontal blue line is the mean of the STN of the possible outlier (shown by red point) and black lines shows the upper and lower limits when k times standard deviation is added and subtracted from the mean.
Fig. 2. Detection of possible outliers
6
4 Discussion and Future Work
Main innovation in this research is that STN definition was based on empirical results instead of intuitive feelings. STARIMA and semivariogram analysis were used to define the STN of an instance.
Common characteristic of the detected STOs is that they all lie below the µ - kσ limit. There is only one STO that exceeds µ + kσ limit when k is 2. In other words almost all of the detected STOs are colder instances than their STN. This may arise density problems in the data. Different density regions may bias the standard deviation and mean of the data. Biased mean and standard deviation will consequently result in misleading STOs. Future work will be concentrated on handling density problems in the data.
Acknowledgements
This research is support by 973 Program (2006CB701305) and 863 Program (2009AA12Z206), P.R China, and EPSRC (EP/G023212/1), UK.
References
1. Adam, N.R., Janeja, V.P., Atluri, V.: Neighborhood based Detection of Anomalies in High Dimensional Spatio-Temporal Sensor Datasets. In: ACM Symposium on Applied Computing, pp. 576—583. ACM (2004)
Fig. 3. STN of an STO instance
7

2. Barua, S., Alhajj, R.: Parallel Wavelet Transform for Spatio-Temporal Outlier Detection in Large Meteorological Data. In: Intelligent Data Engineering and Automated Learning – IDEAL 2007, vol. 4881, pp. 684—694. Springer, Heidelberg (2007)
3. Yuxiang, S., Kunqing, X., Xiujun M., Xingxing. J., Wen. P., Xiaoping G.: Detecting Spatio-Temporal Outliers in Climate Dataset: A Method Study. In: Geoscience and Remote Sensing Symposium, vol.2, pp.760—763. IEEE (2005)
4. Lu, C.Y., Liang, L.R.: Wavelet Fuzzy Classification for Detecting and Tracking Region Outliers in Meteorological Data. In: Proceedings of the 12th annual ACM international workshop on Geographic information systems, pp. 258—265, ACM (2004)
5. Birant, D., Kut, A.: Spatio-Temporal Outlier Detection in Large Databases. In: 28th International Conference Information Technology Interfaces, pp. 179—184. IEEE (2006)
6. Cheng, T., Li, Z.:A Multiscale Approach to Detect Spatial-Temporal Outliers. In: Transactions in GIS, vol. 10, pp. 253—263, Blackwell Publishing (2006)
7. Li, X., Li, Z., Han, J., Lee, J.G.: Temporal Outlier Detection in Vehicle Traffic Data. In: Proceeding of International Conference on Data Engineering (2009)
8. Jin, Y., Dai, J., Lu, C.T.: Spatial-Temporal Data Mining in Traffic Incident Detection. In: SIAM Conference in Data Mining (2006)
9. Kou, Y., Lu, C.T., Santos Jr., R.F.D.: Spatial Outlier Detection: A Graph-based Approach. In: 19th IEEE International Conference on Tools with Artificial Intelligence, pp. 281—288. IEEE (2007)
10. Pfeifer, P.E., Deutsch, S.J.: A Three-Stage Iterative Procedure for Space-Time Modeling. In: Technometrics, vol 22, pp. 35—47. ASA (1980)
11. Cheng, T., Wang, J.Q., Li, X., Zhang, W.: A Hybrid Approach to Model Nonstationary Space-Time Series. In: The International Archives of the Photogrammetry, Remote Sensing and Spatial Information Sciences, vol. XXXVII, pp. 195—202, ISPRS (2008)
12. Ester, M., Kriegel, H.P., Sander, J., Xu X.: A Density-Based Algorithm for Discovering Clusters in Large Spatial Databases with Noise. In: Proceedings of the Second International Conference on Knowledge Discovery and Data Mining (KDD-96), pp. 226-231, AAAI Press (1996)
13. Martin, R. L., Oeppen, J. E.: The Identification of Regional Forecasting Models Using Space-Time Correlation Functions. In: Transactions of the Institute of British Geographers, vol 66, pp. 95- 118, (1975)
14. Box, G. E.P., Jenkins, G.M., Reinsel G.C.: Time Series Analysis: Forecasting and Control. Prentice-Hall (1994)
8
Spatio-Temporal and Context Reasoning inSmart Homes
Sook-Ling Chua, Stephen Marsland, and Hans W. Guesgen
School of Engineering and Advanced Technology, Massey UniversityPalmerston North, New Zealand
{s.l.chua,s.r.marsland,h.w.guesgen}@massey.ac.nz
http://muse.massey.ac.nz/
Abstract. Ambient intelligence has a wide range of applications, includ-ing smart homes. Smart homes can support their inhabitants in a varietyof ways: monitoring for potential security risks, adapting the home toenvironmental conditions, reminding the inhabitant of tasks to be per-formed (e.g. taking medication), and many more. This often requires theambient intelligence to recognise the behaviour of the inhabitants, whichcan be done more effectively if spatial, temporal, and contextual knowl-edge is taken into consideration. For example, cooking in the evening ispretty normal, but it is unusual if somebody has been cooking only anhour previously. However, if we know the context of the current situation,we may be able to explain this anomaly: having a party in the house mayrequire several dishes to be cooked over a short interval. In this paper,we discuss spatio-temporal and context-based reasoning in smart homesand some methods by which it may be achieved.
Key words: Spatio-temporal reasoning, context-awareness, smart home,behaviour recognition, activity segmentation
1 Motivation
It is well-known that we are facing a demographic change towards an agingpopulation. In Europe, for instance, it was reported that the number of peopleaged 65 and over is projected to increase from 10% of the total population in1950 to more than 25% in 2050. In New Zealand, the number of people over 65has doubled between 1970 and 2005 [2]. Furthermore, the global life expectancyat birth is projected to increase from 58 years in 1970–1975 to 75 years in 2045–2050 [3]. The group of elderly (aged 65 years and above) is the fastest growingsegment of the world population.
Aging often results in some degree of physical disability, and even when theelderly are physically healthy, the aging process can be accompanied by cog-nitive impairment such as diminished sense and touch, slower ability to react,physical weakness, and memory problems. It is impossible to rely solely on in-creasing the number of caregivers, since even now it is difficult and expensiveto find care. Additionally, many people are choosing to stay in their own homes
COSIT 2009COSIT 2009
9
2 Sook-Ling Chua, Stephen Marsland and Hans W. Guesgen
as long as possible, and hope to remain independent. In order for them to re-main autonomous, they need to perform the basic self-help tasks also known asthe ‘Activities of Daily Living (ADLs)’ that include bathing, dressing, toileting,eating, and so on [1]. This has lead to a large number of monitoring systemsalso known as ‘smart homes’, or ‘ambient intelligence systems’ that consist of anetwork of sensors connected to household appliances, with the aim of assistingin the activities of daily living, either directly through involvement with the per-son, or by alerting carers when a problem arises. Examples of such smart homeprojects include the Adaptive Home [5], iDorm [6], MavHome [7], PlaceLab [4],Georgia Tech Aware Home [8], and Gator Tech Smart House [9].
For a smart home to react intelligently to its inhabitant’s needs, the systemneeds to recognise their behaviour and to use spatio-temporal information, suchas where (in which room?) and when (at what time) did a particular event occur?Additionally, and possibly more importantly, the contextual information (howwas the current situation reached? what else is happening? what is the state ofthe environment?) needs to be considered.
Although, to some extent, the location of the sensors is known a priori fromthe sequence of sensor observations, it is not enough to allow effective reasoning.Using the example from [12], it would be unusual for somebody to walk aroundin a triangle repeatedly in the living room from the sofa to the window and thento the television. But it makes sense if that person is walking around a trianglerepeatedly between fridge, cabinet and stove in the kitchen. And even in thekitchen, this behaviour would be unusual if it occurs in the middle of the night.One issue with both spatial and temporal resolution is that the scale on whichit is measured can change the analysis. For example, an event can happen oncea year (birthday, Christmas, etc.), weekly (visit from a health worker), daily(showering), or repeatedly during the day (phone calls). If the birthday wasbeing celebrated every day then this would be something that the smart homeshould recognise as unusual. However, the temporal resolution may have to beeven finer to recognise many potentially dangerous events (e.g., microwave ovenused for too long).
Besides spatio-temporal information, context awareness also play an impor-tant role in interpreting behaviour, and should not be treated independently.For example, it is normal for a person to take an afternoon tea in the garden(spatial) if it is summer and it occurs during the day (temporal). The contextinformation could include details such as whether the cup is filled with tea, orwhether the person is standing, squatting, or sitting in the garden, as well aswhat they were doing earlier in the day and who else is around. For example,it may be normal for a person to boil water in the middle of the night if theweather is cold, and the person has just finished watching a movie. If we knowthe context of the situation, we can reason that the person was in the livingroom and then goes to the kitchen (spatial), and since it is Saturday (temporal),the person stays up longer.
The above examples clearly show that space, time and context all play animportant role in behaviour recognition. Representing all of this information
10
Spatio-Temporal and Context Reasoning in Smart Homes 3
in the smart environment is a significant challenge. This paper discusses theimportance of spatio-temporal and context awareness, and how to representthem in behaviour recognition, the first part of the smart home problem.
2 Behaviour Recognition
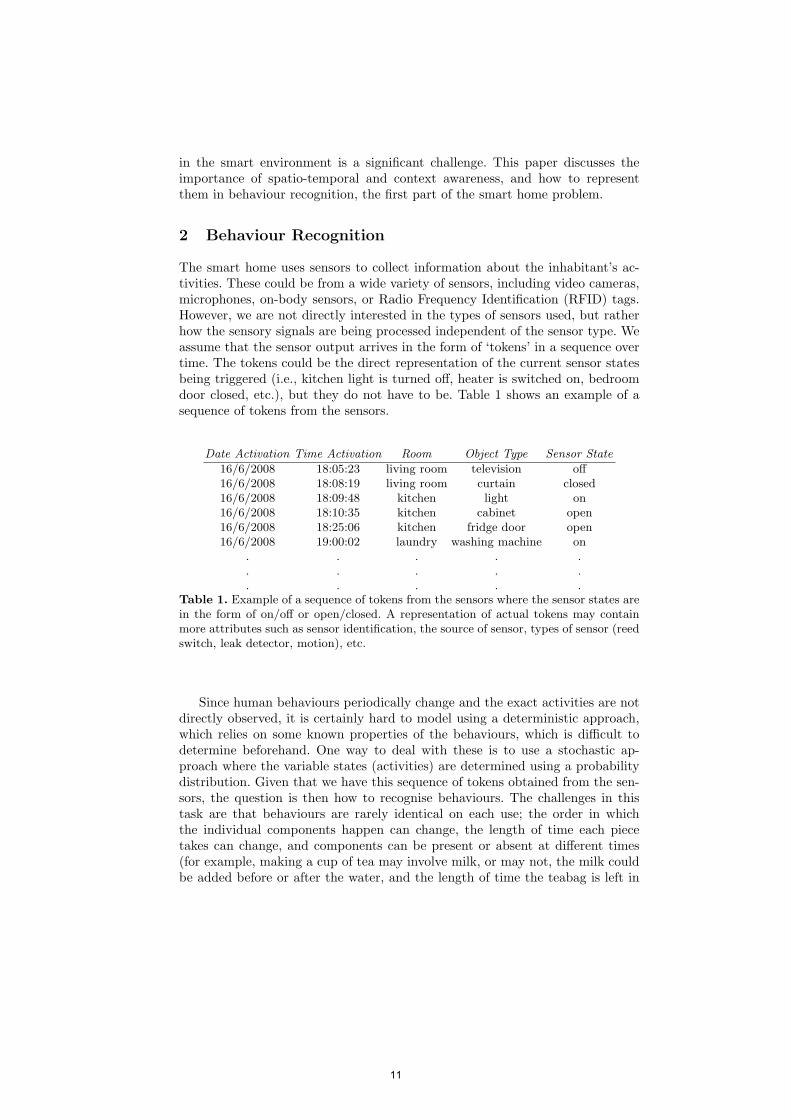
The smart home uses sensors to collect information about the inhabitant’s ac-tivities. These could be from a wide variety of sensors, including video cameras,microphones, on-body sensors, or Radio Frequency Identification (RFID) tags.However, we are not directly interested in the types of sensors used, but ratherhow the sensory signals are being processed independent of the sensor type. Weassume that the sensor output arrives in the form of ‘tokens’ in a sequence overtime. The tokens could be the direct representation of the current sensor statesbeing triggered (i.e., kitchen light is turned off, heater is switched on, bedroomdoor closed, etc.), but they do not have to be. Table 1 shows an example of asequence of tokens from the sensors.
Date Activation Time Activation Room Object Type Sensor State
16/6/2008 18:05:23 living room television off16/6/2008 18:08:19 living room curtain closed16/6/2008 18:09:48 kitchen light on16/6/2008 18:10:35 kitchen cabinet open16/6/2008 18:25:06 kitchen fridge door open16/6/2008 19:00:02 laundry washing machine on
. . . . .
. . . . .
. . . . .Table 1. Example of a sequence of tokens from the sensors where the sensor states arein the form of on/off or open/closed. A representation of actual tokens may containmore attributes such as sensor identification, the source of sensor, types of sensor (reedswitch, leak detector, motion), etc.
Since human behaviours periodically change and the exact activities are notdirectly observed, it is certainly hard to model using a deterministic approach,which relies on some known properties of the behaviours, which is difficult todetermine beforehand. One way to deal with these is to use a stochastic ap-proach where the variable states (activities) are determined using a probabilitydistribution. Given that we have this sequence of tokens obtained from the sen-sors, the question is then how to recognise behaviours. The challenges in thistask are that behaviours are rarely identical on each use; the order in whichthe individual components happen can change, the length of time each piecetakes can change, and components can be present or absent at different times(for example, making a cup of tea may involve milk, or may not, the milk couldbe added before or after the water, and the length of time the teabag is left in
11

4 Sook-Ling Chua, Stephen Marsland and Hans W. Guesgen
the cup can vary). Adding in the fact that the exact activities are not directlyobserved and that sensor observations are themselves intrinsically noisy, it is nosurprise that Hidden Markov Models (HMMs), and variants of them, have beenthe most popular method of recognising behaviours [17–19].
The HMM is a probabilistic graphical model that uses a set of hidden (un-known) states to classify a sequence of observations over time. For example,the sensor observations could be that the bathroom fan is on and the water isrunning where the possible state could be that someone is taking a shower. Bylinking all these sequences of sensor observations over time into activities, it canhelp to recognise behaviours. Fig. 1 shows a simple representation of a HMMwhere the nodes represent the variables and the edges represent the conditionaldependencies between the nodes. Further details on HMMs can be found in [10,11].
Fig. 1. The graphical representation of a Hidden Markov Model. The nodes representthe variables (top line is the hidden states, and bottom line is the observations). Theedges (arrows) represent the conditional dependencies: solid lines represent the con-ditional dependencies between states, P (St|St−1) i.e. the probability of transition toa state St, which depends only on the current state St−1, and dashed lines representthe conditional dependencies of the observation on the hidden states, P (Ot|St) i.e. theobservation at Ot depends only on the hidden state St at that time slice.
In order to use HMMs, there are a few problems that have to be solved. Oneis to break the token sequence into appropriate pieces that represent individualbehaviours (i.e., segmentation), and another is to classify the behaviours usingthe HMM. In previous work [16] we have proposed a method of automatic seg-mentation of the token stream, based on competition between a set of trainedHMMs. In this paper, we propose methods by which this can be augmented withspatial, temporal, and contextual information in order to improve the classifica-tion accuracy. We do not cover the problem of training the individual HMMs;at present we use hand-labelled data to do this, although we plan to identify abetter approach in future work.
Although many methods have been proposed to label inhabitant’s activities,these approaches relied heavily on hand-labelled and manual segmentation, bothwhich are time-consuming and error-prone. Some works even progressed towardsusing the sliding window technique to partition the input sensory stream butthey do rely on a fixed window length, which results the segmentation beingbiased towards the size of window used [13, 14]. To address this, an initial studyhas been conducted that uses a set of Hidden Markov Models (HMMs) with
12
Spatio-Temporal and Context Reasoning in Smart Homes 5
each HMM recognises different behaviours and compete among themselves toexplain the current sensor observations. We will discuss how we can furtherincorporate the spatio-temporal and context information to the existing model.Before discussing this further, we demonstrate that such a system is capable ofidentifying human behaviours from a real smart home.
2.1 Experiment: Behaviour Recognition using HMMs
This experiment was conducted to perform behaviour recognition and segmen-tation so that behaviours can be individually segmented based on competitionbetween trained HMMs. Given a set of HMMs trained on different behaviours,we present data from the sensory stream to all of the HMMs, which each com-putes the likelihood of the sequence of activities according to the model of eachbehaviour. We posit that a typical behaviour is a sequence of activities thatoccur close to one another in time, in one location. While this is not alwaystrue, for now we are focussing on these types of behaviour, which includes ac-tivities such as cooking and preparing beverages. It is interesting to note thatit would not necessarily include common activities such as laundry, which maywell be separated in time (while waiting for the washer to finish) and in space(for example, if clothes are hung outside rather than using a dryer).
In order to demonstrate our algorithm, we took a dataset from the MITPlaceLab [4]. They designed a system based on a set of simply installed state-change sensors that were placed in two different apartments with real peopleliving in them. The subjects kept a record of their activities that form a set ofannotations for the data, meaning that there is a ‘ground-truth’ segmentationof the dataset. We trained the HMMs using this hand-segmented and labelleddata. While this is a simplification of the overall aims of the project, it enablesus to evaluate the method properly.
We assume for now that activities take place in one room, and that thelocation of the sensors is known a priori. For this reason, we concentrated onjust one room, namely the kitchen, which contained more behaviours than anyother room. The behaviours that were originally labelled in the kitchen were(i) prepare breakfast, (ii) prepare beverage, (iii) prepare lunch, and (iv) do thelaundry. We split behaviour (i) into two different ones: prepare toast and preparecereal. This made two relatively similar behaviours.
We partitioned the data into a training set consisting of the first few days,followed by a test set consisting of the remainder. The HMMs were each trainedon the relevant labelled data in the training set using the standard Expectation-Maximization (EM) algorithm [10]. The data that is presented to the five trainedHMMs is chosen from the sensor stream using a Parzen window that moves overthe sequence. The choice of the size of this window is important, because it isunlikely that all of the activities in the sequence belong to one behaviour, and sothe HMM chosen to represent it will, at best, represent only some of the activitiesin the sequence. Rather than using a fixed window length, we proposed a variablewindow length that moves over the sequence of observations. We do not discussthe details on how our algorithm self-determines the Parzen window size (see [16]
13
6 Sook-Ling Chua, Stephen Marsland and Hans W. Guesgen
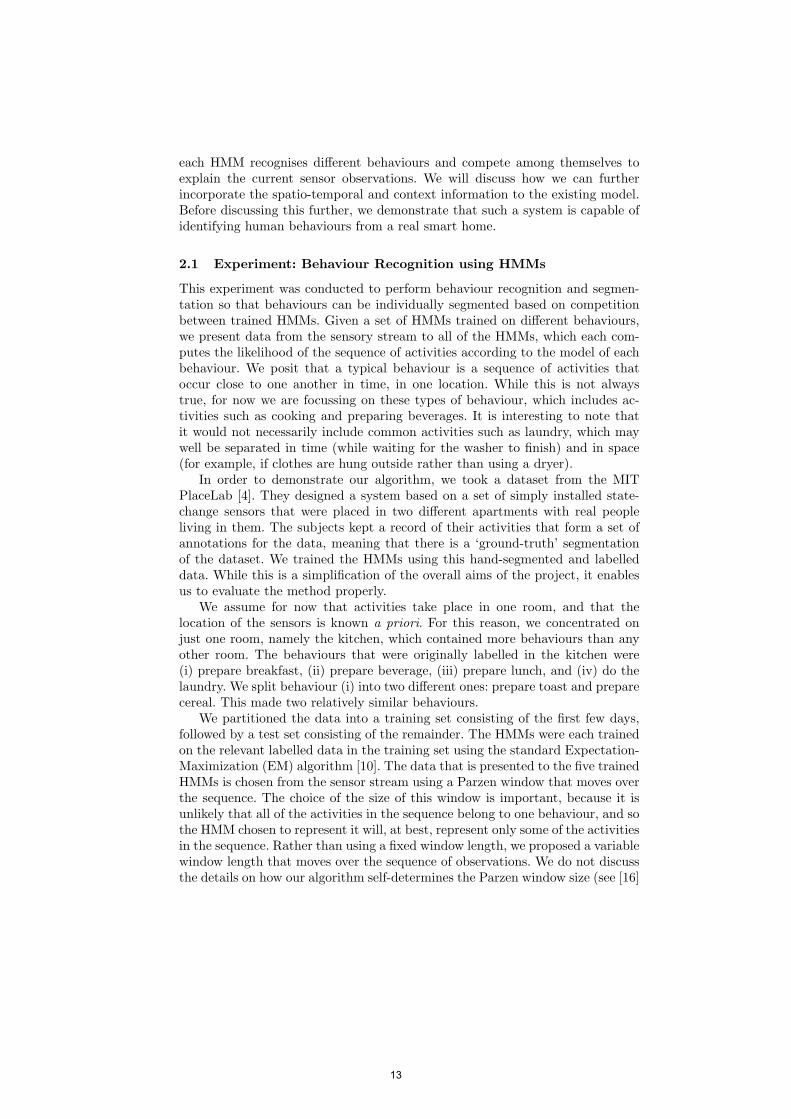
for further details), but focus on how effective our algorithm is at recognisingbehaviours based on the competition among HMMs in that particular room inthe house. To simplify this experiment, we use a Parzen window of size 10.
The results of sliding a Parzen window of size 10 over the data consistingof 727 sensor observations is shown in Fig. 2, which displays the outputs of thealgorithm, with the winning behaviour at each time being clearly visible. Thewinning behaviour is classified when the α = 1. As the figure shows, we candetermine that the subject is doing laundry at observation 150 since α = 1 atthat observation (see first graph in Fig. 2). The classification accuracy of thisexperiment was high enough (over 90% accuracy) to encourage us to look further.
Fig. 2. Illustration of competition between HMMs based on a testing set of 727 obser-vations
2.2 Results
The experimental results show that the method works effectively to detectchanges of activities based on relatively small amount of training data. As themodel is relatively simple and based on recursive computation, the computa-tional costs are significantly lower than many other methods.
One of the limitations found in the study is that the method misclassifiedthe behaviour in situations where the end of one behaviour contains observations
14
Spatio-Temporal and Context Reasoning in Smart Homes 7
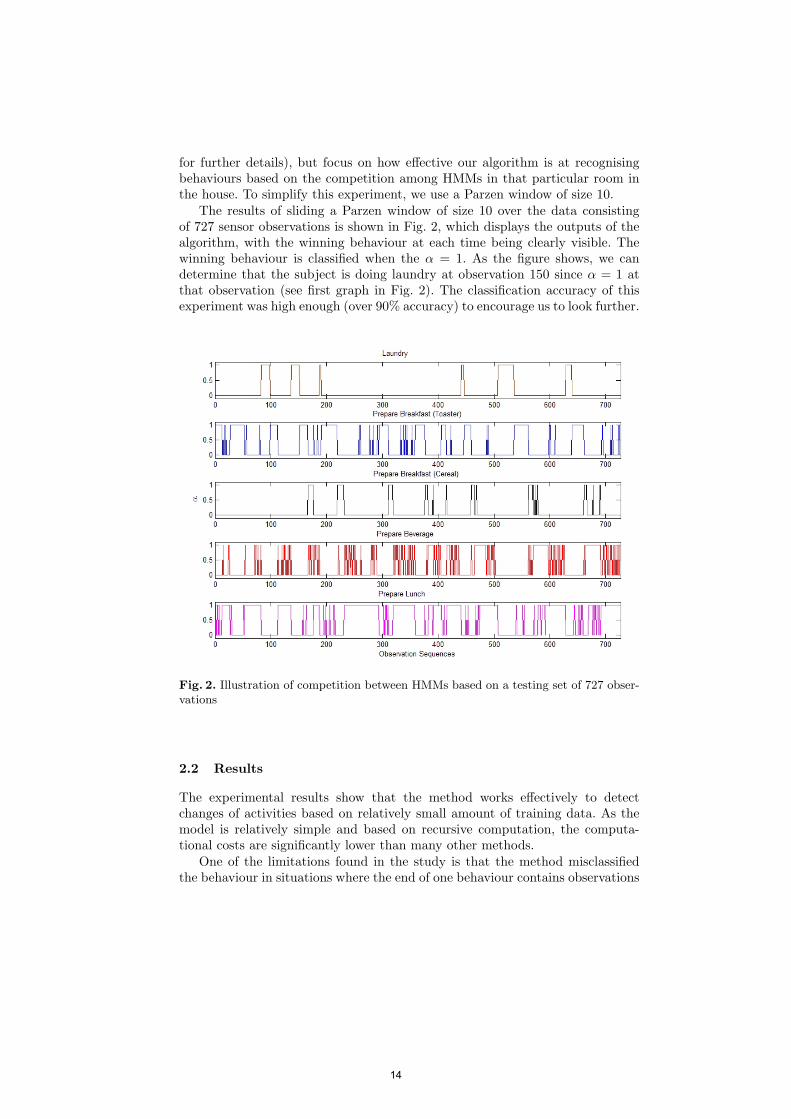
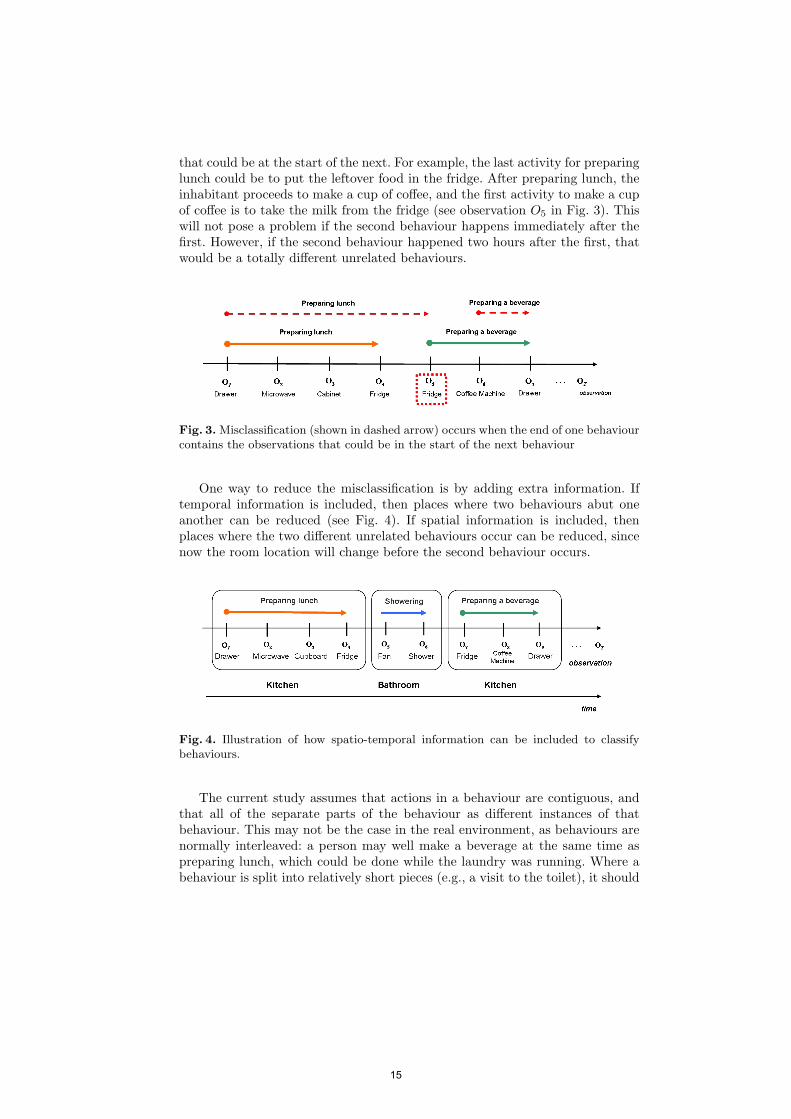
that could be at the start of the next. For example, the last activity for preparinglunch could be to put the leftover food in the fridge. After preparing lunch, theinhabitant proceeds to make a cup of coffee, and the first activity to make a cupof coffee is to take the milk from the fridge (see observation O5 in Fig. 3). Thiswill not pose a problem if the second behaviour happens immediately after thefirst. However, if the second behaviour happened two hours after the first, thatwould be a totally different unrelated behaviours.
Fig. 3. Misclassification (shown in dashed arrow) occurs when the end of one behaviourcontains the observations that could be in the start of the next behaviour
One way to reduce the misclassification is by adding extra information. Iftemporal information is included, then places where two behaviours abut oneanother can be reduced (see Fig. 4). If spatial information is included, thenplaces where the two different unrelated behaviours occur can be reduced, sincenow the room location will change before the second behaviour occurs.
Fig. 4. Illustration of how spatio-temporal information can be included to classifybehaviours.
The current study assumes that actions in a behaviour are contiguous, andthat all of the separate parts of the behaviour as different instances of thatbehaviour. This may not be the case in the real environment, as behaviours arenormally interleaved: a person may well make a beverage at the same time aspreparing lunch, which could be done while the laundry was running. Where abehaviour is split into relatively short pieces (e.g., a visit to the toilet), it should
15
8 Sook-Ling Chua, Stephen Marsland and Hans W. Guesgen
be possible to recognise this. However, care needs to be taken to ensure the factthat somebody cooks 3 times a day (breakfast, lunch, and dinner) does not getbunched into one behaviour interspersed with breaks.
3 Spatio-Temporal and Context Reasoning
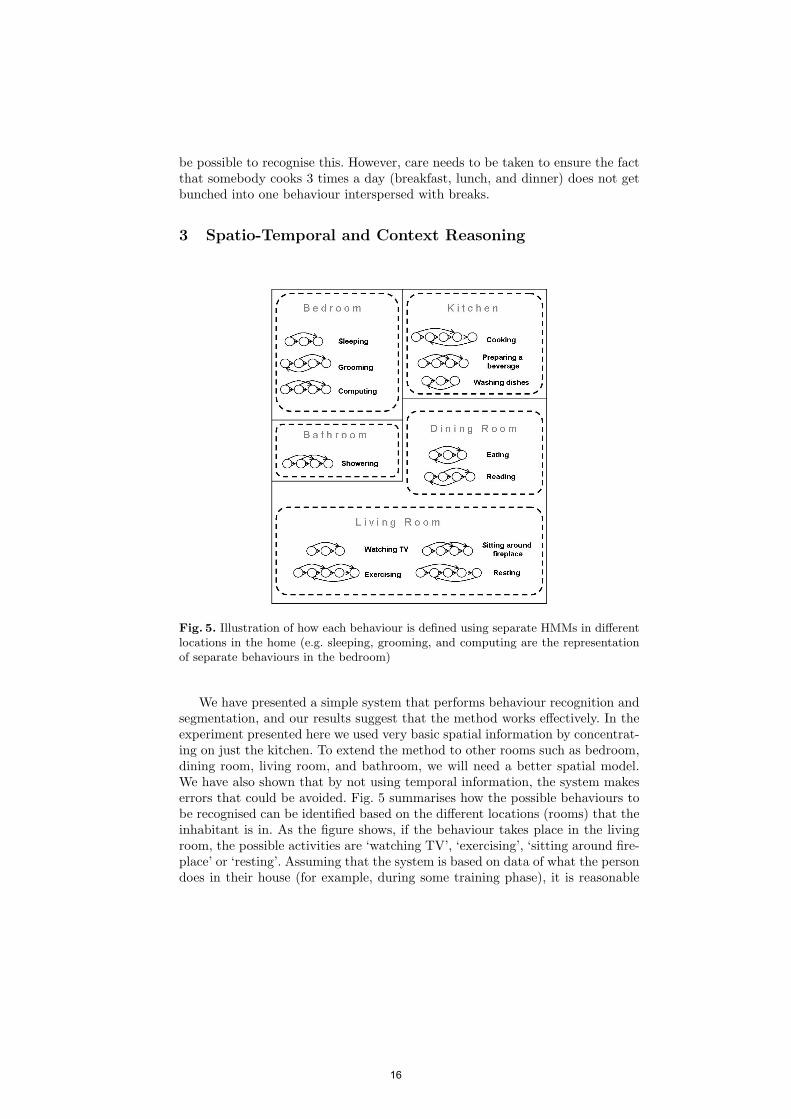
Fig. 5. Illustration of how each behaviour is defined using separate HMMs in differentlocations in the home (e.g. sleeping, grooming, and computing are the representationof separate behaviours in the bedroom)
We have presented a simple system that performs behaviour recognition andsegmentation, and our results suggest that the method works effectively. In theexperiment presented here we used very basic spatial information by concentrat-ing on just the kitchen. To extend the method to other rooms such as bedroom,dining room, living room, and bathroom, we will need a better spatial model.We have also shown that by not using temporal information, the system makeserrors that could be avoided. Fig. 5 summarises how the possible behaviours tobe recognised can be identified based on the different locations (rooms) that theinhabitant is in. As the figure shows, if the behaviour takes place in the livingroom, the possible activities are ‘watching TV’, ‘exercising’, ‘sitting around fire-place’ or ‘resting’. Assuming that the system is based on data of what the persondoes in their house (for example, during some training phase), it is reasonable
16
Spatio-Temporal and Context Reasoning in Smart Homes 9
to assume that these behaviours cover the possible actions. Note that we are notinterested in the exact coordinates of the activity, but rather in the room wherethe activity occurs; it may be that for other activities, a finer spatial resolutionis needed.
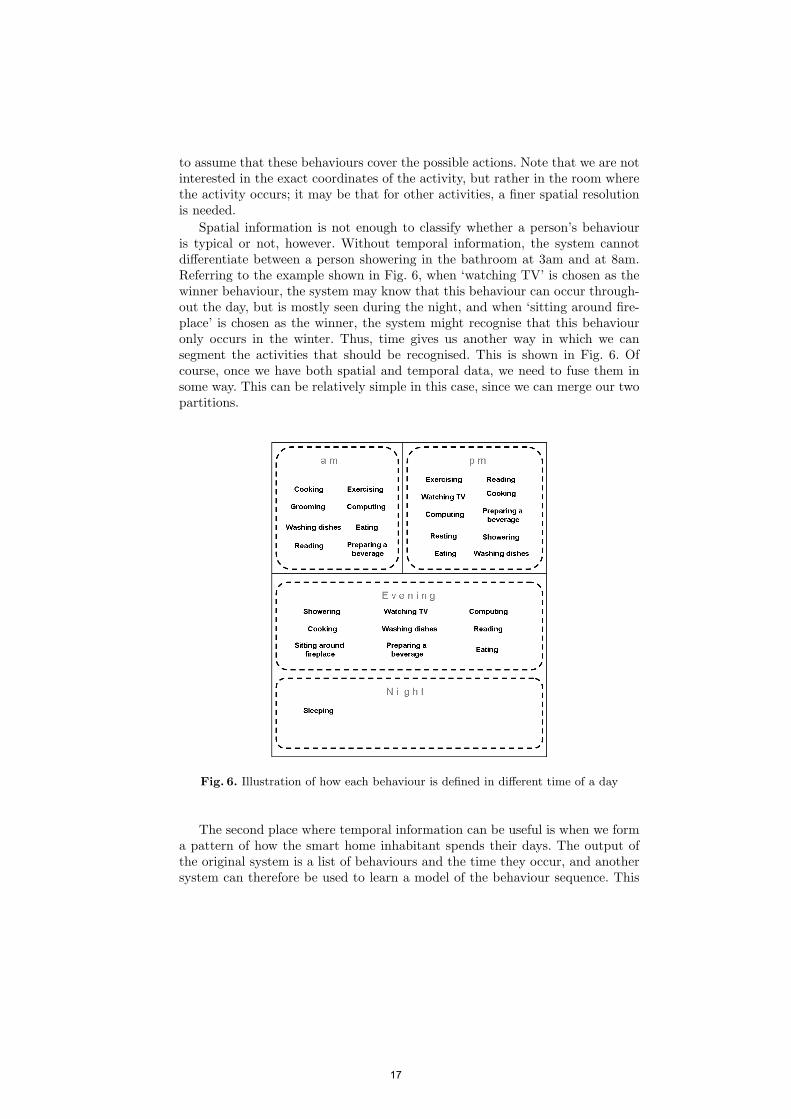
Spatial information is not enough to classify whether a person’s behaviouris typical or not, however. Without temporal information, the system cannotdifferentiate between a person showering in the bathroom at 3am and at 8am.Referring to the example shown in Fig. 6, when ‘watching TV’ is chosen as thewinner behaviour, the system may know that this behaviour can occur through-out the day, but is mostly seen during the night, and when ‘sitting around fire-place’ is chosen as the winner, the system might recognise that this behaviouronly occurs in the winter. Thus, time gives us another way in which we cansegment the activities that should be recognised. This is shown in Fig. 6. Ofcourse, once we have both spatial and temporal data, we need to fuse them insome way. This can be relatively simple in this case, since we can merge our twopartitions.
Fig. 6. Illustration of how each behaviour is defined in different time of a day
The second place where temporal information can be useful is when we forma pattern of how the smart home inhabitant spends their days. The output ofthe original system is a list of behaviours and the time they occur, and anothersystem can therefore be used to learn a model of the behaviour sequence. This
17
10 Sook-Ling Chua, Stephen Marsland and Hans W. Guesgen
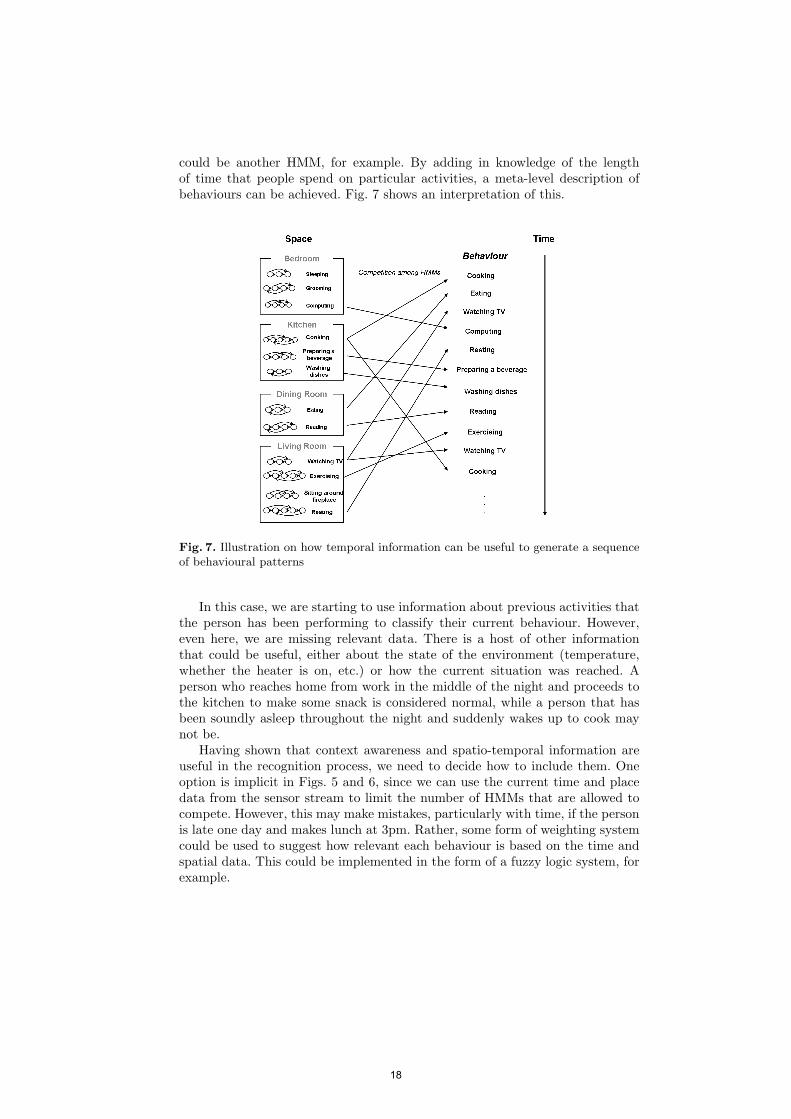
could be another HMM, for example. By adding in knowledge of the lengthof time that people spend on particular activities, a meta-level description ofbehaviours can be achieved. Fig. 7 shows an interpretation of this.
Fig. 7. Illustration on how temporal information can be useful to generate a sequenceof behavioural patterns
In this case, we are starting to use information about previous activities thatthe person has been performing to classify their current behaviour. However,even here, we are missing relevant data. There is a host of other informationthat could be useful, either about the state of the environment (temperature,whether the heater is on, etc.) or how the current situation was reached. Aperson who reaches home from work in the middle of the night and proceeds tothe kitchen to make some snack is considered normal, while a person that hasbeen soundly asleep throughout the night and suddenly wakes up to cook maynot be.
Having shown that context awareness and spatio-temporal information areuseful in the recognition process, we need to decide how to include them. Oneoption is implicit in Figs. 5 and 6, since we can use the current time and placedata from the sensor stream to limit the number of HMMs that are allowed tocompete. However, this may make mistakes, particularly with time, if the personis late one day and makes lunch at 3pm. Rather, some form of weighting systemcould be used to suggest how relevant each behaviour is based on the time andspatial data. This could be implemented in the form of a fuzzy logic system, forexample.
18
Spatio-Temporal and Context Reasoning in Smart Homes 11
4 Conclusion
We have shown that competition between HMMs is a possible mechanism forbehaviour recognition and segmentation in a smart home. In this paper, we havediscussed how context awareness and spatio-temporal information can improvethe accuracy of this system, and how it can be used to better recognise whenbehaviours are not typical.
Algorithms for behaviour recognition generally fall into two categories: thosethat are based on an explicit representation of behaviours together with theevents that characterise them, and those that mine them from sensor streams.The second has the advantage that we don’t need to know what events constitutea behaviour, and therefore they are the preferred approach by many researchers.However, most approaches do not fully exploit the data but mainly focus onwhich sensors are triggered, and use these sensor sequences for learning. Weare using the extra information in the stream (based on implicit information torepresent behaviours where we use a set of hidden states to classify a sequenceof observations over time), which falls into three categories: spatial, temporal,contextual.
For a smart home to support inhabitant’s daily activities, the system shouldnot only recognise behaviours, but also to monitor potential abnormality. Asystem could learn whether a novel input presented to it is a completely newbehaviour, additional information to describe the current learned behaviours(which may be due to newly added sensors), or an abnormal behaviour. Weare particularly interested in the use of novelty detection methods to addressthis, although there may be other suitable machine learning methods. The ideabehind novelty detection is to train on a set of normal behaviours consisting ofspatial, temporal and contextual information and then using the learned ‘normal’behavioural models to identify inputs that do not fit into the pattern of thetraining set [15]. Applying these ideas to behaviour recognition in smart homesis the future direction of this research.
Acknowledgments. This study is conducted as part of PhD research in theSchool of Engineering and Advanced Technology at Massey University. The fi-nancial support from Massey University is gratefully acknowledged. We alsoacknowledge the support of the other members of the MUSE group (http://muse.massey.ac.nz).
References
1. Newcomer R., Kang T., laPlante M., Kaye S.: Living Quarters and Unmet Needfor Personal Care Assistance among Adults with Disabilities. J. Gerontology: Soc.Sci. 60(B), 4, S205–S213 (2005)
2. Dunstan K., Thomson, N. : Demographic Aspects of New Zealand’s AgeingPopulation, 2006. http://www.stats.govt.nz/products-and-services/papers/demographic-aspects-nz-ageing-population.htm
19
12 Sook-Ling Chua, Stephen Marsland and Hans W. Guesgen
3. Department of Economic and Social Affairs, Population Division. : World Pop-ulation Prospects: The 2006 Revision. http://www.un.org/esa/population/
publications/wpp2006/WPP2006_Highlights_rev.pdf4. Tapia E.M., Intille S.S., Larson K.: Activity Recognition in the Home Using Simple
and Ubiquitous Sensors. Pervasive, pp. 158–175. (2004)5. Mozer M.C.: Lessons from an Adaptive Home: Smart Environments: Technology,
Protocols, and Applications. In: Cook, D.J. and Das, S.K. (eds.) pp. 273–298.Wiley, New York (2005)
6. Hagras H., Callaghan V., Colley M., Clarke G., Pounds-Cornish A., Duman H.:Creating an Ambient-Intelligence Environment using Embedded Agents. IntelligentSystems, IEEE. 19, 6, 12–20 (2004)
7. Youngblood G.M., Cook D.J.: Data Mining for Hierarchical Model Creation. IEEETransactions on Systems, Man, and Cybernetics, Part C. 37, 4, 561–572 (2007)
8. Kidd C.D., Orr R., Abowd G.D., Atkeson C.G., Essa I.A., MacIntyre B., MynattE.D., Starner T., Newstetter W.: The Aware Home: A Living Laboratory for Ubiq-uitous Computing Research, Composing a Complex Biological Workflow throughWeb Services. In: CoBuild ’99: Proc. of the Second International Workshop onCooperative Buildings, Integrating Information, Organization, and Architecture.pp. 191–198. Springer-Verlag (1999)
9. Helal S., Mann W., El-Zabadani H., King, J., Kaddoura, Y.,Jansen, E.: The GatorTech Smart House: A Programmable Pervasive Space. Computer. 38, 3, 50–60(2005)
10. Rabiner L.R.: A Tutorial on Hidden Markov Models and Selected Applications inSpeech Recognition. Proc. of the IEEE. 77, 2, 257–286 (1989)
11. Juang B.H., Rabiner L.R.: Hidden Markov Models for Speech Recognition. Tech-nometrics. 33, 3, 251–272 (1991)
12. Guesgen H.W., Marsland, S.: Handbook of Ambient Intelligence and Smart Envi-ronments: Spatio-Temporal Reasoning and Context Awareness. In Nakashima H.,Aghajan H., Augusto J.C. (eds.) Springer (2009).
13. Niu F., Abdel-Mottaleb M.: HMM-based Segmentation and Recognition of HumanActivities from Video Sequences. In: IEEE International Conference on Multimediaand Expo, pp. 804-807. (2005)
14. Kim D., Song J., Kim D.: Simultaneous Gesture Segmentation and Recognitionbased on Forward Spotting Accumulative HMMs. Pattern Recognition. 40, 11,3012-3026 (2007)
15. Marsland S., Nehmzow U., and Shapiro J.: Environment-Specific Novelty Detec-tion.From Animals to Animats, the 7th International Conference on Simulation ofAdaptive Behaviour, pp. 36–45.(2002)
16. Chua S.L., Marsland S., Guesgen H.W.: Behaviour Recognition from SensoryStreams in Smart Environments. Submitted for Review. (2009)
17. Duong T.V., Bui, H.H., Phung D.Q., Venkatesh S.: Activity Recognition and Ab-normality Detection with the Switching Hidden Semi-Markov Model. IEEE Com-puter Society Conference on Computer Vision and Pattern Recognition, 1, 838–845.(2005)
18. Liao L.,Patterson, D.J., Fox D., Kautz, H.: Learning and Inferring TransportationRoutines. Artificial Intelligence. 171, 5-6, 311–331 (2007)
19. Nguyen N.T., Phung D.Q., Venkatesh S., Bui H.: Learning and Detecting Activitiesfrom Movement Trajectories using the Hierarchical Hidden Markov Model. IEEEComputer Society Conference on Computer Vision and Pattern Recognition, 2,955–960. (2005)
20
An Ontology for Qualitative Description ofImages
Zoe Falomir1, Ernesto Jimenez-Ruiz2, Lledo Museros1, and M. Teresa Escrig1
1 Engineering and Computer Science Department2 Languages and Computer Systems Department
University Jaume I, Castellon, Spain{zfalomir,ejimenez,museros,escrigm}@uji.es
Abstract. Our approach describes any image qualitatively by detect-ing regions/objects in the image and describing its visual characteris-tics (shape and colour) and its spatial characteristics (orientation andtopology) by means of qualitative models. The description obtained istranslated into a Description Logic (DL) based ontology which providesa formal and explicit meaning to the qualitative tags which representsthe visual features of the objects in the image and the spatial relationsbetween them. As a result, for any image, our approach obtains a set ofindividuals which are classified, using a DL reasoner, according to thedescriptions of our ontology.
1 Introduction
Visual knowledge about space is qualitative in nature. The retinal image of avisual object is a quantitative image in the sense that specific locations on theretina are stimulated by light of a specific spectrum of wavelengths and inten-sity. However, the knowledge about a retinal image that can be retrieved frommemory is qualitative. Absolute locations, wavelengths and intensities cannotbe retrieved from memory. Only certain qualitative relations between featureswithin the image or between image features and memory features can be recov-ered. Qualitative representations of this kind share a variety of properties with“mental images” which people report about when they describe from memorywhat they have seen or when they attempt to answer questions on the basis ofvisual memories [1].
Psycho-linguistic researchers have studied which language human beings useto describe from memory what they have seen: usually nouns are used to referto objects, adjectives to express properties of these objects and prepositions toexpress relations between them [2]. These nouns, adjectives and prepositions arequalitative labels which extract knowledge from images which can be used tocommunicate and compare image content.
However, describing any image qualitatively and interpreting it in a mean-ingful way as human beings can do remains a challenge. The association ofmeaning to the representations obtained by robotic systems, also known as sym-bol grounding problem, is still a prominent issue within the Artificial Intelligence(AI) domain [3]. In this paper, we present a little step forward in that direction.
21
COSIT 2009

The approach presented in this paper describes any image qualitatively andstores the results of the description as facts according to an ontology. The mainregions that characterize each image are extracted by using a graph-based imagesegmentation method [4] and then the visual and spatial features of these regionsare computed. The visual features of each region are described by qualitativemodels of shape and colour [5], while the spatial features of each region aredescribed by qualitative models of topology [6] and orientation [7, 8]. We proposeto use an ontology to give a formal and explicit meaning to the qualitativelabels used to describe each image. Thus, ontologies will provide an explicitrepresentation of knowledge inside the robot.
The remainder of this paper is organized as follows. Section 2 describes therelated work. Section 3 details what our approach consists of. Section 4 describesthe ontology schema and facts provided by our approach. Section 5 presents theresults of our approach applied to the description of digital images which describeour robot environment. Finally, in Section 6, our conclusions and future workare explained.
2 Related Work
Related works have been published that describe images qualitatively [9, 10, 11].In [9], landscape images are divided by a grid for its description so that semanticcategories (grass, water, etc.) are identified and qualitative relations of relativesize, time and topology are used for image description and retrieval in data bases.In [10], a qualitative description for sketch image recognition is proposed, whichdescribes lines, arcs and ellipses as basic elements and also the relative position,length and orientation of their edges. In [11], a verbal description of an image isprovided to a robotic manipulator system so it can identify and pick an objectup that has been previously described qualitatively using predefined categoriesof type, colour, size, shape and spatial relationships.
We believe that all the works described above provide evidence for the effec-tiveness of using qualitative information to describe images. However, to the bestof our knowledge, none of these works can describe any image from the robotenvironment in a general way, that is, by describing visually and spatially onlythe main important regions without adding to the system any previous learningprocess.
Moreover, in the literature, related works which use ontologies to store andstructure the knowledge extracted from an image can be found [12, 13, 14]. In[12], images containing objects of a specific domain are described by an ontologywhich contains qualitative features of shape, colour, texture, size and topology forobject classification purposes. In [13], an ontology based object categorizationapproach is presented for the recognition and communication of the ball andthe goal in the RoboCup tournament by Sony AIBO robots. Finally, in [14]the possible use of Description Logic (DL) as a knowledge representation andreasoning system for high-level scene interpretation is examined.
22
Despite all these works, the application of ontologies in robotics and in otherautomatic systems is still novel, since ontology-like techniques are still undermaturation (OWL is still evolving and reasoners are being improved to be morescalable). Ontology benefits are theoretically proved but not always practicallytested. Nevertheless, there is a growing tendency to introduce high-level semanticknowledge into robotic systems [15], and our approach is a small contribution tothis.
3 Our Approach for Qualitative Description of Images
The approach presented in this paper describes qualitatively any image by de-scribing the visual and spatial features of the objects/regions within it. Theseobjects/regions are obtained by applying the graph-based image segmentationmethod presented in [4] and other image processing algorithms developed toextract the boundaries of the segmented regions. The visual features of eachregion in the image are described by qualitative models of shape and colour [5],while the spatial features of each region in the image are described by qualitativemodels of topology [6] and orientation [7, 8].
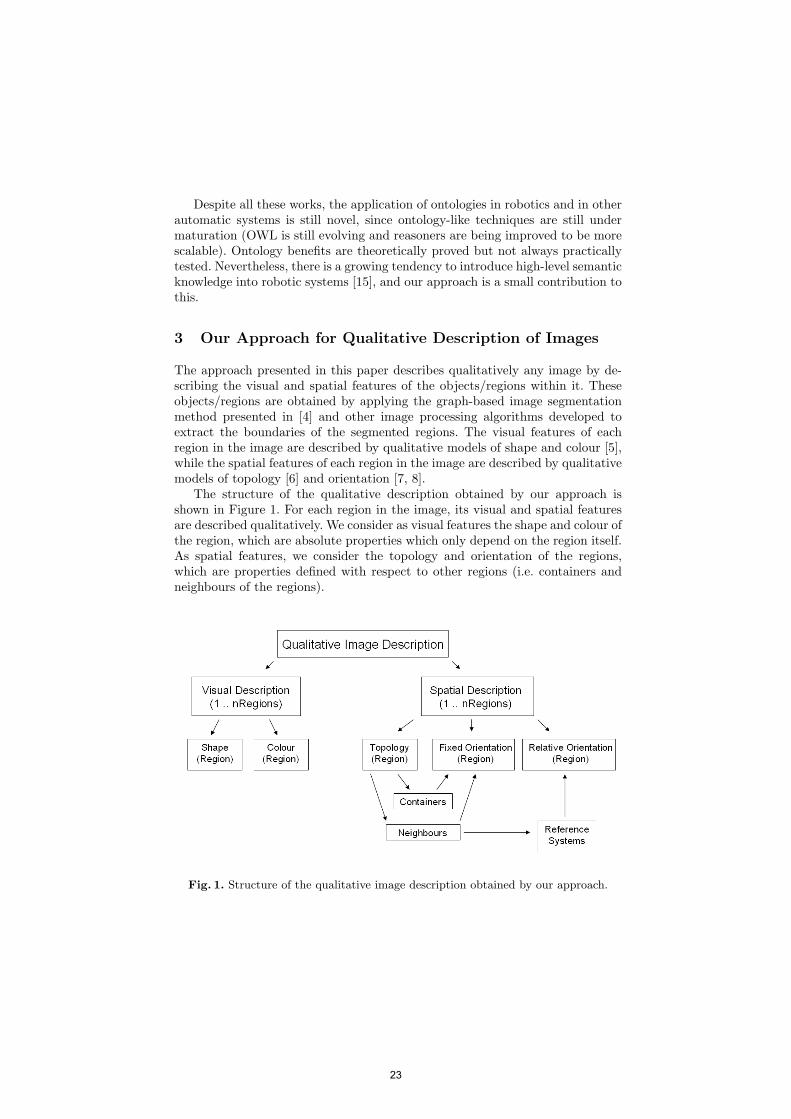
The structure of the qualitative description obtained by our approach isshown in Figure 1. For each region in the image, its visual and spatial featuresare described qualitatively. We consider as visual features the shape and colour ofthe region, which are absolute properties which only depend on the region itself.As spatial features, we consider the topology and orientation of the regions,which are properties defined with respect to other regions (i.e. containers andneighbours of the regions).
Fig. 1. Structure of the qualitative image description obtained by our approach.
23
3.1 Describing Spatial Features of the Regions in the Image
As spatial features of any region in the image, we describe its topology and itsfixed and relative orientation.
Topological Description. The relations of topology described by our approachare a subset of those defined in [6]: disjoint, touching, completely inside, con-tainer of.
Our approach determines if an object is completely inside or if it is the con-tainer of another object. It also defines as neighbours of an object, all thoseobjects with the same container, which can be other objects or the image itself.The neighbours of an object can be (i) disjoint from the object, if they do nothave any edge or vertex in common; (ii) or touching the object, if they have atleast one vertex or edge in common. As digital images are two-dimensional, noinformation on depth is obtained; therefore the topological relations of meeting,overlapping, touching inside and equal defined in [6] cannot be distinguished andare all substituted by touching in our approach.
Fixed and Relative Orientation Description. Orientation relations be-tween the objects in the image are structured in levels of containment.
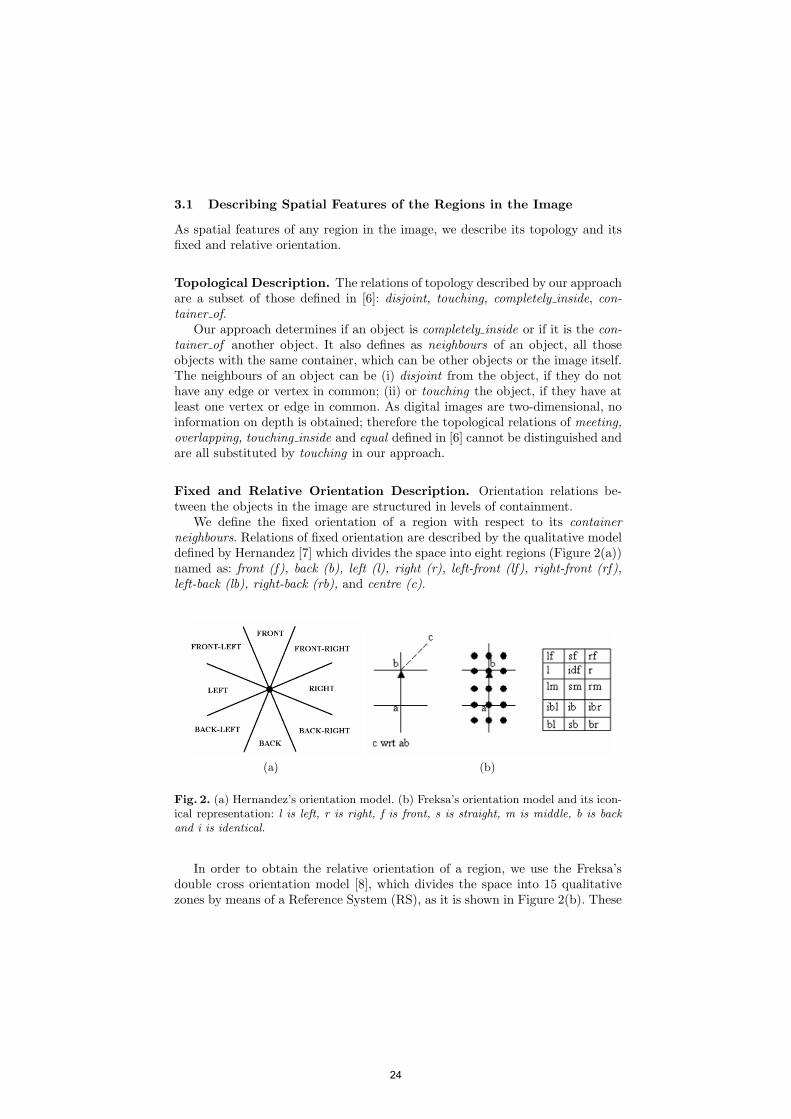
We define the fixed orientation of a region with respect to its containerneighbours. Relations of fixed orientation are described by the qualitative modeldefined by Hernandez [7] which divides the space into eight regions (Figure 2(a))named as: front (f), back (b), left (l), right (r), left-front (lf), right-front (rf),left-back (lb), right-back (rb), and centre (c).
(a) (b)
Fig. 2. (a) Hernandez’s orientation model. (b) Freksa’s orientation model and its icon-ical representation: l is left, r is right, f is front, s is straight, m is middle, b is backand i is identical.
In order to obtain the relative orientation of a region, we use the Freksa’sdouble cross orientation model [8], which divides the space into 15 qualitativezones by means of a Reference System (RS), as it is shown in Figure 2(b). These
24
zones are named as: left-front (lf), straight-front (sf), right-front (rf), left (l),identical-front (idf), right (r), left-middle (lm), same-middle (sm), right-middle(rm), identical-back-left (ibl), identical-back (ib), identical-back-right (ibr), back-front (bf), same-back (sb), back-right (br), as defined in Figure 2(b). Our ap-proach obtains the relative orientation of a region with respect to the referencesystems built by all the pairs of neighbours of a region. The points a and b ofthe RS are the centroids of the neighbour regions composing the RS.
The advantage of providing a description structured in levels of containmentis that the level of detail to be extracted from the image can be selected. Forexample, we can extract all the information in the image or only that informationdealing with the objects immediately contained in the image, which could beconsidered as a more general or abstract description of that image.
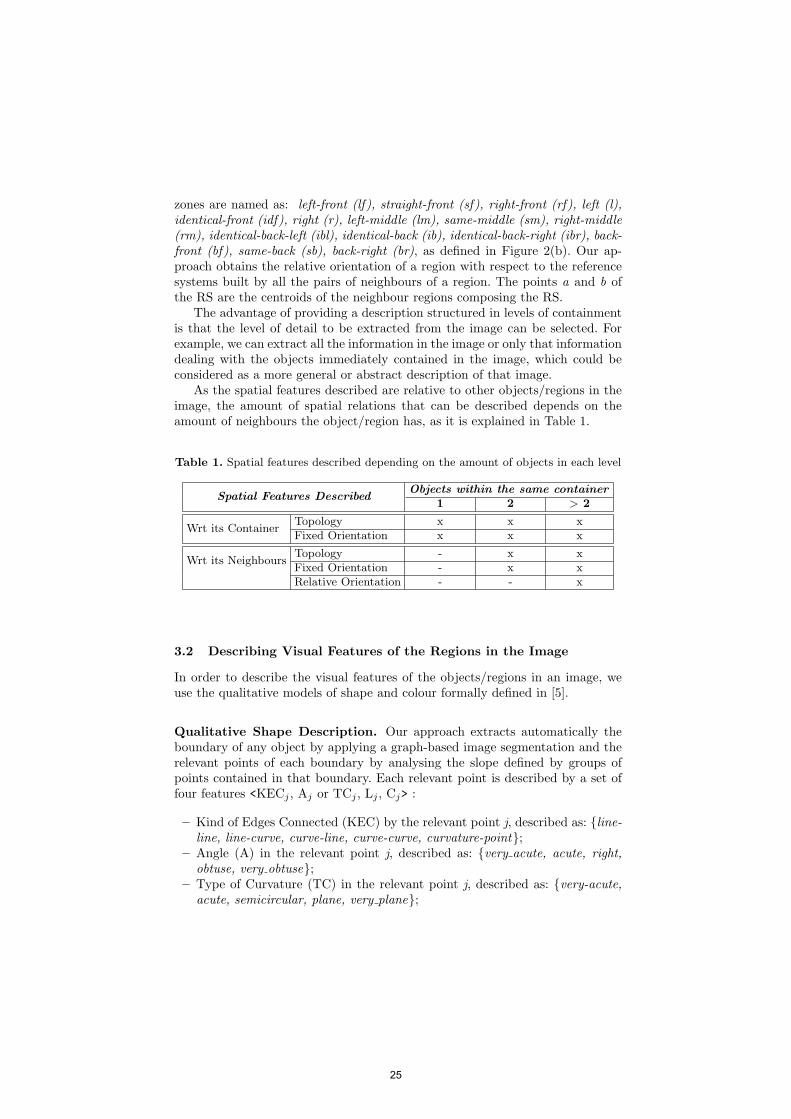
As the spatial features described are relative to other objects/regions in theimage, the amount of spatial relations that can be described depends on theamount of neighbours the object/region has, as it is explained in Table 1.
Table 1. Spatial features described depending on the amount of objects in each level
Spatial Features DescribedObjects within the same container
1 2 > 2
Wrt its ContainerTopology x x xFixed Orientation x x x
Wrt its NeighboursTopology - x xFixed Orientation - x xRelative Orientation - - x
3.2 Describing Visual Features of the Regions in the Image
In order to describe the visual features of the objects/regions in an image, weuse the qualitative models of shape and colour formally defined in [5].
Qualitative Shape Description. Our approach extracts automatically theboundary of any object by applying a graph-based image segmentation and therelevant points of each boundary by analysing the slope defined by groups ofpoints contained in that boundary. Each relevant point is described by a set offour features <KECj , Aj or TCj , Lj , Cj> :
– Kind of Edges Connected (KEC) by the relevant point j, described as: {line-line, line-curve, curve-line, curve-curve, curvature-point};
– Angle (A) in the relevant point j, described as: {very acute, acute, right,obtuse, very obtuse};
– Type of Curvature (TC) in the relevant point j, described as: {very-acute,acute, semicircular, plane, very plane};
25

– Compared Length (L) of the two edges connected by j, described as: {much-shorter (msh), half-lenght (hl), quite-shorter (qsh), similar-lenght (sl), quite-longer (ql), double-lenght (dl), much-longer (ml)};
– Convexiy (C) in the relevant point j, described as: {convex, concave}.
Qualitative Colour Description. Our approach translates the Red, Greenand Blue (RGB) colour channels into Hue, Saturation and Value (HSV) coordi-nates which are more suitable to be divided into intervals of values correspondingto colour names. The qualitative tags used by our approach to represent coloursare the following: black, dark-grey, grey, light-grey, white, red, yellow, green,turquoise, blue, violet.
4 Giving Meaning to Qualitative Descriptions
Our approach describes any image by using qualitative information, both visual(e.g. shape, colour) and spatial (e.g. topology, orientation). We propose to useontologies to give a formal meaning to the qualitative labels associated to eachobject. Thus, ontologies will provide an explicit representation of the knowledgeinside the robot system.
An ontology is an explicit specification of a conceptualization [16] providing anon-ambiguous and formal representation of a domain. Ontologies usually havespecific purposes and their intended consumers are computer applications ratherthan humans. Therefore, ontologies should provide a common vocabulary andmeaning to allow these applications to communicate among themselves [17].
The use of an ontology-based representation is intended to enhance taskssuch as reasoning, communication or collaboration. Next we emphasize the mainmotivations of using ontologies within our system:
– Symbol Grounding. As commented previously, ontologies can provide aformal and explicit meaning to the qualitative labels which describe an imageand are stored inside the robot system.
– Knowledge sharing. The adoption of ontologies provides us with a stan-dard way to publish our representations in order to be shared and reused byother systems. Thus, the use of a common conceptualization will ease thecommunication between systems if necessary.
– Reasoning. New knowledge may be inferred from the explicit representa-tions using reasoners. This gives some freedom and flexibility when insertingnew descriptions or new facts, and this new knowledge can be automaticallyclassified (e.g. a captured object is a door) without providing explicit ax-ioms. Thus, ontologies may support decision making tasks depending on theobtained classifications.
As a proof of concept, we have developed an ontology to represent qualita-tive description of images. We have adopted the revision 2 of OWL3 [18, 19]as ontology language and we have used the OWL ontology editor Protege 44,
3Ontology Web Language: http://www.w3.org/2007/OWL/wiki/Syntax4Protege: http://protege.stanford.edu
26
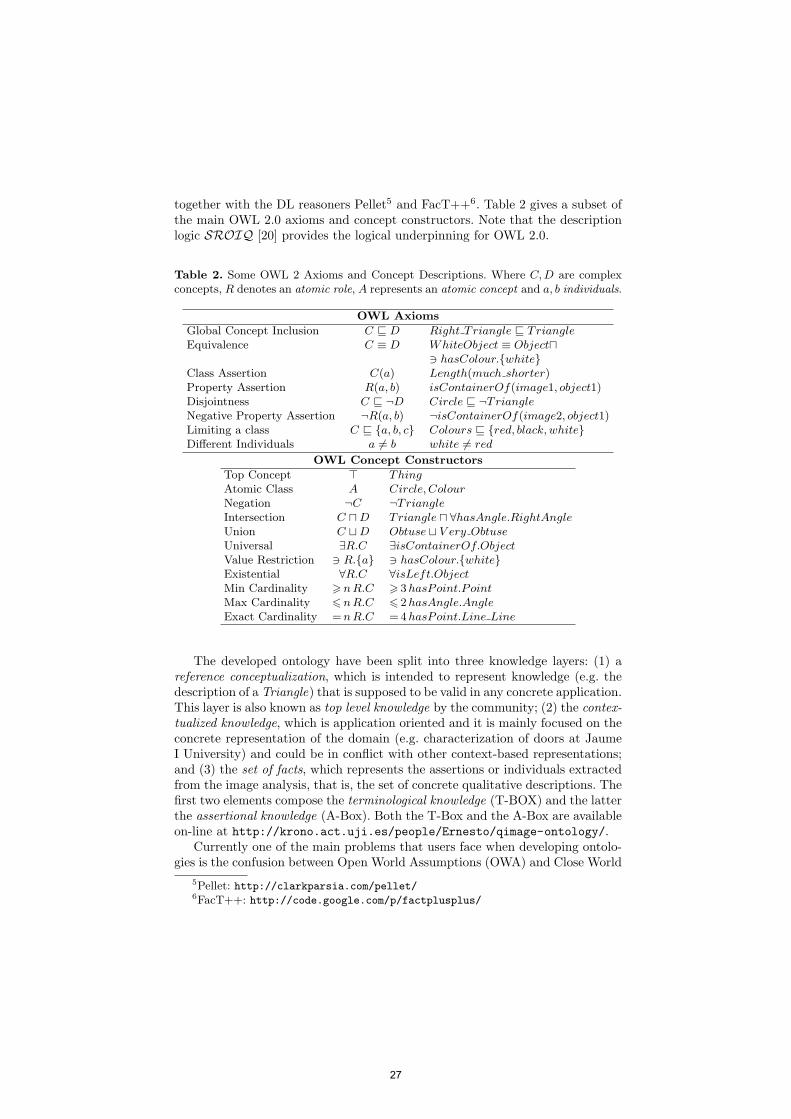
together with the DL reasoners Pellet5 and FacT++6. Table 2 gives a subset ofthe main OWL 2.0 axioms and concept constructors. Note that the descriptionlogic SROIQ [20] provides the logical underpinning for OWL 2.0.
Table 2. Some OWL 2 Axioms and Concept Descriptions. Where C,D are complexconcepts, R denotes an atomic role, A represents an atomic concept and a, b individuals.
OWL Axioms
Global Concept Inclusion C v D Right Triangle v TriangleEquivalence C ≡ D WhiteObject ≡ Objectu
3 hasColour.{white}Class Assertion C(a) Length(much shorter)Property Assertion R(a, b) isContainerOf(image1, object1)Disjointness C v ¬D Circle v ¬TriangleNegative Property Assertion ¬R(a, b) ¬isContainerOf(image2, object1)Limiting a class C v {a, b, c} Colours v {red, black, white}Different Individuals a 6= b white 6= red
OWL Concept Constructors
Top Concept > ThingAtomic Class A Circle, ColourNegation ¬C ¬TriangleIntersection C uD Triangle u ∀hasAngle.RightAngleUnion C tD Obtuse t V ery ObtuseUniversal ∃R.C ∃isContainerOf.ObjectValue Restriction 3 R.{a} 3 hasColour.{white}Existential ∀R.C ∀isLeft.ObjectMin Cardinality >nR.C > 3hasPoint.PointMax Cardinality 6nR.C 6 2hasAngle.AngleExact Cardinality =nR.C = 4hasPoint.Line Line
The developed ontology have been split into three knowledge layers: (1) areference conceptualization, which is intended to represent knowledge (e.g. thedescription of a Triangle) that is supposed to be valid in any concrete application.This layer is also known as top level knowledge by the community; (2) the contex-tualized knowledge, which is application oriented and it is mainly focused on theconcrete representation of the domain (e.g. characterization of doors at JaumeI University) and could be in conflict with other context-based representations;and (3) the set of facts, which represents the assertions or individuals extractedfrom the image analysis, that is, the set of concrete qualitative descriptions. Thefirst two elements compose the terminological knowledge (T-BOX) and the latterthe assertional knowledge (A-Box). Both the T-Box and the A-Box are availableon-line at http://krono.act.uji.es/people/Ernesto/qimage-ontology/.
Currently one of the main problems that users face when developing ontolo-gies is the confusion between Open World Assumptions (OWA) and Close World
5Pellet: http://clarkparsia.com/pellet/6FacT++: http://code.google.com/p/factplusplus/
27

Assumptions (CWA) [21]. Closed world systems such as databases or logic pro-graming (e.g. PROLOG) considers that anything that cannot be found is false(negation as failure). However, Description Logics (and therefore OWL) assumean open world, that is, anything is true unless it can be proven the contrary (i.e.two concepts overlap unless they are declared as disjoint).
In our use case, we have faced that problem when characterizing conceptssuch as “Quadrilateral”, where individuals belonging to that set should haveexactly four sides (i.e. four connected points). Minimum cardinalities are easy tomanage by just declaring the inidividuals (in that case the sides of the quadrilat-eral) to be different among themselves. However, stating maximum (and there-fore exact) cardinalities is not straightforward. For these cases closure axiomsare the key to limit the domain of interpretation. It is not only necessary tosay that an individual has four sides to be classified as a “Quadrilateral”, butalso it is required to say explicitely that it has not more sides with the negativeproperty assertion axioms. Moreover, it is also necessary to declare the size of aclass by means of nominals, that is, to explicitely say that a class is composedby a concrete set of individuals (e.g. possible sides or points for quadrilaterals)and not any other.
5 Results
Our approach obtains a qualitative image description and an instance of anontology for any digital image, including those which describe our robot envi-ronment.
As it is outlined in Figure 3, for each image, our approach obtains the mainregions which characterize it, describe them visually and spatially by using quali-tative models of shape, colour, topology and orientation and obtains a qualitativedescription of the image in a flat format (see Table 3) and also as a set of ontol-ogy facts stored in an .owl file. This .owl file, which represents the assertionalknowledge (A-Box), is imported by Protege and, according to the terminologicalknowledge (T-BOX) defined on our ontology schema, new knowledge is inferredby the reasoners (FaCT++ or Pellet) which can be used by the robot.
Table 3 presents an excerpt of the qualitative description which describesregion 4 in the image. Its spatial description can be intuitively read as: region4 is completedly inside region 0 and exactly located at front, front right, back,back right with respect to the centre of region 0. The neighbours of region 4 areregions 6 and 7, which are both disjoint and located front left, left, back leftwith respect to region 4. Moreover, region 4 is back right (br), back left (bl) withrespect to the reference system built by its two neighbours (region 6 and 7). Thevisual description of region 4 shows that its colour is blue and that the shape ofits boundary is qualitatively described as composed of four line-line segmentswhose angles are two acute and convex and two obtuse and convex and whosecompared distances are respectively much shorter, much longer, much shorter,much longer. Finally, the orientation of its vertices with respect the centroid ofthe region is clockwise: front, back, back, front.
28

Fig. 3. Architecture of our approach, which obtains a qualitative description and aninstance of an ontology for any image.
Table 3. An excerpt of the qualitative description obtained for the image in Figure 3.
[SpatialDescription,
(...)
[ 4, [0, Completedly inside, front right, back right, back, front],
[ [neighbours, 6, 7], [disjoint, 6, 7], ]
[[6, front left, left, back left], [7, front left, left, back left]],
[[[6, 7], br, bl]]
(...)]
[VisualDescription,
[ 4, blue,
[Boundary Shape,
[line-line,acute,much shorter,convex],
[line-line,acute,much longer,convex],
[line-line,obtuse,much shorter,convex],
[line-line,obtuse,much longer,convex]],
[Vertices Orientation, front, back, back, front]],
],
(...)]
In Table 4 an excerpt of our ontology is presented. In this table, we candifferenciate the already mentioned three layers of knowledge (see Section 4).As examples of reference conceptualizations, Table 4 shows the properties of anObject in our ontology, the definition of a Shape as a set of at least 3 relevantpoints, the definition of a Quadrilateral as a Shape with 4 points connecting
29
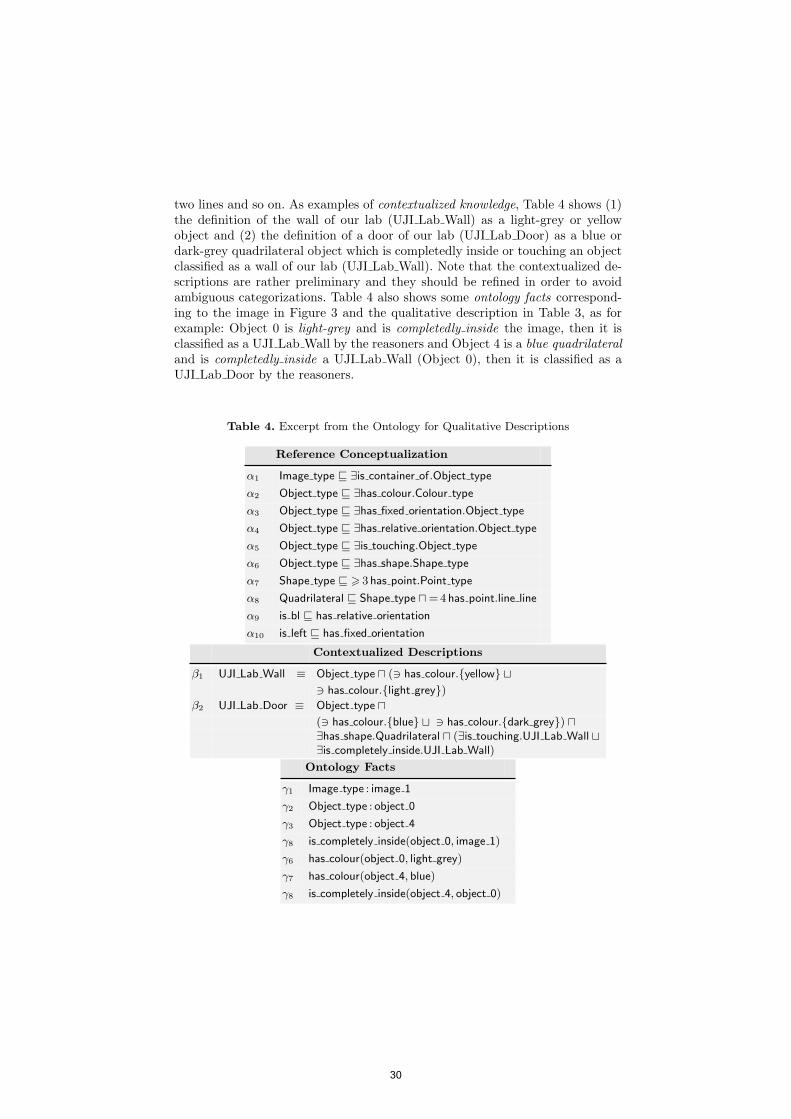
two lines and so on. As examples of contextualized knowledge, Table 4 shows (1)the definition of the wall of our lab (UJI Lab Wall) as a light-grey or yellowobject and (2) the definition of a door of our lab (UJI Lab Door) as a blue ordark-grey quadrilateral object which is completedly inside or touching an objectclassified as a wall of our lab (UJI Lab Wall). Note that the contextualized de-scriptions are rather preliminary and they should be refined in order to avoidambiguous categorizations. Table 4 also shows some ontology facts correspond-ing to the image in Figure 3 and the qualitative description in Table 3, as forexample: Object 0 is light-grey and is completedly inside the image, then it isclassified as a UJI Lab Wall by the reasoners and Object 4 is a blue quadrilateraland is completedly inside a UJI Lab Wall (Object 0), then it is classified as aUJI Lab Door by the reasoners.
Table 4. Excerpt from the Ontology for Qualitative Descriptions
Reference Conceptualization
α1 Image type v ∃is container of.Object type
α2 Object type v ∃has colour.Colour type
α3 Object type v ∃has fixed orientation.Object type
α4 Object type v ∃has relative orientation.Object type
α5 Object type v ∃is touching.Object type
α6 Object type v ∃has shape.Shape type
α7 Shape type v > 3 has point.Point type
α8 Quadrilateral v Shape type u= 4 has point.line line
α9 is bl v has relative orientation
α10 is left v has fixed orientation
Contextualized Descriptions
β1 UJI Lab Wall ≡ Object type u (3 has colour.{yellow} t3 has colour.{light grey})
β2 UJI Lab Door ≡ Object type u(3 has colour.{blue} t 3 has colour.{dark grey}) u∃has shape.Quadrilateral u (∃is touching.UJI Lab Wall t∃is completely inside.UJI Lab Wall)
Ontology Facts
γ1 Image type : image 1
γ2 Object type : object 0
γ3 Object type : object 4
γ8 is completely inside(object 0, image 1)
γ6 has colour(object 0, light grey)
γ7 has colour(object 4, blue)
γ8 is completely inside(object 4, object 0)
30
Finally, we have evaluated the proper classification of the obtained ontol-ogy facts (A-Box) according to our ontology schema (T-Box). For this purpose,Protege has been used as front-end to visualize the explicit knowledge repre-sented in the T-Box and A-Box, and the knowledge inferred using the reasoners.
6 Conclusions and Future Work
This paper has presented a new approach for qualitative description of any imageby means of an ontology. Our approach obtains a visual and a spatial descrip-tion of all the characteristic regions/objects contained in an image. In order toobtain this description, qualitative models of shape, colour, topology, fixed andrelative orientation are applied. As the final result, our approach obtains a set ofqualitative concepts and relations stored as instances of an ontology. The mainaim of this ontology is to describe and classify visual landmarks in the robotworld.
As future work, we intend to (1) extend our approach in order to integratea reasoner inside the robot system, so that we could avoid the use of Protegefront-end and the new knowledge obtained could be provided to the robot inreal time; (2) extend our ontology in order to characterize and classify morelandmarks in the robot environment.
Acknowledgments
This work has been partially supported by MICINN (TIN 2006-14939, TIN2005-09098-C05-04), Generalitat Valenciana (BFPI06/219, BFPI06/372) and Univer-sitat Jaume I - Fundacio Bancaixa (P11A2008-14).
References
[1] Freksa, C.: Qualitative spatial reasoning. In Mark, D.M., Frank, A.U., eds.:Cognitive and Linguistic Aspects of Geographic Space. NATO Advanced StudiesInstitute. Kluwer, Dordrecht (1991) 361–372
[2] Landau, B., Jackendoff, R.: ‘what’ and ‘where’ in spatial language and spatialcognition. Behavioral and Brain Sciences 16(2) (June 1993) 217–265
[3] Williams, M.A.: Representation = grounded information. In: PRICAI ’08: Pro-ceedings of the 10th Pacific Rim International Conference on Artificial Intelli-gence. Volume 5351 of LNCS., Berlin, Heidelberg, Springer-Verlag (2008) 473–484
[4] Felzenszwalb, P.F., Huttenlocher, D.P.: Efficient graph-based image segmentation.International Journal of Computer Vision 59(2) (September 2004) 167–181
[5] Falomir, Z., Almazan, J., Museros, L., Escrig, M.T.: Describing 2D objects byusing qualitative models of color and shape at a fine level of granularity. In: Proc.of the Spatial and Temporal Reasoning Workshop at the 23rd AAAI Conferenceon Artificial Intelligence, ISBN: 978-1-57735-379-9. (2008)
[6] Egenhofer, M.J., Al-Taha, K.K.: Reasoning about gradual changes of topologicalrelationships. In Frank, A.U., Campari, I., Formentini, U., eds.: Theories andMethods of Spatio-Temporal Reasoning in Geographic Space. Intl. Conf. GIS—From Space to Territory. Volume 639 of Lecture Notes in Computer Science.,Berlin, Springer (September 1992) 196–219
31

Qualitative Spatial and TerminologicalReasoning for Ambient Environments
Recent Trends and Future Directions
Joana Hois, Frank Dylla, and Mehul Bhatt
SFB/TR 8 Spatial CognitionUniversity of Bremen, Germany
Abstract. In this paper, we provide an overview how approaches forspatial and terminological representation and reasoning can be appliedto ambient environments and smart places. We introduce formal mod-eling of scene descriptions that are based on qualitative spatial and on-tological aspects. Given this formalization, reasoning techniques relatedto spatial calculi can directly be applied and operationalized for iden-tifying ambient conditions and verifying situation-specific requirements.Furthermore, we point out future challenges on ambient intelligence ben-efiting from spatial and ontological reasoning.
1 Introduction
Ambient Intelligence (AmI) has started to become a mainstream and economi-cally viable venture for a larger consumer base. In particular, it is expected thatAmI projects related to smart environments such as smart homes and offices willadopt a radically different approach as soon as formal knowledge representationand reasoning techniques are involved [1, 4]. Such techniques can support notonly early design stages in order to aid and complement ambient requirementsbut also smart environments in dynamic situations in order to provide their in-tended functionalities. Indeed, since AmI systems primarily pertain to a spatialenvironment, formal representation and reasoning along the ontological (i.e., se-mantic make-up of the space) and spatial (i.e., configurations and constraints)dimensions can be a useful way to ensure that the designed model satisfies keyfunctional requirements that enable and facilitate its required smartness.
In this paper, we provide an overview of state-of-the-art spatial representationand reasoning techniques that are beneficial to spatial aspects of AmI. We furtherprovide latest approaches of formal ontological modeling and its contributionto specifying ambient environments. We indicate how the different formalismsinteract and how they are operationalized for AmI-specific representation andreasoning. Furthermore, a use case of an intelligent apartment for the elderlyis illustrated. Finally, future challenges in the field of spatial, temporal, andterminological reasoning for AmI are discussed.
2 Qualitative Scene Descriptions
Qualitative Reasoning (QR) is concerned with capturing everyday commonsenseknowledge of the physical world with a limited set of symbols and relationshipsand manipulating it in a non-numerical manner [9]. The subfield of qualitativereasoning that is concerned with representations of space is called Qualitative
32
COSIT 2009

Spatial Reasoning (QSR) which includes the underlying representation. We in-troduce essence of qualitative representations in general, and a topological aswell as an orientation representations in the following paragraphs. How suchrepresentations are derived and applied to reason about spatial configurationswithin a spatial environment is shown in Section 4.
2.1 Qualitative Spatial Calculi
The main aim of research in qualitative methods in spatial representation andreasoning is to develop powerful representation formalisms that account for themulti-modality of space in a cognitively acceptable way [9, 15]. A qualitativespatial description captures distinctions between objects that make an impor-tant qualitative difference but ignores others. In general, objects are abstractedto geometric primitives, e.g., points, lines, or regions in the Euclidian plane anddiscrete systems of symbols, i.e., finite vocabularies, are used to describe the re-lationships between objects in a specific domain. A complete model for a certaindomain is called a qualitative calculus. It consists of the set of relations betweenobjects from this domain and the operations defined on these relations. Howreasoning can be performed based on these operations is shown in Section 4. Ingeneral, spatial calculi can be classified into two groups: topological and posi-tional calculi [17]. Topological calculi are, for instance, the region-based calculiRCC-5 or RCC-8 [31] and positional calculi, i.e., calculi dealing with orientationand/or distance information, are for example the DoubleCross Calculus [16] orOPRAm [29].
2.2 Topology and the Region Connection Calculus (RCC)
Topological distinctions are inherently qualitative in nature and they also repre-sent one of the most general and cognitively adequate ways for the representa-tion of spatial information [21, 32]. The prevalent axiomatic approach to buildingtopological theories of space in the QSR domain has its roots in the philosophicallogic community, most notably [7, 8]. Following this work, the class of axiomatictopological theories referred to as Region Connection Calculus (RCC) have beendeveloped [31]. The work by Egenhofer and Franzosa adopts a point-set theoreticapproach and is based on conventional mathematical topology [13].
The RCC-8 Fragment RCC is a modification and extension of the Clarke’soriginal region-based theory. The basic part of the formal theory assumes adyadic relation of connection, namely C(a, b), denoting that region a is con-nected to region b. Topologically, this has the interpretation that the topologicalclosures of a and b share at least one point. From the primitive of connec-tion, the mereological relation of parthood is defined which is, in turn, used todefine proper-part (PP), overlap (O) and disjoint (DR). Further, the relationsdisconnected (DC), externally connected (EC), partial overlap (PO), equal (EQ),tangential proper-part (TPP) and non-tangential proper-part (NTPP) are de-fined. These relations, along with the inverses of the last two, namely TPP−1
and NTPP−1 constitute a jointly exhaustive and pairwise disjoint (JEPD)1 setof base relationships, commonly referred to as the RCC-8 fragment of the region
1 In the case of binary relations, JEPD means that for any pair of entities exactly onebase relation holds. For arbitrary n-ary calculi this must hold for any n-tuple.
33
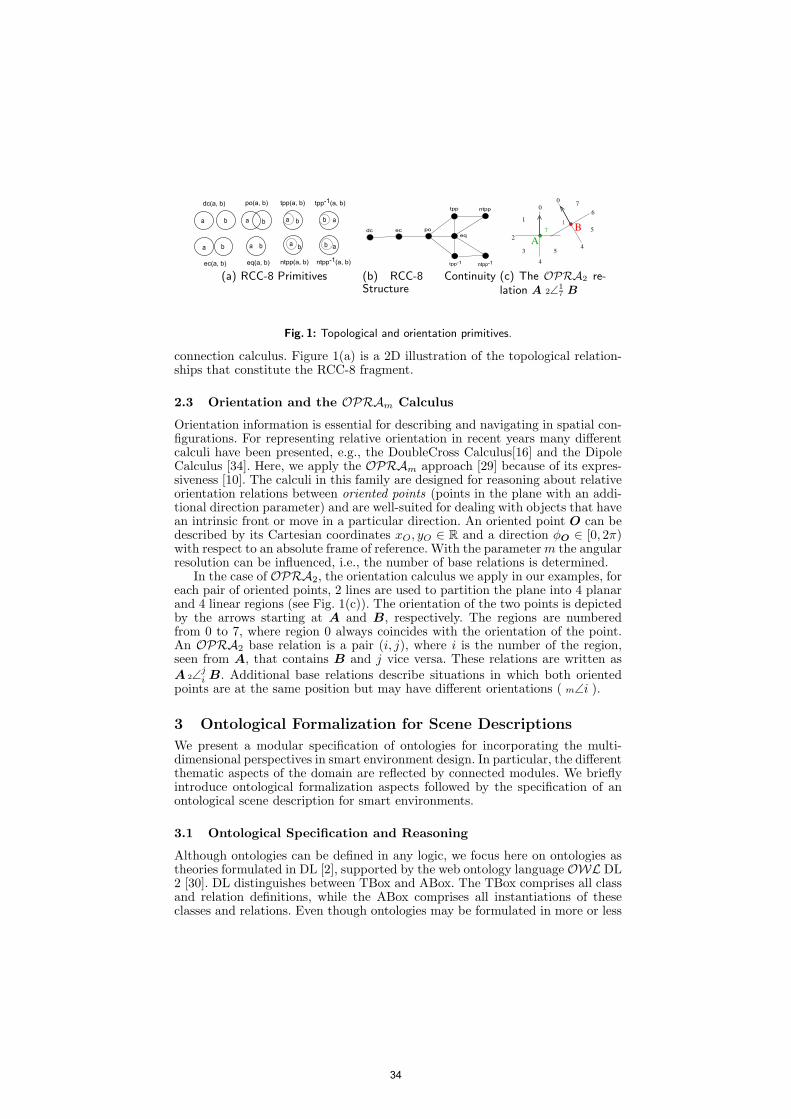
a b
a
aa
a b
b
b
b
a
a
ab
b
b
dc(a, b)
ec(a, b)
po(a, b)
eq(a, b)
tpp(a, b)
ntpp(a, b)
tpp-1(a, b)
ntpp-1(a, b)
(a) RCC-8 Primitives
dc ec poeq
tpp ntpp
ntpp-1tpp-1
(b) RCC-8 ContinuityStructure
1
3
2
5
7
0 76
51
0
4
4A
B
(c) The OPRA2 re-lation A 2∠1
7 B
Fig. 1: Topological and orientation primitives.
connection calculus. Figure 1(a) is a 2D illustration of the topological relation-ships that constitute the RCC-8 fragment.
2.3 Orientation and the OPRAm Calculus
Orientation information is essential for describing and navigating in spatial con-figurations. For representing relative orientation in recent years many differentcalculi have been presented, e.g., the DoubleCross Calculus[16] and the DipoleCalculus [34]. Here, we apply the OPRAm approach [29] because of its expres-siveness [10]. The calculi in this family are designed for reasoning about relativeorientation relations between oriented points (points in the plane with an addi-tional direction parameter) and are well-suited for dealing with objects that havean intrinsic front or move in a particular direction. An oriented point O can bedescribed by its Cartesian coordinates xO, yO ∈ R and a direction φO ∈ [0, 2π)with respect to an absolute frame of reference. With the parameter m the angularresolution can be influenced, i.e., the number of base relations is determined.
In the case of OPRA2, the orientation calculus we apply in our examples, foreach pair of oriented points, 2 lines are used to partition the plane into 4 planarand 4 linear regions (see Fig. 1(c)). The orientation of the two points is depictedby the arrows starting at A and B, respectively. The regions are numberedfrom 0 to 7, where region 0 always coincides with the orientation of the point.An OPRA2 base relation is a pair (i, j), where i is the number of the region,seen from A, that contains B and j vice versa. These relations are written asA 2∠j
i B. Additional base relations describe situations in which both orientedpoints are at the same position but may have different orientations ( m∠i ).
3 Ontological Formalization for Scene Descriptions
We present a modular specification of ontologies for incorporating the multi-dimensional perspectives in smart environment design. In particular, the differentthematic aspects of the domain are reflected by connected modules. We brieflyintroduce ontological formalization aspects followed by the specification of anontological scene description for smart environments.
3.1 Ontological Specification and Reasoning
Although ontologies can be defined in any logic, we focus here on ontologies astheories formulated in DL [2], supported by the web ontology language OWL DL2 [30]. DL distinguishes between TBox and ABox. The TBox comprises all classand relation definitions, while the ABox comprises all instantiations of theseclasses and relations. Even though ontologies may be formulated in more or less
34
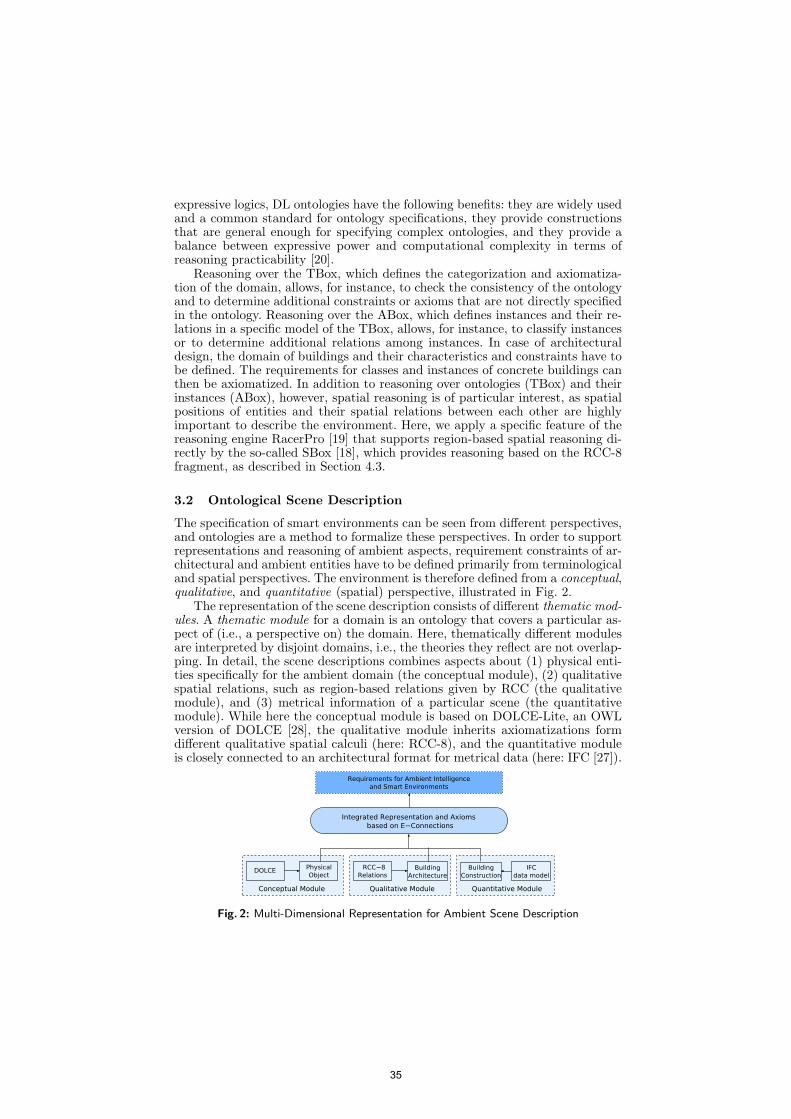
expressive logics, DL ontologies have the following benefits: they are widely usedand a common standard for ontology specifications, they provide constructionsthat are general enough for specifying complex ontologies, and they provide abalance between expressive power and computational complexity in terms ofreasoning practicability [20].
Reasoning over the TBox, which defines the categorization and axiomatiza-tion of the domain, allows, for instance, to check the consistency of the ontologyand to determine additional constraints or axioms that are not directly specifiedin the ontology. Reasoning over the ABox, which defines instances and their re-lations in a specific model of the TBox, allows, for instance, to classify instancesor to determine additional relations among instances. In case of architecturaldesign, the domain of buildings and their characteristics and constraints have tobe defined. The requirements for classes and instances of concrete buildings canthen be axiomatized. In addition to reasoning over ontologies (TBox) and theirinstances (ABox), however, spatial reasoning is of particular interest, as spatialpositions of entities and their spatial relations between each other are highlyimportant to describe the environment. Here, we apply a specific feature of thereasoning engine RacerPro [19] that supports region-based spatial reasoning di-rectly by the so-called SBox [18], which provides reasoning based on the RCC-8fragment, as described in Section 4.3.
3.2 Ontological Scene Description
The specification of smart environments can be seen from different perspectives,and ontologies are a method to formalize these perspectives. In order to supportrepresentations and reasoning of ambient aspects, requirement constraints of ar-chitectural and ambient entities have to be defined primarily from terminologicaland spatial perspectives. The environment is therefore defined from a conceptual,qualitative, and quantitative (spatial) perspective, illustrated in Fig. 2.
The representation of the scene description consists of different thematic mod-ules. A thematic module for a domain is an ontology that covers a particular as-pect of (i.e., a perspective on) the domain. Here, thematically different modulesare interpreted by disjoint domains, i.e., the theories they reflect are not overlap-ping. In detail, the scene descriptions combines aspects about (1) physical enti-ties specifically for the ambient domain (the conceptual module), (2) qualitativespatial relations, such as region-based relations given by RCC (the qualitativemodule), and (3) metrical information of a particular scene (the quantitativemodule). While here the conceptual module is based on DOLCE-Lite, an OWLversion of DOLCE [28], the qualitative module inherits axiomatizations formdifferent qualitative spatial calculi (here: RCC-8), and the quantitative moduleis closely connected to an architectural format for metrical data (here: IFC [27]).
Building
Construction
Physical
Object
Requirements for Ambient Intelligence
and Smart Environments
Quantitative Module
DOLCE
Integrated Representation and Axioms
based on E−Connections
Conceptual Module
Building
Architecture
RCC−8
Relations
Qualitative Module
IFC
data model
Fig. 2: Multi-Dimensional Representation for Ambient Scene Description
35
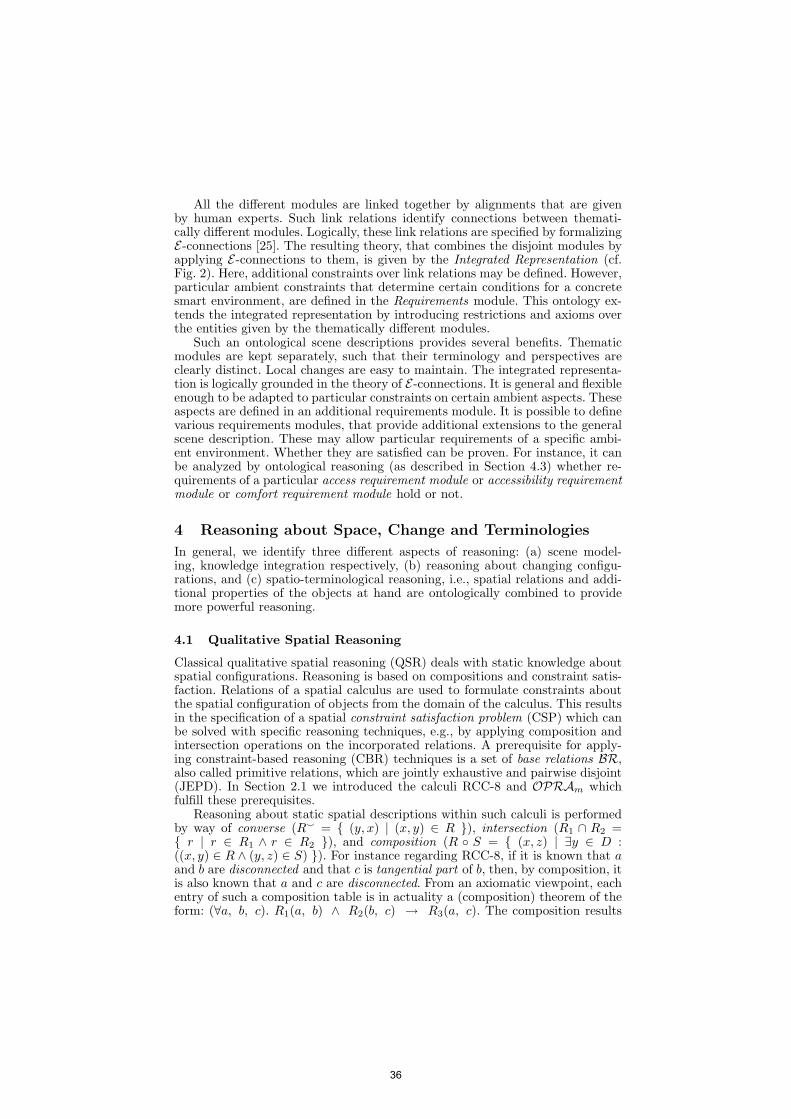
All the different modules are linked together by alignments that are givenby human experts. Such link relations identify connections between themati-cally different modules. Logically, these link relations are specified by formalizingE-connections [25]. The resulting theory, that combines the disjoint modules byapplying E-connections to them, is given by the Integrated Representation (cf.Fig. 2). Here, additional constraints over link relations may be defined. However,particular ambient constraints that determine certain conditions for a concretesmart environment, are defined in the Requirements module. This ontology ex-tends the integrated representation by introducing restrictions and axioms overthe entities given by the thematically different modules.
Such an ontological scene descriptions provides several benefits. Thematicmodules are kept separately, such that their terminology and perspectives areclearly distinct. Local changes are easy to maintain. The integrated representa-tion is logically grounded in the theory of E-connections. It is general and flexibleenough to be adapted to particular constraints on certain ambient aspects. Theseaspects are defined in an additional requirements module. It is possible to definevarious requirements modules, that provide additional extensions to the generalscene description. These may allow particular requirements of a specific ambi-ent environment. Whether they are satisfied can be proven. For instance, it canbe analyzed by ontological reasoning (as described in Section 4.3) whether re-quirements of a particular access requirement module or accessibility requirementmodule or comfort requirement module hold or not.
4 Reasoning about Space, Change and Terminologies
In general, we identify three different aspects of reasoning: (a) scene model-ing, knowledge integration respectively, (b) reasoning about changing configu-rations, and (c) spatio-terminological reasoning, i.e., spatial relations and addi-tional properties of the objects at hand are ontologically combined to providemore powerful reasoning.
4.1 Qualitative Spatial Reasoning
Classical qualitative spatial reasoning (QSR) deals with static knowledge aboutspatial configurations. Reasoning is based on compositions and constraint satis-faction. Relations of a spatial calculus are used to formulate constraints aboutthe spatial configuration of objects from the domain of the calculus. This resultsin the specification of a spatial constraint satisfaction problem (CSP) which canbe solved with specific reasoning techniques, e.g., by applying composition andintersection operations on the incorporated relations. A prerequisite for apply-ing constraint-based reasoning (CBR) techniques is a set of base relations BR,also called primitive relations, which are jointly exhaustive and pairwise disjoint(JEPD). In Section 2.1 we introduced the calculi RCC-8 and OPRAm whichfulfill these prerequisites.
Reasoning about static spatial descriptions within such calculi is performedby way of converse (R` = { (y, x) | (x, y) ∈ R }), intersection (R1 ∩ R2 ={ r | r ∈ R1 ∧ r ∈ R2 }), and composition (R ◦ S = { (x, z) | ∃y ∈ D :((x, y) ∈ R ∧ (y, z) ∈ S) }). For instance regarding RCC-8, if it is known that aand b are disconnected and that c is tangential part of b, then, by composition, itis also known that a and c are disconnected. From an axiomatic viewpoint, eachentry of such a composition table is in actuality a (composition) theorem of theform: (∀a, b, c). R1(a, b) ∧ R2(b, c) → R3(a, c). The composition results
36
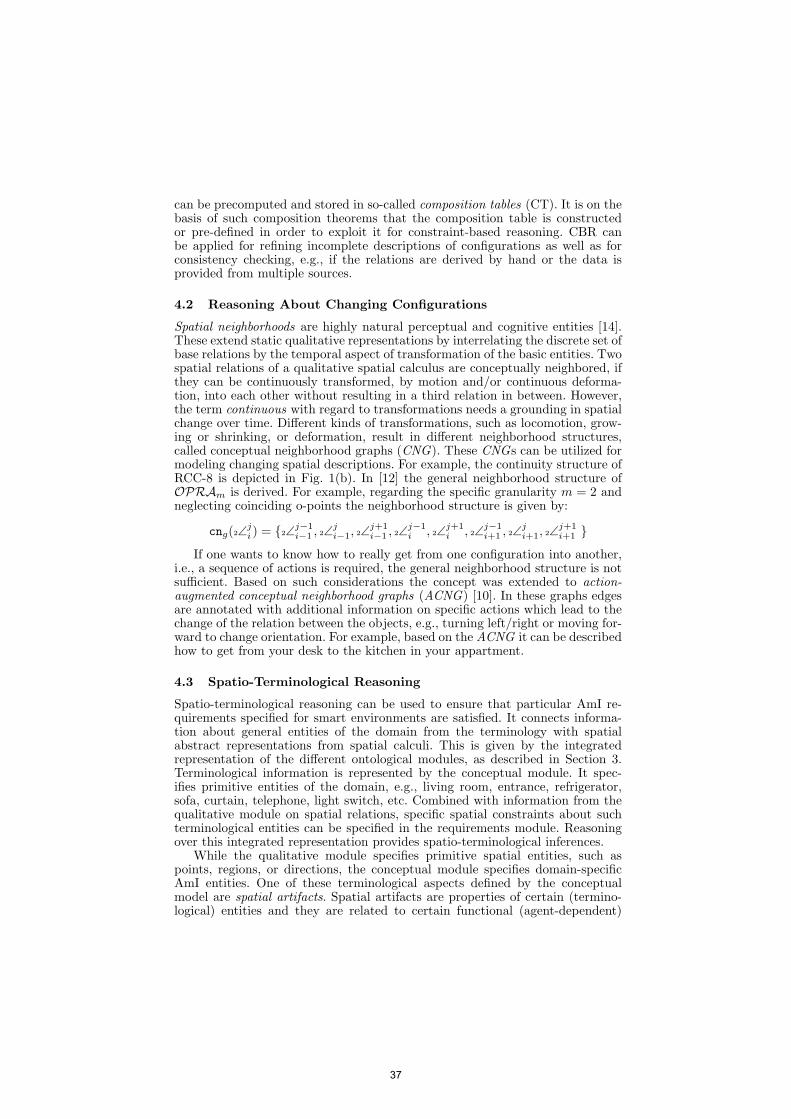
can be precomputed and stored in so-called composition tables (CT). It is on thebasis of such composition theorems that the composition table is constructedor pre-defined in order to exploit it for constraint-based reasoning. CBR canbe applied for refining incomplete descriptions of configurations as well as forconsistency checking, e.g., if the relations are derived by hand or the data isprovided from multiple sources.
4.2 Reasoning About Changing Configurations
Spatial neighborhoods are highly natural perceptual and cognitive entities [14].These extend static qualitative representations by interrelating the discrete set ofbase relations by the temporal aspect of transformation of the basic entities. Twospatial relations of a qualitative spatial calculus are conceptually neighbored, ifthey can be continuously transformed, by motion and/or continuous deforma-tion, into each other without resulting in a third relation in between. However,the term continuous with regard to transformations needs a grounding in spatialchange over time. Different kinds of transformations, such as locomotion, grow-ing or shrinking, or deformation, result in different neighborhood structures,called conceptual neighborhood graphs (CNG). These CNGs can be utilized formodeling changing spatial descriptions. For example, the continuity structure ofRCC-8 is depicted in Fig. 1(b). In [12] the general neighborhood structure ofOPRAm is derived. For example, regarding the specific granularity m = 2 andneglecting coinciding o-points the neighborhood structure is given by:
cng(2∠ji ) = {2∠j−1
i−1 , 2∠ji−1, 2∠
j+1i−1 , 2∠
j−1i , 2∠j+1
i , 2∠j−1i+1 , 2∠
ji+1, 2∠
j+1i+1 }
If one wants to know how to really get from one configuration into another,i.e., a sequence of actions is required, the general neighborhood structure is notsufficient. Based on such considerations the concept was extended to action-augmented conceptual neighborhood graphs (ACNG) [10]. In these graphs edgesare annotated with additional information on specific actions which lead to thechange of the relation between the objects, e.g., turning left/right or moving for-ward to change orientation. For example, based on the ACNG it can be describedhow to get from your desk to the kitchen in your appartment.
4.3 Spatio-Terminological Reasoning
Spatio-terminological reasoning can be used to ensure that particular AmI re-quirements specified for smart environments are satisfied. It connects informa-tion about general entities of the domain from the terminology with spatialabstract representations from spatial calculi. This is given by the integratedrepresentation of the different ontological modules, as described in Section 3.Terminological information is represented by the conceptual module. It spec-ifies primitive entities of the domain, e.g., living room, entrance, refrigerator,sofa, curtain, telephone, light switch, etc. Combined with information from thequalitative module on spatial relations, specific spatial constraints about suchterminological entities can be specified in the requirements module. Reasoningover this integrated representation provides spatio-terminological inferences.
While the qualitative module specifies primitive spatial entities, such aspoints, regions, or directions, the conceptual module specifies domain-specificAmI entities. One of these terminological aspects defined by the conceptualmodel are spatial artifacts. Spatial artifacts are properties of certain (termino-logical) entities and they are related to certain functional (agent-dependent)
37
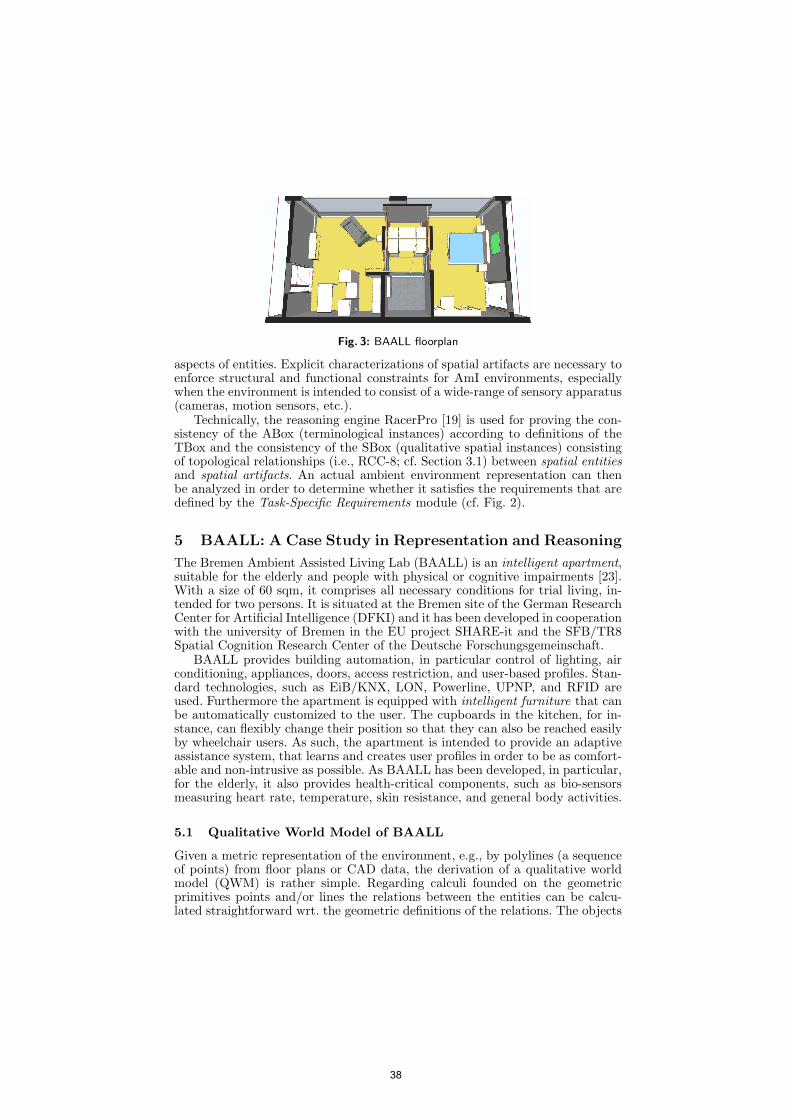
Fig. 3: BAALL floorplan
aspects of entities. Explicit characterizations of spatial artifacts are necessary toenforce structural and functional constraints for AmI environments, especiallywhen the environment is intended to consist of a wide-range of sensory apparatus(cameras, motion sensors, etc.).
Technically, the reasoning engine RacerPro [19] is used for proving the con-sistency of the ABox (terminological instances) according to definitions of theTBox and the consistency of the SBox (qualitative spatial instances) consistingof topological relationships (i.e., RCC-8; cf. Section 3.1) between spatial entitiesand spatial artifacts. An actual ambient environment representation can thenbe analyzed in order to determine whether it satisfies the requirements that aredefined by the Task-Specific Requirements module (cf. Fig. 2).
5 BAALL: A Case Study in Representation and Reasoning
The Bremen Ambient Assisted Living Lab (BAALL) is an intelligent apartment,suitable for the elderly and people with physical or cognitive impairments [23].With a size of 60 sqm, it comprises all necessary conditions for trial living, in-tended for two persons. It is situated at the Bremen site of the German ResearchCenter for Artificial Intelligence (DFKI) and it has been developed in cooperationwith the university of Bremen in the EU project SHARE-it and the SFB/TR8Spatial Cognition Research Center of the Deutsche Forschungsgemeinschaft.
BAALL provides building automation, in particular control of lighting, airconditioning, appliances, doors, access restriction, and user-based profiles. Stan-dard technologies, such as EiB/KNX, LON, Powerline, UPNP, and RFID areused. Furthermore the apartment is equipped with intelligent furniture that canbe automatically customized to the user. The cupboards in the kitchen, for in-stance, can flexibly change their position so that they can also be reached easilyby wheelchair users. As such, the apartment is intended to provide an adaptiveassistance system, that learns and creates user profiles in order to be as comfort-able and non-intrusive as possible. As BAALL has been developed, in particular,for the elderly, it also provides health-critical components, such as bio-sensorsmeasuring heart rate, temperature, skin resistance, and general body activities.
5.1 Qualitative World Model of BAALL
Given a metric representation of the environment, e.g., by polylines (a sequenceof points) from floor plans or CAD data, the derivation of a qualitative worldmodel (QWM) is rather simple. Regarding calculi founded on the geometricprimitives points and/or lines the relations between the entities can be calcu-lated straightforward wrt. the geometric definitions of the relations. The objects
38
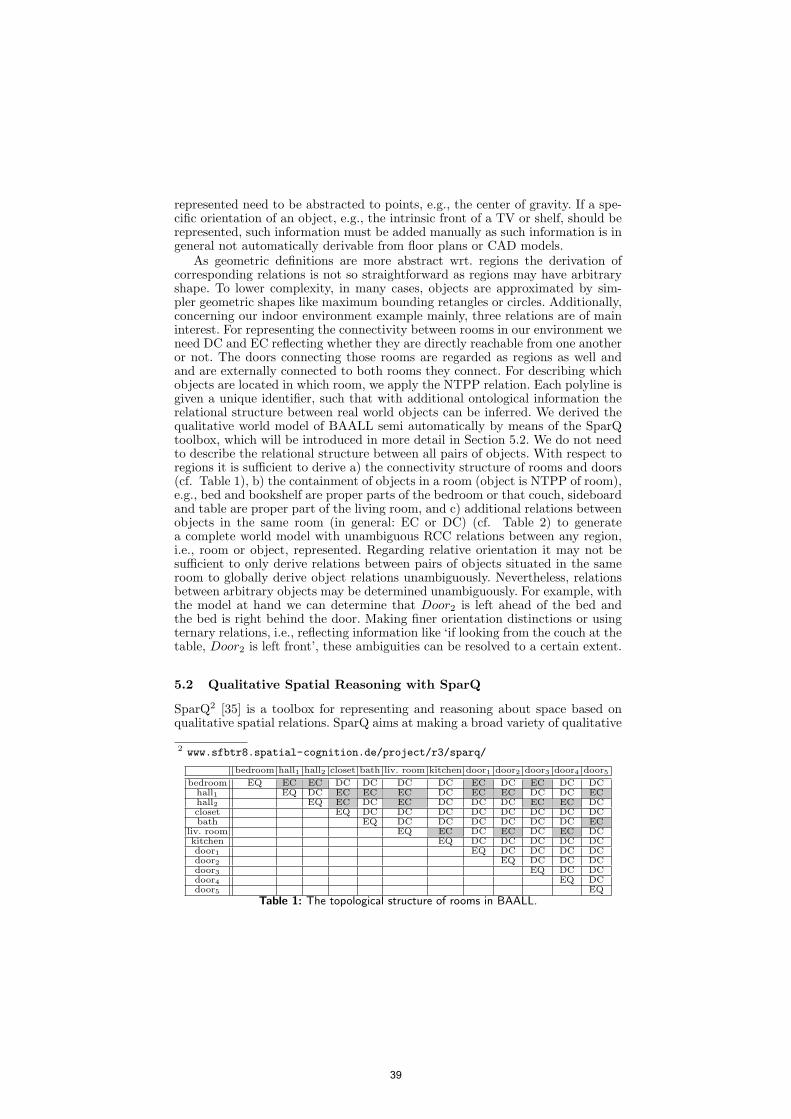
represented need to be abstracted to points, e.g., the center of gravity. If a spe-cific orientation of an object, e.g., the intrinsic front of a TV or shelf, should berepresented, such information must be added manually as such information is ingeneral not automatically derivable from floor plans or CAD models.
As geometric definitions are more abstract wrt. regions the derivation ofcorresponding relations is not so straightforward as regions may have arbitraryshape. To lower complexity, in many cases, objects are approximated by sim-pler geometric shapes like maximum bounding retangles or circles. Additionally,concerning our indoor environment example mainly, three relations are of maininterest. For representing the connectivity between rooms in our environment weneed DC and EC reflecting whether they are directly reachable from one anotheror not. The doors connecting those rooms are regarded as regions as well andand are externally connected to both rooms they connect. For describing whichobjects are located in which room, we apply the NTPP relation. Each polyline isgiven a unique identifier, such that with additional ontological information therelational structure between real world objects can be inferred. We derived thequalitative world model of BAALL semi automatically by means of the SparQtoolbox, which will be introduced in more detail in Section 5.2. We do not needto describe the relational structure between all pairs of objects. With respect toregions it is sufficient to derive a) the connectivity structure of rooms and doors(cf. Table 1), b) the containment of objects in a room (object is NTPP of room),e.g., bed and bookshelf are proper parts of the bedroom or that couch, sideboardand table are proper part of the living room, and c) additional relations betweenobjects in the same room (in general: EC or DC) (cf. Table 2) to generatea complete world model with unambiguous RCC relations between any region,i.e., room or object, represented. Regarding relative orientation it may not besufficient to only derive relations between pairs of objects situated in the sameroom to globally derive object relations unambiguously. Nevertheless, relationsbetween arbitrary objects may be determined unambiguously. For example, withthe model at hand we can determine that Door2 is left ahead of the bed andthe bed is right behind the door. Making finer orientation distinctions or usingternary relations, i.e., reflecting information like ‘if looking from the couch at thetable, Door2 is left front’, these ambiguities can be resolved to a certain extent.
5.2 Qualitative Spatial Reasoning with SparQ
SparQ2 [35] is a toolbox for representing and reasoning about space based onqualitative spatial relations. SparQ aims at making a broad variety of qualitative
2 www.sfbtr8.spatial-cognition.de/project/r3/sparq/
bedroom hall1 hall2 closet bath liv. room kitchen door1 door2 door3 door4 door5
bedroom EQ EC EC DC DC DC DC EC DC EC DC DChall1 EQ DC EC EC EC DC EC EC DC DC EChall2 EQ EC DC EC DC DC DC EC EC DCcloset EQ DC DC DC DC DC DC DC DCbath EQ DC DC DC DC DC DC EC
liv. room EQ EC DC EC DC EC DCkitchen EQ DC DC DC DC DCdoor1 EQ DC DC DC DCdoor2 EQ DC DC DCdoor3 EQ DC DCdoor4 EQ DCdoor5 EQ
Table 1: The topological structure of rooms in BAALL.
39

bed bshelf bst1 bst2 couch sb table door1 door2
bed EQ,2∠0 DC,2∠17 EC,2∠7
3 EC,2∠15 DC,2∠7
7bshelf EQ,2∠0 DC,2∠7
1 DC,2∠71
bst1 EQ,2∠0 DC,2∠26
bst2 EQ,2∠0
couch EQ,2∠0 DC,2∠71 DC,2∠1
7 DC,2∠15
sb EQ,2∠0 DC,2∠71 DC,2∠1
1table EQ,2∠0 DC,2∠7
1door1 EQ,2∠0 DC,2∠4
4door2 EQ,2∠0
Table 2: Topological and relative orientation (OPRAm) relations between objects inthe same room.
spatial calculi and the developed reasoning techniques available in a single ho-mogeneous framework. SparQ is designed for application designers or researchersnot familiar with qualitative reasoning, as well as QSR researchers. For the firstgroup SparQ offers access to reasoning techniques without further effort in aneasy-to-use manner. For the second group SparQ provides an implementationtoolbox of key techniques in QSR, making experimental analysis easier. Further-more, SparQ offers an easy format to specify new calculi. The toolbox is releasedunder the GPL license for freely available software and can easily be includedinto applications.
Currently, three main features are available: qualification, fundamental re-lation transformations, and constraint-based reasoning. The integration of con-ceptual neighborhood-based reasoning is currently in progress. We applied thequalification feature for deriving the qualitative world model of BAALL (cf. Sec-tion 5.1). To qualify metrical data by SparQ with respect to a given calculus,e.g., OPRA2, the positions as well as the orientations must be provided. In theexample below we relate the bed, the bookshelf, and the door to the room repre-sented by their centres of gravity. The result from SparQ represents the relations2∠7
1 , 2∠11 , and 2∠7
1 .
$> sparq qualify opra-2 all ”((BED 255 210 1 0)(BSHELF 319 462 0 -1 )(DOOR 420 270 -1 0))”((BED 1 7 BSHELF) (BED 1 1 DOOR) (BSHELF 1 7 DOOR) )
Constraint-based reasoning can be applied to check consitsency of qualitativeworld models or to complete partially defined models, e.g., the missing topolog-ical relations between bed, couch, living room, and bedroom:
$> sparq constraint-reasoning rcc-8 algebraic-closure ”((BEDROOM DC LIVROOM)(BEDNTPP BEDROOM)(COUCH NTPP LIVROOM)”((BED (dc) COUCH)(LIVROOM (ntppi) COUCH)(LIVROOM (dc) BED)(BEDROOM (dc)COUCH)(BEDROOM (ntppi) BED)(BEDROOM (dc) LIVROOM))
5.3 Spatio-Terminological Reasoning with RacerPro
The environment of BAALL is instantiated by the ontological scene descriptionaccording to Section 3. The different entities are formalized in the conceptualmodule ABox, such as Kitchen, LivingRoom, Sofa, and Camera. The conceptualmodule also indicates, whether an entity has to define spatial artifacts. Thesofa, for instance, defines a functional space, i.e., the space an agent has to belocated in, in order to interact with it for a specific function (e.g., sitting). Thecamera, for instance, defines a range space, i.e., the area it can monitor.
Corresponding spatial regions of the conceptual module are mirrored in thequalitative module SBox, and spatial dependencies based on RCC-8 relationsare specified. RacerPro not only proves the formal consistency of the BAALL
40
model. It also allows to verify that certain pre-defined AmI requirements aresatisfied. They are formalized in the requirements module as an extension to theintegrated representation. For an AmI environment, for instance, it is necessarythat the entrance door is monitored by some camera, in order to ensure thatvisitors are tracked, i.e., no unauthorized person may enter the apartment:
Class: FrontDoor FunctionalSpaceSubClassOf: FunctionalSpace, rcc:properPartOf some (MotionSensor RangeSpace), ...
Whether BAALL satisfies this constraint is automatically proven with ana-lyzing ABox and SBox consistency by applying RacerPro for spatio-terminologicalreasoning. It can also be illustrated by the following query, which indicates thecombination of the SBox (?*X) and ABox (?X):
? (retrieve (?*X ?*Y) (and (?X FrontDoor FunctionalSpace)(?Y MotionSensor RangeSpace) not (?*X ?*Y :NTPP)))
> NIL
6 Summary and Challenges
We have presented an overview of different approaches from the field of qualita-tive spatial reasoning and formal ontology and the manner in which they maybe applied for representation and reasoning purposes in ambient intelligence sys-tems. Qualitative spatial descriptions can assist in formalizing essential spatialrelations and their compositions. Ontological descriptions can assist in formal-izing essential AmI entities and artifacts. Reasoning with both descriptions canprove spatial consistency and domain-specific requirements. In particular, qual-itative spatial and terminological reasoning can be applied to specific AmI usecases, such as the ones resembling the BAALL environment discussed in this pa-per. There are, however, different challenging research questions left for futurework, as we point out in the sections to follow.
6.1 Ontologies and AmI
The AmI-related ontology aspects, pointed out in Sections 3 and 4.3, have tobe investigated in more detail. It will be up to future work, whether the the-ory of E-connections is expressive enough to define integrations of all differentmodules, that will be necessary to describe scenes of any kind in AmI. Generalmodularity aspects [22] from the field of ontological engineering may have to beinvestigated, given domain-specific modeling issues with respect to smart envi-ronments. On a more fine-grained level, specific (domain-dependent) ontologieshave to be developed to cover a wide range of different aspects necessary to for-malize AmI aspects. For instance, a thorough specification of different sensorsand their properties have to be analyzed together with their link relations toother ontologies from the integrated representation. This will also result in amore thorough scene description ontology to model ambient environments.
One of the general ontological challenges, which affect AmI ontologies, isthe specification of processes in ontologies. Bridging the gap between highlyexpressive ontological definitions of actions and activities, such as the ProcessSpecification Language [33], and computational complexity in terms of reasoningpracticability will be a challenging task here. Moreover, particular processesin smart environments will be of interest. Strongly connected to these activity
41

formalizations is the ontological integration of the temporal dimension in general.Furthermore, the combination of spatial and ontological reasoning in general isan important next step. It is up to future research, how a flexible and loosecoupling of the different reasoning techniques, similar to the one supported byE-connections (Section 3.2), will be specified. And, more importantly, its impacton the design of smart environments and its conformity with existing industrial/ architectural standards and design tools then has to be analyzed.
6.2 Space, Interaction and Change
One fundamental research question pertains to the integration of spatial calculifor scene modelling. Presently, it is not possible to reason over different aspectsof space, i.e., , for example, either in the domain of oriented points or in thedomain of regions, or even over different granularities within the same spatialaspect. Although, there is already effort in the QSR community to overcome suchlimitations and extend calculus expressivity, the research in this direction needsto be strengthened. For example, in [11] transformations between point-based, o-point-based, and line-based calculi dealing with relative information were definedand investigated. A unified approach of representing points, lines and regions ispresented in [24]. An approach by [6] combines regions and orientations in aternary projective calculus for regions. The position of one region is describedwith respect to two other regions, and this position is given by five collinearityregions, which result in five projective relations.
At an application level, the simulation of the spatial interaction betweeensubjects and smart artefacts within an ambient environment is a topic that di-rectly benefits by the formal modelling of spatial and terminological knowledge,and the spatio-terminological reasoning tasks that it facilitates. For instance,spatial, terminological and spatio-terminological reasoning, in the manner assuggested in Section 4.3 (and elaborated in [5]) may be used to model functionalrequirements at the design stage, whereupon a design may be actually simulatedwithin a virtual reality setup (e.g., [26]) to visualize and simulate the impact ofthe spatio-terminological (functional) constraints on the work-in-progress design.Closely related to the topic of such simulation is the task of motion pattern ab-straction for activitiy analysis and interpretation. In recent years different quan-titative approaches to derive motion patterns from sensor data were presented,e.g., an approach based on expectation maximization and Hidden Markov Models[3]. From our perspective such models are helpful for machine-machine interac-tion, but not very helpful for human-machine interaction and action analysis,behavior interpretation respectively. With action-augmented conceptual neigh-borhoods (Section 4.2), motion evaluation is possible at a high-level of abstrac-tion, if data in a suitable form is available. We believe that the combination ofboth methods will improve systems on behavior monitoring and interpretationin specific, and ambient intelligence systems is parrticular.
Acknowledgements: We gratefully acknowledge the financial support of the DFGthrough the Collaborative Research Center SFB/TR 8, projects R3-[Q-Shape]and I1-[OntoSpace]. Additionally, M. Bhatt also acknowledges funding by the Alexan-der von Humboldt Stiftung, Germany.
Bibliography[1] J. C. Augusto and C. D. Nugent, editors. Designing Smart Homes, The Role of Artificial
Intelligence, volume 4008 of LNCS. Springer, 2006.[2] F. Baader, D. Calvanese, D. McGuinness, D. Nardi, and P. Patel-Schneider. The Description
Logic Handbook. Cambridge University Press, 2003.
42
[3] M. Bennewitz, W. Burgard, G. Cielniak, and S. Thrun. Learning motion patterns of people forcompliant robot motion. International Journal of Robotics Research, 24(1), 2005.
[4] M. Bhatt and F. Dylla. A qualitative model of dynamic scene analysis and interpretationin ambient intelligence systems. Int. Journal of Robotics and Automation: Special Issue onRobotics for Ambient Intelligence, 2009, to appear.
[5] M. Bhatt, F. Dylla, and J. Hois. Spatio-terminological inference for the design of ambientenvironments, 2009. COSIT 2009, France (to appear).
[6] R. Billen and E. Clementini. A model for ternary projective relations between regions. InE. Bertino, S. Christodoulakis, D. Plexousakis, V. Christophides, M. Koubarakis, K. Bhm, andE. Ferrari, editors, 9th Int. Conf. on Extending Database Technology, volume 2992 of LNCS,pages 310–328. Springer, 2004.
[7] B. L. Clarke. Individuals and points. Notre Dame Journal of Formal Logic, 26(1):61–75, 1985.[8] B. L. Clarke. A calculus of individuals based on ‘connection’. Notre Dame Journal of Formal
Logic, 22(3):204–218, 1991.[9] A. Cohn and S. Hazarika. Qualitative spatial representation and reasoning: An overview. Fun-
dam. Inf., 46(1-2):1–29, 2001.[10] F. Dylla. An Agent Control Perspective on Qualitative Spatial Reasoning, volume 320
of DISKI. Akademische Verlagsgesellschaft Aka GmbH (IOS Press); Heidelberg, Germany;http://www.infix.com/, 2008.
[11] F. Dylla and J. O. Wallgrun. On generalizing orientation information in pra. In C. Freksa,M. Kohlhase, and K. Schill, editors, 29th Annual German Conference on AI, volume 4314 ofLNCS, pages 274–288. Springer, 2006.
[12] F. Dylla and J. O. Wallgrun. Qualitative spatial reasoning with conceptual neighborhoods foragent control. Journal of Intelligent and Robotic Systems, 48(1):55–78, 2007.
[13] M. J. Egenhofer and R. D. Franzosa. Point Set Topological Relations. Int. Journal of Geo-graphical Information Systems, 5(2):161–174, 1991.
[14] C. Freksa. Conceptual neighborhood and its role in temporal and spatial reasoning. In Proc.of the IMACS Workshop on Decision Support Systems and Qualitative Reasoning, pages181–187, Amsterdam, 1991. Elsevier.
[15] C. Freksa. Qualitative spatial reasoning. In Cognitive and linguistic aspects of geographicspace, pages 361–372. Kluwer, 1991.
[16] C. Freksa. Using orientation information for qualitative spatial reasoning. In A. U. Frank,I. Campari, and U. Formentini, editors, Theories and methods of spatio-temporal reasoningin geographic space, pages 162–178. Springer, 1992.
[17] C. Freksa and R. Rohrig. Dimensions of qualitative spatial reasoning. In N. P. Carrete andM. G. Singh, editors, III IMACS Int. Workshop on Qualitative Reasoning and Decision Tech-nologies, pages 483–492, 1993.
[18] V. Haarslev, C. Lutz, and R. Moller. Foundations of spatioterminological reasoning with de-scription logics. In Proc. of 6th Int. Conference on Principles of Knowledge Representationand Reasoning (KR’98), pages 112–123, 1998.
[19] V. Haarslev, R. Moller, and M. Wessel. Querying the semantic web with Racer + nRQL. InProc. of the KI-2004 Int. Workshop on Applications of Description Logics (ADL’04), 2004.
[20] I. Horrocks, O. Kutz, and U. Sattler. The Even More Irresistible SROIQ. In KnowledgeRepresentation and Reasoning (KR). AAAI Press, 2006.
[21] M. Knauff, R. Rauh, and J. Renz. A cognitive assessment of topological spatial relations:Results from an empirical investigation. In Proc. of COSIT ’97, pages 193–206. Springer,1997.
[22] B. Konev, C. Lutz, D. Walther, and F. Wolter. Formal properties of modularisation. In H. Stuck-enschmidt, C. Parent, and S. Spaccapietra, editors, Modular Ontologies. Springer, 2009.
[23] B. Krieg-Bruckner, B. Gersdorf, M. Dohle, and K. Schill. Technology for Seniors to Be in theBremen Ambient Assisted Living Lab. In 2. Deutscher AAL-Kongress. VDE-Verlag, 2009.
[24] Y. Kurata. The 9 + -intersection: A universal framework for modeling topological relations.In GIScience ’08: Proc. of 5th Int. Conference on Geographic Information Science, pages181–198. Springer, 2008.
[25] O. Kutz, C. Lutz, F. Wolter, and M. Zakharyaschev. E-Connections of Abstract DescriptionSystems. Artificial Intelligence, 156(1):1–73, 2004.
[26] J. Lertlakkhanakul, J. W. Choi, and M. Y. Kim. Building data model and simulation platformfor spatial interaction management in smart home. Automation in Construction, 17(8):948 –957, 2008.
[27] T. Liebich, Y. Adachi, J. Forester, J. Hyvarinen, K. Karstila, and J. Wix. Industry FoundationClasses: IFC2x Edition 3 TC1. International Alliance for Interoperability (Model SupportGroup), 2006.
[28] C. Masolo, S. Borgo, A. Gangemi, N. Guarino, and A. Oltramari. Ontologies library. Wonder-Web Deliverable D18, ISTC-CNR, 2003.
[29] R. Moratz. Representing relative direction as a binary relation of oriented points. In G. Brewka,S. Coradeschi, A. Perini, and P. Traverso, editors, ECAI’06, pages 407–411. IOS Press, 2006.
[30] B. Motik, P. F. Patel-Schneider, and B. C. Grau. OWL 2 Web Ontology Language: DirectSemantics. Technical report, W3C, 2008.
[31] D. A. Randell, Z. Cui, and A. Cohn. A spatial logic based on regions and connection. In KR’92,pages 165–176. Morgan Kaufmann, 1992.
[32] J. Renz, R. Rauh, and M. Knauff. Towards cognitive adequacy of topological spatial relations.In Proc. of Spatial Cognition II, pages 184–197. Springer, 2000.
[33] C. Schlenoff, M. Gruninger, F. Tissot, J. Valois, J. Lubell, and J. Lee. The process specifica-tion language (PSL): Overview and version 1.0 specification. Technical Report NISTIR 6459,National Institute of Standards and Technology, 2000.
[34] C. Schlieder. Reasoning about ordering. In Proc. of COSIT’95, volume 988 of LNCS, pages341–349. Springer, 1995.
[35] J. O. Wallgrun, L. Frommberger, D. Wolter, F. Dylla, and C. Freksa. A toolbox for qualitativespatial representation and reasoning. In Proc. of Spatial Cognition V, pages 79–90, Bremen,Germany, 2006.
43
A Continuous-based Model for the Analysis of Indoor Spaces
Xiang Li1, Christophe Claramunt2, Cyril Ray2
1 Key Lab of Geographical Information Science, Ministry of Education,
East China Normal University Shanghai 200062, China
2 Naval Academy Research Institute, Lanvéoc-Poulmic, CC 600, 29240 Brest Cedex 9, France
{christophe.claramunt,cyril.ray}@ecole-navale.fr
Abstract. Recent years have witnessed development of GIS research to ambient and indoor environments. Preliminary studies have been particularly active in the fields of urban planning and architectural design, particularly with the develop-ment of space syntax and ubiquitous computing, and where indoor spaces are of-ten considered as structural and graph-based representations. However, it has been demonstrated that a structural model cannot integrate all the properties of space, and particularly the way a given space is continuously distributed. The ob-jective of the preliminary research presented in this paper is to consider a built environment as a continuous frame of reference, and where an analysis of such continuity is realized using a combination of grid-based and structural-based rep-resentations, thus favoring integration of geometrical and topological properties within a homogeneous framework.
Keywords. Indoor spaces, continuous-based modeling
1 Introduction Over the past few years the range of applications of Geographical Information Science has been progressively extended from large to small scale environments, and for many disciplines beyond the usual scope of environmental and urban sciences. Amongst many factors that have favored this evolution, recent developments of ubiquitous com-puting such as ambient systems have largely favored the application of GIS to indoor spaces (Li, 2008). An indoor space can be informally defined as a large-scale built environment where people are likely to behave, whereas an ambient system or device utilize pre-attentive processing to display information without any apparent human interaction. Several recent applications have illustrated the potential of GIS in indoor spaces. Raubal and Worboys (1999) discussed the elements affecting the process of
44
COSIT 2009
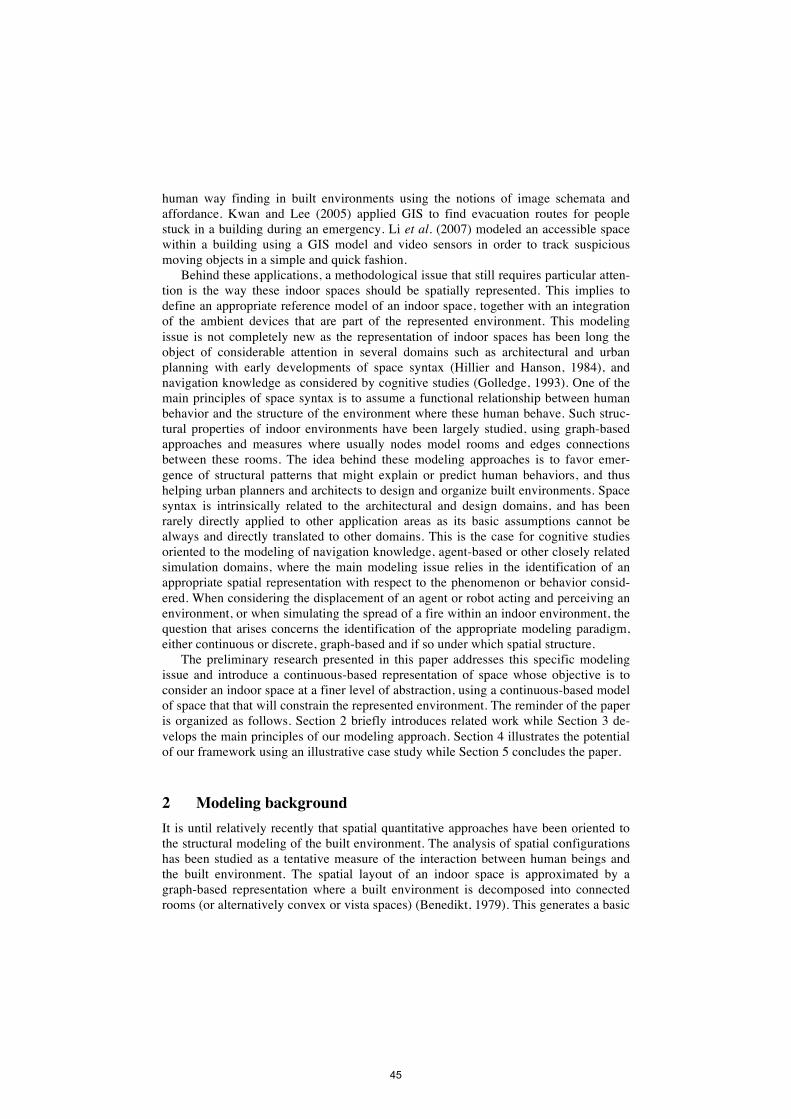
human way finding in built environments using the notions of image schemata and affordance. Kwan and Lee (2005) applied GIS to find evacuation routes for people stuck in a building during an emergency. Li et al. (2007) modeled an accessible space within a building using a GIS model and video sensors in order to track suspicious moving objects in a simple and quick fashion.
Behind these applications, a methodological issue that still requires particular atten-tion is the way these indoor spaces should be spatially represented. This implies to define an appropriate reference model of an indoor space, together with an integration of the ambient devices that are part of the represented environment. This modeling issue is not completely new as the representation of indoor spaces has been long the object of considerable attention in several domains such as architectural and urban planning with early developments of space syntax (Hillier and Hanson, 1984), and navigation knowledge as considered by cognitive studies (Golledge, 1993). One of the main principles of space syntax is to assume a functional relationship between human behavior and the structure of the environment where these human behave. Such struc-tural properties of indoor environments have been largely studied, using graph-based approaches and measures where usually nodes model rooms and edges connections between these rooms. The idea behind these modeling approaches is to favor emer-gence of structural patterns that might explain or predict human behaviors, and thus helping urban planners and architects to design and organize built environments. Space syntax is intrinsically related to the architectural and design domains, and has been rarely directly applied to other application areas as its basic assumptions cannot be always and directly translated to other domains. This is the case for cognitive studies oriented to the modeling of navigation knowledge, agent-based or other closely related simulation domains, where the main modeling issue relies in the identification of an appropriate spatial representation with respect to the phenomenon or behavior consid-ered. When considering the displacement of an agent or robot acting and perceiving an environment, or when simulating the spread of a fire within an indoor environment, the question that arises concerns the identification of the appropriate modeling paradigm, either continuous or discrete, graph-based and if so under which spatial structure.
The preliminary research presented in this paper addresses this specific modeling issue and introduce a continuous-based representation of space whose objective is to consider an indoor space at a finer level of abstraction, using a continuous-based model of space that that will constrain the represented environment. The reminder of the paper is organized as follows. Section 2 briefly introduces related work while Section 3 de-velops the main principles of our modeling approach. Section 4 illustrates the potential of our framework using an illustrative case study while Section 5 concludes the paper.
2 Modeling background It is until relatively recently that spatial quantitative approaches have been oriented to the structural modeling of the built environment. The analysis of spatial configurations has been studied as a tentative measure of the interaction between human beings and the built environment. The spatial layout of an indoor space is approximated by a graph-based representation where a built environment is decomposed into connected rooms (or alternatively convex or vista spaces) (Benedikt, 1979). This generates a basic
45

node-edge representation where nodes represent rooms, and edges connections, such as corridors and doors, between rooms. The assumption of this modeling approach is that there might be a correlation between the structural patterns that emerge from a building layout and the way people occupy and move through space, and social interactions (Hillier and Hanson, 1984). This approach is structural and assumes a close relation-ship between the structure of a built environment and human behaviors within it.
There is no formal theory behind space syntax although many experimental studies have long proven its interest for architectural design and urban planning (Hillier, 1999). The main advantage of space syntax is that it has been easily computationally experi-mented with basic principles and operations long identified by graph theories. Many operators have been applied: local operators that evaluate the connectivity of a given room (e.g., degree) in the emerging network or degrees of clustering, global operators that measure the role played by a given room in the whole network (e.g., centrality and betweenness values). Despite its successful diffusion within the urban planning and architectural design communities, the structural and computational principles of space syntax have been recently criticized with respect to its lack of integration of geometri-cal properties (Ratti, 2004). On the modeling dimension, this indirectly raises an inter-esting issue, that is, the old duality of space, in between feature- and continuous-based perceptions of space. In other words, although a structural representation of space is likely to reveal the main layout and some emerging properties of space, it lacks the continuity and geometrical measures of space that encompass another dimensional range of properties. Space as a continuum is inherent to many phenomena such as the diffusion of physical processes or cognitive perception of the environment, or agent and robotics navigation where the environment is quantitatively measured. Also peo-ple’s behaviors are often non deterministic processes that cannot always be approxi-mated by a structural representation of space.
Alternative solutions have been proposed to consider indoor spaces at a lower level of granularity. Ray et al. (2009) intoduced a fine cell-based modeling for real-time indoor positioning. Each cell is associated with an evolution law (height directions) that represents displacement opportunities. Li et al. (2007) considered an indoor space as a continuous space represented as a graph at a lower level of granularity through filling a cellular unit with additional edges and nodes. Although there is lack of procedure to formalize the filling operation, this provides a sort of compromise, where structural properties might be still encapsulated within the graph-based representation, and where the geometrical properties are implicitly represented by the continuous layout of the graph. The basic idea is of this modeling approach is derived from an occupancy grid which was initially proposed in the communities of mobile robotics and artificial intel-ligence (Moravec and Elfes 1985; Thrun et al. 2005). An occupancy grid is a regular matrix consisting of equally-sized cells, and each cell can be connected to its eight neighboring cells. The surrounding environment of a mobile robot is covered by such kind of grid. Then the movement probability of a robot could be estimated and re-corded. A high probability is assigned to cells within accessible space, while a low probability to cells occupied by obstacles. Simplicity and metric embeddedness are two advantages of the occupancy grid approach (Franz, 2005).
46
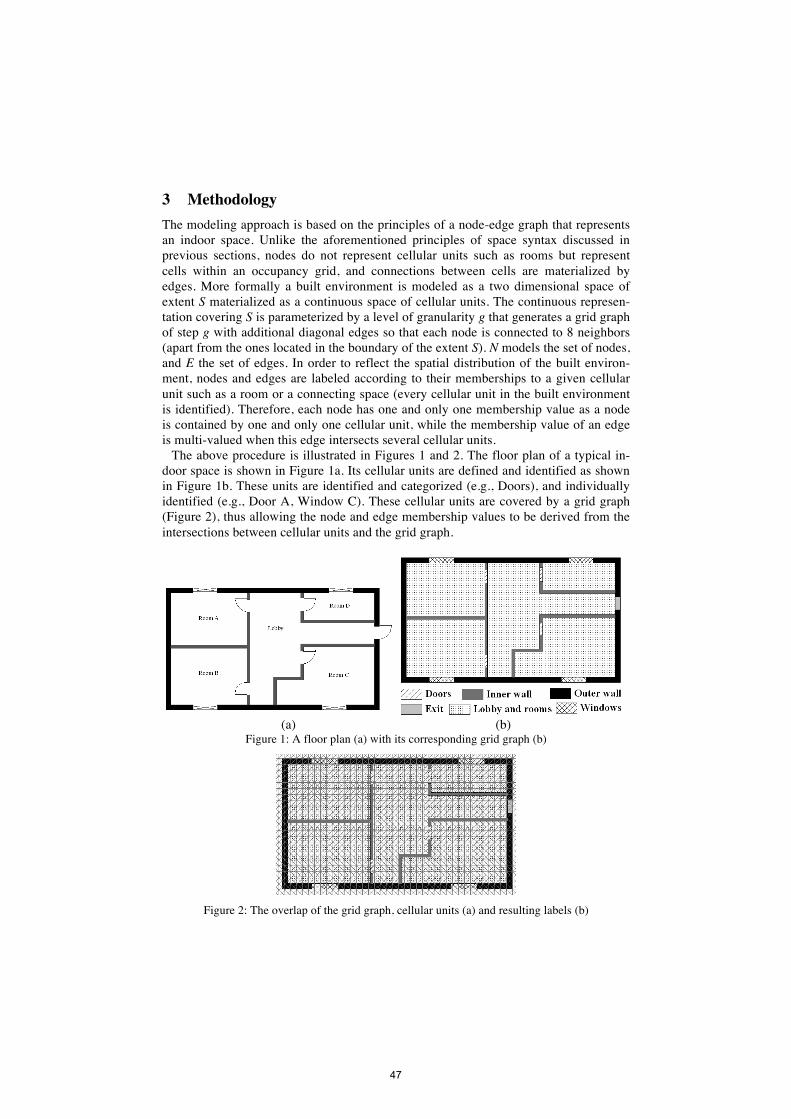
3 Methodology The modeling approach is based on the principles of a node-edge graph that represents an indoor space. Unlike the aforementioned principles of space syntax discussed in previous sections, nodes do not represent cellular units such as rooms but represent cells within an occupancy grid, and connections between cells are materialized by edges. More formally a built environment is modeled as a two dimensional space of extent S materialized as a continuous space of cellular units. The continuous represen-tation covering S is parameterized by a level of granularity g that generates a grid graph of step g with additional diagonal edges so that each node is connected to 8 neighbors (apart from the ones located in the boundary of the extent S). N models the set of nodes, and E the set of edges. In order to reflect the spatial distribution of the built environ-ment, nodes and edges are labeled according to their memberships to a given cellular unit such as a room or a connecting space (every cellular unit in the built environment is identified). Therefore, each node has one and only one membership value as a node is contained by one and only one cellular unit, while the membership value of an edge is multi-valued when this edge intersects several cellular units.
The above procedure is illustrated in Figures 1 and 2. The floor plan of a typical in-door space is shown in Figure 1a. Its cellular units are defined and identified as shown in Figure 1b. These units are identified and categorized (e.g., Doors), and individually identified (e.g., Door A, Window C). These cellular units are covered by a grid graph (Figure 2), thus allowing the node and edge membership values to be derived from the intersections between cellular units and the grid graph.
(a) (b)
Figure 1: A floor plan (a) with its corresponding grid graph (b)
Figure 2: The overlap of the grid graph, cellular units (a) and resulting labels (b)
47
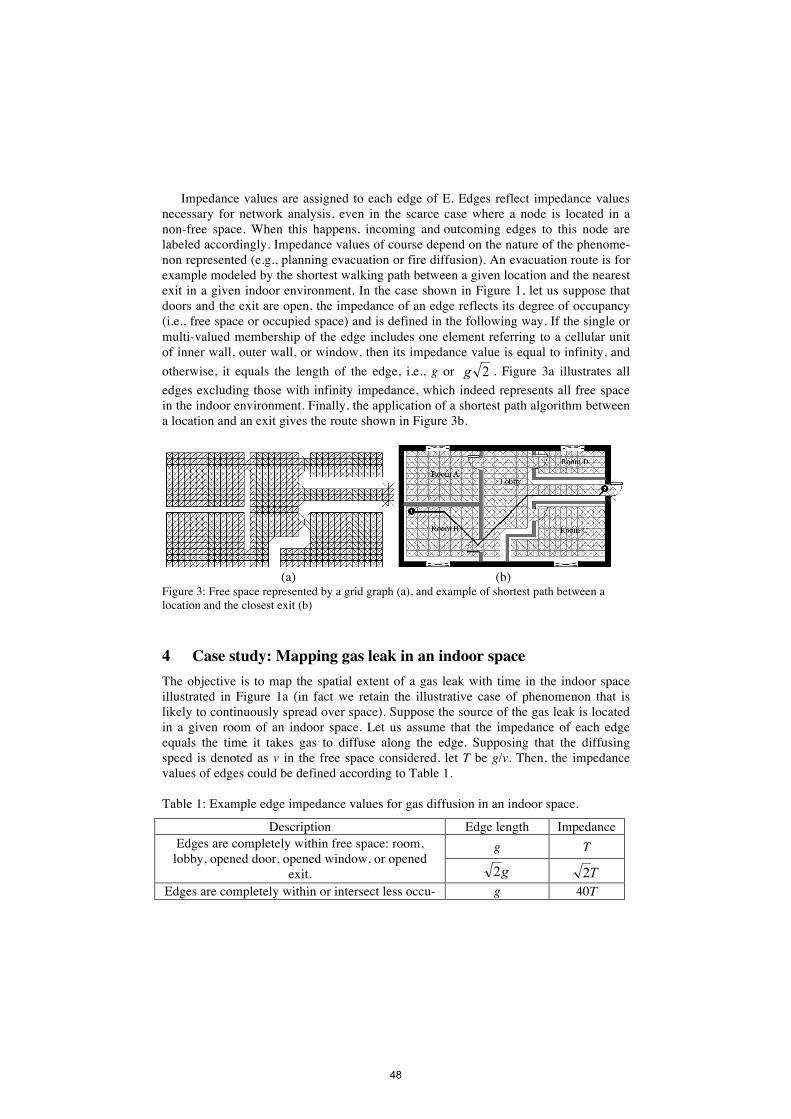
Impedance values are assigned to each edge of E. Edges reflect impedance values necessary for network analysis, even in the scarce case where a node is located in a non-free space. When this happens, incoming and outcoming edges to this node are labeled accordingly. Impedance values of course depend on the nature of the phenome-non represented (e.g., planning evacuation or fire diffusion). An evacuation route is for example modeled by the shortest walking path between a given location and the nearest exit in a given indoor environment. In the case shown in Figure 1, let us suppose that doors and the exit are open, the impedance of an edge reflects its degree of occupancy (i.e., free space or occupied space) and is defined in the following way. If the single or multi-valued membership of the edge includes one element referring to a cellular unit of inner wall, outer wall, or window, then its impedance value is equal to infinity, and otherwise, it equals the length of the edge, i.e., g or . Figure 3a illustrates all edges excluding those with infinity impedance, which indeed represents all free space in the indoor environment. Finally, the application of a shortest path algorithm between a location and an exit gives the route shown in Figure 3b.
(a) (b)
Figure 3: Free space represented by a grid graph (a), and example of shortest path between a location and the closest exit (b)
4 Case study: Mapping gas leak in an indoor space The objective is to map the spatial extent of a gas leak with time in the indoor space illustrated in Figure 1a (in fact we retain the illustrative case of phenomenon that is likely to continuously spread over space). Suppose the source of the gas leak is located in a given room of an indoor space. Let us assume that the impedance of each edge equals the time it takes gas to diffuse along the edge. Supposing that the diffusing speed is denoted as v in the free space considered, let T be g/v. Then, the impedance values of edges could be defined according to Table 1. Table 1: Example edge impedance values for gas diffusion in an indoor space.
Description Edge length Impedance g T Edges are completely within free space: room,
lobby, opened door, opened window, or opened exit.
Edges are completely within or intersect less occu- g 40T
48
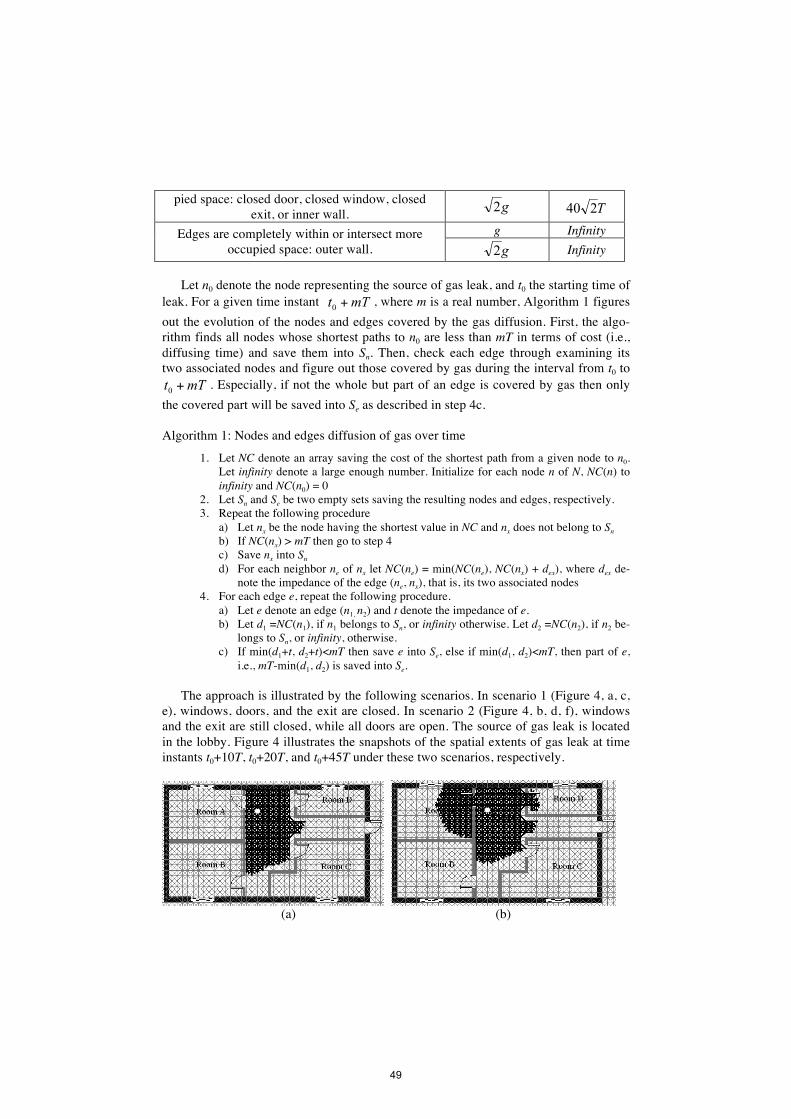
pied space: closed door, closed window, closed exit, or inner wall.
g Infinity Edges are completely within or intersect more occupied space: outer wall. Infinity
Let n0 denote the node representing the source of gas leak, and t0 the starting time of
leak. For a given time instant , where m is a real number, Algorithm 1 figures out the evolution of the nodes and edges covered by the gas diffusion. First, the algo-rithm finds all nodes whose shortest paths to n0 are less than mT in terms of cost (i.e., diffusing time) and save them into Sn. Then, check each edge through examining its two associated nodes and figure out those covered by gas during the interval from t0 to
. Especially, if not the whole but part of an edge is covered by gas then only the covered part will be saved into Se as described in step 4c. Algorithm 1: Nodes and edges diffusion of gas over time
1. Let NC denote an array saving the cost of the shortest path from a given node to n0. Let infinity denote a large enough number. Initialize for each node n of N, NC(n) to infinity and NC(n0) = 0
2. Let Sn and Se be two empty sets saving the resulting nodes and edges, respectively. 3. Repeat the following procedure
a) Let nx be the node having the shortest value in NC and nx does not belong to Sn b) If NC(nx) > mT then go to step 4 c) Save nx into Sn d) For each neighbor ne of nx let NC(ne) = min(NC(ne), NC(nx) + dex), where dex de-
note the impedance of the edge (ne, nx), that is, its two associated nodes 4. For each edge e, repeat the following procedure.
a) Let e denote an edge (n1, n2) and t denote the impedance of e. b) Let d1 =NC(n1), if n1 belongs to Sn, or infinity otherwise. Let d2 =NC(n2), if n2 be-
longs to Sn, or infinity, otherwise. c) If min(d1+t, d2+t)<mT then save e into Se, else if min(d1, d2)<mT, then part of e,
i.e., mT-min(d1, d2) is saved into Se.
The approach is illustrated by the following scenarios. In scenario 1 (Figure 4, a, c, e), windows, doors, and the exit are closed. In scenario 2 (Figure 4, b, d, f), windows and the exit are still closed, while all doors are open. The source of gas leak is located in the lobby. Figure 4 illustrates the snapshots of the spatial extents of gas leak at time instants t0+10T, t0+20T, and t0+45T under these two scenarios, respectively.
(a) (b)
49
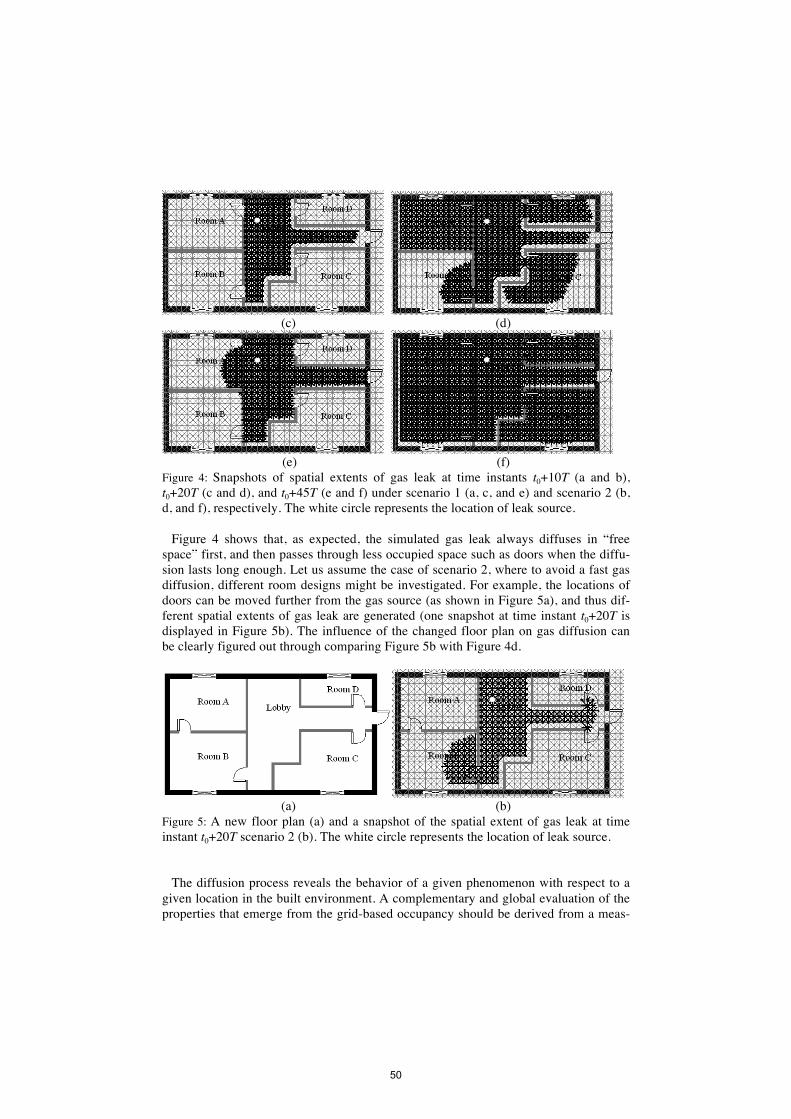
(c) (d)
(e) (f)
Figure 4: Snapshots of spatial extents of gas leak at time instants t0+10T (a and b), t0+20T (c and d), and t0+45T (e and f) under scenario 1 (a, c, and e) and scenario 2 (b, d, and f), respectively. The white circle represents the location of leak source.
Figure 4 shows that, as expected, the simulated gas leak always diffuses in “free space” first, and then passes through less occupied space such as doors when the diffu-sion lasts long enough. Let us assume the case of scenario 2, where to avoid a fast gas diffusion, different room designs might be investigated. For example, the locations of doors can be moved further from the gas source (as shown in Figure 5a), and thus dif-ferent spatial extents of gas leak are generated (one snapshot at time instant t0+20T is displayed in Figure 5b). The influence of the changed floor plan on gas diffusion can be clearly figured out through comparing Figure 5b with Figure 4d.
(a) (b)
Figure 5: A new floor plan (a) and a snapshot of the spatial extent of gas leak at time instant t0+20T scenario 2 (b). The white circle represents the location of leak source.
The diffusion process reveals the behavior of a given phenomenon with respect to a
given location in the built environment. A complementary and global evaluation of the properties that emerge from the grid-based occupancy should be derived from a meas-
50
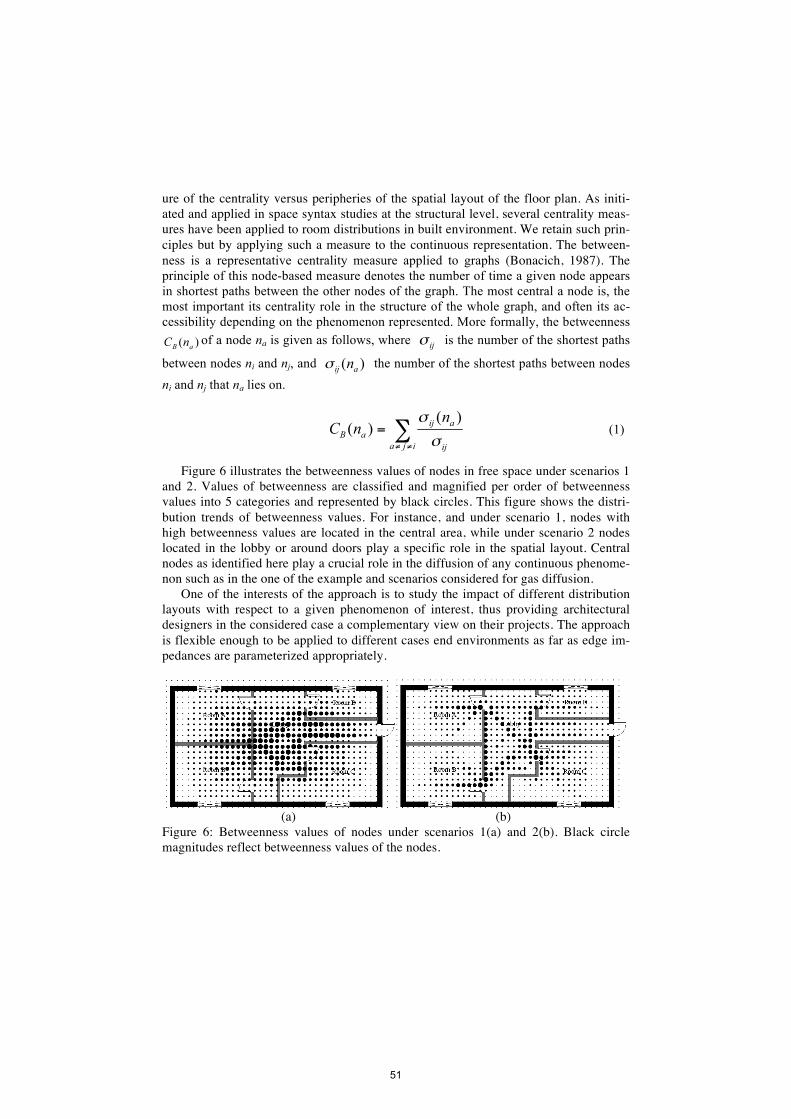
ure of the centrality versus peripheries of the spatial layout of the floor plan. As initi-ated and applied in space syntax studies at the structural level, several centrality meas-ures have been applied to room distributions in built environment. We retain such prin-ciples but by applying such a measure to the continuous representation. The between-ness is a representative centrality measure applied to graphs (Bonacich, 1987). The principle of this node-based measure denotes the number of time a given node appears in shortest paths between the other nodes of the graph. The most central a node is, the most important its centrality role in the structure of the whole graph, and often its ac-cessibility depending on the phenomenon represented. More formally, the betweenness
of a node na is given as follows, where is the number of the shortest paths
between nodes ni and nj, and the number of the shortest paths between nodes ni and nj that na lies on.
(1)
Figure 6 illustrates the betweenness values of nodes in free space under scenarios 1 and 2. Values of betweenness are classified and magnified per order of betweenness values into 5 categories and represented by black circles. This figure shows the distri-bution trends of betweenness values. For instance, and under scenario 1, nodes with high betweenness values are located in the central area, while under scenario 2 nodes located in the lobby or around doors play a specific role in the spatial layout. Central nodes as identified here play a crucial role in the diffusion of any continuous phenome-non such as in the one of the example and scenarios considered for gas diffusion.
One of the interests of the approach is to study the impact of different distribution layouts with respect to a given phenomenon of interest, thus providing architectural designers in the considered case a complementary view on their projects. The approach is flexible enough to be applied to different cases end environments as far as edge im-pedances are parameterized appropriately.
(a) (b)
Figure 6: Betweenness values of nodes under scenarios 1(a) and 2(b). Black circle magnitudes reflect betweenness values of the nodes.
51

5 Conclusion Built environment and indoor spaces represent a novel domain of application for the development of spatial information models, at the crossroad of many disciplines from design to engineering sciences. Early developments have been often successful in de-fining spatial representations of built environments such as structural-based models, cognitive and quantitative models. However, the concept of space as considered in indoor environments deserves complementary spatial modeling approaches adapted to the specific continuous properties of built environments. The research presented in this paper provides a continuous-based representation of a built environment, and where an occupancy grid is considered as the reference modeling concept. An indoor space is covered by a grid graph, where labeled edges retain the semantics of the distribution of the built environment and of a given phenomenon of interest (i.e., the distribution of a variable of interest). The interest of this approach is that the coverage of the emerging graph allows a study of the spatial diffusion of a given phenomenon of interest, and the application of structural measures that reveal the emerging structural properties of the represented space. The approach thus keeps a continuous representation of space, while still embedding structural properties at a lower level of granularity. The potential of the approach is illustrated by a representative case study. The research is still preliminary, and we plan to extend the modeling approach to 3D environments and to apply these modeling concepts to experimental setups in built environments.
Acknowledgments
This research was sponsored by National Natural Science Foundation of China, Ref. No. 40730526, Shanghai Pujiang Program, Ref. No. 07PJ14035, and Ministry of Edu-cation Fundation for Junior Faculty in Doctoral Program, Ref. No. 20070269031.
References
Benedikt, M.L., 1979, To Take Hold of Space: Isovists and Isovist Fields, Environment and Planning B, Vol. 6, pp. 47-65.
Bonacich, P., 1987, Power and Centrality: A Family of Measures, American Journal of Sociology, Vol. 92, pp. 1170-1182.
Dijkstra, E., 1959, A note on two problems in connexion with graphs, Numerische Mathematik, 1: 269–271.
Golledge, R.G., 1993: Geographical perspectives on spatial cognition. In: Gärling, T.; Golledge, R.G. (Eds.), Behaviour and environment: Psychological and geo-graphical approaches. Elsevier, Amsterdam, pp. 16-46.
Hillier, B., and Hanson, J., 1984, The Social Logic of Space, Cambridge University Press.
52

Hillier, B., 1999, Space is the Machine: A Configurational Theory of Architecture. Cambridge University Press.
Kwan, M., Lee, J., 2005, Emergency response after 9/11: the potential of real-time 3D GIS for quick emergency response in micro-spatial environments, Computers, Environment and Urban Systems, 29: 93–113.
Li, X., Zhang, X., Tan, L., 2007, Assisting video surveillance in micro-spatial envi-ronments with a GIS approach. Geospatial Information Technology and Applica-tions. Edited by Peng Gong, Yongxue Liu. Proceedings of the SPIE, Volume 6754, pp. 675402.
Moravec, H., Elfes, A., 1985, High resolution maps from wide angle sonar. In Proceed-ing of the IEEE International Conference on Robotics and Automation, pp. 116–121 St. Louis, MO.
Li, K., 2008, Indoor Space: A New Notion of Space, In proceedings of Web and Wire-less GIS, Lecture Notes in Computer Science 5373, Springer-Verlag , pp. 1-3.
Franz, G., Mallot, H., Wiener, J., 2005, Graph-based models of space in architecture and cognitive science - a comparative analysis. Architecture, Engineering and Construction of Build Environments, pp. 30-38, ISBN 1-897233-05-1, Windsor, Ontario, Canada.
Thrun, S., Wolfram, B., Dieter, F., 2005, Probalistic Robotics. The MIT Press: Cam-bridge, Massachusetts.
Kim, H., Jun, C., Cho, Y.,Kim, G., 2008, Indoor Spatial Analysis Using Space Syn-tax, The International Archives of the Photogrammetry, Remote Sensing and Spatial Information Sciences. Vol. XXXVII, Part B2.
Raubal, M., Worboys, M., 1999, A formal model of the process of wayfinding in built environments, Lecture Notes in Computer Science 1661, Springer-Verlag, pp. 381-399.
Ratti, C., 2004, “Space syntax: some inconsistencies'' Environment and Planning B: Planning and Design 31, pp. 487-499.
Ray, C., Comblet, F., Bonnin, J.-M., and Le Roux Y.-M., 2009, Wireless and Informa-tion Technologies Supporting Intelligent Location-based Services, Chapter 13, M.-T. Zhou, Y. Zhang, L.T. Yang (eds.), Nova Science Publishers, to appear.
53

Space, Time and Ambient Intelligence
COSIT 2009

ProceedingsSpatial and Temporal Reasoning for Ambient Intelligence Systems. Conferenceon Spatial Information Theory, 2009 (France). Report Series of the TransregionalCollaborative Research Center SFB/TR 8 Spatial Cognition, Universitat Bremen/ Universitat Freiburg. SFB/TR 8 Report No. 020-08/2009, Bremen, Germany.