spatial and temporal variation in the functional diversity ... · spatial and temporal variation in...
TRANSCRIPT

Spatial and temporal variation in the functional diversity of non-breeding wader
communities across British estuaries
Verónica Méndez Aragón
Thesis submitted for the degree of Doctor of Philosophy at the University of East Anglia
Norwich, 2012
© This copy of the thesis has been supplied on condition that anyone who consults it is understood to recognise that its copyright rests with the author and that use of any information derived there from must be in accordance with current UK Copyright Law. In addition, any quotation or extract must include full attribution.

i
Contents
Page
Abstract ii
Acknowledgements iii
General Introduction 1
Chapter 1
Functional diversity across space and time: trends in wader communities on British
estuaries.
18
Chapter 2
Impacts of demographic changes in the population of wintering waders on community
structure.
43
Chapter 3
Consequences of population change for the distribution of wintering waders on British
estuaries.
67
Chapter 4
Variations in functional diversity and structure of wintering wader communities along
different environmental gradients in Great Britain.
93
Chapter 5
Co-occurrence patterns of wintering wader species foraging in the intertidal area of British
estuaries.
122
Conclusions 147
Appendix
Appendix 1: Description of functional traits used in analysis. 161
Appendix 2: Functional relationships among wintering wader species. 162

ii ii
Spatialandtemporalvariationinthefunctionaldiversityofnon-breedingwader
communitiesacrossBritishestuaries
Abstract
Manywaderspeciesdependonestuarineecosystemsduringthenon-breedingseason.
However,manyestuariesaroundtheworldareunderintensepressurefromhumanimpacts,
greatlyinfluencingthecompositionofwinteringwadercommunities.Changesincommunities
havebeendocumentedusingspeciesrichnessandevenness.However,thesemeasuresdonot
accountforthefactthatcoexistingspeciesdifferwidelyinthelevelofdistinctnessofthe
ecologicalrolestheyfulfil.Consideringwholecommunitiesintermsoftherangeoftraits,the
ecologicalrolesrepresentedbyeachspeciesandthemechanismsthatregulatecommunity
assembly,isamorepowerfulmethodofunderstandingvariationincommunitycomposition.
Inthisthesis,national-scaledatasetsareusedtoexplorespatialandtemporalvariationinthe
functionaldiversity(FD)ofwinteringwadercommunitiesacrossUKestuaries.Usingnullmodel
analysis,Ishowthatwinteringwadercommunities,overall,aremorefunctionallysimilarthan
expectedfromarandomcommunitywithequivalentnumberofspecies,suggestingthat
environmentalconditionshavethestrongestinfluenceonstructuringthesecommunities.The
relative influence of structuring processes appears to be changing through time, as
communitiesarebecomingmorefunctionallydiversethanexpectedbychance.Usingdifferent
environmentaldatasets,IexplorethespatialandtemporalvariationinFDandidentify
potentialdrivers.Furthermore,Iinvestigatewhichspeciesaremorelikelytocontributeto
changesinFD.UsingdatafromWeBSLowTideCounts,Igoontoshowatendencyfor
functionallysimilarspeciestoaggregatewithintheintertidalarea.Thethesisfindings
emphasizethelikelyimportanceofenvironmentalfactorsforwadercommunityassembly.
Understandingtheprocessesunderlyingcommunityassemblycanhelpinunderstanding
communityresponsestoenvironmentalchangeandimproveconservationandmanagement
plans.

iii
Acknowledgements
I would like to thank all the people and institutions that in one way or another have made the
writing of this thesis possible.
I am very grateful to my supervisors. To Richard Davies who trusted me to do this PhD. I am
thankful for his support and interest through this period and for helping me organizing ideas
and structuring the thesis converting the initial thoughts into solid research. To Jenny Gill,
without whom this PhD would not have been the same. Thanks Jenny for showing me the way
to understand science. To Niall Burton for his valuable comments, revisions and support
throughout the PhD.
I am also extremely grateful to all the British Trust for Ornithology (BTO) volunteers who
supply the data used here. This thesis could not have been written without your effort and
dedication. Special thanks go out to each volunteer.
My ability to analyse functional diversity had a giant leap when Owen Petchey helped me
understand his amazing R-code. I have also been lucky to work in collaboration with the WeBS
team at the BTO, I am particularly thankful to Graham Austin, Lucy Wright and Neil Calbrade
for helping me understand the data, providing information about species and the
methodologies used. To Amy Romans, Louise Bossut and Daniele Giorgini for all their
contribution to the hard work of collecting traits data, and for many discussions of FUNctional
diversity.
When most people think about a cabbage they imagine a leafy greenish vegetable, but when I
think about the cabbage, I recall laughs, dances, cakes, crocodiles, cartridges, booze, old
journals, oycs, towels, and general great times. I have been very fortunate to spend the last
four years in the (in)famous ‘Cabbage lab’. Many people have contributed to the fun and
unforgettable moments at the Cabbage, which helped me keep relatively sane during these
four years. From the start, José Alves, Catriona Morrison, Maria Uyarra, Dave White, Daniel
Hayhow, Freydis Vigfúsdottir, Sian Diamond, Lotty Packman and Katie Newton made me very
welcome. As every fairy tale, the cabbages grow and flower, eventually venturing into real life
(mainly because they become doctors!!) leaving behind empty spots which are rapidly
occupied by other upcoming sprouts: Kelly Edmunds, Lorenzo Alvarez, Bècky Láidlaw, Danni
Peruffo, Dave Wright, Catalina Gonzalez, Joanne Godwin, Tom Finch and Michael Bolton and
the honorary cabbage, Leila Walker (i.e. the shelduck in my dataset). Thank you all for all the
biscuits, coffees, teas, and especially for your time, friendship and coping with this ESpanish!!

iv
Outwith the cabbage, I met very special people and would like to thank all the Stranglers and
RDGers. Their motivation, work and their different perspectives have helped me to develop
broad critical thinking. The weekly meetings provided me with the opportunity to learn about
many different topics, from tiny little things I cannot see but that reveal research secrets to
landscape approaches on saving endangered species across the world, not forgetting lessons
on how to run from lions.
I am very fortunate to have met the ‘Latino gang’. Thank you Lorenzo Zanette for helping me
with R (and for all the coffee breaks) and to Sergio Vallina for extending my understanding of
modelling (and for all the nights out). Christiana Faria brought samba into my life and we have
shared unforgettable experiences in more than one country that I cherish tenderly: Muito
obrigada minina querida! David Padilla came to UEA and brought sun into my days. Your daily
visits to the cabbage have helped me more than you can imagine. David sigue sonriendo
porque alegras a todas las almas. To Alberto Vélez for his constant state of happiness and his
very cool month long moustache.
Beyond UEA, I am very grateful to John and Laura Griffin who have inspired me in both science
and life. Thank you for being always present.
I have also been lucky enough to spend the last summer of my PhD in Iceland, working with
the Black-tailed Godwit team. That team is ace! The amount of things I have learnt and
experienced during that period has proven invaluable. It was very inspiring to see you working
together. The way ideas flow in your discussions (mostly the ones related to work!) is
incredible and the passion and dedication for science and particularly during long hours of
fieldwork (even if whimbrels are involved) is extraordinary. Many thanks to Jenny Gill, José
Alves, Tómas Gunnarson, Graham Appleton and Borgný Katrínardóttir. You rock! To Tómas and
Borgny I would like to add fle fle fle.
A few special mentions:
Catriona Morrison, your sprout is growing and she has been doing it by following your steps.
Thanks Cat for being so patient with me. For all the hours spent talking and figuring out mixed
models, glms and general stats. You have been a role model for me and you always believed in
me when all was crumbling. You have been an incredible friend. Thanks Morrison! Next
challenge: Morrison and Mendez (2013) (Nature? Bird Study? You choose!). You are the tart of
my tan…Love you Scottish!
Here is the challenge: I have to make Kelly Edmunds laugh when she reads this. I don’t think I
will achieve that but I will nevertheless thank her with all my fiery Espanish heart. Kelly, you

v
have become my sister. Without you this moment would still be a remote dream… You have
supported me since the first day. Thank you Kelly!
Becky Laidlaw, thank you for keeping me sane for the past year. You have been a great
colleague and always been a true Friend. During this last year you have inspired me to teach
Spanish, to play in office goodminton, to never keep a serious face, to instigate Prof. T-Rex, to
coffee up the mornings, to drink expired beers, and to push always a bit more: go Becky, go! I
wish I could draw the face that makes you laugh! Here is my go: - one day you will be able
to do it!!. Thanks Rebecky! É verano!
And now, with your permission, I will switch to Spanish (click click) and Catalan.
A mis padres: Agustín Méndez y Ma Gloria Aragón. He llegado hasta aquí gracias a vosotros.
Muchas gracias por vuestra paciencia y comprensión, por apoyarme incondicionalmente y
motivarme a continuar en momentos difíciles. Muchas gracias por creer en mi! No se como
agradeceros por todo el esfuerzo que habéis hecho para educarme y por todos los valores que
siempre me habéis inculcado. Solo deciros que os quiero!!
A mis hermanas: Susana y Lydia. Os admiro. Vosotras habéis sido un gran ejemplo y una
inspiración para mí. Habéis sido el motor para lograr todos mis propósitos. Muchas gracias por
vuestra paciencia y por estar siempre a mi lado, sin vosotras no hubiera llegado a donde estoy.
Os estaré eternamente agradecida y aunque no lo diga muy a menudo, os quiero muchísimo!
A la meva petitona, Natasha. Des de que vas néixer has sigut la meva alegria. Gràcies a tu, els
dies s’han fet molt més interessants. Et dono les gràcies especialment perquè m’has fet
recordar lo bonic que es aprendre. T’estimo petitona!
A Marc Borrell, sense tu tampoc hauria estat posible. Gràcies pel teu suport incondicional i
continu.
A mi amor, compañero y amigo: José Alves. Desde el primer día has estado a mi lado. Que
suerte que tuve al encontrarte! Sin ti, este camino no hubiera sido el mismo. Gracias por tu
comprensión, paciencia y ánimos. Gracias por la música que me has mandado cada día y por
cada notita que me encontraba en mi escrito; han sido el motor de muchos días grises. Gracias
amor. Gracias por dejarme ser parte de tu vida y enseñarme tu mundo. Gracias por hacerme
creer más en mi. Gracias por todo. Te amo mi vida!
Esta tesis se la dedico con mucho cariño a mi familia y a José, como un símbolo de gratitud por
todo el apoyo que me han ofrecido y por creer siempre en mí. Muchas gracias familia! Muchas
gracias José!.

vi
Y por último, dar las gracias a todos mis amigos y compañeros que me han apoyado a lo largo
de todos estos años y que me han hecho ver que hay otro mundo a parte del de la universidad.
En particular doy las gracias a Laura Simón, Vanesa Bajo y Damià Garcia.

1
General Introduction

General introduction
2
Integrating functional traits for the understanding of biodiversity change
The continued demands of a rapidly growing human population are predicted to increase the
degradation of ecosystems worldwide, with many biomes and biogeochemical cycles being
deeply impacted by human actions (Vitousek et al., 1997). Although, historically, human
activities have modified the distribution of habitat types across the globe (MEA, 2012) the rate
of land use change has dramatically increased over the last century and many habitats have
been severely degraded during this period (Goldewijk, 2001). Over the same period, the rates
of exploitation of natural resources and introduction of non-native and invasive species have
also increased dramatically (MEA 2012, and references therein). The impacts of the
Anthropocene era on the global environment have mostly resulted in a general decline in
biodiversity and shifts in species composition of natural communities. Over recent decades,
these global changes have highlighted the need to preserve the diversity of ecological
communities and to understand the potential consequences of biodiversity loss, which
ultimately can affect the well-being of human populations through changes in ecosystems
services (MEA, 2012). Therefore, evaluating and assessing biodiversity has become
instrumental as a means of monitoring the environment (McCann, 2000). Several diversity
indices have been developed which aim to measure different aspects of biological diversity
and assess the health of ecological communities and ecosystems (Magurran, 2004).
Changes in biodiversity have been mostly documented using both species richness (the
number of different species) and species evenness (the relative abundance of species within
the community) (Loreau et al., 2002; Lepš 2004; Schmid & Hector, 2004). However, the
multidimensionality of diversity means that using a single index compresses and reduces the
complexity of ecological systems. Indices focused solely on species numbers and abundances
ignore the degree of interspecific similarity or dissimilarity across species, and therefore do not
account for the fact that some species may have stronger impacts than others upon their
common ecosystem (Grime, 1998; Petchey & Gaston, 2002; Petchey, 2004; Valone &
Schutzenhofer, 2004). Furthermore, there has been a growing recognition that ecosystem level
processes may not be affected by species richness per se but, instead, the effects of
biodiversity on ecosystem processes are mostly driven by species traits (Walker, 1992; Díaz &
Cabido, 2001; Tilman, 2001; Petchey & Gaston, 2002; Hooper et al., 2005). This has resulted in
a shift of the traditional and static view of communities towards a more functional and
dynamic approach which focuses on the role of each species within the community, by using
the value of species traits (Petchey & Gaston, 2006).

General introduction
3
Functional traits, functional diversity and their ecological importance
Functional traits refer to ecological attributes of species that influence their performance
(McGill et al., 2006). Functional traits relate species to both ecosystem processes (functional
effect traits), such as productivity or pollination, as well as to their interaction with biotic and
abiotic factors (functional response traits), such as resource availability or climatic variations.
As such, functional traits reflect adaptations to different physical and biotic environments and
can be morphological (e.g. body size, beak size), physiological (e.g. salinity tolerance),
reproductive (e.g., seed or egg size), ecological (e.g. habitat breadth) or behavioural (e.g.
feeding method) (Bremner et al., 2003; Dumay et al., 2004; Lepš et al., 2006). Functional
response traits are commonly used to understand the variation in species distributions in
response to environmental change (Hooper et al., 2002), whereas functional effect traits are
mostly used in to investigate and infer the linkage between biodiversity and ecosystem
functioning (Hooper et al., 2002). Interestingly the link between functional response and effect
traits remains unclear, as these may or may not be correlated with each other (Lavorel &
Garnier, 2002) and this is a matter of current debate within theoretical ecology.
Functional diversity (FD) measures the extent of functional trait variation within natural
communities. For example, two communities with the same number of species may be more
or less functionally diverse depending on how similar or different are the functional traits
among species within both communities. Given that functional diversity incorporates
information on a variety of life-history traits and ecological roles, it has been shown to be a
more suitable indicator of ecosystem function than taxonomic indices (Díaz & Cabido, 2001;
Petchey & Gaston, 2006). Additionally, substantial theoretical and empirical evidence supports
the idea that functional diversity better explains variation in ecosystem processes (Hooper et
al., 2005), and ecosystem services (Díaz et al., 2007), and can therefore provide a basis for
understanding and predicting consequences of biodiversity changes in ecosystems.
Understanding the spatial and temporal variation in community FD and its drivers is important
not only because it is associated with changes in ecosystem functioning but also because the
presence of different sets of functional traits in a given community may suggest the operation
of different community assembly processes (see section below) (McGill et al., 2006; Mouillot
et al., 2007; Petchey et al., 2007; Thompson et al., 2010). However, to date, very few empirical
studies have investigated how functional diversity varies along environmental and/or temporal
gradients (but see de Bello et al., 2006; Mayfield et al., 2006; Flynn et al., 2009; Gerisch et al.,
2011), and also how functional diversity may respond to global environmental change (but see
Mayfield et al., 2010; Buisson et al., 2012). For instance, a decrease in FD could be expected in
human-modified systems, which tend to be environmentally homogeneous and host more

General introduction
4
generalist species with similar functional traits whilst excluding species with relatively unique
traits (McKinney & Lockwood, 1999). However, the few studies that have examined variation
in FD along environmental/anthropogenic gradients have revealed contrasting patterns and
further analysis is required in order to achieve consensus. Moreover, it is still unclear whether
the prevailing effect of human action promotes the coexistence of more functionally similar or
more functionally different species. Understanding the processes underlying community
assembly can influence debate on these issues and may thus help to refine conservation
strategies aimed at maintaining biological diversity, as well as understanding community
responses to environmental change.
Functional diversity: a tool for disentangling community structure
For decades, ecologists have debated the importance of different processes in determining the
assembly and maintenance of ecological communities, with particular consideration of the
effects of environmental factors, biological interactions and random or neutral processes
(Clements, 1936; Hubbell, 2001; Leibold et al., 2004; McGill, 2010; Pavoine & Bonsall, 2011;
Münkemüller et al., 2012). Neutral theory is predicated on the idea that communities
represent random assemblages from a regional species pool, with species coexisting
independently of their traits and all individuals of all species being equivalent in terms of their
competitive ability, dispersal ability and fitness (Hubbell, 2001, 2005, 2006). In contrast, the
classical view of community assembly (i.e. niche-based models) considers that a portion of
species in the regional pool is excluded from membership of a particular local community
through various biotic and environmental filters. The relative strength of these
mechanisms/filters determines which traits or trait values occur in the local community.
Environmental filtering will constrain specific traits from the species pool, resulting in
coexisting species sharing more similar traits (underdispersion: species are likely to be more
similar than expected by chance). Conversely, competitive exclusion, a primary biotic
mechanism, will limit the trait similarity between coexisting species, resulting in coexisting
species being more dissimilar in their traits and thus generating overdispersion of traits.
In order to facilitate investigation into the role of species’ traits in community assembly and
structure a number of recent studies have integrated measures of functional diversity (e.g.
Petchey & Gaston, 2002; Mason et al., 2005; Cornwell et al., 2006; Mouillot et al., 2007;
Petchey et al., 2007; Algar et al., 2011; de Bello, 2012). These studies have predominately
focused on measuring differences between observed functional diversity and the functional
diversity expected under a null model, as a means of providing evidence supporting or
opposing the operation of non-neutral processes (Ricklefs & Travis, 1980; Mouillot et al., 2007;
Petchey et al., 2007; Thompson et al., 2010; de Bello, 2012). These studies suggest that

General introduction
5
environmental factors will lead to a lower functional diversity than expected by chance
(Cornwell et al., 2006), while competitive exclusion will lead to a greater FD than expected by
chance (e.g. Holdaway & Sparrow, 2006; Petchey et al., 2007; Thompson et al., 2010).
It has been suggested that the role of the structuring mechanisms may be scale-dependent
(Zobel, 1997; Kraft et al., 2007; Funk et al., 2008), with environmental effects likely to be
stronger at larger scales (Díaz, Cabido & Casanoves, 1998; Cornwell, Schwilk & Ackerly, 2006),
whereas competitive exclusion effects are likely to have greater influence at smaller scales
(Cavender-Bares et al., 2004; Slingsby & Verboom, 2006). These structuring mechanisms are
not mutually exclusive and can co-occur simultaneously across scales (de Bello et al., 2006;
Mouillot et al., 2007). For example, low water availability, a stressful environmental condition,
may constrain the traits arriving from the species pool allowing only for a narrow range of
similar traits to be present in the community (e.g. drought resistance traits), but
simultaneously it may also cause an intensification of competitive interactions between similar
species as a result of limiting resources. There is currently very little empirical evidence for
how the relative strength of mechanisms structuring communities may vary along
environmental gradients, and this is an issue that urgently requires further research, as the
current fast pace of environmental change is likely to alter the strength of the mechanism
regulating community composition.
Waders across the globe
Wader (Charadrii) species can have very large distribution ranges and can occupy numerous
biomes throughout the world (Hayman et al., 1986). Most wader species are migratory and
there are many species that breed at arctic and subarctic latitudes and winter from temperate
regions to Patagonia and South Africa. This group of birds is generally associated with wetlands
(both coastal and inland) but a few are also found in other habitats (e.g. arid & semi-arid,
Stone curlews Burhinus oedicnemus; open plains, Upland sandpiper Bartramia longicauda;
mountain ranges, Dotterel Charadrius morinellus). During the non-breeding season most
waders inhabit tidal habitats, feeding in the inter-tidal zone at low tide and roosting above the
high water mark at high tide. They display a remarkable range of morphological, behavioural
and ecological traits that reflect the multiplicities of responses to the resources consumed, and
also adaptations to their environmental conditions. Common wader prey includes macro-
benthos, particularly polychaetes, crustaceans and molluscs, which are abundant in estuarine
systems. However, these prey taxa are not equally important to all waders. The quantity and
type of food resource used by each wader species and the methods to acquire them (foraging
strategies) are closely linked to each species’ morphology. For example, to a large extent prey
size and burrowing depth are correlated with the wader species’ bill size, hardness and shape

General introduction
6
(O’Connor, 1981; Ferns 1992). Plovers have the shortest bills of all waders and tend to locate
prey by sight and feed by pecking on the surface of the sediment, whereas godwits, with long
and sensitive bills, locate prey by touch while probing deep within the burrows of their prey
like lugworms and ragworms (Figure 1). In contrast, the majority of sandpipers forage by sight,
visually scanning a search area (in some cases while walking) and then, when signs of prey are
located, either pecking at prey on the surface of the sediment or probing deeper in order to
locate them.
The wide distribution of waders across biomes, and their wide range of foraging methods and
adaptations, provides an excellent study system in which to investigate patterns of functional
diversity across wader communities and how it might vary along distinct environmental
gradients.
Figure 1. Bill size and shape of various waders in relation to the depth of prey species. From
left to right: curlew (Numenius arquata), bar-tailed godwit (Limosa lapponica), oystercatcher
(Haematopus ostralegus), common redshank (Tringa totanus), grey plover (Pluvialis
squatarola), little ringed plover (Charadrius dubius), whimbrel (Numenius phaeopus),
turnstone (Arenaria interpres) and avocet (Recurvirostra avosetta). Reproduced from
studentmag.acsedu.com/Articles/Seabirds-and-Waterbirds.aspx
Wintering wader communities in the UK
The United Kingdom with its extensive areas of highly productive estuarine environments, its
relatively mild winter owing to the influence of the Gulf Stream (van de Kam et al., 2004), and

General introduction
7
its location on one of the major flyways for Arctic nesting species, is internationally important
for several wintering wader populations. The UK holds over 20% of the populations of 10
species across the flyway (Musgrove et al., 2011). However, as with estuarine areas elsewhere,
a high proportion of the UK’s human population is concentrated near the coast (particularly
around estuaries), resulting in continuous anthropogenic pressures on this ecosystem. Almost
90% of UK estuaries have already been affected by land claim and marinas, recreational and
housing schemes and tidal power barrages are common around estuaries in Britain (Davidson
et al., 1991). The potential vulnerability of both habitats and waterbird species to these
pressures has provided the impetus for national-scale monitoring of waterbird populations,
through the Wetland Bird Survey (WeBS). The UK is also a signatory country to the Convention
on Wetlands of International Importance especially as Waterfowl Habitat (Ramsar Convention),
the Convention on the Conservation of Migratory Species of Wild Animals (CMS), the African-
Eurasian Migratory Waterbird Agreement (AEWA), and the Convention on Biological Diversity
(CBD). In addition, the UK, as part of the European Union, is required to enforce the Birds
Directive 2009/147/EC and Habitats Directive 92/43/EEC (Bern Convention). These
conventions and directives require the UK to set-up and maintain a monitoring scheme for
waders and other waterbird populations and to promote their conservation.
In the early 1970s, a monitoring scheme was implemented in the UK, in order to assess
population status and trends of waterbird species, firstly as the Birds of Estuaries Enquiry
(BoEE) and latterly as the Wetland Bird Survey (WeBS). The current WeBS is a joint scheme of
the British Trust for Ornithology (BTO), Royal Society for the Protection of Birds (RSPB) and
Joint Nature Conservation Committee (JNCC), in association with Wildfowl & Wetlands Trust
(WWT). WeBS Core Counts are synchronised monthly counts carried out across the majority of
wetland types in the UK on predetermined dates, thus minimizing the likelihood of double-
counting some individuals or missing others. A recent addition to this scheme has been
developed, the Low Tide Counts, which are undertaken on selected estuaries for identifying
key areas used by waders during this period of the tidal cycle. Both datasets provide a valuable
resource for the large-scale study of waterbird populations and communities.
The monitoring of waders across Britain provides the data required for designating the
importance of individual sites for these populations (e.g. Stroud et al., 2001) and also to
quantify national-scale population trends (population size, distribution and temporal trends)
(Thaxter et al., 2010). Following decades in which populations of several waterbirds had
increased, some are now declining, such as ringed plover and dunlin (Holt et al., 2011).
Conversely, other species such as the avocet and the black-tailed godwit have been increasing
since the start of these monitoring programs. In addition, the distribution of many species has

General introduction
8
also changed since the 1970s, with evidence that the mid-winter centroid of the range of
several species is now further eastwards and/or northwards than in previous decades
(Rehfisch et al., 2004; Maclean et al., 2008). These levels of variation in population trends and
distribution have been analysed in an attempt to identify and understand the factors
underlying changes in abundance and distribution of species at the population level. Previous
studies have suggested that changes in wader abundance may be related to a combination of
factors that include habitat loss resulting from land claim, dredging and urbanization (Goss-
Custard et al., 1995, 2006; Dolman & Sutherland, 1995), human disturbance (Gill et al., 2001;
Burton et al., 2002; West et al., 2002), shell-fisheries (Atkinson et al., 2010) and changes in the
amount of organic nutrients discharged into coastal waters, resulting in changes in
invertebrate prey communities (Alves et al., 2012). However, much less research has been
focused on understanding wader community level dynamics and the processes influencing
community assembly (but see Hill et al., 1993; Rehfisch et al., 1997; Atkinson et al., 2010).
To date, only two large-scale studies on wader communities across UK have investigated
variation in community composition (Hill et al., 1993; Rehfisch et al., 1997). The early study by
Hill and co-workers (1993) revealed that wader composition is influenced by physical estuarine
characteristics, in particular by the type of intertidal habitat and the tidal range, alongside
salinity, ammonium-N concentration in water, percentage dissolved oxygen and biochemical
oxygen demand. Rehfisch and colleagues (1997) identified seven environmental variables that
influence community composition, including the morphological, sedimentological and
geographical characteristics of the estuary (estuary length, channel and shore width, exposure
to swell, sediment type, longitude and latitude). Both studies produced a classification of
communities according to species composition. Hill and co-workers identified four wader
community types according to latitude, tidal range and total estuary area whereas Rehfisch
and colleagues (1997) identified seven communities, where latitude, longitude and estuary
length discriminated the groups. Differences between these studies might be attributed to: (i)
the difference between the taxonomic breadths of species studied, since Rehfisch et al.
included also wildfowl species such as pintail and wigeon; and/or (ii) the difference between
the number of sites included, since Hill et al. included 109 estuaries and Rehfisch et al. only 27,
hence, it is likely that the variation in environmental factors may be different. Despite these
differences, both studies converge on the effect of geographical position and size of estuary in
influencing wader community composition. However, neither study considered resource use,
which is likely to be an important if not predominant factor driving community dynamics. The
processes that sustain wader communities and allow species’ co-existence remain poorly
understood. Furthermore, we do not know (i) how these processes vary along environmental
gradients and whether they are changing through time, and (ii) how population changes

General introduction
9
influence the composition and structure of whole communities. Understanding the processes
underlying community assembly is key for understanding community responses to
environmental change, because changes in the relative strength of the processes structuring
communities can result in changes in community composition and consequently, in changes to
ecosystem functioning.
Thesis structure
In this thesis, the two national-scale surveys of wader distribution in the UK (WeBs Core and
Low Tide counts) are used to explore (i) spatial and temporal variation in functional diversity of
wintering wader species, (ii) the variation in community structure along environmental
gradients and (iii) how changes in wintering population size contribute to changing patterns of
functional diversity and community structure.
The wide range of morphological, behavioural and ecological characteristics of waders, and
their high winter dependency in estuarine habitats, results in a model study system in which
functional diversity can be used to understand the processes determining (wader)
communities, as well as the functional ecological significance of community structure and
complexity. In chapter one, winter WeBS Core Counts collected between 1980/81 and
2006/07 are used to explore the geographical and temporal variation in functional diversity
and community structure across 100 British estuaries. Overall, wintering wader communities
show greater similarity in functional trait states than expected from a random community with
equivalent numbers of species. Furthermore, this similarity amongst species appears to be
changing through time. The potential drivers and mechanisms underlying these patterns are
discussed.
Wader functional diversity estimations in chapter one were calculated using presence-absence
data, thus limiting the changes in functional diversity to only be sensitive to changes in species
local extinction or colonization, while being insensitive to changes in population size.
Surprisingly, it is currently unknown how population size and site occupancy might impact
community structure. In chapter two, I therefore examine the association between temporal
trends in population size and wintering occupancy for wader communities on 83 estuaries
around Britain. This analysis revealed that the direction and magnitude of changes in wintering
wader population size and occupancy are species-specific. Then, using the estimates extracted
from chapter one of the deviation between observed and expected functional diversity, I
explore the impact of changes in species distribution on spatial and temporal patterns in
functional diversity and community structure.

General introduction
10
Despite the wealth of scientific research evaluating factors underlying changes in population
abundance, there is relatively little understanding of the consequences of changes in
population size for changes in occupancy and local abundance. In chapter three, I tackle this
issue by investigating the patterns of change in local abundance and site occupancy of
wintering wader species throughout Britain over the last two decades (from 1980/81 to
2006/07). While large changes in site occupancy were apparent for a few species, changes in
total wintering population size were typically manifest as changes in local abundances rather
than in occupation of sites. This analysis provides insights into the processes influencing
changes in local abundance and range expansion during periods of population fluctuations and
possible ecological correlates of changes in population size are explored.
The geographical variation in functional diversity of wintering wader communities across
Britain may be due to variation in environmental conditions operating at the same spatial scale,
and the direction and magnitude of change in functional diversity may be associated with
changes in environmental conditions. Therefore, in chapter four, I use the previously
estimated deviations of observed from expected functional diversity to explore geographical
variation in community structure in relation to the estuarine morphology, climatic conditions
and anthropogenic activities. I also investigate if the magnitude and direction of annual
changes in deviations of observed from expected FD relates to changes in climatic conditions
or other habitat-derived factors.
Patterns of species co-existence are normally assessed using trait-based (as in this thesis) or
species-based (spatial dispersion) approaches to determine whether species traits converge or
diverge, or whether species aggregate or segregate spatially in relation to null expectations.
Although both approaches share the common aim of identifying the mechanisms by which
species co-exist, it is not known whether a relationship between spatial and trait dispersion
exists. In chapter five, using Low Tide Counts, I therefore explore spatial distribution within
and between species. For the latter, I examine whether co-occurrence patterns differed from
null expectations across the eight sites included in this analysis. I then examine the
relationship between species-pair co-occurrence patterns and species-pair functional
differences, and test whether co-occurring species tend to be more or less functionally
dissimilar. The possible mechanisms driving the observed patterns are discussed.
Finally, the General Conclusions provides a synthesis of the main results from the thesis, their
implications for conservation planning and future directions of this work.

General introduction
11
References
Algar, A.C., Kerr, J.T. & Currie, D.J. (2011) Quantifying the importance of regional and local
filters for community trait structure in tropical and temperate zones. Ecology, 92, 903–
14.
Alves, J.A., Sutherland, W.J. & Gill, J.A. (2012) Will improving wastewater treatment impact
shorebirds? Effects of sewage discharges on estuarine invertebrates and birds. Animal
Conservation, 15, 44–52.
Atkinson, P.W., Maclean, I.M.D. & Clark, N.A. (2010). Impacts of shellfisheries and nutrient
inputs on waterbird communities in the Wash, England. Journal of Applied Ecology, 47,
191–199.
Bremner, J., Rogers, S.I. & Frid, C.L.J. (2003) Assessing functional diversity in marine benthic
ecosystems: a comparison of approaches. Marine Ecology Progress Series, 254, 11–25.
Buisson, L., Grenouillet, G., Villéger, S., Canal, J. & Laffaille, P. (2012) Toward a loss of functional
diversity in stream fish assemblages under climate change. Global Change Biology. doi:
10.1111/gcb.12056.
Burton, N.H.K., Armitage, M.J.S., Musgrove, A.J. & Rehfisch, M.M. (2002) Impacts of man-made
landscape features on numbers of estuarine waterbirds at low tide. Environmental
Management, 30, 857-864.
Cavender-Bares, J., Ackerly, D.D., Baum, D.A. & Bazzaz, F.A. (2004) Phylogenetic overdispersion
in Floridian oak communities. American Naturalist, 163, 823-843.
Clements, F.E. (1936) Nature and the structure of climax. Journal of Ecology, 24, 252-284.
Cornwell, W.K., Schwilk, L.D.W. & Ackerly, D.D. (2006) A trait-based test for habitat filtering:
convex hull volume. Ecology, 87, 1465–1471.
Davidson, N.C., Laffoley, D. d’A., Doody, J.P., Way, L.S., Gordon, J., Key, R., Pienkowski, M.W.,
Mitchell, R. & Duff, K.L. (1991). Nature Conservation and Estuaries in Great Britain.
Nature Conservancy Council, Peterborough, UK.
de Bello, F.D., Lepš, J. & Sebastià, M.-T. (2006) Variations in species and functional plant
diversity along climatic and grazing gradients. Ecography, 6, 801–810.

General introduction
12
de Bello, F.D. (2012) The quest for trait convergence and divergence in community assembly:
are null-models the magic wand? Global Ecology and Biogeography, 21, 312–317.
Díaz, S. & Cabido, M. (2001) Vive la difference: plant functional diversity matters to ecosystem
processes. Trends in Ecology & Evolution, 16, 646-655.
Díaz, S., Cabido, M. & Casanoves, F. (1998) Plant functional traits and environmental filters at a
regional scale. Journal of Vegetation Science, 9, 113-122.
Díaz, S., Lavorel, S., de Bello, F., Quétier, F., Grigulis, K. & Robson, T.M. (2007) Incorporating
plant functional diversity effects in ecosystem service assessments. Proceedings of the
National Academy of Sciences of the United States of America, 104, 20684-20689.
Dolman, P.M. & Sutherland, W.J. (1995) The response of bird populations to habitat loss. Ibis,
137, S38–S46.
Dumay, O., Tari, P.S., Tomasini, J.A. & Mouillot, D. (2004) Functional groups of lagoon fish
species in Languedoc Roussillon, southern France. Journal of Fish Biology, 64, 970–983.
Ferns, P.N. (1992) Bird life of coasts and estuaries. Cambridge: Cambridge University Press.
Flynn, D.F.B., Gogol-Prokurat, M., Nogeire, T., Molinari, N., Richers, B.T., Lin, B.B., Simpson, N.,
Mayfield, M.M. & DeClerck, F. (2009) Loss of functional diversity under land use
intensification across multiple taxa. Ecology letters, 12, 22–33.
Funk, J.L., Cleland, E.E., Suding, K.N. & Zavaleta, E.S. (2008) Restoration through reassembly:
plant traits and invasion resistance. Trends in Ecology & Evolution, 23, 695-703.
Gerisch, M., Agostinelli, V., Henle, K. & Dziock, F. (2011) More species, but all do the same:
contrasting effects of flood disturbance on ground beetle functional and species
diversity. Oikos, 121, 508–515.
Gill, J.A., Norris, K. & Sutherland, W.J. (2001) The effects of disturbance on habitat use by black-
tailed godwits Limosa limosa. Journal of Applied Ecology, 38, 846–856.
Goldewijk, K.K. (2001) Estimating global land-use change over the past 300 years: The HYDE
Database. Global Biogeochemical Cycles, 15, 417-433.
Goss-Custard, J.D., Caldow, R.W.G., Clarke, R.T., Durell, S.E.A., Urfi, J. & West, A.D. (1995):
Consequences of habitat loss and change to populations of wintering migratory birds:
predicting the local and global effects from studies of individuals. Ibis, 137, S56-S66.
Goss-Custard, J.D., Burton, N.H.K., Clark, N.A., Ferns, P.N., McGrorty, S., Reading, C.J., Rehfisch,

General introduction
13
M.M., Stillman, R.A., Townend, I., West, A.D. & Worrall, D.H. (2006). Test of a behavior-
based individual-based model: response of shorebird mortality to habitat loss.
Ecological Applications, 16, 2215-2222.
Grime, J.P. (1998) Benefits of plant diversity to ecosystems: immediate, filter and founder
effects. Journal of Ecology, 86, 902-910.
Hayman, P., Marchant, J. & Prater, A.J. (1986) Shorebirds. Croom Helm, London.
Hill, D., Rushton, S.P., Clark, N., Green, P. & Prys-Jones, R. (1993) Shorebird communities on
British estuaries: factors affecting community composition. Journal of Applied Ecology,
30, 220-234.
Holdaway, R.J. & Sparrow, A.D. (2006) Assembly rules operating along a primary riverbed-
grassland successional sequence. Journal of Ecology, 94, 1092–1102.
Holt, C.A., Austin, G.E., Calbrade, N.A., Mellan, H.J., Mitchell, C., Stroud, D.A., Wotton, S.R. &
Musgrove, A.J. (2011) Waterbirds in the UK 2009/10: The Wetland Bird Survey.
BTO/RSPB/JNCC, Thetford.
Hooper, D.U., Chapin, F.S., Ewel, J.J., Hector, A., Inchausti, P., Lavorel, S., Lawton, J.H., Lodge,
D.M., Loreau, M., Naeem, S., Schmid, B., Setala, H., Symstad, A.J., Vandermeer, J. &
Wardle, D.A. (2005) Effects of biodiversity on ecosystem functioning: A consensus of
current knowledge. Ecological Monographs, 75, 3-35.
Hooper, D.U., Solan, M., Symstad, A.J., Diaz, S., Gessner, M.O., Buchmann, N. et al. (2002).
Species diversity, functional diversity and ecosystem functioning. In: Biodiversity and
Ecosystem Functioning: Syntheses and Perspectives (eds Loreau, M., Naeem, S. &
Inchausti, P.). Oxford University Press, Oxford, pp. 195–208.
Hubbell, S.P. (2001) The Unified Neutral Theory of Biodiversity and Biogeography. Princeton
(NJ): Princeton University Press.
Hubbell, S.P. (2005) Neutral theory in community ecology and the hypothesis of functional
equivalence. Functional Ecology, 19, 166-172.
Hubbell, S.P. (2006) Neutral theory and the evolution of ecological equivalence. Ecology, 87,
1387-1398.
Kraft, N.J.B., Cornwell, W.K., Webb, C.O. & Ackerly, D.D. (2007) Trait evolution, community
assembly, and phylogenetic structure of ecological communities. American Naturalist,
170, 271-283.

General introduction
14
Lavorel, S. & Garnier, E. (2002) Predicting changes in community composition and ecosystem
functioning from plant traits: revisiting the Holy Grail. Functional Ecology, 16, 545-556.
Leibold, M.A., Holyoak, M., Mouquet, N., Amarasekare, P., Chase, J.M., Hoopes, M.F., Holt,
R.D., Shurin, J.B., Law, R., Tilman, D., Loreau, M. & Gonzalez, A. (2004) The
metacommunity concept: a framework for multi-scale community ecology. Ecology
Letters, 7, 601–613.
Lepš, J. (2004) Variability in population and community biomass in a grassland community
affected by environmental productivity and diversity. Oikos, 107, 64-71.
Lepš, J., de Bello, F., Lavorel, S. & Berman, S. (2006) Quantifying and interpreting functional
diversity of natural communities: Practical considerations matter. Preslia, 78, 481–501.
Loreau, M., Naeem, S. & Inchausti, P. (eds) (2002) Biodiversity and Ecosystem Functioning:
Synthesis and Perspectives. Oxford University Press, Oxford, UK.
Maclean, I.M.D., Austin, G.E., Rehfisch, M.M., Blew, J., Crowe, O., Delany, S., Devos, K.,
Deceuninck, B., Gunther, K., Laursen, K., et al. (2008). Climate change causes rapid
changes in the distribution and site abundance of birds in winter. Global Change
Biology, 14, 2489-2500.
Magurran, A.E. (2004). Measuring Biological Diversity. Blackwell, Oxford.
Mason, N.W.H., Mouillot, D., Lee, W.G. & Wilson, J.B. (2005) Functional richness, functional
evenness and functional divergence: the primary components of functional diversity.
Oikos, 111, 112-118.
Mayfield, M.M., Ackerly, D. & Daily, G.C. (2006) The diversity and conservation of plant
reproductive and dispersal functional traits in human-dominated tropical landscapes.
Journal of Ecology, 94, 522–536.
Mayfield, M.M., Bonser, S.P., Morgan, J.W., Aubin, I., McNamara, S. & Vesk, P.A. (2010) What
does species richness tell us about functional trait diversity? Predictions and evidence
for responses of species and functional trait diversity to land-use change. Global
Ecology and Biogeography, 19, 423–431.
McCann, K.S. (2000) The diversity–stability debate. Nature, 405, 228–233.
McGill, B.J., Enquist, B.J., Weiher, E. & Westoby, M. (2006) Rebuilding community ecology from
functional traits. Trends in Ecology and Evolution, 21, 178-185.

General introduction
15
McGill, B.J. (2010) Towards a unification of unified theories of biodiversity. Ecology Letters, 13,
627–642.
McKinney, M.L. & Lockwood, J.L. (1999) Biotic homogenization: a few winners replacing many
losers in the next mass extinction. Trends in Ecology and Evolution, 14, 450-453.
Millenium Ecosystem Assessment (2012). Available from
http://www.millenniumassessment.org/en/index.html, accessed on 21/11/2012.
Mouillot, D., Dumay, O. & Tomasini J.A. (2007) Limiting similarity, niche filtering and functional
diversity in coastal lagoon fish communities. Estuarine, Coastal and Shelf Science, 71,
443-456.
Münkemüller, T., de Bello, F., Meynard, C.N., Gravel, D., Lavergne, S., Mouillot, D., Mouquet, N.,
& Thuiller, W. (2012) From diversity indices to community assembly processes: a test
with simulated data. Ecography, 35, 468-480.
Musgrove, A.J., Austin, G.E., Hearn, R.D., Holt, C.A., Stroud, D.A. & Wotton, S.R. (2011)
Overwinter population estimates of British waterbirds. British Birds, 104, 364-397.
O’Connor, R.J. (1981) Patterns of shorebird feeding. In Estuary birds of Britain and Ireland. (ed.
A.J.Prater), pp 34-50. T & A D Poyser Ltd, Town Head House, Calton, Waterhouses,
Staffordshire, England.
Pavoine, S. & Bonsall, M.B. (2011) Measuring biodiversity to explain community assembly: a
unified approach. Biological reviews of the Cambridge Philosophical Society, 86, 792–
812.
Petchey, O.L. (2004). On the statistical significance of functional diversity effects. Functional
Ecology, 18, 297–303.
Petchey, O.L., Evans, K.L., Fishburn, I.S. & Gaston, K.J. (2007) Low functional diversity and no
redundancy in British avian assemblages. Journal of Animal Ecology, 76, 977-85.
Petchey, O.L. & Gaston, K.J. (2002) Functional diversity (FD), species richness and community
composition. Ecology letters, 5, 402-411.
Petchey, O.L. & Gaston, K.J. (2006) Functional diversity: back to basics and looking forward.
Ecology letters, 9, 741-758.
Rehfisch, M.M., Austin, G.E., Freeman, S.N., Armitage, M.J.S. & Burton, N.H.K. (2004) The
possible impact of climate change on the future distributions of waders on Britain’s

General introduction
16
non-estuarine coast. Ibis, 146, 70-81.
Rehfisch, M., Holloway, S., Yates, M. & Clarke, R. (1997). Predicting the effect of habitat change
on waterfowl communities: a novel empirical approach. In: Goss-Custard, J.D., Rufino,
R., Luis, A., (eds) Effect of habitat loss and change on waterbirds. London, The
Stationery Office, 116-126, 144pp. (ITE Symposium, 30).
Ricklefs, R.E. & Travis, J. (1980) A morphological approach to the study of avian community
organization. Auk, 97, 321-338.
Schmid, B. & Hector, A. (2004) The value of biodiversity experiments. Basic and Applied
Ecology, 5, 535-542.
Slingsby, J.A. & Verboom, G.A. (2006) Phylogenetic relatedness limits co-occurrence at fine
spatial scales: evidence from the schoenoid sedges (Cyperaceae: Schoeneae) of the
Cape Floristic Region, South Africa. American Naturalist, 168, 14-27.
Stroud, D.A., Chambers, D., Cook, S., Buxton, N., Fraser, B., Clement, P., Lewis, P., McLean, I.,
Baker, H. & Whitehead, S. (2001) The UK SPA network: its scope and content. Volume 2:
species accounts. JNCC, Peterborough.
Tilman, D. (2001) Functional diversity. In: Encyclopaedia of Biodiversity (ed. Levin, S.A.) pp. 109-
120 Academic Press, San Diego, CA.
Thaxter, C.B., Sansom, A. Thewlis, R.M., Calbrade, N.A, Ross-Smith, V.H., Bailey, S., Mellan, H. &
Austin, G.E. (2010) Wetland Bird Survey Alerts 2006/2007: changes in numbers of
wintering waterbirds in the constituent countries of the United Kingdom, Special
Protection Areas (SPAs) and Sites of Special Scientific Interest (SSSIs). BTO Research
Report 556. BTO, Thetford.
Thompson, K., Petchey, O.L., Askew, A.P., Dunnett, N.P., Beckerman, A.P. & Willis, A.J. (2010)
Little evidence for limiting similarity in a long-term study of a roadside plant
community. Journal of Ecology, 98, 480-487.
Valone, T.J. & Schutzenhofer, M.R. (2007) Reduced rodent biodiversity destabilizes plant
populations. Ecology, 88, 26–31.
van de Kam, J., Ens, B., Piersma, T. & Zwarts, L. (2004) Shorebirds: An illustrated behavioural
ecology. KNNV Publishers, Utrecht.
Vitousek, P.M., Aber, J.D., Howarth, R.W., Likens, G.E., Matson, P.A., Schindler, D.W., Schlesinger,
W.H. & Tilman, D.G. (1997) Human alteration of the global nitrogen cycle: sources and

General introduction
17
Consequences. Ecological Applications, 7, 737-750.
Walker, B.H. (1992) Biodiversity and ecological redundancy. Biological Conservation, 6, 18-23.
West, A.D., Goss-Custard, J.D., Stillman, R.A., Caldow, R.W.G., Durell, S.E.A. le V. dit &
McGrorty, S. (2002) Predicting the impacts of disturbance on wintering waders using a
behaviour-based individuals model. Biological Conservation, 106, 319–328.
Zobel, M. (1997) The relative role of species pools in determining plant species richness: an
alternative explanation of species coexistence? Trends in Ecology & Evolution, 12, 266-
269.

18
Chapter one

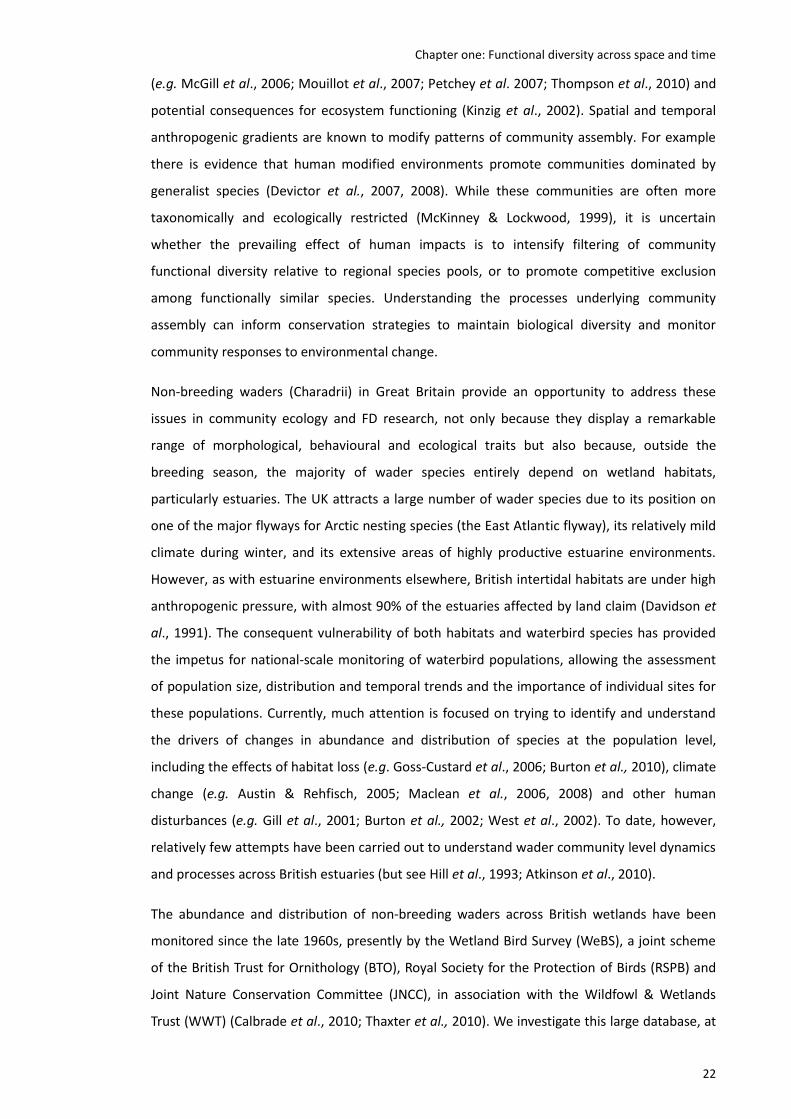
Chapter one: Functional diversity across space and time
19
Functional diversity across space and time: trends in wader communities on British estuaries
Diversity and Distributions, 18, 356-365, 2012.
Veronica Mendez1, Jennifer A. Gill1, Niall H. K. Burton2, Graham E. Austin2, Owen L. Petchey3
and Richard G. Davies1
1 School of Biological Sciences, University of East Anglia, Norwich NR4 7TJ, UK
2 British Trust for Ornithology, The Nunnery, Thetford IP24 2PU, UK
3 Institute for Evolutionary Biology and Environmental Studies, University of Zurich,
Winterthurerstrasse 190, 8057 Zurich, Switzerland.

Chapter one: Functional diversity across space and time
20
Abstract
Aim British estuarine ecosystems support large populations of protected migratory waders.
Understanding how wader communities vary spatially and how they may be changing
temporally can greatly improve understanding of these dynamic ecosystems. Here we explore
the variation in functional diversity (using a range of morphological and ecological traits) in
order to identify the processes shaping wader communities on British estuaries and how these
processes may be changing.
Methods We use national survey data (Wetland Bird Survey) from 1980/81 to 2006/07 winter
to calculate functional diversity (FD) – an index that measures trait dispersion - in wader
communities on 100 estuaries. We test for evidence of non-random patterns of diversity and
explore the relative importance of two key processes, environmental filtering and competition,
in shaping these communities.
Results The observed FD was significantly and positively associated with species richness and to
a lesser extent estuary area, followed by longitude. An increase in observed FD was observed
since 1980, supported by a small but significant slope. In the majority of cases, changes in FD
were mirrored by changes in species richness. Observed FD was on average lower than
expected by chance, as indicated by a negative value of observed minus expected FD. However,
this difference became less negative over time, with observed minus expected FD values
increasing slightly, but significantly, over the study period.
Main conclusions Wader FD varies across British estuaries and the relative influence of the
processes by which communities are structured appears to be changing through time. We
discuss the potential drivers underlying these patterns and the importance of identifying such
drivers for the protection of wader communities.
Keywords Community composition, community structure, competition, environmental filtering,
functional diversity, waders.

Chapter one: Functional diversity across space and time
21
Introduction
Classically, macro-ecological studies have focused on understanding patterns of biodiversity
distribution such as patterns in the frequency distributions of species characteristics (e.g.
Blackburn & Gaston, 1994), relationships between species characteristics (e.g. Stevens, 1989),
species richness (e.g. Rosenzweig, 1995) and the possible mechanisms driving such patterns
(e.g. MacArthur & Levins, 1967; Hubbell, 2001). More recently, ecological studies have focused
more attention on the implications of global biodiversity decline and ecosystem functioning,
focusing on developing measures of functional diversity (reviewed in Petchey & Gaston, 2006;
Mouchet et al., 2010).
Functional diversity (hereafter referred to as FD) measures the extent of functional trait
dispersion of natural communities (Diaz & Cabido, 2001; Tilman, 2001). FD is a biodiversity
metric that carries information on the variety of life styles and ecological roles contributed by
species. It provides a basis for an understanding not only of the mechanistic links between
biodiversity and ecosystems (Diaz & Cabido, 2001; Tilman, 2001; Hooper et al., 2002), but also
of which mechanisms act to promote species coexistence and hence community structure
(Mouquet et al., 2002; Petchey & Gaston, 2002, 2006). Several distinct community assembly
dynamics have previously been postulated to explain species coexistence. Neutral theory is
predicated on the idea that communities represent random assemblages from a regional pool,
with species coexisting independently of their traits and all individuals of all species being
functionally equivalent; i.e. species are identical in their competitive ability, dispersion and
fitness (Hubbell, 2001, 2005, 2006). In contrast, classical assembly rules theory (i.e. niche-
based models) predicts that communities are assembled non-randomly, based on the
similarities or differences in their traits through the dual influences of environmental filtering
effects and/or species interactions. The environmental filtering model assumes that abiotic
factors act as a filter constraining specific traits within the species pool, hence allowing a
relatively narrow range of trait values to be present in natural communities. As a result, the FD
of a community will be lower than expected by random assembly and coexisting species will be
more functionally similar than expected. Alternatively, models based on species interactions, in
particular competition, assume that there will be displacement between species with similar
traits and that natural communities will form primarily from species with complementary
traits. As a result, the FD of the community will be greater than expected by chance and hence
coexisting species will be more functionally dissimilar than expected (e.g. Holdaway & Sparrow,
2006; Petchey et al., 2007; Thompson et al., 2010).
Understanding spatial and temporal variation in community FD is important because different
levels of trait dispersion among communities suggest the operation of different assembly rules
Chapter one: Functional diversity across space and time
22
(e.g. McGill et al., 2006; Mouillot et al., 2007; Petchey et al. 2007; Thompson et al., 2010) and
potential consequences for ecosystem functioning (Kinzig et al., 2002). Spatial and temporal
anthropogenic gradients are known to modify patterns of community assembly. For example
there is evidence that human modified environments promote communities dominated by
generalist species (Devictor et al., 2007, 2008). While these communities are often more
taxonomically and ecologically restricted (McKinney & Lockwood, 1999), it is uncertain
whether the prevailing effect of human impacts is to intensify filtering of community
functional diversity relative to regional species pools, or to promote competitive exclusion
among functionally similar species. Understanding the processes underlying community
assembly can inform conservation strategies to maintain biological diversity and monitor
community responses to environmental change.
Non-breeding waders (Charadrii) in Great Britain provide an opportunity to address these
issues in community ecology and FD research, not only because they display a remarkable
range of morphological, behavioural and ecological traits but also because, outside the
breeding season, the majority of wader species entirely depend on wetland habitats,
particularly estuaries. The UK attracts a large number of wader species due to its position on
one of the major flyways for Arctic nesting species (the East Atlantic flyway), its relatively mild
climate during winter, and its extensive areas of highly productive estuarine environments.
However, as with estuarine environments elsewhere, British intertidal habitats are under high
anthropogenic pressure, with almost 90% of the estuaries affected by land claim (Davidson et
al., 1991). The consequent vulnerability of both habitats and waterbird species has provided
the impetus for national-scale monitoring of waterbird populations, allowing the assessment
of population size, distribution and temporal trends and the importance of individual sites for
these populations. Currently, much attention is focused on trying to identify and understand
the drivers of changes in abundance and distribution of species at the population level,
including the effects of habitat loss (e.g. Goss-Custard et al., 2006; Burton et al., 2010), climate
change (e.g. Austin & Rehfisch, 2005; Maclean et al., 2006, 2008) and other human
disturbances (e.g. Gill et al., 2001; Burton et al., 2002; West et al., 2002). To date, however,
relatively few attempts have been carried out to understand wader community level dynamics
and processes across British estuaries (but see Hill et al., 1993; Atkinson et al., 2010).
The abundance and distribution of non-breeding waders across British wetlands have been
monitored since the late 1960s, presently by the Wetland Bird Survey (WeBS), a joint scheme
of the British Trust for Ornithology (BTO), Royal Society for the Protection of Birds (RSPB) and
Joint Nature Conservation Committee (JNCC), in association with the Wildfowl & Wetlands
Trust (WWT) (Calbrade et al., 2010; Thaxter et al., 2010). We investigate this large database, at

Chapter one: Functional diversity across space and time
23
the level of whole estuaries (equivalent to a landscape scale), in order to (1) examine spatial
and temporal variation in FD of wader communities across Great Britain over the last 27 years,
and (2) understand the extent to which wader communities are assembled randomly or non-
randomly and hence whether there are discernable patterns of community assembly. The
observed patterns are discussed in the context of the possible ecological drivers and/or
anthropogenic impacts which may underlie such trends.
Methods
Data collection
We used bird count data from 100 estuaries distributed across Great Britain from the WeBS
Core Count scheme for the period 1980/81 to 2006/07 in our analysis. Estuary area was
derived from a GIS shapefile of estuary boundaries of high tide WeBS Core Count sectors.
Under the WeBS scheme and its predecessors, synchronized monthly counts are carried out at
the UK’s important wetlands on predetermined dates (minimizing the likelihood of double
counting some individuals or missing others) to provide the information needed to monitor the
populations of UK non-breeding waterbirds. Detailed information on the survey methodology,
count accuracy and completeness are provided in Calbrade et al. (2010).
Different wader species occur in Great Britain at different times of the year. Some species are
passage and/or winter visitors (e.g. grey plover Pluvialis squatarola), whereas others are
migrant and/or resident breeders with numbers supplemented by visitors in winter (e.g. avocet
Recurvirostra avosetta). WeBS counts are made all year round, though wader populations are
at their greatest from October to March. We used only data recorded during winter
(November- February) when the number of birds using a site more accurately reflects stable
non-breeding population numbers. We restricted the analysis to twenty wintering species,
based on their high winter dependency on estuaries rather than other habitats (Table 1). All
species are waders with the exception of shelduck Tadorna tadorna, which (as elsewhere, e.g.
Clark & Prys-Jones, 1994) is included here since it is highly dependent on estuaries for winter
feeding and has a similar feeding ecology to waders, in particular being reliant on intertidal
invertebrate prey.
WeBS counters record all waterbirds seen on a site. However, some species recorded may not
typically be considered part of the wintering community, for example, a species only recorded
during one month in very low numbers. Consequently, only species occurring on a site in at
least 60% of all winter months counted were included within the community at that particular
site. Analyses of the data with and without this constraint on species inclusion were conducted

Chapter one: Functional diversity across space and time
24
and both produced qualitatively very similar results. Hence, we only present the former results.
Table 1. The 20 species of waterbirds included in the analyses. All species are waders with the
exception of shelduck Tadorna tadorna.
Common name Scientific name
Ringed plover Charadrius hiaticula
Golden plover Pluvialis apricaria
Grey plover Pluvialis squatarola
Lapwing Vanellus vanellus
Oystercatcher Haematopus ostralegus
Avocet Recurvirostra avosetta
Turnstone Arenaria interpres
Sanderling Calidris alba
Dunlin Calidris alpina
Knot Calidris canutus
Purple sandpiper Calidris maritima
Ruff Philomachus pugnax
Bar-tailed Godwit Limosa lapponica
Black-tailed Godwit Limosa limosa
Curlew Numenius arquata
Whimbrel Numenius phaeopus
Spotted redshank Tringa erythropus
Greenshank Tringa nebularia
Redshank Tringa totanus
Shelduck Tadorna tadorna
Measuring observed and expected FD
Waders display a remarkably high level of behavioural and morphological variation, particularly
with regards to their feeding apparatus and feeding ecology (Burton, 1974). This results in
variation in the types of prey that are exploited. To calculate the community FD at each estuary
every year, seven trait types were chosen to capture this key aspect of variation among waders
relating to their capacity to exploit food resources (Table 2, see Appendix 1 for descriptions of
the foraging methods). Similar combinations of traits have already been used in other studies
of avian FD (e.g. Petchey et al., 2007). The size of the prey can influence the distribution of
individuals within estuaries (Alves et al., 2013) and could also influence the position of species
within the functional space. However, there is no data available regarding the prey size
consumed by the majority of the species included in this analysis. However, prey sizes are

Chapter one: Functional diversity across space and time
25
limited by bill structure and size as well as prey profitability (van de Kam et al., 2004).
Furthermore, prey detectability can also influence the types and sizes of prey that are
consumed and waders have evolved different mechanisms related to the eyes and pressure –
sensory mechanisms within the bill that allows them to increase the detectability of their prey
(Gill, 2012). Therefore, the combination of traits presented in Table 2 represents an adaptation
of waders to prey type and size, capturing the influence of prey size on the presence/absence
of species in estuaries. Trait values were obtained from the BTO data base
(http://www.bto.org/about-birds/birdfacts) and from The Birds of the Western Palaearctic on
interactive DVD-ROM (2006), using information for populations that occur in UK whenever
possible. Mean trait values for species were used for continuous traits, while diet components,
foraging methods and traits involved in prey location were divided into independent binary
traits, as these are not mutually exclusive (Petchey et al., 2007).
Table 2. Traits used to measure functional diversity with regard to resource use. Trait values
were obtained from the British Trust for Ornithology database and from The Birds of the
Western Palaearctic on interactive DVD-ROM (2006), using information for populations that
occur in UK whenever possible.
Trait Type Values Units/ Categories
Body mass Continuous Mean Gram
Bill length Continuous Mean Centimetre
Tarsus length Continuous Mean Centimetre
Bill shape Categorical 3 categories Up-curved, straight, down-curved
Main component of diet Binary 9 categories Insects, crustaceans, worms,
molluscs, medusa, amphibians, fish,
plant material, others
Location of prey Binary 2 categories Touch, sight
Main foraging strategy Binary 10 categories Pecking, probing, jabbing, stitching,
ploughing, scything, foot trembling,
turning over objects, hammering,
swimming
To calculate the values of FD for each community on each site in each year, we followed
Petchey & Gaston’s (2002, 2006) methodology, using species presence/absence data. First, the
entire species by trait matrix for all 20 species was converted into a distance matrix and this
was then clustered to produce the functional dendrogram that describes the functional
relationships between species. Gower distance was used throughout because it can deal with
data-sets comprising continuous, ordinal and categorical traits (Gower, 1971; Pavoine et al.,

Chapter one: Functional diversity across space and time
26
2009). UPGMA clustering was used because when compared with other clustering algorithms -
single and complete - it produced a dendrogram with the highest cophenetic correlation (c =
0.7) (Appendix 2).
The regional FD (i.e. the FD for a community with all 20 species) was measured as the total
branch length of the dendrogram and was used to standardize all measures of FD to vary
between 0 and 1, where 0 occurs for single species communities and 1 for communities
including all 20 species. The local FD (i.e. observed FD) was measured as the sum of the branch
lengths connecting all the species present in a given community. To calculate expected FD,
random communities were assembled, controlling for number of species, under two
alternative null models. First, the random communities were assembled assuming that each
species from the regional pool has the same chance of occurring. Second, the random
communities were constructed based on the relative occurrence of species summed across the
data set. In both cases, 1000 independent randomizations were made per estuary site. We
confirm that parameter estimates had stabilised after 1000 randomizations. FD was calculated
for each of the 1000 random communities and the mean was used as the expected FD for each
random community in each site. Analyses of the data using both null models produced
qualitatively very similar results. We only present the second approach, as we believe it is more
realistic to take into account the frequency of occurrence of species. However, we note that, to
date, there is no consensus on how best to generate the random communities for the null
models and this is still widely debated (e.g. Mason et al., 2007; Thompson et al., 2010; de
Bello, 2011). All analyses were conducted in R (R Development Core Team 2010).
Analysing variation in observed FD
To understand the variation in FD across British estuaries, we used bivariate and multiple
regression analysis where observed FD was modelled as a function of species richness, estuary
area, latitude and longitude. We tested the fit of all combinations of these four predictors and
determined which model had the lowest AIC value, and which set of models together had
>0.95 probability of including the best model (Burnham & Anderson, 2001). We also compared
the explanatory power of the predictors.
In order to explore changes in species richness and wader FD over time, we used mixed effects
models where richness and FD were modelled as a function of year and estuary, with estuary
as a random effect. The random structure in the statistical model accounted for some of the
variation introduced by each estuary. Estuaries with poor temporal coverage (temporal
coverage < 80%) were excluded from the analyses. We assessed the extent to which spatial
autocorrelation might be influencing our statistical models by plotting model residuals using

Chapter one: Functional diversity across space and time
27
the Moran’s I correlogram function in Spatial Analysis for Macroecology (SAM) software v4.0
(Rangel et al., 2010). Spatial autocorrelation was not significant (P>0.05) for any lag-distance
class within our data.
Analysing variation in observed and expected FD
We compared patterns of observed FD of local communities with patterns of expected FD of
random communities to investigate community assembly patterns. We used a standardised
measure of comparison between observed and expected, the standardised effect size index
(SES; Gotelli & McCabe, 2002), calculated as (observed FD – expected FD)/standard deviation
of expected FD. Local communities are considered to be assembled at random if SES is not
significantly different from zero. However, if SES is significantly greater than 0, then trait
divergence/ complementarity is likely to occur due to interspecific competition, whereas if SES
is significantly less than 0, trait convergence / similarity due to environmental filtering is likely
to be the stronger influence on community structure (Petchey & Gaston, 2007; Hardy, 2008;
Thompson et al., 2010; de Bello, 2011).
We followed the methodology described in Thompson et al. (2010) to estimate if SES: (i) was
significantly different from zero; (ii) varied between estuaries; (iii) changed through time, and
(iv) changed differently through time between estuaries. Two statistical models were used,
where SES was modelled as a function of year and estuary, with estuary as a random effect
allowing each estuary to have a different rate of change through time (model 1) and with each
estuary having the same rate of change through time (model 2). In both models, year was
treated as a continuous variable and accounted for temporal autocorrelation and non-
independence caused by repeated measures at the same estuary. Prior to the analyses, year
was transformed by subtracting the mean and rescaling to the interval [-1, 1]. Thus, the
intercept estimates coincided with the middle point of the time period of this study (year
1993) and the slope estimates were changes in SES expected over half of the time period. The
overall intercept of each model is the mean of the intercept values for each estuary.
To address the points described above (i) the overall intercept of model 1 was used and the
significance was tested generating a sample from the posterior distribution of the parameter
using Markov chain Monte Carlo simulation; (ii) we compared the explanatory power between
model 2 and the same model without random effect using a likelihood ratio test; (iii) the
significance of the year effect in model 2 was tested with Markov chain Monte Carlo
simulation, and (iv) a likelihood ratio test was used to compare the explanatory power between
model 1 and model 2 (Thompson et al., 2010).

Chapter one: Functional diversity across space and time
28
A sensitivity analysis was conducted in order to assess the influence of uncommon species on
the observed patterns of functional diversity and their differences with expected functional
diversity. To do this we removed one at a time, the three species with lowest frequencies of
occurrence, both from our observed communities and from the regional species pool, and re-
ran our analyses. The three species were whimbrel (Numenius phaeopus), spotted redshank
(Tringa erythropus) and ruff (Philomachus pugnax). For all three species removals, the changes
to the results were negligible and did not alter the overall findings and conclusions from
analyses of the complete communities. We therefore only present the results from the latter
set of analyses.
Results
Observed functional diversity patterns
For the last year of the study data (2006/7), bivariate tests showed that observed FD across
estuaries is strongly positively associated with species richness and to a lesser extent estuary
area, followed by longitude (Figure 1). In contrast, there is no significant latitudinal gradient in
absolute levels of wader community FD around Great Britain (Figure 1c). Multiple regression
models of all combinations of predictors showed that the model with species richness alone
had the lowest AIC (-326.1) and a probability (Akaike weight) of 0.84 of being the best model.
This model and the model containing both species richness and longitude had a combined
probability of 0.986 that they included the best model. However, simultaneously fitting species
richness inverted the slope of relationship for longitude to negative. The regression results for
each of the other data years tested separately showed essentially the same pattern, hence we
present only the results for 2006/7. Spatial autocorrelation was found to be absent from
residuals of the best-fit models (Moran’s I associated p-values > 0.05).
Overall, an increase in species richness and FD was observed since 1980 (Figure 2) and
supported by a small but significant positive slope in both models (p<0.0001). Figure 3 shows
the spatial distribution of FD at the beginning and the end of the time period and the absolute
change in FD.

Chapter one: Functional diversity across space and time
29
Figure 1. Relationships between observed wader functional diversity across 100 British
estuaries and (a) the number of species present, (b) estuary area (log transformed), (c) latitude
and (d) longitude. For presentation purposes, only the final year (winter 2006/07) is shown.
The solid line is the linear model predicted relationship for (a) R2=0.9, p < 0.0001, (b) R2=0.5, p
< 0.0001, (c), R2=0.01, p=0.1 and (d) R2=0.2, p<0.0001. FD is standardised to the interval [0, 1].
Differences from expected functional diversity
The observed FD in British wader communities was on average lower than expected by chance,
as indicated by a negative overall intercept in the mixed models relating SES to year and site
(Table 3). The explanatory power of the negative relationship between species richness and
SES is very weak (R2 = 0.04), but statistically significant (p=0.04) (Figure 4.).

Chapter one: Functional diversity across space and time
30
Table 3. Parameter estimates from the mixed effects model of variation in SES, the
standardised effect size, calculated as (observed FD - expected FD)/standard deviation in
expected FD. Also given χ2 values and associated significance values for each. Significance is
given at the 95% confidence interval.
Parameter Estimate (SE) χ2 p
Differences in estuary slopes
(random effects)
NA 89.406 <0.00001
Differences in estuary intercepts
(random effects)
NA 1085.929 <0.00001
Overall slope (Year effect) 0.01 (0.001) NA 0.03
Overall intercept -0.14 (0.06) NA 0.0003
Figure 2. Temporal trend of (a) species richness (slope = 0.05, p < 0.0001) and (b) observed
functional diversity (slope = 0.003, p < 0.0001) in wader communities across British estuaries.
For ease of interpretation, mean values of observed FD were calculated for each year and
standard errors are represented.
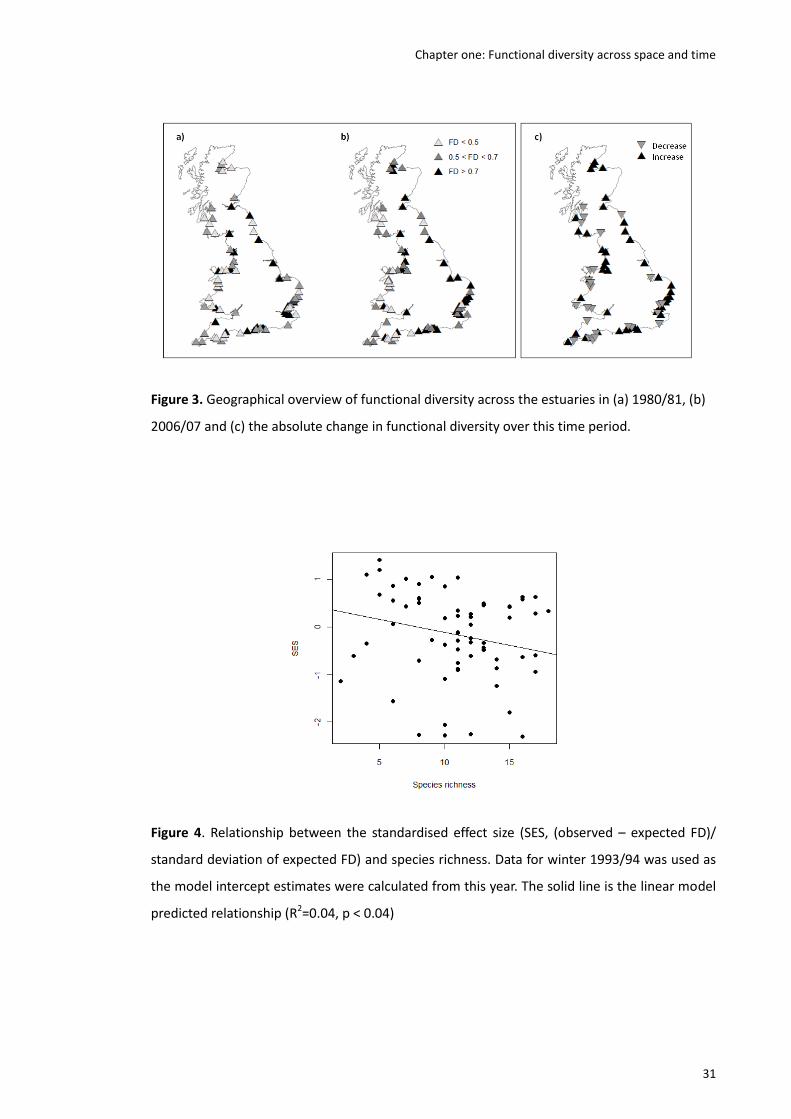
Chapter one: Functional diversity across space and time
31
Figure 3. Geographical overview of functional diversity across the estuaries in (a) 1980/81, (b)
2006/07 and (c) the absolute change in functional diversity over this time period.
Figure 4. Relationship between the standardised effect size (SES, (observed – expected FD)/
standard deviation of expected FD) and species richness. Data for winter 1993/94 was used as
the model intercept estimates were calculated from this year. The solid line is the linear model
predicted relationship (R2=0.04, p < 0.04)

Chapter one: Functional diversity across space and time
32
Observed and expected FD differed less over time, with the SES values increasing slightly
(Figure 5), but significantly over the study period (overall slope in Table 3). At the beginning of
the time period the overall observed FD was lower than expected FD across the majority of the
estuaries, whilst by the end of the time period, the overall difference shifted towards having a
greater FD than expected by chance (Figure 6).
Figure 5. Temporal patterns of deviation of the standardised effect size (SES) from zero in
wader communities across British estuaries. For ease of interpretation, mean values of FD
difference were calculated for each year and standard errors are represented.
SES varied between estuaries and at different rates, supported by a significant variation
between estuaries and a year-estuary interaction (differences in estuary random intercepts
and random slopes in Table 3). The estimated value for the variance in the random intercepts
(d2 = 0.36), which determines the amount of variation around the overall model intercept, was
considerably greater than the variance in the estuary random slope (d2 =0.0004), which
determines the variation in slope at each estuary.
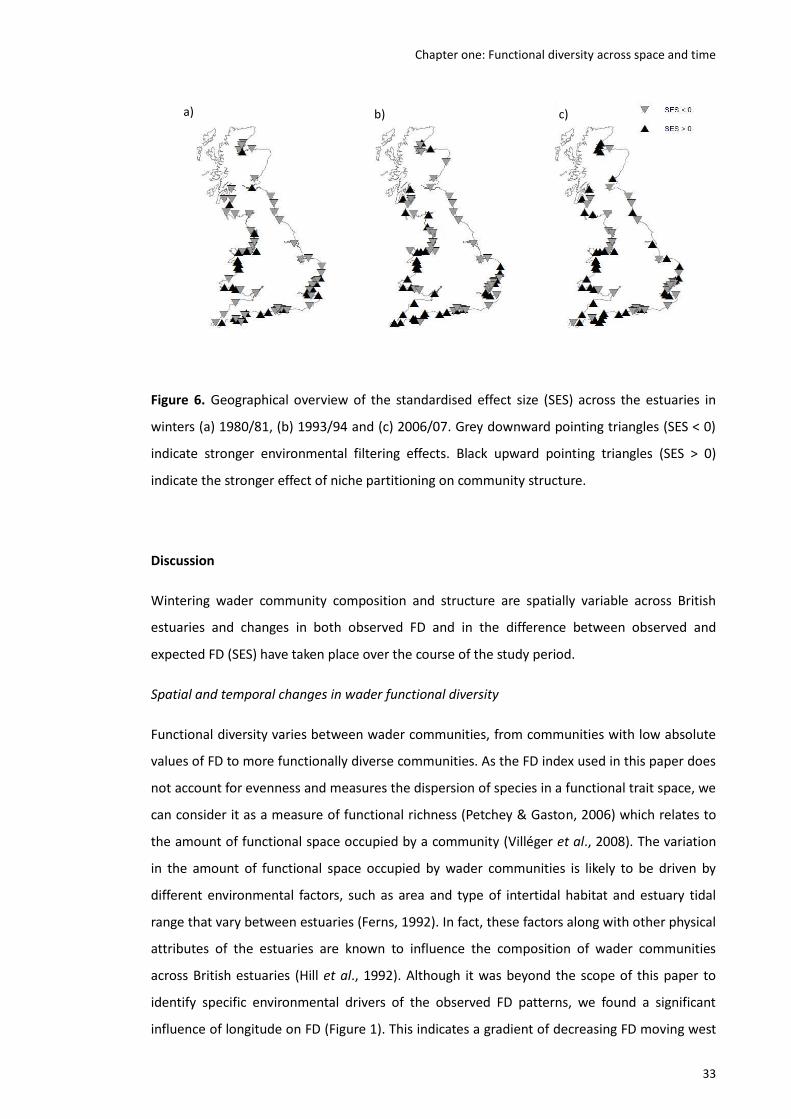
Chapter one: Functional diversity across space and time
33
Figure 6. Geographical overview of the standardised effect size (SES) across the estuaries in
winters (a) 1980/81, (b) 1993/94 and (c) 2006/07. Grey downward pointing triangles (SES < 0)
indicate stronger environmental filtering effects. Black upward pointing triangles (SES > 0)
indicate the stronger effect of niche partitioning on community structure.
Discussion
Wintering wader community composition and structure are spatially variable across British
estuaries and changes in both observed FD and in the difference between observed and
expected FD (SES) have taken place over the course of the study period.
Spatial and temporal changes in wader functional diversity
Functional diversity varies between wader communities, from communities with low absolute
values of FD to more functionally diverse communities. As the FD index used in this paper does
not account for evenness and measures the dispersion of species in a functional trait space, we
can consider it as a measure of functional richness (Petchey & Gaston, 2006) which relates to
the amount of functional space occupied by a community (Villéger et al., 2008). The variation
in the amount of functional space occupied by wader communities is likely to be driven by
different environmental factors, such as area and type of intertidal habitat and estuary tidal
range that vary between estuaries (Ferns, 1992). In fact, these factors along with other physical
attributes of the estuaries are known to influence the composition of wader communities
across British estuaries (Hill et al., 1992). Although it was beyond the scope of this paper to
identify specific environmental drivers of the observed FD patterns, we found a significant
influence of longitude on FD (Figure 1). This indicates a gradient of decreasing FD moving west
a) b) c)

Chapter one: Functional diversity across space and time
34
to east across UK estuaries when species richness is accounted for. We also found a significant
positive influence of estuary area. However, this is almost certainly attributable to species-area
relationships that are likely to result in part from area-habitat heterogeneity relationships. This
is supported by the fact that area does not add to model likelihood for any models in which
species richness is fitted. The variation in FD seems therefore to be primarily driven by the
number of species present in the community; the more species in the community the greater
the functional trait space occupied.
Functional diversity is increasing through time across the majority of estuaries (Figure 2 and 3).
However, this should be interpreted cautiously. While WeBS coverage from early 1980s is good
across the majority of the sites, there are some limitations to count data at the beginning of
the time period since the recording effort was not consistent in all the sites covered. Despite
this limitation, real increases in the number of species recorded across estuaries in Britain have
been observed since the early 1980s (Austin & Rehfisch, 2005; Calbrade et al., 2010), which
could result in changes in community composition by the arrival of new species and/or
replacement by species with more distinctive traits. As a consequence, variation in the amount
of functional space filled by the community may occur, causing changes in FD. As with the
spatial patterns of FD (above), since the species selected in this study are quite functionally
distinct (Figure 1a), increases in species richness over time will result in a greater functional
trait space occupied by communities, hence greater FD. The exploitation of prey of different
shape, size and burrowing depth within the sediment, is considered to have played a key role in
the evolution of wader morphology and behaviour (Burton, 1974; van de Kam et al., 2004). The
relationship between species richness and FD in the present study suggests that there is
relatively little evidence of functional redundancy among wader species present in UK
estuaries.
Spatial and temporal changes in observed and expected wader functional diversity
Our results reinforce the role of environmental conditions in shaping wader communities at
landscape scales because, overall, wader FD is lower than expected by chance (overall
intercept, Table 3). These results provide evidence that wintering wader communities show
greater similarity in functional traits than expected from a random assembly with equivalent
number of species, suggesting that environmental conditions are, to a certain extent, acting as
a filter on which species are present at any given site.
In a previous study on FD of 192 species of British breeding bird, there was also a negative
departure from levels of FD expected from random community assembly (Petchey et al., 2007).
As with their study, our results show that, despite the stronger effect of environmental filtering

Chapter one: Functional diversity across space and time
35
overall, competition could also be structuring wader communities, as indicated by the variation
in estuary random intercepts and the positive departures from expected FD observed in some
estuaries (Table 3 and Figure 6). Thus, both processes are likely to interact simultaneously but
their relative influence might be community specific. Differences in observed minus expected
FD between estuaries, are not well explained by the number of species present in the estuary,
since the explanatory power of this relationship is very small, even if statistically significant
(Figure 4). The evidence for niche partitioning versus environmental filtering varies among UK
estuaries, and these differences are likely to be explained by factors operating at a number of
scales that influence the presence of wader species in estuaries, including those affecting
whole estuaries and those at the more local scale of species interactions.
Differences in the strength of the mechanism(s) assembling bird communities between
Petchey et al.’s (2007) and this study might be attributable to one or a combination of three
factors. (1) The spatial scale of the studies; lower than expected FD occurs at regional scales in
Petchey et al. (2007), whereas our study is at a finer spatial scale and the levels of niche
partitioning and environmental filtering seem to vary between communities. The effect of
species interactions are likely to be stronger at finer, more local scales whereas constraining
environmental conditions are more likely to explain diversity patterns at larger scales. (2) The
different taxonomic breadth of species studied; although we use a similar set of functional
traits, Petchey et al. (2007) considered a wide range of breeding bird species occurring in the
UK, occupying both terrestrial and coastal habitats. Our study focuses on non-breeding wader
communities, the structure of which will have been shaped by very different influences. (3)
There are differences in the methods used to calculate expected FD and thus in the statistical
models used to test whether observed FD differs significantly from expected FD. In particular,
Petchey et al. (2007) controlled for number of species in calculating expected FD but did not
control for the species’ frequency of occurrence. As discussed by Thompson et al. (2010), when
frequency of occurrence is not accounted for, the random communities tend to have relatively
high FD as all the species have the same probability of occurring (not accounting for rarity) and,
hence, environmental filtering effects are more pronounced. Comparing both types of null
model in the present study confirmed this tendency.
Interestingly, we also found evidence for changes in the temporal dynamics of the wader
communities on British estuaries. The difference between observed and expected FD became
less negative through the study period (Figure 5), with a small but significant year effect (Table
3), suggesting that levels of niche partitioning may have become stronger through time and/or
that environmental filtering has become weaker. Some of the wader communities are seen to
have shifted from a negative to a positive difference between observed and expected FD over

Chapter one: Functional diversity across space and time
36
time. Changes in habitat (total area, relative abundance of habitat types and complexity) and in
the amount of resource available due to changes in sea level, land claim for agriculture,
industry and harbour development or other anthropogenic pressures (e.g. shell-fishing), might
account for the suggested increase in the strength of competition. According to the limiting
similarity theory (Macarthur & Levins, 1967), there will be stronger competition effects
between species that are more similar in exploiting the available resource. Thus, following any
reduction of resources due to changes or loss of habitat, or expansion in population density
and distribution range of particular species, competition for similar resources is predicted to
intensify, thereby increasing the chance of one species displacing another that shares its food
resources. Under this scenario increased competition may result in a community with species
that are more complementary to one another, increasing community FD relative to that
expected by chance. However, as mentioned above, the observed patterns might also be
attributable to a weaker influence of environmental filtering. Winters in the UK are generally
becoming milder and less severe, with an increase in mean temperatures and a decrease in the
number of days with ice cover. Previous analysis of WeBS data has shown how the distributions
of several wader species wintering on British estuaries have changed in association with these
changing climatic conditions (Austin & Rehfisch, 2005; Maclean et al., 2008). These milder
conditions might therefore allow a wider spectrum of traits to persist, for a given number of
species present, hence reducing the strength of environmental filtering effects.
Many wader species in the UK are protected as features of Special Protection Areas (under the
EC Birds Directive 2009/147/EC (formerly 79/409/EEC): Stroud et al., 2001), Ramsar sites
(Wetlands of International Importance protected under the Ramsar Convention) and Sites of
Special Scientific Interest, while the estuaries themselves are protected under the EC Habitats
Directive (92/43/EEC). Clearly, if we wish to protect both bird species and estuaries we need to
understand the processes by which communities are sustained in the UK, in particular the
processes by which communities are assembled, and how they may be changing. The present
study using FD as a diversity measure increases our understanding of trait complementarity
amongst wintering wader species and points to likely processes driving species coexistence in
British estuaries. As Mouchet and colleagues pointed out recently (2010), we need to
understand the relative influence of each process on communities, as both environmental
filtering and competition may simultaneously be influencing the community structure.
However, disentangling which one has the stronger influence at landscape scale is very
challenging, not only because both can act simultaneously but also because they might be
community-specific. With the rapid pace of global environmental change, there is a need to
understand the extent to which the influence of spatial and temporal anthropogenic effects on
functional diversity, through changes in habitat, resource availability and climatic conditions,

Chapter one: Functional diversity across space and time
37
could be akin to environmental filtering (e.g. homogeneous habitat might narrow the spectrum
of species and thus the functional traits present) or could be promoting competition. For bird
populations in winter, a stable food supply is extremely important in meeting metabolic
requirements, especially under low temperatures. Food availability for waders might also be
changing due to shifts from bivalve dominated to more worm dominated communities as a
result of shellfisheries activities across British estuaries (Atkinson et al., 2010, and references
therein). The decrease in bivalve abundance towards a more limited resource may increase
competition between species. There is still much to learn about spatial and temporal patterns
of community functional diversity. As we have demonstrated, changes in functional trait
distributions are occurring in UK wader assemblages, suggesting simultaneous changes in the
functioning of estuary ecosystems.
Chapter one: Functional diversity across space and time
38
References
Alves, J.A., Gunnarsson, T.G., Potts, P.M., Sutherland, W.J. & Gill, J.A. (2013) Sex-biases in
distribution and resource use at different spatial scales in a migratory shorebird.
Ecology and Evolution. doi: 10.1002/ece3.503.
Atkinson, P.W., Maclean, I.M. & Clark, N.A. (2010) Impacts of shellfisheries and nutrient inputs
on waterbird communities in the Wash, England. Journal of Applied Ecology, 47, 191-
199.
Austin, G.E. & Rehfisch, M.M. (2005) Shifting non-breeding distributions of migratory fauna in
relation to climatic change. Global Change Biology, 11, 31-38.
Blackburn, T.M. & Gaston, K.J. (1994) Animal body-size distributions-patterns, mechanisms and
implications. Trends in Ecology & Evolution, 9 (12), 471-474.
Buck, A.L. (1997) An inventory of UK estuaries. Peterborough, Joint Nature Conservation
Committee.
Burnham, K.P. & Anderson, D.R. (2001) Model selection and multi-model inference: a practical
information–theoretic approach. New York, NY: Springer.
Burton, P.J.K. (1974) Feeding and Feeding Apparatus in Waders. British Museum (Natural
History), London
Burton, N.H.K., Armitage, M.J.S., Musgrove, A.J. & Rehfisch, M.M. (2002) Impacts of man-made
landscape features on numbers of estuarine waterbirds at low tide. Environmental
management, 30, 857-864.
Burton, N.H.K., Musgrove, A.J., Rehfisch, M.M. & Clark, N.A. (2010) Birds of the Severn Estuary
and Bristol Channel: their current status and key environmental issues. Marine
Pollution Bulletin, 61, 115-123.
Calbrade, N.A., Holt, C.A., Austin, G.E., Mellan, H.J., Hearn, R.D., Stroud, D.A., Wotton, S.R. &
Musgrove, A.J. (2010) Waterbirds in the UK 2008/09: The Wetland Bird Survey.
BTO/RSPB/JNCC in association with WWT. Thetford.
Clark, N.A. & Prys-Jones, R.P. (1994) Low tide distribution of wintering waders and Shelduck on
the Severn Estuary in relation to the proposed tidal barrage. Biological Journal of the
Linnean Society, 51, 199–217.
Davidson, N.C., Laffoley, D.d’A., Doody, J.P., Way, L.S., Gordon, J., Key, R., Pienkowski, M.W.,

Chapter one: Functional diversity across space and time
39
Mitchell, R. & Duff, K.L. (1991) Nature Conservation and Estuaries in Great Britain.
Nature Conservancy Council, Peterborough, UK.
de Bello, F. (2011) The quest for trait convergence and divergence in community assembly: are
null-models the magic wand? Global Ecology and Biogeography. In press.
Devictor, V., Julliard, R., Couvet, D., Lee, A. & Jiguet, F. (2007) The functional homogenization
effect of urbanization on bird communities. Conservation Biology, 21, 741-751.
Devictor, V., Julliard, R., Clavel, J., Jiguet, F., Lee, A. & Couvet, D. (2008) Functional biotic
homogenization of bird communities in disturbed landscapes. Global Ecology and
Biogeography, 17, 252-261.
Díaz, S. & Cabido, M. (2001) Vive la difference: plant functional diversity matters to ecosystem
processes. Trends in Ecology & Evolution, 16, 646-655.
Ferns, P.N. (1992) Bird life of coasts and estuaries. Cambridge: Cambridge University Press
Gill, J.A., Norris, K. & Sutherland, W.J. (2001) The effects of disturbance on habitat use by
black-tailed godwits, Limosa limosa. Journal of Applied Ecology, 38, 846-856.
Goss-Custard, J.D., Burton, N.H.K., Clark, N.A., Ferns, P.N., McGrorty, S., Reading, C.J., Rehfisch,
M.M., Stillman, R.A., Townend, I., West, A.D. & Worrall, D.H. (2006) Test of a behavior-
based individual-based model: response of shorebird mortality to habitat loss.
Ecological Applications, 16, 2215-2222.
Gotelli, N.J. & McCabe, D.J. (2002) Species co-occurrence: a meta-analysis of J. M. Diamond’s
assembly rules model. Ecology, 83, 2091-2096.
Gower, J.C. (1971) A general coefficient of similarity and some of its properties. Biometrics, 27,
857-874.
Hardy, O.J. (2008) Testing the spatial phylogenetic structure of local communities: statistical
performances of different null models and test statistics on a locally neutral
community. Journal of Ecology, 96, 914-926.
Hill, D., Rushton, S.P., Clark, N., Green, P. & Prys-Jones, R. (1993) Shorebird communities on
British estuaries: factors affecting community composition. Journal of Applied Ecology,
30, 220-234.
Holdaway, R.J. & Sparrow, A.D. (2006) Assembly rules operating along a primary riverbed-
grassland successional sequence. Journal of Ecology, 94, 1092-1102.
Chapter one: Functional diversity across space and time
40
Hooper, D.U. Solan, M., Symstad, A.J., Diaz, S., Gessner, M.O., Buchmann, N., et al. (2002)
Species diversity, functional diversity and ecosystem functioning. In Biodiversity and
Ecosystem Functioning: Syntheses and Perspectives (eds Loreau, M., Naeem, S. &
Inchausti, P.). Oxford Press, Oxford, pp. 195-208.
Hubbell, S.P. (2001) The Unified Neutral Theory of Biodiversity and Biogeography.
Princeton(NJ): Princeton University Press.
Hubbell, S.P. (2005) Neutral theory in community ecology and the hypothesis of functional
equivalence. Functional Ecology, 19, 166-172.
Hubbell, S.P. (2006) Neutral theory and the evolution of ecological equivalence. Ecology, 87,
1387-1398.
Kinzig, A., Pacala, S.W. & Tilman, D. (eds) (2002) The functional consequences of biodiversity:
empirical progress and theoretical extensions. Princeton University Press, Princeton, NJ.
MacArthur, R.H. & Levins, R. (1967) Limiting similarity convergence and divergence of
coexisting species. American Naturalist, 101, 377-385.
Maclean, I.M.D., Austin, G.E. & Rehfisch, M.M. (2006) Are responses to climate change
temperature dependent? Population changes in over-wintering migratory shorebirds.
Journal of Ornithology, 147, 26-26.
Maclean, I.M.D., Austin, G.E., Rehfisch, M.M., Blew, J., Crowe, O., Delany, S., Devos, K.,
Deceuninck, B., Gunther, K., Laursen, K., et al. (2008) Climate change causes rapid
changes in the distribution and site abundance of birds in winter. Global Change
Biology, 14, 2489-2500.
Mason, N.W.H., Lanoiselee, C., Mouillot, D., Irz, P. & Argillier, C. (2007) Functional characters
combined with null models reveal inconsistency in mechanisms of species turnover in
lacustrine fish communities. Oecologia, 153, 441-452.
McGill, B.J., Enquist, B.J., Weiher, E. & Westoby, M. (2006) Rebuilding community ecology from
functional traits. Trends in Ecology and Evolution, 21, 178-185.
McKinney, M.L. & Lockwood, J.L. (1999) Biotic homogenization: a few winners replacing many
losers in the next mass extinction. Trends in Ecology and Evolution, 14, 450-453.
Mouchet, M.A., Villeger, S., Mason, N.W.H. & Mouillot, D. (2010) Functional diversity measures:
an overview of their redundancy and their ability to discriminate community assembly
rules. Functional Ecology, 24, 867-876.

Chapter one: Functional diversity across space and time
41
Mouillot, D., Dumay, O. & Tomasini J.A. (2007) Limiting similarity, niche filtering and functional
diversity in coastal lagoon fish communities. Estuarine, Coastal and Shelf Science, 71,
443-456.
Mouquet, N., Moore, J.L. & Loreau, M. (2002) Plant species richness and community
productivity: why the mechanism that promotes coexistence matters. Ecology letters,
5, 56-65.
Pavoine, S., Vallet, J., Dufour, A.B., Gachet, S. & Daniel, H. (2009) On the challenge of treating
various types of variables: application for improving the measurement of functional
diversity. OIKOS, 118, 391-402.
Pavoine. S. & Bonsall, M.B. (2011) Measuring biodiversity to explain community assembly: a
unified approach. Biological Reviews, 86 doi: 10.1111/j.1469-185X.2010.00171.x
Petchey, O.L. & Gaston, K.J. (2002) Functional diversity (FD), species richness and community
composition. Ecology letters, 5, 402-411.
Petchey, O.L. & Gaston, K.J. (2006) Functional diversity: back to basics and looking forward.
Ecology letters, 9, 741-758.
Petchey, O.L., Evans, K.L., Fishburn, I.S. & Gaston, K.J. (2007) Low functional diversity and no
redundancy in British avian assemblages. Journal of Animal Ecology, 76, 977-85.
R Development Core Team (2010). R: A language and environment for statistical computing. R
Foundation for Statistical Computing, Vienna, Austria. ISBN 3-900051-07-0, URL
http://www.R-project.org.
Rangel, T.F.L.V.B, Diniz-Filho, J.A.F & Bini, L.M. (2010) SAM: a comprehensive application for
Spatial Analysis in Macroecology. Ecography, 33, 46-50.
Rosenzweig, M.L. (1995) Species Diversity in Space and Time. Cambridge: Cambridge University
Press.
Stevens, G.C. (1989) The latitudinal gradient in Geographical Range: How so many species
coexist in the tropics. The American Naturalist, 133, 240.
Stroud, D.A., Chambers, D., Cook, S., Buxton, N., Fraser, B., Clement, P., Lewis, P., McLean, I.,
Baker, H. & Whitehead, S. (2001) The UK SPA network: its scope and content. JNCC,
Peterborough, UK.
Thaxter, C.B., Sansom, A., Thewlis, R.M., Calbrade, N.A, Ross-Smith, V.H., Bailey, S., Mellan, H. &

Chapter one: Functional diversity across space and time
42
Austin, G.E. (2010) Wetland Bird Survey Alerts 2006/2007: changes in numbers of
wintering waterbirds in the constituent countries of the United Kingdom, Special
Protection Areas (SPAs) and Sites of Special Scientific Interest (SSSIs). BTO Research
Report 556. BTO, Thetford.
The Birds of the Western Palearctic on interactive DVD-ROM (2006) BirdGuides Ltd. and Oxford
University Press.
Thompson, K., Petchey, O.L., Askew, A.P., Dunnett, N.P., Beckerman, A.P. & Willis, A.J. (2010)
Little evidence for limiting similarity in a long-term study of a roadside plant
community. Journal of Ecology, 98, 480-487.
Tilman, D. (2001) Functional diversity. In: Encyclopaedia of Biodiversity (ed. Levin, S.A.) pp. 109-
120 Academic Press, San Diego, CA.
van de Kam, J., Ens, B., Piersma, T. & Zwarts, L. (2004) Shorebirds: An illustrated behavioural
ecology. KNNV Publishers, Utrecht.
Villéger, S., Mason, N.W.H. & Mouillot, D. (2008) New multidimensional functional diversity
indices for a multifaceted framework in functional ecology. Ecology, 89, 2290-2301.
West, A.D., Goss-Custard, J.D., Stillman, R.A., Caldow, R.W.G., Durell, S.E.A. le V. dit &
McGrorty, S. (2002) Predicting the impacts of disturbance on wintering waders using a
behaviour-based individuals model. Biological Conservation, 106, 319–328.

43
Chapter two

Chapter two: Changes in population size and community structure
44
Impacts of demographic changes in the population of wintering waders on community
structure
Abstract
Aim British estuarine ecosystems support large populations of protected migratory wader
species, many of which have previously been reported to be declining severely. However, it is
still unclear how changes in population size relate to changes in wintering site occupancy and
how these population changes may influence changes in the composition and structure of
whole wader communities. Here, we use 30 years of monitoring data on winter population size
to explore the association between changes in wintering population size and site occupancy.
We then explore the variation in functional diversity of communities through the influence of
species presence/absence, to identify how species may be influencing community structure.
Finally, we explore the variation in species functional traits, in order to further understand
similarities amongst species and their influence in the overall community functional diversity
and community structure.
Methods We use national survey (Wetland Bird Survey, WeBS) data from winters 1980/81 to
2006/07 of 20 species in 83 estuaries to explore annual trends in wintering population size and
site occupancy, using the abundance and presence/absence of each species as response
variables and, in both cases, having year as explanatory term. We then model functional
diversity estimates for the same 83 communities as a function of species presence/absence to
understand the influence of each species on community structure. In order to investigate
similarities and differences amongst species, we performed a principal coordinate analysis
(PCoA).
Results The direction and magnitude of changes in wintering wader population size and site
occupancy across British estuaries are species-specific. A significant association between
population size and the number of estuaries occupied occurs for the majority of species. The
presence of avocet, spotted redshank, greenshank and shelduck within the community,
contributes significantly to greater functional diversity. As expected, species that show a
positive effect on functional diversity are also species that lie at the extremes of functional
space.
Main conclusions Wintering wader population size and site occupancy are changing across
British estuaries and influencing changes in community composition. Changes in functional
diversity reveal that coexisting species are becoming more functionally different and that
species interactions are becoming stronger and/or abiotic factors becoming weaker in
structuring communities. Species that have a positive influence on functional diversity are

Chapter two: Changes in population size and community structure
45
species that are more functionally distinctive within functional space and that have also
expanded their wintering ranges. We discuss the potential mechanisms underlying these
community structuring patterns, and their relevance for the protection of wader communities.
Keywords functional diversity, functional traits, population size, site occupancy, wader.

Chapter two: Changes in population size and community structure
46
Introduction
Estuaries are amongst the most productive ecosystems in the world (Geider et al., 2001).
These ecosystems are of great importance for a great variety of species, including plants,
invertebrates, fish, waterbirds and mammals (Buck, 1993). However, estuaries have
experienced continuous anthropogenic pressures due to their numerous socio-economic
functions (Davidson et al., 1991) and, for example, activities such as land reclamation,
pollution and over-exploitation of fisheries have greatly influenced the dynamics of several
benthic and bird species (e.g. Gill et al., 2001; Ravenscroft & Beardall, 2003; Goss-Custard et al.,
2006; Atkinson et al., 2010; Burton et al., 2010; Alves et al., 2012; Sutherland et al., 2012). The
ecological importance of these ecosystems has been widely recognised and many estuarine
ecosystems are protected under national and international legislation (Convention on
Wetlands of International Importance, ‘Ramsar’, 1971; the EC Birds Directive – Stroud et al.,
2001). Despite international conservation efforts, many conflicts are apparent between the
economic values of estuaries and the effective protection of both habitats and species. Site
protection status is typically based on threshold numbers or proportion of populations
occurring within the site (i.e. a site is considered to be of conservation importance if it
regularly holds over 20,000 waterfowl or at least 1% of the national or the biogeographic
population of a given species) (Stroud et al., 2001). The number of individuals required to meet
the 1% threshold, however, has to be reviewed when national population numbers change.
Furthermore, it is often not clear why number of individuals and communities composition
change within individual sites, especially for migratory species, since these changes might be
influenced by processes occurring elsewhere in their distribution range. Understanding how
these communities assemble is therefore a key step in understanding community dynamics on
estuaries and their use by any species.
Estuarine ecosystems are particularly important for migratory bird species, as they provide
wintering and stop over conditions for birds to rest and refuel during non-breeding and
migration periods (Fuller, 1982; Ferns, 1992; Delany et al., 2009). Within the Paleartic-African
migratory corridors, in particular the East Atlantic flyway, 42% of the populations of species of
waterbirds, including herons, egrets, swans, ducks, geese and waders, are currently declining
(Delany et al., 2009). The United Kingdom is located within this flyway and provides important
non-breeding grounds for many wader species (Charadrii), with over a million individuals
wintering within its coastal habitats (Holt et al., 2011). The UK assumes particular relevance on
the East Atlantic flyway, due to its large number and total area of wetlands and associated
estuarine systems. In addition, the UK winter temperatures are higher than those of other
regions at the same latitude, owing to the influence of the Gulf Stream (van de Kam et al.,
Chapter two: Changes in population size and community structure
47
2004), making it a favoured wintering location for many arctic and subarctic breeding species.
The numbers of birds supported on wetlands in the UK have been assessed since 1969 through
a nation-wide monitoring scheme, the Wetland Bird Survey (WeBS), providing the data needed
for designating important sites (e.g. Stroud et al., 2001) and for quantifying national-scale
population trends (Thaxter et al., 2010) (see Table 1, for details on population trends). Making
use of this data set, previous studies have examined the possible causes of changes in
abundance of wintering bird populations on European estuaries in relation to environmental
factors operating at a variety of scales (e.g. Gill et al., 2001; West et al., 2002; Austin &
Rehfisch, 2005; Goss-Custard et al., 2006; Maclean et al., 2008; Burton et al., 2010). However,
it is still unclear how these population changes influence the composition and structure of
whole communities, and how these changes may impact ecosystem functioning.
Changes in species richness and composition of wintering wader communities across British
estuaries over the last 30 years have been accompanied by changes in functional diversity (i.e.
changes in the functional traits present in the community) and community structure (chapter
1). The relative influence of the mechanisms structuring wader communities on British
estuaries over that time period is not constant, with an overall tendency towards an increase
in dissimilarity amongst coexisting species (chapter 1). According to niche-model theory,
community assembly is influenced by similarities or differences in species traits, through the
opposing influences of environmental filtering effects and species interactions (MacArthur &
Levins, 1967). Thus, an increase in functional diversity while species richness remains constant
suggests that niche partitioning/competition levels might also be increasing (i.e. higher
character displacement between species due to limiting similarity) and/or that environmental
constraints might have been decreasing (i.e. the environment allows a wider range of traits to
be present in communities). However, wader functional diversity in chapter 1 was calculated
using presence-absence data, limiting the changes in functional diversity to be sensitive only to
changes in species local extinction or colonization while being insensitive to changes in
population size. Surprisingly, it is currently unknown how the influence of changes in
population size and site occupancy might impact community structure.
In this study, we use WeBS count data to examine the association between temporal trends in
population size and wintering occupancy for wader communities on 83 estuaries around
Britain. Then, using the estimates extracted from chapter 1 of deviation of observed from
expected functional diversity (thus controlling for the number of species present in each
community) we test if the species that are influencing changes in functional diversity and
community structure are those with more extreme/different trait states. Species with a
greater influence on changes in functional diversity and community structure are expected to

Chapter two: Changes in population size and community structure
48
be those that are more functionally different, being positioned near the edges of the
ecomorphological (functional) space. Hence, if their population sizes and distributions are
changing through time, these species will have greater impact on community structure than
other species that are more functionally redundant/ similar. Here, we use species abundance
data to for the first time to explore how changes in population size and wintering site
occupancy influence the community functional diversity and community structure.
Methods
Species selection
We restricted our analyses to the same 20 wintering species (Table 1) used in chapter 1, which
were selected based on their high winter dependency on estuaries and inter-tidal invertebrate
prey populations. All selected species are waders with the exception of shelduck (Tadorna
tadorna), which was included in this and previous community analyses as it has similar feeding
ecology to waders and is also highly dependent on estuaries (e.g. Clark & Prys-Jones, 1994)
(hereafter, “waders” refers to all the species in this study). Spotted redshank and whimbrel
were also included although they are relatively scarce wintering species in the UK, with
populations found only at a few sites as the majority of individuals of both species winter in
Africa and only a small proportion remains on British estuaries during winter.
Data collection
Monitoring waterbird species has taken place throughout the UK since 1969/1970 by co-
ordinated monthly counts on predetermined dates, thus minimizing the likelihood of missing
or double counting individuals (Holt et al., 2011). Count accuracy and completeness
assessments are carried out for all the species at all sites. Count accuracy is provided by the
counter, assessing the count as complete (‘OK’) or incomplete (‘Low’). Then, completeness
assessments are made for all the WeBS counts on the basis of each count information.
Completeness calculations for large and complex sites are based on a moving window of
counts, thus, the addition of new data each year may result in counts assessed as incomplete
in previous years now being considered complete, or vice versa, as the species may have
changed the sections they use within the estuary. Thus, this method allows the correction of
previous counts and completeness assessment. Additional information regarding survey type,
methodology, count accuracy and completeness are detailed in Holt et al. (2011).

Chapter two: Changes in population size and community structure
49
Table 1. The 20 wintering species of waterbirds included in the analyses and their long-term
(25 year) population trends in Great Britain (extracted from Thaxter et al., 2010). Whimbrel
and spotted redshank trends are not available as the majority winter in Africa.
Code Common name Scientific name Long-term population change (%)
RP Ringed plover Charadrius hiaticula -9
GP Golden plover Pluvialis apricaria 500
GV Grey plover Pluvialis squatarola 71
L_ Lapwing Vanellus vanellus 183
OC Oystercatcher Haematopus ostralegus 2
AV Avocet Recurvirostra avosetta >1000
TT Turnstone Arenaria interpres 9
SS Sanderling Calidris alba 69
DN Dunlin Calidris alpina -26
KN Knot Calidris canutus 20
PS Purple sandpiper Calidris maritima -43
RU Ruff Philomachus pugnax 88
BA Bar-tailed godwit Limosa lapponica -25
BW Black-tailed godwit Limosa limosa 518
CU Curlew Numenius arquata 41
WM Whimbrel Numenius phaeopus NA
DR Spotted redshank Tringa erythropus NA
GK Greenshank Tringa nebularia 106
RK Redshank Tringa totanus 19
SU Shelduck Tadorna tadorna -1
We compiled winter data for 83 British estuaries between the winters of 1980/81 and 2006/07,
which have been systematically surveyed and the temporal coverage is considered to be
complete during this time period. Only species occurring on a site in at least 60% of the winter
months in a given year (November to February) are assumed to be part of the winter
community and included in the subsequent analysis. Winter mean abundance for each species
at each site was calculated using counts between November and February, when the number

Chapter two: Changes in population size and community structure
50
of birds using sites at these latitudes more accurately reflects stable non-breeding population
numbers.
Seven trait types were chosen to capture behavioural and morphological variation among
waders relating to their capacity to exploit food resources (as in chapter 1). Trait values were
obtained from the BTO data base (http://www.bto.org/about-birds/birdfacts) and from The
Birds of the Western Palaearctic on interactive DVD-ROM (2006), using information for
populations that occur in UK whenever possible.
Changes in wintering wader population size and occupancy
Wintering population size (i.e. total number of individuals per species per year) was calculated
as the sum of the winter mean abundances across all the sites where the species was present.
We used generalised linear models with Poisson error distribution and log link function to
model wintering population size as a function of year, with standard errors adjusted for
overdispersion. Non-linear annual trends were explored in all models and included when
significant.
Winter mean abundance was transformed to presence/absence data, to calculate the number
of sites where a species was present in a given year, i.e. site occupancy. Variation in annual site
occupancy was modelled as a function of year with generalised linear models with binomial
error distribution and logit link function, with standard error adjusted for overdispersion. Non-
linear annual trends were included in all models and recorded when significant. We used
Spearman correlations to explore the association between the (log10-transformed) population
size and the number of estuaries occupied by a species in a given year. All analyses were
conducted in statistical package R (2.12.2, R Development Core Team, 2011) using the glm
function for the described models.
Changes in wintering wader community
Functional diversity (hereafter referred as FD) estimates how dispersed the species of a given
community are in trait space. Seven trait types in relation to resource use were used to
calculate the FD across wader communities, which included morphological, behavioural and
ecological traits (Table 2 in chapter 1). Deviations of observed FD from expected FD have been
previously used to understand the mechanisms by which communities are assembled (e.g.
Petchey et al., 2007; Thompson et al., 2010; Mendez et al., 2012). Expected FD is calculated
from the same regional pool (20 species), by assembling 1000 random communities with the
same number of species as the real community and calculating their FD. Expected FD is
calculated as the mean value of the FD of these random communities. Observed communities

Chapter two: Changes in population size and community structure
51
are considered to be assembled at random if the difference between observed and expected is
not significantly different from zero. However, if the difference is significantly less than zero,
then environmental filtering is likely to be the stronger influence on community structure,
whereas if it is significantly greater than zero, interspecific competition is likely to be the
predominant influence on community structure. We used the standardised effect size
estimates of FD (hereafter referred as SES-FD) extracted from chapter 1 to explore the
influence of individual species population changes on community changes. SES-FD was
calculated as (observed FD – expected FD)/standard deviation of expected FD, for each wader
community on each site in each year (Gotelli & McCabe, 2002).
Since functional diversity was measured using presence/absence data, changes in SES-FD will
be sensitive to changes in species composition and species richness through colonization and
extinction events. Thus, SES-FD was modelled as a function of the presence/absence of each
species with estuary and year as random effects. In the model, species were considered as
independent variables and year was treated as a continuous variable in the random structure
to account for temporal autocorrelation (i.e. non-independence caused by repeated measures
at the same estuary). The statistical model was carried out using the lmer function of the lme4
package (Bates et al., 2011) in R (2.12.2, R Development Core Team, 2011). The best model
(minimum adequate model) was selected through backwards removal from the maximal
model (when all species were included), using Akaike Information Criteria (AIC) and maximum
likelihood ratio tests (ML). The relative importance of each removed term and the goodness-
of-fit of the model were determined.
Finally, we performed a principal coordinate analysis (PCoA), using a Gower distance matrix
calculated from the same trait matrix as in chapter 1 and comprising the 20 species. The PCoA
positions each species within multidimensional functional trait space, determined by the
combination of functional trait states of each species. The PCoA was performed using the
function pcoa from the ape package (Paradis et al., 2004) in R (2.12.2, R Development Core
Team, 2011). We overlaid the traits as arrows in the PCoA plot to explore whether changes in
populations and communities might be linked to changes in specific functional traits.
Results
Changes in wintering wader population size and occupancy
Between 1980/81 and 2006/07, the populations of wader species wintering in the UK have
experienced contrasting changes in size. Population size trends were statistically significant for
18 species, but not significant for bar-tailed godwit and knot (Table 2a, Figure 1). Dunlin and
shelduck suffered an overall decrease in numbers over the time period, whereas curlew, grey

Chapter two: Changes in population size and community structure
52
plover, lapwing, oystercatcher, purple sandpiper, redshank, ringed plover and turnstone have
experienced more recent declines (Figure 1). Avocet, black-tailed godwit, spotted redshank,
sanderling and whimbrel showed a linear increase in numbers, with avocet and black-tailed
godwit increasing at the fastest rate during this time period (yearly rates of ~0.07 - 0.1%, Table
2a). Greenshank, golden plover and ruff also enjoyed an overall increase in population
abundance throughout the analysed time period (Table 2a, Figure 1).
Figure 1. Temporal trends in wintering wader population size (i.e. total number of individuals
per year) in Great Britain. Population size is calculated as the sum of the winter mean
abundance across 83 coastal sites. Fitted lines represent generalised linear predictor models
for annual trends in population size. Species codes may be found in Table 1.
Overall, site occupancy increased for all 20 species (i.e. the number of sites occupied at the
end of the time period was overall greater than the number of sites occupied at the beginning
of the time period) (Table 2b, year effect is positive for all the species). However, increases in
occupancy have stopped for the majority of species (Table 2b, year2 in the model is negative),

Chapter two: Changes in population size and community structure
53
and for species such as dunlin, grey plover, ringed plover, purple sandpiper, bar-tailed godwit
and turnstone declines in occupancy were more pronounced since the early 90s (Figure 2).
Figure 2. Trends in the variation of sites occupied by 20 species of wintering waders across 83
coastal sites in Great Britain. Fitted lines are the generalised linear model relationship. Species
codes are provided in Table 1.
There was no significant correlation between annual wintering population sizes and site
occupancy for dunlin, knot, oystercatcher, purple sandpiper and ruff (Table 2c). In contrast, for
the majority of species (14) a significant positive correlation between population size and the
number of estuaries occupied was found, and only for shelduck there was a (weakly)
significant negative correlation (Table 2c), with site occupancy increasing with population
declines in this species.
Chapter two: Changes in population size and community structure
54
Changes in wintering wader community
On British estuaries between 1980/81 and 2006/07, there was a significant effect of the
occurrence or absence of several species on changes in SES-FD (i.e. the changes in wader FD on
individual estuaries; Table 3). The effect of the presence of avocet, spotted redshank,
greenshank and shelduck on the variation in SES-FD was positive (intercept, Table 3). Thus,
when any of these species were present in the community, SES-FD values tended to be less
negative than when they were absent from the community. In other words, when any of these
four species was present in a community, it was more functionally distinct than communities
where they were absent, hence functional diversity tended to be less negative or closer to that
expected by chance. In contrast, when any of the other nine species (species with negative
estimates, Table 3) were present in the community, SES-FD values tended to be more negative
than when these species were absent from the community. Hence, species within the
community tended to be more similar than expected by chance when any of these nine
species were present.

Chapter two: Changes in population size and community structure
55
Table 2. Estimates of the annual changes in (a) population size and (b) site occupancy for each
species in Great Britain, and (c) the Spearman’s correlations between population size and site
occupancy. Significance levels are coded as follows: *P < 0.05, **P < 0.01, ***P < 0.001 and NS
= not significant. Non-linear annual trends (Year2 ) were explored in all models but are only
included when significant. Species details are given in Table 1.
Change in population: Correlation between population size and
occupancy
(a) size (b) occupancy (c) rho
Species Year Year2 Year Year2
AV 0.096 (***) 10.02 (**) -0.0025 (**) 0.88 (***)
BA -0.006 (NS) 13.38 (**) -0.0033 (**) 0.39 (*)
BW 0.076 (***) 5.94 (**) -0.0015 (**) 0.95 (***)
CU 7.540 (***) -0.0018 (***) 26.95 (***) -0.0067 (***) 0.61 (***)
DN 6.895 (***) -0.0017 (***) 30.29 (***) -0.0076 (***) 0.32 (NS)
DR 0.028 (***) 0.010 (**) 0.39 (*)
GK -5.421 (*) 0.0013 (*) 0.036 (***) 0.63 (***)
GP 9.476 (*) -0.0023 (*) 10.75 (***) -0.0027 (***) 0.66 (***)
GV 16.40 (***) -0.0041 (***) 19.29 (***) -0.0048 (***) 0.63 (***)
KN 0.004 (NS) 10.49 (**) -0.0026 (**) 0.15 (NS)
L_ 14.59 (***) -0.0036 (***) 27.66 (***) -0.0069 (***) 0.55 (**)
OC 2.615 (**) -0.0006 (**) 41.61 (***) -0.010 (***) 0.31 (NS)
PS 17.78 (**) -0.0044 (**) 7.5 (*) -0.0018 (*) 0.11 (NS)
RK 5.453 (***) -0.0013 (***) 47.46 (***) -0.012 (***) 0.45 (*)
RP 10.21 (***) -0.0025 (***) 23.71 (***) -0.0059 (***) 0.67 (***)
RU -11.48 (*) 0.0028 (*) 8.75 (**) -0.0022 (**) -0.28 (NS)
SS 0.023 (***) 0.02 (***) 0.65 (***)
SU 3.413 (**) -0.0008 (**) 10.95 (*) -0.0027 (*) -0.45 (*)
TT 9.116 (***) -0.0022 (***) 24.82 (***) -0.0062 (***) 0.71 (***)
WM 0.044 (**) 10.47 (*) -0.0026 (*) 0.82 (***)

Chapter two: Changes in population size and community structure
56
Table 3. Results of the minimum adequate linear mixed model of the influence of species
presence/absence on changes in functional diversity (SES-FD). The parameter estimate of a
given species is scaled relative to the intercept and indicates the effect of the presence of that
species on SES with the influence of all the remaining species held constant. Species codes are
given in Table 1.
Estimate Std. Error t value p-value
(Intercept) - 0.301 0.178 - 1.688 0.09
Presence of: AV 0.192 0.048 3.960 <0.0001
BA - 0.257 0.044 - 5.818 <0.0001
BW - 0.115 0.039 - 2.915 0.02
DR 0.142 0.039 3.635 0.0002
GK 0.162 0.036 4.432 <0.0001
GP - 0.065 0.045 - 1.445 0.36
GV - 0.180 0.049 - 3.632 0.0001
OC - 0.239 0.158 - 1.510 0.03
PS - 0.071 0.043 - 1.623 0.07
RP - 0.225 0.064 - 3.515 0.0002
RU - 0.094 0.042 - 2.240 0.007
SS - 0.071 0.041 - 1.725 0.008
SU 1.027 0.063 16.294 <0.0001
Species position in the ecomorphological (functional) space
Patterns of variation in wader functional traits are shown in Figure 3, with each species
positioned in multidimensional functional space. Species placed close together share more
similar functional trait states (e.g. the feeding techniques are similar, they feed on similar prey
types and they display similar morphological characteristics) than species placed further apart,
which tend to have more dissimilar functional trait states. Shelduck, avocet, spotted redshank
and greenshank, species that had a positive estimate in Table 3, were positioned further apart
from the rest of the species (top left of the ordination), indicating that they are more
functionally distinct than the other species (Figure 3).

Chapter two: Changes in population size and community structure
57
Figure 3: Principal Coordinate Analysis (PCoA) of the functional traits of 20 wintering wader
species across British estuaries. For ease of interpretation, species scores are represented
alone (a) and in relation with the functional traits (b). Species codes are provided in Table 1.
a)
b)

Chapter two: Changes in population size and community structure
58
Discussion
The wintering population size and site occupancy of several wader species across British
estuaries have undergone considerable changes, and the direction and magnitude of these
changes are species-specific. These population changes are influencing changes in community
composition (i.e. which species are present in the community), resulting in changes in
functional diversity. Coexisting species are becoming more functionally complementary, and
the structuring influence of species interactions is becoming stronger and/or abiotic factors
are becoming weaker in ruling community assembly.
Changes in wintering wader population size and occupancy
The overall trend in the wintering population abundance of wader species in the UK has been
one of increase over the last 40 years, and in particular from mid-1970s to late 1990s (Holt et
al., 2011). However, since the late 1990s, the numbers of the majority of species have
stabilised and for some species have fallen (Holt et al., 2011; Musgrove et al., 2011). Our study,
based on a shorter time period and using mean winter abundances, also captures these trends.
Of the 20 wintering species, only bar-tailed godwit, dunlin and shelduck experienced overall
declines in numbers whereas the remaining species increased. But these increases are not
always linear, and species such as curlew, grey plover, lapwing, oystercatcher, purple
sandpiper, redshank, ringed plover and turnstone are experiencing recent declines after a
period of increasing in numbers (Figure 1, Table 2a). It should be noted that abundance trends
and the population estimates reported here may differ slightly from those already published,
because the sites included here represent only the sites with most complete counts which are
only a portion of the sites used to calculate the annual indices reported in WeBS (Holt et al.,
2011) and the overwinter population estimates (Musgrove et al., 2011), which also include
inland sites. However, the changes in overall population abundance patterns have not
previously been related to changes in site occupancy and community structure.
As observed for many other taxa (e.g. Gaston et al., 2000), wader population sizes tend to be
positively correlated with site occupancy, thus species with large population sizes such as
redshank, oystercatcher and dunlin, tend to occupy a large number of estuaries, whereas rare
species, such as spotted redshank and whimbrel, are present in fewer sites. This positive
association seems also to extend to the changes in population size and site occupancy. For
example, avocet and black-tailed godwit, two of the wader species that have greatly increased
in numbers, have also occupied new sites. The increase in numbers is likely to result in
increases in local abundance and consequent density-dependent effects may be a key
mechanism facilitating winter recruitment or dispersal into new sites and establishing new

Chapter two: Changes in population size and community structure
59
local populations. Alternatively, changes in abundance and occupancy may occur
independently, and it is important to note that not all the changes in populations and
occupancy have been significant or positive for wader species across Britain.
Non-significant correlations between population size and wintering occupancy could indicate
that changes in wintering population size may primarily be driven by changes in local
abundances. For instance, constraints on the availability of suitable sites to colonize may mean
that increasing species are more likely to increase in local abundance. Wader species are
typically highly philopatric, returning every year to the same wintering site (Townshead, 1985;
Burton, 2000), thus declining populations may have fewer individuals returning to the same
estuary each year, resulting in lower local abundances but similar site occupancy. This might
be the case for dunlin, as the decrease in numbers does not seem to vary with numbers of
sites occupied, suggesting a reduction in local abundances, which could be attributed to shifts
in wintering distribution to sites outside the UK (Austin & Rehfisch, 2005; Maclean et al., 2008)
or to overall population declines at the flyway level. Interestingly, we also found a negative
association between occupancy and population size in shelduck, which has undergone a
significant decrease in population size over the last 30 years while its wintering occupancy has
increased, indicating a likely redistribution of wintering sites and a reduction of local
abundances.
Despite the wealth of scientific research evaluating factors underlying changes in population
abundance (e.g. Rehfisch et al., 1997; Gill et al., 2007; Maclean et al., 2008; Amar et al., 2011),
there is relatively little understanding of the consequences of changes in population size to
changes in occupancy and local abundance. We have shown an association between changes
in population size and wintering occupancy in waders but the contribution of changes in local
abundances and/or changes in site occupancy to the overall population change remain
unknown. Furthermore, we do not know (i) the carrying capacities of sites for local populations,
before density-dependence effects begin to operate and (ii) the role of Allee effects (benefits
for individuals of species from the presence of conspecifics) and thus the extinction risk
associated with different population sizes. Further investigation into these aspects of
population dynamics are needed since they are likely to aid in understanding the link between
population trends and mechanisms, and consequently enable assessment of extinction risk
and the likelihood of successful colonization events.
Changes in wintering wader communities
Changes in functional diversity are influenced by individual species in different ways and, of
the 20 species included in this study, only 13 proved to have a statistically significant effect on

Chapter two: Changes in population size and community structure
60
the variation in community functional diversity. The level of redundancy or distinctiveness of
functional traits contributed by each species is likely to explain differences between the
magnitude and the direction of the effect of species presence/absence on functional diversity.
Species with a positive effect – avocet, spotted redshank, greenshank and shelduck (Table 3) –
appear to be more functionally distinct with respect to resource use, broadening the
functional trait space when they are present in the community (Figure 3). In fact, these species
are all particularly specialised for feeding in shallow standing water and forage by moving their
bills from side to side (Cramp & Simmons, 1983; van de Kam et al., 2004), traits that are not
shared by any of the other wintering species. Furthermore, these species can feed on fish
and/or other aquatic invertebrates found in the water column (van de Kam et al., 2004; BWPi,
2006), which again are not resources exploited by the other species. Avoiding niche overlap by
being able to exploit different parts of the resource spectrum and to perform different
functional roles within the community might thus explain why these species have been able to
successfully establish local populations in new sites. Additionally, since these species were
found in few estuaries, it seems that there may have been an under-utilisation of resources at
the beginning of the time period or the type and abundance of resources available within
estuaries have changed. Thus, observed increases in the overall FD of UK wintering
communities may be a consequence of the expansion of the total niche space (new traits are
incorporated into the community) and/or strengthening of the levels of niche partitioning
(displacement of functionally similar species occurs when there is limited resource, resulting in
communities with more complementary species) as previously suggested (chapter 1).
There was a significant negative effect on changes in FD of seven species (Table 3). In other
words, when any of these species were present in a community, they contributed to species
being more functionally similar than in communities where they were absent, hence lowering
levels of FD than expected by chance. Thus, the addition of these species into these
communities appears to add largely similar functional traits. These species tended to cluster
within the functional space (Figure 3) since they feed on similar main prey types (e.g. worms,
molluscs and crustaceans) using similar feeding techniques (e.g. probing or pecking). The
similarity amongst species might be enhanced through the influence of environmental
conditions. For instance, bar-tailed godwit and sanderling tend to occur on large sandy
estuaries (Hill et al., 1993), whilst the presence of golden plover in estuaries seems to be linked
to winter weather severity (Rehfisch et al., 2004; Gillings & Fuller, 2009). These and other
environmental conditions could be constraining the presence of these and other species,
hence, acting as a filter and allowing only a specific and more similar set of functional traits to
be present in a given community.

Chapter two: Changes in population size and community structure
61
One of the advantages of FD as a measure of biodiversity is that, as well as representing the
range of functional traits, it also expresses the extent of complementarity in resource use
space, and thus, resource partitioning/niche differentiation amongst coexisting species
(Petchey & Gaston, 2006; Petchey et al., 2007; Villéger, Mason & Mouillot, 2008). The ability of
a species to colonise is partly constrained by the extent of the niche space available and by
species interactions, in particular competition between species exploiting similar parts of the
resource spectrum (MacArthur & Levins, 1967). Previous studies have examined the responses
of wader numbers to environmental and anthropogenic changes such as shell-fishing (van
Roomen et al., 2005; Atkinson et al., 2010), habitat loss (Burton et al., 2010), organic loading
(Burton et al., 2005; Alves et al., 2012) and more recently climate change has been suggested
as a cause of changes in wintering wader distribution and abundance (Rehfisch et al., 2004;
Austin & Rehfisch, 2005; Maclean et al., 2008). However, the results of this study suggest that
some of the changes in occupancy may be occurring through density dependent processes,
species interactions, niche availability and suitability, while acknowledging that changes in
population size are often correlated with changes in environmental conditions and these have
to be suitable for a species to persist within a community. Understanding trait diversity and
the functional role of each species within the community is an important topic that can
improve our understanding of species interactions and co-existence and better inform
conservation policy.

Chapter two: Changes in population size and community structure
62
References
Amar, A., Grant, M., Buchanan, G., Sim, I., Wilson, J., Pearce-Higgins, J.W. & Redpath, S. (2011)
Exploring the relationships between wader declines and current land-use in the British
uplands. Bird Study, 58, 13-26.
Alves, J.A., Sutherland, W.J. & Gill, J.A. (2012) Will improving wastewater treatment impact
shorebirds? Effects of sewage discharges on estuarine invertebrates and birds. Animal
Conservation, 15, 44–52.
Atkinson, P.W., Maclean, I.M. & Clark, N.A. (2010) Impacts of shellfisheries and nutrient inputs
on waterbird communities in the Wash, England. Journal of Applied Ecology, 47, 191-
199.
Austin, G.E. & Rehfisch, M.M. (2005) Shifting non-breeding distributions of migratory fauna in
relation to climatic change. Global Change Biology, 11, 31-38.
Bates, D., Maechler, M. & Bolker, B. (2011) lme4: Linear mixed-effects models using S4 classes.
R package version 0.999375-39. http://CRAN.R-project.org/package=lme4.
Birds of the Western Paleartic interactive DVD-ROM (2006) Oxford University Press.
Buck. A.L. (1993) An inventory of UK estuaries. Peterborough, Joint Nature Conservation
Committee.
Burton, N.H.K. (2000) Winter site-fidelity and survival of Redshank Tringa totanus at Cardiff,
south Wales. Bird Study, 47, 102-112.
Burton, N.H.K., Fuller, R.A. & Eaton, M.A. (2005) Between-year changes in the wintering sites
of Ruddy Turnstones Arenaria interpres: a response to diminished food resources?
Wader Study Group Bulletin, 107, 36-39.
Burton, N.H.K., Musgrove, A.J., Rehfisch, M.M. & Clark, N.A. (2010) Birds of the Severn Estuary
and Bristol Channel: their current status and key environmental issues. Marine
Pollution Bulletin, 61, 115-123.
Convention on Wetlands of International Importance especially as Waterfowl Habitat. Ramsar
(Iran) (1971). UN Treaty Series No. 14583. As amended by the Paris Protocol, 3
December 1982, and Regina Amendments, 28 May 1987.
Clark, N.A. & Prys-Jones, R.P. (1994) Low tide distribution of wintering waders and Shelduck on
the Severn Estuary in relation to the proposed tidal barrage. Biological Journal of the

Chapter two: Changes in population size and community structure
63
Linnean Society, 51, 199–217.
Cramp, S. & Simmons, K.E.L. (eds) (1983) Handbook of the birds of Europe, the Middle East and
Africa. The birds of the western Palearctic. Vol. III: waders to gulls. Oxford University
Press, Oxford.
Davidson, N.C., Laffoley, D. d'A., Doody, J.P., Way, L.S., Key, R., Drake, C.M., Pienkowski, M.W.,
Mitchell, R. & Duff, K.L (1991) Nature conservation and estuaries in Great Britain.
Peterborough: Nature Conservancy Council.
Delany, S., Scott, D., Dodman, T. & Stroud, D. (eds) (2009) An Atlas of Wader Populations in
Africa and Western Eurasia. Wetlands International, Wageningen, The Netherlands.
Ferns, P.N. (1992) Bird life of coasts and estuaries. Cambridge University Press. Cambridge
Fuller, R.J. (1982) Bird Habitats. T. & A.D. Poyser, Calton.
Gaston, K.J., Blackburn, T.M., Greenwood, J.J.D., Gregory, R.D., Quinn, R.M. & Lawton, J.H.
(2000) Abundance–occupancy relationships. Journal of Applied Ecology, 37, 39–59.
Geider, R.J., Delucia, E.H., Falkowski, P.G., Finzi, A.C., Grime, J.P., Grace, J., Kana, T.M., La Roche,
J., Long, S.P., Osborne, B.A., Platt, T., Prentice, I.C., Raven, J.A., Schlesinger, W.H.,
Smetacek, V., Stuart, V., Sathyendranath, S., Thomas, R.B., Vogelmann, T.C., Williams, P.
& Woodward, F.I. (2001) Primary productivity of planet earth: biological determinants
and physical constraints in terrestrial and aquatic habitats. Global change biology, 7,
849-882.
Gill, J.A., Norris, K. & Sutherland, W.J. (2001) The effects of disturbance on habitat use by
black-tailed godwits Limosa limosa. Journal of Applied Ecology, 38, 846–856.
Gill, J.A., Langston, R.H.W., Alves, J.A., Atkinson, P.W., Bocher, P., Cidraes Vieira, N., Crockford,
N.J., Gélinaud, G., Groen, N., Gunnarsson, T.G., Hayhow, B., Hooijmeijer, J., Kentie, R.,
Kleijn, D., Lourenço, P.M., Masero, J.A., Meunier, F., Potts, P.M, Roodbergen, M.,
Schekkerman, H., Schröder, J., Wymenga, E. & Piersma, T. (2007) Contrasting trends in
two Black-tailed Godwit populations: a review of causes and recommendations. Wader
Study Group Bulletin, 114, 43-50.
Gillings, S. & Fuller, R.J. (2009) How many Eurasian Golden Plovers Pluvialis apricaria and
Northern Lapwings Vanellus vanellus winter in Great Britain? Results from a large-scale
survey in 2006/07. Wader Study Group Bulletin, 116, 21-28.
Goss-Custard, J.D., Burton, N.H.K., Clark, N.A., Ferns, P.N., McGrorty, S., Reading, C.J.,

Chapter two: Changes in population size and community structure
64
Rehfisch, M.M., Stillman, R.A., Townend, I., West, A.D. & Worrall, D.H. (2006) Test of
a behaviour-based individual-based model: response of shorebird mortality to habitat
loss. Ecological Applications, 16, 2215-2222.
Gotelli, N.J. & McCabe, D.J. (2002) Species co-occurrence: a meta-analysis of J. M. Diamond’s
assembly rules model. Ecology, 83, 2091-2096.
Hill, D., Rushton, S.P., Clark, N., Green, P. & Prys-Jones, R. (1993) Shorebird communities on
British estuaries: factors affecting community composition. Journal of Applied Ecology,
30, 220-234.
Holt, C.A., Austin, G.E., Calbrade, N.A., Mellan, H.J., Mitchell, C., Stroud, D.A., Wotton, S.R. &
Musgrove, A.J. (2011) Waterbirds in the UK 2009/10: The Wetland Bird Survey.
BTO/RSPB/JNCC, Thetford.
MacArthur, R.H. & Levins, R. (1967) Limiting similarity convergence and divergence of
coexisting species. American Naturalist, 101, 377-385.
Maclean, I.M.D., Austin, G.E., Rehfisch, M.M., Blew, J., Crowe, O., Delany, S., Devos, K.,
Deceuninck, B., Gunther, K., Laursen, K., et al. (2008) Climate change causes rapid
changes in the distribution and site abundance of birds in winter. Global Change
Biology, 14, 2489-2500.
Mendez, V., Gill, J.A., Burton, N.H.K., Austin, G.E., Petchey, O.L. & Davies, R.G. (2012)
Functional diversity across space and time: trends in wader communities on British
estuaries. Diversity and Distributions, 18, 365-365.
Musgrove, A.J., Austin, G.E., Hearn, R.D, Holt, C.A., Stroud, D.A. & Wotton, S.R. (2011)
Overwinter population estimates of British waterbirds. British Birds, 104, 364–397.
Paradis, E., Claude, J. & Strimmer, K. (2004) APE: analyses of phylogenetics and evolution in R
language. Bioinformatics, 20, 289-290.
Petchey, O.L. & Gaston, K.J. (2006) Functional diversity: back to basics and looking forward.
Ecology letters, 9, 741-758.
Petchey, O.L., Evans, K.L., Fishburn, I.S. & Gaston, K.J. (2007) Low functional diversity and no
redundancy in British avian assemblages. Journal of Animal Ecology, 76, 977-85.
R Development Core Team (2011). R: A language and environment for statistical computing. R
Foundation for Statistical Computing, Vienna, Austria. ISBN 3-900051-07-0, URL
http://www.R-project.org/.

Chapter two: Changes in population size and community structure
65
Ravenscroft, N.O.M. & Beardall, C.H. (2003) The importance of freshwater flows over estuarine
mudflats for wintering waders and wildfowl. Biological Conservation, 113, 89-97.
Rehfisch, M.M., Holloway, S.J., Yates, M.G., Clarke, R.T., Austin, G., Clark, N.A., Le V. dit Durell,
S.E.A., Eastwood, J.A., Goss-Custard, J.D., Swetnam, R. & West, J.R. (1997) Predicting
the effect of habitat change on waterfowl communities: a novel empirical approach. In:
Goss-Custard, J. D., Rufino, R., Luis, A., (eds.) Effect of habitat loss and change on
waterbirds. London, The Stationery Office, 116-126, 144pp. (ITE Symposium, 30).
Rehfisch, M.M., Austin, G.E., Freeman, S.N., Armitage, M.J.S. & Burton, N.H.K. (2004) The
possible impact of climate change on the future distributions of waders on Britain’s
non-estuarine coast. Ibis, 146, S70-81.
Stroud, D.A., Chambers, D., Cook, S., Buxton, N., Fraser, B., Clement, P., Lewis, P., McLean, I.,
Baker, H. & Whitehead, S. (2001) The UK SPA network: its scope and content. Volume
2: species accounts. JNCC, Peterborough.
Sutherland, W.J., Alves, J.A., Amano, T., Chang, C.H., Davidson, N.C., Finlayson, C.M., Gill, J.A.,
Gill Jr, R.E., González, P.M., Gunnarsson, T.G., Kleijn, D., Spray, C.J., Székely, T. &
Thompson, D.B.A. (2012) A horizon scanning assessment of current and potential
future threats to migratory shorebirds. Ibis, 154, 663-679.
Thaxter, C.B., Sansom, A. Thewlis, R.M., Calbrade, N.A., Ross-Smith, V.H., Bailey, S., Mellan, H.J.
& Austin, G.E. (2010) Wetland Bird Survey Alerts 2006/2007: Changes in numbers of
wintering waterbirds in the Constituent Countries of the United Kingdom, Special
Protection Areas (SPAs) and Sites of Special Scientific Interest (SSSIs). BTO Research
Report 556. BTO, Thetford.
Thompson, K., Petchey, O.L., Askew, A.P., Dunnett, N.P., Beckerman, A.P. & Willis, A.J. (2010)
Little evidence for limiting similarity in a long-term study of a roadside plant
community. Journal of Ecology, 98, 480-487.
Townshend, D.J. (1985) Decisions for a lifetime: establishment of spatial defence and
movement patterns by juvenile grey plovers (Pluvialis squatarola). Journal of Animal
Ecology, 54, 267–274.
Van de Kam, J., Ens, B., Piersma, T. & Zwarts, L. (2004) Shorebirds: an illustrated behavioural
ecology. KNNV Publishers, Utrecht, The Netherlands.

Chapter two: Changes in population size and community structure
66
Van Roomen, M., van Turnhout, C, van Winden, E., Koks, B., Goedhart, P., Leopold, M. & Smit,
C. (2005) Trends in benthivorous waterbirds in the Dutch Wadden Sea 1975-2002:
large differences between shellfisheaters and worm-eaters. Limosa, 78, 21-38.
Villéger, S., Mason, N.W.H. & Mouillot D. (2008) New multidimensional functional diversity
indices for a multifaceted framework in functional ecology. Ecology, 89, 2290–2301.
West, A.D., Goss-Custard, J.D., Stillman, R.A., Caldow, R.W.G., Durell, S.E.A. le V. dit &
McGrorty, S. (2002) Predicting the impacts of disturbance on wintering waders using a
behaviour-based individuals model. Biological Conservation, 106, 319–328.

67
Chapter three
Chapter three: Consequences of population change for species distribution
68
Consequences of population change for the distribution of wintering waders on British
estuaries
Abstract
Aim The population size of many European wintering waders is changing, with some species
increasing and others declining. Given the statutory importance of maintaining these species in
designated protected areas, it is necessary to understand the consequences of population
change for local abundance and distribution, as this can help in assessing extinction/invasion
risk and targeting conservation measures. Here, we explore patterns of change in local
abundance and site occupancy of wintering wader species on estuaries throughout Great
Britain over the last two decades, and investigate possible ecological correlates of these
changes.
Methods We use national survey data (Wetland Bird Survey, WeBS) for 19 non-breeding
waders in 83 estuaries between two time periods (1980/81-1984/85 and 2002/03-2006/07) to
build Rank Occupancy-Abundance Profiles (ROAPs) for each species, in order to assess the
consequences of population change for changes in local abundances and/or site occupancy.
We also explore the variation in local abundance and distribution between species that differ
in diet, social behaviour, location of breeding grounds and winter habitat.
Results Populations sizes of all 19 species were observed to fluctuate, with significant overall
increases for nine species while none declined significantly. Although the number of estuaries
occupied by some species has changed greatly, population changes have primarily resulted in
changes in local abundances. Species that were initially more widespread showed smaller
changes in local abundance and site occupancy than rare species. Only changes in local
abundances were positively correlated with total population change. None of the ecological
characteristics explored here proved to be significant in explaining the observed variation in
local population size or distribution.
Main conclusions This study provides insights into the processes influencing changes in local
abundance and range expansion during periods of population fluctuations. While large
changes in site occupancy were apparent for a few species, changes in total wintering
population size were typically manifested more in changes in local abundances. It appears that
the mechanisms through which population change influence distribution are varied, but
habitat availability and site fidelity, along with wader longevity may explain the observed
patterns of change in occupancy and local abundances.
Keywords local abundance, population change, ROAP, site occupancy, species traits, waders

Chapter three: Consequences of population change for species distribution
69
Introduction
Changes in community composition and structure can greatly influence the dynamics of an
entire ecosystem, impacting its processes and functioning by altering, for instance,
productivity, food webs, nutrient cycling and successional stages (Loreau et al., 2002; Hooper
et al., 2005). Shifts in community composition can result from changes in species’ abundance
and distribution, through changes in local abundance, colonization of new sites, local
extinctions and/or range shifts. Therefore, understanding changes in community composition
requires an understanding of the dynamics of species that co-exist, and particularly how
changes in local abundance and regional occupancy are linked to processes acting at these two
spatial scales.
The general (although not universal) positive association between abundance and occupancy
(reviewed in Gaston et al., 2000 and Holt et al., 2002) has allowed large scale population
dynamics to be modelled as a function of local population dynamics, with the aim of predicting
total population size and, more recently, extinction risk (Gaston & Fuller, 2007; Mace et al.,
2008). Different ecological mechanisms have been put forward to explain the relationship
between abundance and occupancy (Gaston et al., 2000; Gaston & Blackburn, 2000) and these
can be grouped as: (i) range position, referring to the spatial position of species with respect to
their geographical range, since species tend to decline in abundance and occupancy towards
the edge of their ranges (Blackburn et al., 1999); (ii) resource availability, resulting from
variation in abundance and variety of resources used (e.g. Brown, 1984; Gaston, Blackburn &
Lawton, 1997) and in the availability of suitable habitat, since occupancy can depend on the
amount of suitable resource or habitat (e.g. Holt et al., 1997; Freckleton et al., 2005); and (iii)
population dynamics, concerning the possible consequences of population growth,
colonization and extinction rates (e.g. Levins, 1970; Holt et al., 1997; Hanski, 2000). However,
investigations of the processes underlying the abundance and occupancy relationship usually
use the average local abundance across all occupied sites. This approach can result in either
considerable overestimations of minimum local population size prior to extinction or in
underestimations of the maximum local population size that can be supported by the available
resources. Consequently, averaging local abundances across sites limits the capacity to
understand and detect changes in the distribution of abundances across sites throughout
species’ ranges.
Changes in total population size must involve either changes in the average abundance at
occupied sites and/or changes in total site occupancy (by means of gaining or losing local
populations through local colonisation or extinction). These changes are often associated with
changes in environmental conditions, such as habitat loss or degradation (Sutherland et al.,

Chapter three: Consequences of population change for species distribution
70
2012). However, there can be substantial variation between species in terms of the magnitude
and direction of population change in response to such environmental changes. Species’
responses are likely to be influenced by differences in species-specific traits related to life
history and to other ecological characteristics such as dispersal and competitive ability, as
particular traits are likely to respond differently to different environmental conditions. For
instance, species with greater dispersal capacity and competitive ability may be more able to
colonize new areas and establish viable populations and be less vulnerable to extinction
(Hanski, 2000). However, the predictive capacity of such traits in this context has been recently
argued to be limited for several taxonomic groups, including birds, odonates, alpine plants and
mammals (Angert et al., 2011). However, there was some evidence that differences in species
traits within those taxonomic groups were associated with variation in population changes
with regard to range shifts, with some traits promoting faster range shifts than others (Angert
et al., 2011).
Migratory wader species (Charadrii) use wetland habitats extensively during the non-breeding
season, and these habitats face increasing anthropogenic pressures (e.g. land claim,
disturbance and sea level rise). Recent studies have demonstrated that the composition and
structure of wintering wader communities is currently changing (Godet et al., 2011; Mendez et
al., 2012) as a result of variation in the demography of different wader populations (chapter 2).
Population size estimates are available for the majority of wintering waders in northwest
Europe (Delany et al., 2007; Musgrove et al., 2011), and changes in their abundance and
distribution have been documented across this region (Maclean et al., 2008). However, it
remains unclear how changes in population size are manifested as either changes in local
abundance or site occupancy. In other words, whether increases or decreases in population
size result in changes in local abundances within occupied sites, changes in distribution
through colonization of new sites or local extinction, or both. Understanding the spatial
structure of changes in local abundances for individual species and how it might vary among
species can help to identify how site protection measures might also vary for those species.
For instance, species for which population declines result in decreases in local abundances but
not local extinctions may be managed differently from those declining in site occupancy
resulting in a more restricted distribution.
Here we use abundance data for non-breeding waders across British estuaries to examine the
extent to which overall changes in wintering population size have resulted in changes in local
abundance and/or site occupancy. Changes in abundance and site occupancy of wader species
are likely to depend on traits such as the extent of site-fidelity and other factors that constrain
or facilitate dispersal, such as flocking and territoriality. Knowing which of these is more

Chapter three: Consequences of population change for species distribution
71
prevalent is important because it can influence how best to monitor populations, within and
between sites. Similarly, the frequency of changes in population size will influence the
probability of range change, and thus the need to consider sites beyond current ranges when
planning conservation. In order to quantify the magnitude and direction of changes in
wintering population abundance and distribution between two time periods (1980/81-1984/85
and 2002/03-2006/07) we use Rank Occupancy-Abundance Profiles (ROAPs; Collins et al.,
2009). This approach provides a graphical representation of local abundances across all sites
occupied by a given species and, thus, the total number of sites occupied. We quantify changes
in local abundances and site occupancy in relation to overall population change for 19 study
species. We then explore whether (i) changes in local abundance and site occupancy are more
or less likely in species that are initially widespread or narrowly distributed, initially abundant
or rare; (ii) social behaviour influences the probability of colonisation of new sites, with the
expectation of non-flocking species having greater capacity to expand into new suitable
habitat than flocking species; (iii) diet breadth influences the probability of changes in site
occupancy, as a result of different rates of change across different species of the invertebrate
community (e.g. shell-fishing activities could cause bivalve feeders to go locally extinct); and (iv)
wintering habitat choice or breeding region influences patterns of population change, which
could suggest differences among species in the effect of environmental pressures operating
within wintering habitats, or in processes occurring across different breeding grounds.
Methods
Data collection
Several species of waterbirds winter in the UK, however, we restricted our analyses to 19
wintering species for which population trends are available and regularly assessed by Wetland
Bird Survey (WeBS, Holt et al., 2011), a joint scheme of the British Trust for Ornithology (BTO),
Royal Society for the Protection of Birds (RSPB) and Joint Nature Conservation Committee
(JNCC), in association with the Wildfowl & Wetlands Trust (WWT). These species were also
selected because of their high winter dependency on coastal wetlands, mainly estuarine
habitats, which are very dynamic systems and prone to environmental and anthropogenic
change (Davidson et al., 1991). All selected species are waders with the exception of shelduck
Tadorna tadorna, which (as elsewhere, e.g. Clark & Prŷs-Jones, 1994) is included here because
of its high dependence on estuaries during winter and its similarity in feeding ecology to
waders, being also extremely reliant on intertidal invertebrate prey.
Under the WeBS monitoring scheme and its predecessor schemes, synchronized monthly
counts are carried out at the UK’s important wetlands on predetermined monthly dates (thus

Chapter three: Consequences of population change for species distribution
72
minimizing the likelihood of double-counting some individuals or missing others), and the
resulting national population estimates for all species are published annually (Holt et al., 2011).
Detailed information on the survey methodology, count accuracy and completeness are
provided in Holt et al. (2011). We used count data for 83 British estuaries that have been
systematically surveyed and for which the monthly coverage is considered to be complete
between the winters of 1980/81 and 2006/07.
Winter mean abundance for each species at each site was calculated using counts from
November to February, when the number of birds using a site more accurately reflects stable
non-breeding population numbers.
Data Analysis
To compare population changes across time, a five-year mean abundance at each site was
calculated for the periods 1980/81-1984/85 and 2002/03-2006/07, as this reduces the
influence of any between-observer differences in counts. The five-year mean abundance for a
given species in a particular estuary is thus considered as its local abundance.
Variation among population trends was firstly assessed using population growth indices, which
provide a measure of population size on an arithmetic scale relative to one, and result from
dividing the final population size by the initial population size. Thus, if an index is above unity,
for example 1.3, means that the population has increased by 0.3 (i.e. 30%) and if it is below
unity, for example 0.8, the population has decreased by 0.2 (i.e. 20%).
To understand the consequences of population change for local abundances and species
distribution (i.e. site occupancy), we used Rank Occupancy-Abundance Profiles (ROAPs; Collins
et al., 2009). ROAP uses a graphical representation of abundances across space, displaying the
distribution of local abundances and site occupancy. To generate a ROAP for a single species at
a given time, all sites are ordered and ranked by the species local abundance (here using five
year means, as described above), from the highest (site rank 1) to the lowest local abundance.
The rank position of a given site is divided by the total number of sites (83) to determine the
relative rank. This allows comparisons between species with different distributions (some
species are present across the majority of British estuaries whereas others have a more
restricted distribution). Species-specific ROAPs can then be generated by plotting the local
abundance (y-axis) against the relative rank of the estuaries (x-axis) (Figure 1).

Chapter three: Consequences of population change for species distribution
73
Figure 1. Species Rank Occupancy-Abundance Profiles (ROAPs) for two time periods,
represented by the grey and black lines. Each ROAP shows the distribution of local abundances
(y-axis) and the proportion of sites occupied (x-axis). Overall population change is the area
between the two ROAPs (D*). The filled triangles represent the changes in maximum local
abundance (diagonal lines) and in site occupancy (diamonds). Changes in intermediate local
abundance are represented by the unfilled space between ROAPs. Figure adapted from Collins
(2009).
To test for differences between ROAPs at different time periods, we used the non-parametric
statistic D* (Collins et al., 2009), calculated as the area between the two ROAPs or the
difference in total population size between two time periods (Figure 1). Total population size
was calculated as the sum of the local abundances across all estuaries for each time period (i.e.
the area under each ROAP). Therefore, D* represents the number of birds gained/lost
between two time periods. We tested for statistical significance of D* using a randomization
protocol (Collins et al., 2009). For each pair of ROAPs, we combined the dataset of each time
period into one, and re-sampled the data 1000 times, randomly assigning each abundance to a
time period without replacement, and calculated D* for each randomization. This generates a
statistical distribution of D* values that could have been generated by chance alone, given the
observed data. We compared the empirical D* (increase or decrease) to the distribution
generated from the randomizations and considered the results to be significant at α=0.05
We then quantified the changes in local abundance and site occupancy resulting from changes
in the overall population change for each species. First, we divided the area between ROAPs
into different sectors according to where each ROAP intersects with the true axis (Figure 1)
(Collins, 2009). Changes in site occupancy were assessed from the intersect between ROAPs on
maximum local abundance
total sites occupied

Chapter three: Consequences of population change for species distribution
74
the x-axis (diamond-filled triangle in Figure 1) and calculated as the sum of individuals at sites
where a species has colonized or gone locally extinct between the two time periods. Changes
in local abundance were explored for both maximum and intermediate local abundance
(Figure 1). Changes in maximum local abundance were quantified using the intersect between
ROAPs and the y-axis, summing the populations at sites that, at the end of the time period,
have higher/lower abundances than the maximum local abundance at the beginning of the
time period (diagonal line-filled triangle in Figure 1). Changes in intermediate local abundances
were calculated as the sum of local populations that have not been included in the other two
changes. Finally, changes in local abundance and occupancy were transformed into
proportions of the initial population. For example, to understand shifts in maximum local
abundance between periods, we divided changes in maximum local abundance by D*, and
multiplied by the growth index previously calculated (% population change between 1980/81-
1984/85 and 2002/03-2006/07), resulting in the proportionate amount by which the
population had increased or decreased through changes in maximum abundance. The %
change in site occupancy represents the % of the initial population that occurs in colonised
sites or that was in sites from which the species has gone locally extinct.
We used Kruskal-Wallis tests to explore differences in population change (overall changes and
the consequent changes in maximum and intermediate local abundances and site occupancy)
of species grouped by diet, social behaviour, location of breeding grounds and winter habitat
(Table 1). Using the proportion of prey in the species diet (Leopold et al., 2004 a, b; Gill et al.,
2001b; Gillings & Sutherland, 2007), we classified species by their food preference: bivalves,
worms, mixed (feed on both worms and bivalves) and other (when the main prey is neither
bivalves nor worms). The social behaviour of species was classified into three broad categories:
gregarious (from few individuals to <1000), highly gregarious (from 1000 to >10000 individuals)
and not gregarious (from 1 to 30 individuals) (Birdlife, 2012). Location of the breeding grounds
allowed the species to be classified into temperate, sub-arctic, arctic and high arctic (Delany et
al., 2009). Finally, following Musgrove et al. (2011), we also classified species by their wintering
habitat preference: estuaries, estuaries & inland, estuaries & non-estuarine, non-estuarine &
inland, fresh water marshes & wet grassland, and non-estuarine (e.g. rocky shores).
We used the number of individuals rather than density as a measure of abundance because
although the correlation between density and area was not statistically significant, there was a
negative association such that small estuaries tend to have greater densities than large
estuaries. Thus, in the ROAP approach, small estuaries with high density populations will be
ranked high, whereas a large local population in a very big estuary may have a low density and
thus be ranked low. Moreover, total numbers are more suitable in indicating real differences in

Chapter three: Consequences of population change for species distribution
75
local population sizes and population trends (i.e. it is more meaningful to say that a given
population has lost 3000 individuals than 2 individuals per hectare). All analyses were
conducted in R (R Development Core Team 2011).

76
Table 1. Species’ diet, social behaviour, location of breeding grounds and winter habitat. The information sources are specified in the text.
Species Scientific name Species
code Food preference
Social behaviour Breeding grounds Wintering habitat
Avocet Recurvirostra avosetta av worm gregarious Temperate estuaries
Bar-tailed godwit Limosa lapponica ba worm highly gregarious Arctic estuaries
Black-tailed godwit Limosa limosa bw bivalve highly gregarious Sub-arctic estuaries, inland
Curlew Numenius arquata cu mixed not gregarious Sub-arctic estuaries, non-estuarine, inland
Dunlin Calidris alpina dn worm highly gregarious Sub-arctic estuaries
Spotted redshank Tringa erythropus dr other not gregarious Sub-arctic estuaries
Greenshank Tringa nebularia gk other not gregarious Arctic estuaries
Golden plover Pluvialis apricaria gp other gregarious Sub-arctic estuaries, inland
Grey plover Pluvialis squatarola gv worm not gregarious Sub-arctic estuaries
Knot Calidris canutus kn bivalve highly gregarious Arctic estuaries
Lapwing Vanellus vanellus l_ other highly gregarious Sub-arctic estuaries, inland
Oystercatcher Haematopus ostralegus oc bivalve not gregarious Sub-arctic estuaries, inland
Purple sandpiper Calidris maritima ps mixed gregarious Arctic non-estuarine
Redshank Tringa totanus rk mixed gregarious Temperate estuaries, non-estuarine, inland
Ringed plover Charadrius hiaticula rp worm gregarious Arctic estuaries, non-estuarine, inland
Ruff Philomachus pugnax ru other highly gregarious Sub-arctic fresh water marshes, wet grassland
Sanderling Calidris alba ss worm gregarious High-arctic estuaries
Shelduck Tadorna tadorna su other highly gregarious Sub-arctic estuaries
Turnstone Arenaria interpres tt other gregarious High-arctic estuaries, non-estuarine
Chapter three: Consequences of population change for species distribution
77
Results
Variation in population trends
The populations of waders using estuaries monitored by WeBS in the UK fluctuated by varying
amounts between 1980/81-1984/85 and 2002/03-2006/07 (Figure 2). Five species have
declined over this period, with purple sandpiper and shelduck suffering the greatest losses
(both wintering populations declined by around 25%). Avocet, black-tailed godwit and golden
plover experienced the greatest population increases, of 1689, 554 and 418% of the initial
population, respectively (Table 2).
Of the 19 species analysed, nine showed statistically significant differences between ROAPs in
1980/81-1984/85 and 2001/02-2006/07 (Table 2, D* test p<0.05). Populations of all these nine
species had increased over this period (Figure 3). Black-tailed godwit showed the greatest
increase in wintering site occupancy (25 new sites, with local abundances up to approximately
100 individuals), followed by avocet (15 new sites, with local abundances ranging from a few
individuals to 200). Other species that also occupied new estuaries across Britain during this
period were greenshank, golden plover and sanderling. Grey plover was the only species that
showed a decrease in site occupancy, being present at five fewer sites in 2002/03-2006/07
than in 1980/81-1984/85 (Figure 3). Common species on British estuaries such as curlew,
redshank and lapwing were present in at least 90% of the estuaries considered in the present
study (Figure 3).
Consequences of population change for changes in local abundance and site occupancy
The changes in local abundance and wintering occupancy resulting from population changes
varied among species. Overall, changes in wintering populations have largely resulted in
changes in local abundances rather than changes in site occupancy. Only four species showed
changes in site occupancy greater than 2% (Table 2, Figure 4). Of the species with statistically
significant D*, most of the population increase was manifest in increases in local abundances,
both maximum and intermediate, rather than in site occupancy (Table 2). Wintering
populations of avocet and black-tailed godwit increased in maximum local abundances by 829%
and 215%, respectively between 1980/81-1984/85 and 2002/03-2006/07. For the remaining
species, changes in intermediate local populations were greater than changes in maximum
local abundance (i.e. the proportion of individuals gained at intermediate abundance
populations is higher than the proportion of individuals gained through changes in maximum
local abundance) (Table 2). Although the number of estuaries occupied by some species has

Chapter three: Consequences of population change for species distribution
78
changed greatly (e.g. black-tailed godwit and avocet), the local abundances in colonised sites
were small in comparison to the increases in local abundances in occupied sites (Figures 3 & 4).
Figure 2. Population changes of wader species on British estuaries between 1980/81-1984/85
and 2002/03-2006/07 (y-axis is log-scaled). Population abundance at each time period is
calculated as the sum of all local populations (mean winter abundance). Population changes
are calculated in relation to the initial population abundance, thus population increases are
above 1 (horizontal dashed line) and population decreases are below 1. Species are ordered by
decreasing magnitude of population change. Species codes are provided in Table 1.

Chapter three: Consequences of population change for species distribution
79
Table 2. Wintering wader population changes on British estuaries between 1980/81-1984/85
and 2002/03-2006/07. Initial population is the sum of all individuals across all sites. D* is the
difference in population abundance between the two time periods and represents the number
of individuals lost or gained between time periods. The p values are derived using a
randomization protocol by comparing empirical D* with the random distribution of D*. The
percentage change is calculated in relation to the initial population abundance and indicates
the total population change and the changes in maximum and intermediate local abundances
and site occupancy. Species codes are provided in Table 1.
% change of:
Species code
Initial population
D* p total population
maximum abundance
Intermediate abundance
occupancy
av 327 5525 <0.001 1690 829.05 636.39 224.85
ba 38092 -3322 0.37 -9 7.85 -16.58 0.005
bw 4060 16971 <0.001 418 214.67 187.16 16.15
cu 43422 18891 0.009 43 4.29 39.04 0.16
dn 357848 -27661 0.36 -8 1.13 -8.86 0
dr 41 11 0.20 27 -7.31 31.7 2.43
gk 136 92 0.015 67 19.63 44.36 2.90
gp 19329 107026 <0.001 554 274.75 278.79 0.15
gv 18297 13922 0.005 76 13.72 62.37 -0.01
kn 189824 55844 0.24 29 3.03 26.38 0
l_ 76074 125535 <0.001 165 50.96 114.04 0
oc 196028 32350 0.29 16 7.01 9.48 0.0005
ps 557 -147 0.22 -26 -45.6 19.03 0
rk 51349 17027 0.037 33 3.36 29.78 0.005
rp 5757 -123 0.43 -2 3.634 -5.76 0
ru 120 56 0.24 47 16.66 30 0
ss 3979 3122 0.035 78 11.3 66.67 0.47
su 69160 -17859 0.11 -26 -29.79 3.95 0.01
tt 9331 329 0.41 4 0.39 3.12 0.01

Chapter three: Consequences of population change for species distribution
80
Figure 3. Rank occupancy-abundance profiles (ROAP) at two time periods, 1980/81-1984/85
(open circles) and 2002/03-2006/07 (filled circles), for all species that showed significant
population changes (D* - see table 2). Local abundance was measured as the five-year mean
abundance for the two time periods at each estuary. Relative rank was calculated by dividing
the rank order of estuaries by the total number of estuaries surveyed (n=83). Each estuary in
which the species was present is represented by a single point. For ease of interpretation,
estuaries where species were not present (local abundance=0) are not shown.
Correlates of population change
There was no significant correlation between changes in maximum or intermediate local
abundance and initial population size (Figure 5 a, d). However, changes in site occupancy were
negatively correlated with initial population size for species with significant change in
population size (D*) (Figure 5 g). Changes in maximum and intermediate local abundances and
site occupancy were negatively correlated with initial population occupancy (Figure 5 b, e, h),
but the correlation was only statistically significant for species with significant change in

Chapter three: Consequences of population change for species distribution
81
population size. So, among species with significant changes in population size, those that were
initially rare have colonized more new sites.
Figure 4. Relationship between changes in maximum local abundance and changes in site
occupancy of 19 wader species on British estuaries. Changes are expressed as a proportion of
initial population abundance. Both axes are log10-scaled. Dashed lines indicate the initial time
period, hence species under the horizontal dashed line have decreased in maximum local
abundance and species above the line have increased, and species to the left of the vertical
dashed line have decreased in wintering occupancy and species on the right have increased.
Species with significant D* are shown in filled circles and species with non-significant D* are
shown in open circles. Species codes are provided in Table 1.
Changes in local abundances - maximum and intermediate - were significantly positively
correlated with total population change; the greater the total population change the greater
the change in local abundance (Figure 5 c, f). This correlation was consistent for analyses
including all species and excluding the species showing non-significant D*. On the other hand,
there was no significant correlation between changes in site occupancy and total population
change (Figure 5 i).

Chapter three: Consequences of population change for species distribution
82
Figure 5. Top row: relationships between changes in maximum local abundance and (a) initial
population abundance, (b) initial population occupancy (rho = -0.7, n = 9, p = 0.04) and (c) total
population change (solid line, rho = 0.86, n = 19, p < 0.001; dotted line, rho = 0.93, n = 9, p <
0.001). Middle row: relation between changes in intermediate local abundance and (d) initial
population abundance, (e) initial population occupancy (rho = -0.73, n = 9, p = 0.03) and (f)
total population change (solid line, rho = 0.93, n = 19, p < 0.001; dotted line, rho = 1, n = 9, p <
0.001). Bottom row: relation between changes in site occupancy and (g) initial population
abundance (rho = -0.7, n = 9, p = 0.03), (h) initial population occupancy (rho = -0.78, n = 9, p =
0.01) and (i) total population change. Black solid lines show the correlation when all the
species are included, whilst dotted line show the correlation when only species with
statistically significant change in D*are analysed (filled circles). Open circles are species with no
statistically significant change in D* (see table 2 for details).

Chapter three: Consequences of population change for species distribution
83
There was no statistically significant difference between the overall population change of
species with different dietary composition, social behaviour, breeding grounds and wintering
habitat (Table 3). This pattern was also consistent when differences between these groups in
maximum local abundances, intermediate local abundances and/or site occupancy were
analysed (Table 3, Figure 6).
Figure 6. Variation in changes in local abundance and site occupancy between 1980/81-
1984/85 and 2002/03-2006/07 of 19 wintering wader species, grouped by (a) the main prey
type in their diet, (b) social behaviour, (c) breeding grounds and (d) wintering habitat.

Chapter three: Consequences of population change for species distribution
84
Table 3. Variation in population change (overall changes and the consequent changes in
maximum and intermediate local abundances and site occupancy) of species grouped by diet,
social behaviour, location of breeding grounds and winter habitat (Kruskal-Wallis test).
Dietary
composition
Social behaviour Breeding grounds Wintering habitat
Changes in: χ2 df p χ2 df p χ2 df p χ2 df p
Total size 0.88 3 0.83 0.36 2 0.83 3.83 3 0.28 5.94 5 0.31
Max. abundance 2.22 3 0.52 0.01 2 0.99 1.48 3 0.68 8.11 5 0.15
Interm. abundance 0.46 3 0.92 0.88 2 0.64 3.45 3 0.32 4.09 5 0.53
Site occupancy 0.59 3 0.89 1.25 2 0.53 2.69 3 0.44 2.35 5 0.79
Discussion
Consequences of population change for species distribution and local abundances
The overall abundance of wader species wintering on wetlands across Great Britain has
increased over the last 40 years, and in particular during the mid-1970s to late 1990s (Holt et
al., 2011). However, since then, the numbers of most species have stabilised and some have
even decreased (Holt et al., 2011; Musgrove et al., 2011). Our analyses support the general
trend in increasing population abundance for most species, and reveal that several species
have also experienced changes in site occupancy, with all but one (grey plover) expanding their
range within Britain. However, changes in occupancy were always accompanied by increases in
local abundance (Figure 4), supporting the general pattern of positive abundance-occupancy
relationships, and suggesting that many sites were not at maximum carrying capacity for these
species at the start of the study (Goss-Custard et al., 2002). Colonisation of new sites is likely
to be a density-dependent response to increases in local abundance. This process has already
been described for wintering black-tailed godwits, which have undergone a significant increase
in population size over the past 30 years and expanded into estuaries on the east coast of
England (Gill et al., 2001a). However, the establishment and expansion of new populations will
depend, among other things, on the number of suitable sites available and the amount of
resources available within those sites (Gill et al., 2001a).
The extent of initial occupancy proved to be an important factor influencing patterns of
change in local abundance and distribution of the wader species with significant population
changes. Initially rare and narrowly distributed species (e.g. avocet) have been able to expand
their ranges, whereas abundant and widespread species (e.g. lapwing) have not experienced

Chapter three: Consequences of population change for species distribution
85
changes in occupancy but have increased in local abundances. This pattern would be expected
as widespread species were already present across the majority of suitable habitat, and thus
the potential for colonisation of new sites in response to population increases was limited. Our
results suggest that the expansion of some species into new sites may result from density-
dependent pressures on resource use, as species that have expanded their range have also
increased in local abundance within the previously occupied sites. Changes in site occupancy
are likely to depend on the amount and distribution of suitable habitat, the distances over
which individuals will disperse and the total number of potential dispersers in the population,
resulting from intrinsic population growth (Freckleton et al., 2005). It is worth noting that it is
likely that many of the common species may be expanding outside the range included here, for
example into other estuarine sites across Europe (Maclean et al., 2008). Although the analyses
used in this paper do not encompass the entire winter range of these species, the results
suggest that, for declining populations, local declines will occur before local extinctions.
Identifying overall population declines will thus require detailed surveys and monitoring of
local winter population sizes on individual sites, such as the data used in this study.
Despite the large number of estuaries occupied by some of the wintering species (e.g. black-
tailed godwit and avocet), the number of individuals gained through changes in site occupancy
– resulting in the formation of new local populations – was small in relation to the number of
individuals gained through changes in larger local abundances, as abundance increased at all
local population sizes. As shown for other waterbird species (Jackson et al., 2004), site fidelity
can strongly influence patterns of occupancy, particularly given the longevity of these bird
species. Site choice by individuals may also be influenced by the performance and abundance
of conspecifics, resulting in aggregations around areas of abundant resources (Doligez et al.,
1999; Brown et al., 2000; Jackson et al., 2004). Thus, juvenile settlement decision may be
influenced by the distribution of conspecifics, resulting in increased local abundances rather
than colonisation of new sites.
Five out of the 19 species analysed decreased in number between 1980/81-1984/85 and
2001/02-2006/07 (bar-tailed godwit, dunlin, ringed plover, purple sandpiper and shelduck),
although these changes were not statistically significant. Despite this decreasing tendency, no
range contraction (i.e. local extinctions) occurred for these five species over that time period.
Instead, the decreases in the wintering population size resulted solely in declines in local
abundances, with either declines at maximum or intermediate local abundances. However,
should populations continue to decline then local extinctions from sites with small local
populations are inevitable, as small populations are most likely to be vulnerable to extinction
(MacArthur & Wilson, 1967; Pimm et al., 1988; Lawton, 1993). The fact that the overall decline

Chapter three: Consequences of population change for species distribution
86
has not resulted in local extinctions for these five species might be because populations
declines have not yet been sufficiently severe for local extinctions to occur, combined with the
fact that we considered a time period of 26 years, which might also be insufficient to capture
the effect of extinctions, given the longevity and site-faithfulness of waders. According to the
extinction debt concept, local extinction of species may occur with delay following an
environmental perturbation (Tilman et al., 1994) and it is expected that for long-lived species
there would be a longer time lag between declines in local abundances and loss of site
occupancy (reviewed in Kuussaari et al., 2009). The life-span of waders wintering in Great
Britain ranges from around 7 to 40 years (BTO, 2012), and studies have shown that many
wader species are faithful to their wintering sites both within and between winters (e.g.
Burton & Evans, 1997; Burton, 2000 and reference therein). Thus, it is highly likely that small
populations will persist at traditional wintering sites. All the declining species, with the
exception of purple sandpiper, are widespread across Britain, so the persistence of small local
populations may suggest that the biotic and/or abiotic pressures influencing the overall
wintering population are acting differently across wintering sites, depressing the maximum
and intermediate local abundances.
Potential drivers of variation in population trends in wintering waders
Differences in trends in the distribution and local abundance of wintering wader species in this
study were not explained by any of the species-specific characteristics explored. We expected
that social-behaviour might influence the probability of dispersal to new sites, resulting in
gregarious species showing greater changes in local abundances rather than occupancy, and
non-flocking species showing greater changes in occupancy than in local abundances. However,
wintering waders are generally gregarious, and so there was limited variation in this trait with
which to identify such an effect, and no statistical differences between groups of different
levels of gregariousness were observed (Figure 6b). All of the wader species in this study are
migratory, and thus their abundance and distribution may be affected by factors operating
throughout the annual cycle, including wintering, breeding and migratory periods (Alves et al.,
in press). However, differences among species in wintering habitat type, main prey type or
location of breeding grounds do not explain differences in trends in winter distribution and
abundance (Figure 6). Between-species comparisons of this sort may not be capable of
identifying these effects in this case due to the relatively limited variation in wader ecology.
Identifying the role of these effects would probably therefore require within-species studies or
inclusion of a wider range of species and sites (e.g. across Europe).

Chapter three: Consequences of population change for species distribution
87
In conclusion, our study provides an insight into how local abundances vary across sites and
how local abundance and site occupancy change in response to overall population change in
wintering waders. While large changes in site occupancy have been described for some of the
species included here, overall, changes in wintering wader populations have mostly resulted in
changes in local abundance (at both maximum and intermediate population sizes). It appears
that the mechanisms driving population changes are varied, but habitat availability and site
fidelity, along with wader longevity may explain the strong tendency for local population
abundance to change much more than site occupancy. Given the statutory importance of
maintaining wader (and other waterbird) populations in designated protected areas under
legislative frameworks such as the Birds Directive (2009/147/EC) and the Habitats Directive
(92/43/EEC), it is important to maintain surveys for identifying the changes in local abundances
and distribution that are likely to result from changes in the total population size. In the case of
declining species, conservation plans should not be focused only on small populations since
abundant local populations may suffer the greatest declines. Similarly, it is important to
understand site occupancy of species to be able to assess whether there is potential for
colonization of new sites by increasing species.
Chapter three: Consequences of population change for species distribution
88
References
Alves, J.A., Gunnarsson, T.G., Hayhow, D.B., Appleton, G.F., Potts, P.M., Sutherland, W.J. & Gill,
J.A. (in press) Costs, benefits and fitness consequences of different migratory
strategies. Ecology.
Angert, A.L., Crozier, L.G., Rissler, L.J., Gilman, S.E., Tewksbury, J.J. & Chunco, A.J. (2011) Do
species’ traits predict recent shifts at expanding range edges?. Ecology Letters, 14,
677–689.
BirdLife International (2012) IUCN Red List for birds. Available from http://www.birdlife.org,
accessed on 21/ 04/ 2012.
Blackburn, T.M., Gaston, K.J, Quinn, R.M. & Gregory, R.D. (1999) Do local abundances of British
birds change with proximity to range edge?. Journal of Biogeography, 26, 493-505.
Brown, J.H. (1984) On the relationship between abundance and distribution of species.
American Naturalist, 124, 255 – 279.
Brown, C.R., Brown, M.B. & Danchin, E. (2000) Breeding habitat selection in cliff swallows: the
effect of conspecific reproductive success on colony choice. Journal of Animal Ecology,
69, 133–142.
British Trust for Ornithology BTO (2012) BirdFacts. Available from http://www.bto.org/about-
birds/birdfacts, accessed on 24/05/2012.
Burton, N.H.K. (2000) Winter site-fidelity and survival of Redshank Tringa totanus at Cardiff,
south Wales. Bird Study, 47, 102-112.
Burton, N.H.K. & Evans, P.R. (1997) Survival and winter site-fidelity of Turnstones Arenaria
interpres and Purple Sandpipers Calidris maritima in north-east England. Bird Study, 44,
35-44.
Clark, N.A. & Prŷs-Jones, R.P. (1994) Low tide distribution of wintering waders and Shelduck on
the Severn Estuary in relation to the proposed tidal barrage. Biological Journal of the
Linnean Society, 51, 199–217.
Collins, C.D. (2009) Population and community responses to anthropogenic environmental
changes. Unpublished PhD thesis, University of Kansas.
Collins, C.D., Holt, R.D. & Foster, B.L. (2009) Patch size effects on plant species decline in an
experimentally fragmented landscape. Ecology, 90, 2577-2588.

Chapter three: Consequences of population change for species distribution
89
Davidson, N.C., Laffoley, D. d’A., Doody, J.P., Way, L.S., Gordon, J., Key, R., Pienkowski, M.W.,
Mitchell, R. & Duff, K.L. (1991) Nature Conservation and Estuaries in Great Britain.
Nature Conservancy Council, Peterborough, UK.
Delany, S., Scott, D.A., Helmink, T. & Martakis, G. (2007) Report on the Conservation Status of
Migratory Waterbirds in the Agreement Area. Third Edition. AEWA Technical Series No.
13. Bonn, Germany.
Delany, S., Scott, D., Dodman, T. & Stroud, D. (2009) An atlas of wader populations in Africa and
Western Europe. Wageningen, The Netherlands: Wetlands International.
Doligez, B., Danchin, E., Clobert, J. & Gustafsson, L. (1999) The use of conspecific reproductive
success for breeding habitat selection in a non-colonial, hole-nesting species, the
collared flycatcher Ficedula albicollis. Journal of Animal Ecology, 68, 1193-1206.
Freckleton, R.P., Gill, J.A., Noble, D. & Watkinson, A.R. (2005) Large-scale population dynamics,
abundance-occupancy relationships and the scaling from local to regional population
size. Journal of Animal Ecology, 74, 353-364.
Gaston, K.J. & Blackburn, T.M. (2000) Pattern and process in macroecology. Blackwell Science,
Oxford.
Gaston, K.J., Blackburn, T.M., Greenwood, J.J.D., Gregory, R.D., Quinn, R.M. & Lawton, J.H.
(2000) Abundance-occupancy relationships. Journal of Applied Ecology, 37, 39-59.
Gaston, K.J., Blackburn, T.M. & Lawton, J.H. (1997) Interspecific abundance-range size
relationships: an appraisal of mechanisms. Journal of Animal Ecology, 66, 579–601.
Gaston, K.J. & Fuller, R.A. (2007) Biodiversity and extinction: Losing the common and the
widespread. Progress in Physical Geography, 31, 213–225.
Gill, J.A., Norris, K., Potts, P.M., Gunnarsson, T.G., Atkinson, P.W. & Sutherland, W.J. (2001a) The
buffer effect and large-scale population regulation in migratory birds. Nature, 412, 436-
438.
Gill, J.A., Sutherland, W.J. & Norris, K. (2001b) Depletion models can predict shorebird
distribution at different spatial scales. Proceedings of the Royal Society of London.
Series B: Biological Sciences, 268, 369-376.
Gillings, S. & Sutherland, W.J. (2007) Comparative diurnal and nocturnal diet and foraging in
Eurasian Golden Plovers Pluvialis apricaria and Northern Lapwings Vanellus vanellus

Chapter three: Consequences of population change for species distribution
90
wintering on arable farmland. Ardea, 95, 243–257.
Godet, L., Jaffré, M. & Devictor, V. (2011) Waders in winter: long-term changes of migratory
bird assemblages facing climate change. Biology Letters, 7, 714-717.
Goss-Custard, J.D., Stillman, R.A., West, A.D., Caldow, R.W.G. & McGrorty, S. (2002) Carrying
capacity in overwintering migratory birds. Biological Conservation, 105, 27-41.
Hanski, I. (2000) Metapopulation Ecology. Oxford University Press, Oxford.
Holt, A.R., Gaston, K.J. & He, F. (2002) Occupancy-abundance relationships and spatial
distribution: A review. Basic and Applied Ecology, 3, 1-13.
Holt, R.D., Lawton, J.H., Gaston, K.J. & Blackburn, T.M. (1997) On the relationship between
range size and local abundance: back to basics. Oikos, 78, 183–190.
Holt, C.A., Austin, G.E., Calbrade, N.A., Mellan, H.J., Mitchell, C., Stroud, D.A., Wotton, S.R. &
Musgrove, A.J. (2011) Waterbirds in the UK 2009/10: The Wetland Bird Survey.
BTO/RSPB/JNCC, Thetford.
Hooper, D.U, Chapin, F.S., Ewel, J.J., Hector, A., Inchausti, P., Lavorel, S., Lawton, J.H., Lodge,
D.M., Loreau, M., Naeem, S., Schmid, B., Setälä, H., Symstad, A.J., Vandermeer, J. &
Wardle, D.A. (2005) Effects of Biodiversity on Ecosystem Functioning: A Consensus of
Current Knowledge. Ecological Monographs, 75, 3-35.
Jackson, S.F., Kershaw, M. & Gaston, K.J. (2004) The buffer effect and the selection of protected
areas for waterbirds in Britain. Biological Conservation, 120, 137-143.
Kuussaari, M., Bommarco, R., Heikkinen, R.K., Helm, A., Krauss, J., Lindborg, R., Öckinger, E.,
Pärtel, M., Pino, J., Rodà, F., Stefanescu, C., Teder, T., Zobel, M. & Steffan-Dewenter, I.
(2009) Extinction debt: a challenge for biodiversity conservation. Trends in Ecology &
Evolution, 24, 564-571.
Lawton, J.H. (1993) Range, population abundance and conservation. Trends in Ecology &
Evolution, 8, 409–413.
Leopold, M.F., Dijkman, E.M., Cremer, J.S.M., Meijboom, A. & Goedhart, P.W. (2004a) De
effecten van mechanische kokkelvisserij op de benthische mac- rofauna en hun habitat.
Eindverslag EVA II (Evaluatie Schelpdiervisserij tweede fase). Deelproject C1 ⁄ 3. Alterra
rapport 955. Alterra, Wageningen, The Netherlands.
Leopold, M.F., Smit, C.J., Goedhart, P.W., van Roomen, M., van Winden, A.J. & van Turnhout, C.
Chapter three: Consequences of population change for species distribution
91
(2004b) Langjarige trends in aantallen wadvogels in relatie tot de kokkelvisserij en het
gevoerde beleid in deze. Eindverslag EVA II (Evaluatie schelpdiervisserij tweede fase).
Deelproject C2. Alterra rapport 954; SOVON onderzoeksrapport 2004⁄07. Alterra,
Wageningen, The Netherlands.
Levins, R. (1970) Extinction. Some Mathematical Questions in Biology (ed. M. Gerstenhaber),
pp. 77–107. American Mathematical Society, Providence.
Loreau, M., Naeem, S. & Inchausti, P. (Eds) (2002) Biodiverity and ecosystem functioning:
synthesis and perspectives. Oxford University Press, Oxford, United Kingdom.
MacArthur, R.H. & Wilson, E.O (1967) The Theory of Island Biogeography. Princeton University
Press, Princeton, NJ, USA.
Mace, G.M., Collar, N.J., Gaston, K.J., Hilton-Taylor, C., Akçakaya, H.R., Leader-Williams, N.,
ilner-Gulland, E.J. & Stuart, S.N. (2008) Quantification of extinction risk: IUCN’s system
for classifying threatened species. Conservation Biology, 22, 1424-1442.
Maclean, I.M.D., Austin, G.E., Rehfisch, M.M., Blew, J., Crowe, O., Delany, S., Devos, K.,
Deceuninck, B. Gunther, K., Laursen, K., van Roomen, M. & Wahl, J. (2008) Climate
change causes rapid changes in the distribution and site abundance of birds in winter.
Global Change Biology, 14, 2489-2500.
Mendez, V., Gill, J.A., Burton, N.H.K., Austin, G.E., Petchey, O.L. & Davies, R.G. (2012) Functional
diversity across space and time: trends in wader communities on British estuaries.
Diversity and Distributions, 18, 356-365.
Musgrove, A.J., Austin, G.E., Hearn, R.D., Holt, C.A., Stroud, D.A. & Wotton, S.R. (2011)
Overwinter population estimates of British waterbirds. British Birds, 104, 364-397.
Pimm, S.L., Jones, H.L. & Diamond, J. (1988) On the risk of extinction. American Naturalist,
132,757–785.
R Development Core Team (2011). R: A language and environment for statistical computing. R
Foundation for Statistical Computing, Vienna, Austria. ISBN 3-900051-07-0, URL
http://www.R-project.org/.
Sutherland, W.J., Alves, J.A., Amano, T., Chang, C.H., Davidson, N.C., Finlayson, C.M., Gill, J.A.,
Gill Jr, R.E., González, P.M., Gunnarsson, T.G., Kleijn, D., Spray, C.J., Székely, T. &
Thompson, D.B.A. (2012) A horizon scanning assessment of current and potential
future threats to migratory shorebirds. Ibis, 154, 663-679.

Chapter three: Consequences of population change for species distribution
92
Tilman, D., May, R.M., Lehman, C.L. & Nowak, M.A. (1994) Habitat destruction and the
extinction debt. Nature, 371, 65–66.

93
Chapter four

Chapter four: Variations in functional diversity along environmental gradients
94
Variations in functional diversity and structure of wintering wader communities along
different environmental gradients in Great Britain
Abstract
Aim During the non-breeding season, British estuarine ecosystems support many populations
of protected migratory wader species. The functional diversity of these wintering communities
varies geographically and temporally. Understanding how wader community structure varies
along different environmental gradients may indicate the processes that regulate the
mechanisms by which communities are assembled. We used deviations of observed functional
diversity from expected functional diversity (FD), which can reflect community assembly
processes (limiting similarity and environmental filtering), to explore spatial variation in wader
community structure in relation to environmental variables at a macro-spatial scale (estuarine
morphology, climatic conditions and anthropogenic activities); and whether the magnitude
and direction of annual changes in deviations of observed from expected FD relate to changes
in climatic conditions or other environmental factors.
Methods We use national survey data (Wetland Bird Survey, WeBS) from the winters of
1980/81 to 2006/07 for 20 species to calculate annual values of the observed FD and expected
FD in wader communities across 83 estuaries around the coast of Britain. We investigate how
deviations of observed from expected FD for 44 communities relate to estuary morphology
(estuary depth, tidal range and fetch), weather (minimum winter temperature and mean
precipitation), shell-fishing activities (presence/absence), habitat structure (richness and
heterogeneity) and location (latitude and longitude). We also investigate how the direction
and magnitude of annual change in community functional diversity relates to estuary
morphology, shell-fishing activities, weather and geographic location.
Results The model which best described the variation in deviations of observed from expected
FD included longitude, fetch, tidal range, winter minimum temperature, estuary depth, and
presence of shell-fishing activities, and these factors jointly explained 56% of the variation in
observed minus expected FD. Communities tend to be more functionally similar than expected
by chance further east and in estuaries with large tidal range and high fetch, and with shell-
fishing activities. Conversely, communities tended to be more functionally diverse than
expected by chance in warmer and deeper estuaries. Trends for wader communities to
become more similar over time were detected on estuaries with greater depth and fetch (i.e.
sandier), whereas communities in shallower estuaries with small fetch (i.e. muddier) have
become more functionally diverse.
Chapter four: Variations in functional diversity along environmental gradients
95
Main conclusions This study provides insights into how the mechanisms structuring wintering
wader communities in Britain change along different estuarine and climatic gradients, by
relaxing or increasing the effects of environmental filtering and competition, resulting in
communities varying in functional diversity along those gradients. While we expected that
increases in winter temperatures would relax environmental filtering effects, we did not find
any association between the annual rate of change in observed minus expected FD and
proportional changes and variability in climatic conditions. Instead, we found a modest but
nevertheless significant negative relationship between the annual rate of change and both
fetch and estuary depth.
Keywords community structure, competition, environmental filtering, environmental gradient,
functional diversity, waders

Chapter four: Variations in functional diversity along environmental gradients
96
Introduction
Over recent decades, there has been a growing interest in understanding ecological
communities, and the mechanisms that determine species richness, as well as the identities
and the abundances of species that can co-occur in the same location (e.g. Hutchinson, 1961;
MacArthur, 1972). However, the relative importance of environmental factors, biological
interactions, and random processes in determining the assembly and maintenance of
ecological communities are still not fully understood (Leibold et al., 2004; McGill, 2010;
Pavoine & Bonsall, 2011; Münkemüller et al., 2012). In order to facilitate investigations into
the role of species traits in community assembly and structure, a number of recent studies
have developed and applied measures of trait dispersion, known as functional diversity (FD)
metrics (e.g. Petchey & Gaston, 2002; Mason et al., 2005; Cornwell et al., 2006; Mouillot et al.,
2007; Petchey et al., 2007; Algar et al., 2011; de Bello, 2012). Such studies have predominately
focused on measuring differences between observed FD and FD expected under a null model
(i.e. trait distribution expected by chance) as a means of providing evidence for or against the
operation of non-neutral processes (Ricklefs & Travis, 1980; Mouillot et al., 2007; Petchey et
al., 2007; Thompson et al., 2010; de Bello, 2012). Thus, environmental factors, acting as filters,
should constrain specific traits to be present in the community (Cornwell et al., 2006), leading
to a lower FD than expected by chance. Alternatively, biotic interactions are expected to result
in competitive exclusion among species with similar traits, limiting the similarity amongst
coexisting species, hence leading to a greater FD than expected by chance (e.g. Holdaway &
Sparrow, 2006; Petchey et al., 2007; Thompson et al., 2010).
Across the relatively few studies that have investigated how FD varies along environmental
gradients (de Bello 2006; Mayfield et al., 2006; Flynn et al., 2009; Gerisch et al., 2011),
contrasting patterns have been found within and between systems. This might result from the
variation in the relationship between FD and environmental variables as different mechanisms
are thought to support the coexistence of functionally similar and distinct species along
environmental gradients (de Bello 2006; Mayfield et al., 2010). Given current rates of
environmental change and biodiversity loss, and the importance of functional trait diversity to
ecosystem functions and services (Díaz & Cabido, 2001; Grime 2001; Hooper et al., 2005;
Petchey & Gaston, 2006; Díaz et al., 2007; Suding et al., 2008), it is necessary to understand
the variation in the mechanisms that facilitate or constrain the coexistence of species along
environmental gradients, in order to inform conservation strategies aimed at maintaining
biological diversity and to monitor community responses to environmental change.
During the non-breeding season, migratory wader species (Charadrii) extensively use wetland
habitats, which are recognised as being amongst the most productive ecosystems (Costanza et
Chapter four: Variations in functional diversity along environmental gradients
97
al., 1997) but also amongst the most vulnerable (CBD, 2012). The United Kingdom attracts a
large number of wintering wader species due to its geographical position along one of the
major flyways for Arctic and subarctic breeding species (the East Atlantic flyway), its relatively
mild climate during winter (van de Kam et al., 2004), and its extensive areas of wetlands and
associated estuarine systems. However, as with estuarine environments elsewhere, British
intertidal habitat has been and continues to be under high anthropogenic pressure. Habitat
loss resulting from land claim (Davidson et al., 1991), alteration of the physical structure or
shape of the estuary, which determine both the quality and quantity of habitat available for
waterbirds (Austin & Rehfisch 2003), developments within and near estuaries (Burton et al.,
2002), and alteration of the invertebrate community due to shell-fishing activities (Frid et al.,
2000) are amongst the most common impacts in estuarine systems. The consequent
vulnerability of both habitats and species has provided the impetus for national-scale
monitoring of wader populations, allowing the assessment of population trends, the
importance of individual sites for these populations (Holt et al., 2011) and, more recently, the
assessment of community composition, structure and functional diversity (Hill et al., 1993;
Atkinson et al., 2010; Mendez et al., 2012).
The functional diversity and structure of wintering wader communities varies geographically
across British estuaries (chapter 1). Although overall wader communities across UK tend to be
more functionally similar than expected by chance, there is a regional variation in how
communities assemble (Figure 1a). Wader communities in the south and southwest regions
tend to be more functionally diverse than expected by chance, suggesting that species
interactions may have a relatively strong influence in structuring the communities, whereas in
the east and northwest, communities are less functionally diverse than expected, suggesting
environmental filtering to be the strongest process structuring communities (Figure 1a). In the
present study, we first investigate the influence of estuarine environmental conditions across
sites on the distribution of wader functional traits, in order to facilitate interpretation about
the overall community functional diversity and the environment, using RLQ analysis. Estuarine
conditions also vary regionally, with the eastern estuaries tending to be muddier and typically
experiencing colder and drier winter conditions than the rest of the country. We therefore go
on to explore the spatial variation of community structure in relation to environmental
variables, using estimates of the difference between observed and expected FD extracted from
chapter 1 and environmental variables that also vary at these spatial scales. We also
investigate whether or not shell-fishing may influence the functional diversity of wader
communities. The presence of shell-fishing indicates a richness of mussels and cockles, prey
items that are particularly favoured by some species (e.g. knot and oystercatcher), which may
influence the wader community structure as may increase or decrease the functional traits
Chapter four: Variations in functional diversity along environmental gradients
98
present in the community. Furthermore, if the fishery is poorly regulated and there is
overfishing, the FD of wader communities may be higher than expected by chance due to an
increasing in competitive interactions for the limited resource.
Additionally, changes in both observed FD and in the difference between observed and
expected FD have taken place over the last 30 years, with wader communities becoming less
similar than expected through time, suggesting that levels of species interactions may have
become stronger through time and/or that environmental filtering has become weaker
(chapter 1). There have also been changes in environmental conditions over the same time.
For instance, eastern estuaries are becoming generally warmer during winter, where winter
minimum temperatures have increased over 2oC. Changes in climatic conditions could relax
environmental filters, allowing an influx of more functionally diverse species into the
community, or replacement of functionally redundant species within the community, resulting
in increases of functional diversity. However, the magnitude and direction of changes in FD are
not equal amongst communities and, contrary to community structure, there is no clear
regional pattern in variation in the rate of change in FD (Figure 1b). Thus, other factors may be
also influencing the magnitude and direction of changes in community structure, such as
reduction of habitat and resource availability, which could increase the strength of competitive
interactions and exclude the most functionally similar species, resulting in increases in
functional diversity. Using estimates of the rate of change of the difference between observed
FD and expected FD extracted from chapter 1, we explore the temporal variation in
community structure in relation to environmental conditions and shell-fishing activities.

Chapter four: Variations in functional diversity along environmental gradients
99
Figure 1: Regional variation in (a) observed FD – expected FD (intercept estimates of the linear
mixed model reported in chapter 1), where negative values suggest stronger influence of
environmental filtering and positive values suggest stronger influence of species interactions
structuring communities; and (b) the rate of change in observed FD – expected FD (slope
estimates of the linear mixed model reported in chapter 1), where positive values indicates
communities becoming less similar throughout time and negative values indicates
communities becoming more similar throughout time. The map displays the estuaries grouped
within each region.
Methods
Wader functional diversity
We restricted our analysis to the same 20 wintering species included in chapter 1, which were
selected based on their high winter dependency on estuaries and inter-tidal invertebrates. All
selected species are waders with the exception of shelduck (Tadorna tadorna), which was
included in this and previous community analyses as it has similar feeding ecology to waders
and is also highly dependent on estuaries (e.g. Clark & Prys-Jones, 1994) (hereafter, waders
refer to all the species in this study). Spotted redshank and whimbrel were also included
although they are relatively scarce wintering species in the UK, with populations found only at
a few sites. The majority of individuals of both species winter in Africa and a small proportion
remain on some British estuaries during winter.
Chapter four: Variations in functional diversity along environmental gradients
100
We used estimated values of deviations of observed from expected functional diversity
extracted from chapter 1 to explore causes of geographic and temporal variation in wader
community composition and structure. Deviations of observed from expected FD were
calculated as (observed FD-expected FD)/standard deviation of expected FD (standardised
effect size, SES; Gotelli & McCabe, 2002) for each wader community on each site each year. In
order to calculate community FD, first a species by trait matrix was created. Seven trait types
related to resource use were used, including morphological, behavioural and ecological traits
(chapter 1, Table 2). Then, the entire species by trait matrix for all 20 species was converted
into a distance matrix and this was then clustered to produce the functional dendrogram that
describes the functional relationships between species (Petchey & Gaston, 2002, 2006). Gower
distance was used throughout because it can deal with data-sets comprising continuous,
ordinal and categorical traits (Gower, 1971; Pavoine et al., 2009). UPGMA clustering was used
because it produced a dendrogram with the highest cophenetic correlation (c = 0.7). The
regional FD (i.e. the FD for a community with all 20 species) was measured as the total branch
length of the dendrogram and was used to standardize all measures of FD to vary between 0
and 1, where 0 occurs for single species communities and 1 for communities including all 20
species. Using presence/absence data on community composition (site x species matrix), the
observed FD was measured as the sum of the branch lengths connecting all the species
present in a given community. Expected functional diversity is calculated from the regional
species pool (20 species), assembling random communities with the same number of species
as the real community and the probability of inclusion weighted by the relative abundance.
In chapter 1, SES (deviation of observed from expected FD) was modelled as a function of year
and estuary, with estuary as a random effect allowing each estuary to have a different rate of
change through time. The statistical model was conducted using the lmer function of the lme4
package (Bates et al., 2011) in R 2.12.2 (R Development Core Team, 2011). Here, we used the
same model and extracted the intercept and slope estimates for each wader community using
the coef function from the same package. SES intercept estimates coincided with the middle
point of the time period of this study (year 1993/94) and we used them to understand the
causes of geographical variation in wader functional diversity and community structure. Slope
estimates were used to understand variation in the annual rates of changes across wader
communities (magnitude and direction of change). Positive slopes indicate that species within
a community are becoming less similar/more dissimilar through time. In contrast, negative
slopes indicate that species within a community are becoming more similar/less dissimilar
through time.

Chapter four: Variations in functional diversity along environmental gradients
101
Estuary morphology and habitat data
We used information from 44 estuarine sites in England and Wales for which a comprehensive
estuary morphology dataset is available. Burton et al. (2010) derived a range of morphological
variables for these estuaries, following the previous work of Austin et al. (1996) and Rehfisch
et al. (2000), using GIS shape-files of each estuary, defined by mean high and low water levels
and corresponding with the estuary definitions used by WeBS. These included maximum and
mean measurements of the area, length and width of the estuary, intertidal zone and estuary
channels, and estuary depth (calculated as mean low tide channel width / mean estuary width).
However, many of these variables were highly correlated (p < 0.001). To minimise the risk of
collinearity between variables in the multivariate analysis, we used a subset of these variables
for which the significance of their correlation with each other was p > 0.05. We included
estuary depth, which was not strongly correlated with any other morphological variable
(Burton et al., 2010). We extracted the mean spring tidal range (the height difference between
low tide and high tide) of each estuary from the JNCC Inventory of UK Estuaries for southern,
south- west, north-east, and north–west Britain (Buck, 1993a, 1993b, 1997a, 1997b).
We used the mean “fetch” of the estuary from Burton et al. (2010). Fetch reflects turbidity and
the strength of wave action in the estuary: the higher the fetch value, the more turbid the
water within the estuary becomes, influencing the deposition of sediments and consequently,
the availability of invertebrate prey (Austin et al., 1996; Yates et al., 1996). Thus, fetch is a
good indicator of the sediments present within the estuary (high and low fetch are related to
sandier and muddier sites, respectively). Fetch estimates were derived from GIS shape-files of
estuary boundaries using the average distance perpendicular from the centre line of the
intertidal area (i.e. the area encompassed between mean high and low water levels) on one
side of the estuary to the centre line of the intertidal area on the opposite shore (adapted
from Austin et al., 1996; Burton et al., 2010). Unfortunately, Scottish sites could not be
included in the analysis because fetch values for those sites could not be calculated in the
same way as for English and Welsh sites. This relates to the Ordnance Survey data and a
different definition of high and low tide marks in Scotland to England and Wales: mean
high/low water mark in England and Wales and mean high/low water spring tide mark in
Scotland. Although the fetch and other estuary shape variables can be calculated for Scottish
sites, they would not be comparable with English and Welsh sites due to these differences in
measurements (Burton, pers. comm.).

Chapter four: Variations in functional diversity along environmental gradients
102
Habitat data from Corine Land Cover Map 2000 of the UK (LCM2000, Fuller et al., 2002) were
overlaid with the shapefile of defined UK estuaries used by WeBS in order to extract habitat
types and their areas within each estuary using ESRI ArcMap 10. LCM habitat classes were
grouped by habitat types used by wader species as follows: littoral sediment (mud, sand,
sand/mud with algae); supra-littoral sediment (shingle and dunes); rock; saltmarsh (grazed and
ungrazed); and grasslands. We calculated habitat richness, as the total number of habitat types
within the estuary, and habitat heterogeneity, as the diversity of habitat types taking into
account habitat richness and habitat type area, using the Shannon-Wiener Index (Krebs, 1999;
Oliver et al., 2010).
Shell-fishery data
To assess whether shellfish harvesting activities are carried out in the estuary or not, we
overlaid the UK estuaries boundary map with a map of bivalve mollusc harvesting area
classification zones around England and Wales (GIS shape-file downloaded from
www.magic.gov.uk) using ESRI ArcMap 10. There were 14 non-harvested estuaries and 30
harvested estuaries.
Climate data
We used 5-km resolution monthly data sets from 1980/81 to 2006/07 obtained from the
British Met Office (www.metoffice.gov.uk) of the mean daily minimum temperature (monthly
average of the daily lowest air temperature from 09:00 - 09:00, oC) and total precipitation
(total precipitation amount during the month, mm). We overlaid these climate data with the
UK estuaries boundary map and computed the area-weighted average monthly minimum
temperature and precipitation for each of the 44 estuary sites. Then, we used data from
November to February, the same winter months from which wintering communities are
defined, to calculate winter weather indices. Minimum winter temperature was calculated as
the lowest minimum temperature recorded during a given winter and was used as a proxy for
winter severity. Other winter severity indices can provide a better fit in predicting wader
survival and density (e.g. the number of consecutive days below freezing or snow cover
ground), however, it should be noted that FD was calculated using presence/absence data, and
thus, we believe that using the lowest minimum temperature recorded throughout the winter
is a good proxy for winter severity in this analysis. Mean winter precipitation was calculated
for each of the winter periods represented in the time series (1980/81-2006/07).
To understand the causes of variation in functional diversity and community structure, we
calculated a five-year mean for each of the climate variables from winter 91/92 to 95/96, the
central period in the overall time series considered. Using this mean rather than the values for
Chapter four: Variations in functional diversity along environmental gradients
103
the winter 93/94 (when SES intercepts are estimated) allows possible climatic differences
between sequential winters at particular sites to be accounted for. To understand the
differences amongst rates of change in deviations of observed from expected FD, we
estimated the proportional change in minimum temperature and precipitation, calculated as
the difference in climatic conditions between the end (five-year mean between winters
2001/02- 2005/06) and the beginning of the time period (five-year mean between winters
1980/81- 1984/85) divided by the climatic conditions at the end of the time period; and the
variability (standard deviation) in climatic conditions across the whole time series for each
estuary.
Data analysis
In order to explore the environmental drivers of functional diversity, we first investigated the
association between functional traits and environmental conditions using RLQ analysis
(Dolédec et al., 1996). This approach allows the simultaneous ordination of three matrices (R-
mode: site by environmental variables matrix, which contains the environmental characteristics
at each site; Q-mode: site by species matrix, which contains the occurrence of species at each
site; and L-link: species by trait matrix, which contains the functional traits of each species), in
order to analyse relationships between species’ traits and environment conditions, while
accounting for species occurrence at sites (for detailed information see Dolédec et al., 1996).
The analysis was carried using the ade4 package (Dray & Dufour, 2007) in R 2.12.0 (R Core
development team, 2011). First, individual ordination analyses were performed for each
matrix: a correspondence analysis using the function dudi.coa for the site x species matrix; and
a principal components analysis (PCA) for the other matrices using the function dudi.hillsmith,
that allows mixing quantitative and categorical variables. Then, these ordinations were
combined to perform the RLQ analysis using the rlq function. To test the significance of the
relationship between traits and environment, we performed a Monte-Carlo permutation test
with 1000 repetitions using randtest.rlq function.
We investigated deviations of observed from expected FD (SES) using multiple regression
analysis to model SES intercept estimates for each estuary as a function of estuary morphology
(estuary depth, tidal range and fetch), weather (minimum winter temperature and mean
precipitation), presence/absence of shell-fishing activities, habitat (richness and
heterogeneity), latitude and longitude. We specified an offset variable, intertidal area, to
control for the area effect (i.e. larger estuaries can hold greater wader diversity, chapter 1). All
morphological variables were log10 transformed prior to the analysis. We used a full model
averaging approach to select the best combination of predictors, using the AICcmodavg
package (Mazerolle, 2010). Models with delta AIC <6 were included for the calculation of the

Chapter four: Variations in functional diversity along environmental gradients
104
parameter estimates. Prior to the multivariate analysis, we checked for collinearity amongst
predictors in the model; as all correlation coefficients were < 0.6, all variables were included.
We also compared the explanatory power of the predictors and measured the relative
importance of each of the predictors in the model using calc.relimp function within the
relaimpo library (Grömping, 2006) in R 2.12.0 (R Core development team, 2011). Two methods
were used to assess the relative importance of each of the predictors: (i) comparison of the
amount of variance each predictor alone is able to explain (R2 values from regression models
with one predictor, method=first), and (ii) the R2 contribution averaged over orderings among
predictors (method= lmg).
We investigated the variation in the direction and magnitude of change in community
functional diversity using SES slope estimates. We used multiple regression analysis, where SES
slopes were modelled as a function of estuary morphology (estuary depth, tidal range, fetch),
presence/absence of shell-fishing activities, weather (proportional change and standard
deviation of both minimum temperature and mean precipitation), latitude and longitude, and
intertidal area as a covariate. We followed the same steps as above described for model
selection.
We assessed the extent to which spatial autocorrelation might influence all of our statistical
models by plotting the residuals of the best-fit model using the Moran’s I correlog function in
the R package ncf (Bjornstad, 2009).
Results
Relationships between environmental conditions and functional traits
The first two axes of the RLQ accounted for 41% and 27%, respectively, of the total variance in
the matrix that related the functional traits and environmental variables. The permutation test
demonstrated a significant relationship between the environmental conditions and the species
functional traits (P = 0.0009, Monte Carlo permutation test). The relationships between
species functional traits and environmental conditions are shown in Figure 2, which provides a
visual representation of where a given set of traits tends to occur. For instance, species with an
up-curved bill, feeding on crustaceans by sweeping the bill through the upper surface of the
mud or water (scything) tend to occur at estuaries at lower latitude and longitude, where the
minimum winter temperature and precipitation are both high (warmer and wetter estuaries).
Harvested and deeper estuaries tend to be dominated by species with a down-curved bill that
probe or jab, are able to swim while feeding, and feed on worms. However, this does not
necessarily mean that each species has to display all these traits, rather that those sites are

Chapter four: Variations in functional diversity along environmental gradients
105
characterized by the presence of those traits states, which could be displayed by more than
one species.
Figure 2. Relationship between environmental conditions and species functional traits along
the first two RLQ axes, which explain 41% and 27% of the variation in wader functional traits
on 44 UK estuaries. Arrows indicate environmental gradients. Traits are defined in chapter 1,
Table 2.
Factors that determine variation in deviations of observed FD from expected FD (SES intercept)
Of all the variables analysed, longitude, fetch, tidal range, estuary depth, winter minimum
temperature and whether or not shell-fishing activities take place within the estuary, provided
the best-fit model and jointly explained 56% of the variation in SES intercepts (Table 1, Figure
3). SES intercept values tended to decrease with increasing longitude, fetch and tidal range
(Table 2). Thus, communities tended to be more functionally similar than expected by chance
further east and in estuaries with large tidal range and high fetch. On the other hand, SES
values tended to be higher for estuaries with warmer minimum winter temperature and
Non-harvested
Longitude
Latitude
Tidal range
Fetch Intertidal area
Harvested
Min Temperature
Precipitation
Depth

Chapter four: Variations in functional diversity along environmental gradients
106
higher depth (i.e. communities were more functionally diverse than expected by chance).
When the presence of shell-fishing was included in the multiple regression model, its influence
in SES values was negative (Table 2). However, this effect was reversed when none of the
other variables were included, where SES estimate values for harvested estuaries are higher
than for the non-harvested (harvested = -0.03, p = 0.7; non-harvested = -0.2, p = 0.2). Thus,
estuaries that are harvested tended to hold wader communities that are more functionally
dissimilar than expected by chance. However, this difference was not statistically significant (F
value=0.7, p=0.4).
Tidal range, longitude and winter minimum temperature were the most important variables in
the model and their combination contributed 90% of the variance explained by the full model
(R2), using either of the methods to calculate the predictor’s relative importance (Figure 4).
Longitude, however, was one of the variables that was correlated with tidal range (r=-0.42,
df=42, p=0.003) and winter minimum temperature (r=-0.57, df=42, p<0.0001). Thus, eastern
estuaries tend to have smaller tidal ranges and also tend to be colder.
Figure 3: Variation in deviations of observed FD from expected FD (SES intercept) of wader
communities and environmental variables on 44 UK estuaries. Fitted lines represent single
linear predictor models for longitude (R2 = 0.1, 42 df, p = 0.03), fetch (R2 = 0.06, 42 df, p = 0.1),
tidal range (R2 = 0.15, 42 df, p = 0.009), estuary depth (R2 = 0.01, 42 df, p = 0.4) and minimum
winter temperature (R2 = 0.26, 42 df, p = 0.0003). Shellfish harvested, 0 or 1 (absence [n=14]

Chapter four: Variations in functional diversity along environmental gradients
107
and presence [n=30], respectively, of shellfish harvesting activities within estuary) (F=0.7,
p=0.4).
Table 1: AIC values, Delta AIC, AIC weights, the cumulative AIC for each model where SES
intercept was the response variable. Only models with Delta AIC < 6 are included in the table.
Parameters included in the model AIC Delta AIC
AIC Wt
Cum Wt
Fetch + Tidal range+ Depth + min Temp + Harvested + Long 69.32 0.00 0.29 0.29 Fetch + Tidal range+ Depth + min Temp + Long 69.74 0.42 0.24 0.53 Fetch + Tidal range+ min Temp + Long 69.82 0.50 0.23 0.76 Fetch + Tidal range+ Depth + min Temp + Harvested + Habitat Heterogeneity + Long
70.74 1.42 0.14 0.90
Fetch + Tidal range+ Depth + min Temp + Harvested + Habitat Heterogeneity + Habitat richness + Long
72.33 3.01 0.06 0.90
Fetch + Tidal range+ Depth + min Temp + Precipitation + Harvested + Habitat Heterogeneity + Habitat richness + Long
74.12 4.80 0.03 0.99
Table 2: Estimate values for the combination of predictors that best explain the variation in
SES intercept. Model-average estimates and unconditional standard errors (as opposed to the
conditional SE based on a single model) were obtained from the models in Table 1.
Model-averaged estimate Unconditional SE
Tidal range (log10) -2.22 0.52
Fetch (log10) -1.19 0.19
Estuary depth (log10) 0.40 0.28
Minimum temperature 0.20 0.12
Shellfish harvested -0.25 0.18
Longitude -0.16 0.05
Spatial autocorrelation was found to be absent from residuals of the best-fit models (Moran’s I
associated p-values > 0.05) for any lag-distance class within our data, with the exception of the

Chapter four: Variations in functional diversity along environmental gradients
108
second lag-distance (approx. 125km) where the Moran’s I correlation is negative (-0.25) with a
p<0.05 (Figure 5). However, the combination of spatial autocorrelation, being present only at
the second lag-distance rather than at the more indicative, shortest lag-distance class, was
interpreted as somewhat anomalous and non-problematic, and no further consideration was
taken of it. Moreover, negative spatial autocorrelation is not readily addressed (Griffith, 2006).
Figure 4: The relative importance of environmental predictors in determining the SES-Intercept
(± 95% bootstrap confidence intervals). Relative importance is measured using the LMG
method (left) the First method (right). In both cases, metrics are normalised so that their sum
equals 100%.

Chapter four: Variations in functional diversity along environmental gradients
109
Figure 5. Moran’s I correlogram for the residuals of the best model explaining the geographical
variation of SES intercepts across wader communities. Significant spatial autocorrelation is
indicated with filled circles.
Variation in the rate of change of deviations of observed FD from expected FD (SES slope)
The amount of variation in the direction and magnitude of changes in SES explained by the
combination of fetch and estuary depth was rather modest but nevertheless significant (R2 =
0.13, p = 0.02) (Figure 6). Both variables had negative estimates (Table 3), indicating that
wader communities found in estuaries with greater fetch and depth have become more similar
through time or little change was observed, whereas communities in shallower estuaries with
small fetch have become more functionally diverse than expected by chance.
Spatial autocorrelation was found to be absent from residuals of the best-fit models for slope
of SES (Moran’s I associated p-values > 0.005) for any lag-distance class within our data.
Table 3. Estimate values for the combination of predictors that best explain the variation in
SES Slope. Model-average estimates and unconditional standard errors were obtained from
the models with Delta AIC < 6.
Model-averaged estimate Unconditional SE
Fetch (log10) -0.01 0.01
Estuary depth (log10) -0.02 0.01

Chapter four: Variations in functional diversity along environmental gradients
110
Figure 6. Variation in the rate of change of deviations of observed FD from expected FD (SES
slope) in relation to estuarine morphological variables. Fitted lines represent single predictor
models for (i) fetch (R2 = 0.1, 42 df, p = 0.03) and (ii) estuary depth (R2 = 0.1, 42 df, p = 0.02).
Discussion
Relationship between functional traits and environmental conditions
The RLQ analysis revealed a significant relationship between wader functional traits and
environmental variables. The variation in functional traits is associated with a combination of
estuarine morphological, climatic and anthropogenic variables (shell-fishing), suggesting that
environmental conditions in estuaries influence the range of functional trait states
represented within wader communities. However, even though environmental conditions vary
across estuaries and may be associated with the presence of specific traits, there is no
distinctive segregation of trait states along these environmental gradients, as the close
proximity of the functional traits to the centre of the RLQ plot (Figure 2) indicates that a similar
range of trait states tend to occur in a large number of estuaries. This is almost certainly due to
the fact that the majority of the analysed species are widely distributed in the UK. Exceptions
to this include avocet, black-tailed godwit, greenshank, ruff, spotted redshank and whimbrel,
all of which have distributions that are more restricted to southern and western estuaries. In
this study, these estuaries represent a disproportionate component of the total number of
estuaries included in the analysis, making these species over-represented in our data set.
Therefore it is possible that the segregation in functional traits along environmental gradients

Chapter four: Variations in functional diversity along environmental gradients
111
might be clearer if a larger number of coastal sites across the UK, and particularly Scotland,
had been included. However, the number of estuarine communities included here is sufficient
to show that the distribution of functional traits (i.e. functional diversity) is not uniform across
communities (Mendez et al., 2012), with some communities being under-dispersed (species
are more similar than expected by chance) and others being over-dispersed (species are less
similar than expected by chance), possibly as a result of a stronger relative influence of
environmental filtering and species interactions, respectively.
Geographic variation in community structure
Depending on how environmental variables affect the processes structuring wader
communities, different functional trait distributions will result. Tidal range and minimum
winter temperature turned out to be the factors that accounted for the largest proportion of
the variance in the difference between observed and expected FD (i.e. SES intercept), followed
by longitude and fetch (Figure 4). Although estuary depth and the presence/absence of shell-
fisheries activities within the estuary improve the fit of the model, they explain very little of
the variance in SES (Figure 3) and when they are removed from the model, the relative
goodness of fit (AIC) changes only slightly (Table 1). Two models are considered to have the
same weight in the data when the difference between their AIC is less than two (Burnham &
Anderson, 2004). Thus, we will discuss the most important variables explaining the variance in
community structure. However, it is worth mentioning that there was a tendency, albeit weak,
for wader communities to be more similar when shell-fishing occurs in the estuary. Overfishing
might increase the similarity by filtering out species that feed on bivalves and shifting towards
communities dominated by worm-feeding species (Atkinson et al., 2010). Estuaries with
shellfisheries are more likely to be dominated by worm feeders (Figure 2), which may increase
the similarity amongst coexisting species. However, if shellfisheries are well regulated, they
may have weaker effects on community structure than the overfished estuaries, resulting in a
weak overall tendency for these communities to be more similar than expected by chance.
Tidal range, the vertical difference between low and high tide, varies greatly along the British
coast (range from 1.4 metres to 12.3 metres). Twice a day, intertidal areas are exposed by the
receding tide, and the period of exposure is determined by tidal levels (Wanink & Zwarts,
1993; and references therein). Generally, estuaries with greater tidal range can have their
intertidal area exposed for longer periods of time, providing more foraging time to wader
species. The foraging time available for waders will also depend on the interaction between
tidal range and the distribution of invertebrates, as many invertebrate species are common at
the mid-tide level and thus are available to waders for limited periods of time within each tidal
cycle (Evans 1976). The decline in the difference between observed and expected FD with

Chapter four: Variations in functional diversity along environmental gradients
112
increasing tidal range (Table 2, Figure 3) could therefore reflect a relaxation of the effects of
competition on estuaries with larger tidal ranges and greater foraging time. This is supported
by the fact that decreases in the difference between observed and expected FD along this
gradient are normally accompanied by an increase in species number (negative relationship
between SES and species richness; Figure 4, chapter 1) suggesting more of an increase in
species packing due to a relaxation of competition, rather than an increase in environmental
filtering, which would occur if species numbers decreased along the gradient.
Conversely, winter minimum temperature has a positive effect on the difference between
observed and expected FD (Table 2), with overdispersed communities associated with warmer
sites, whereas underdispersed communities are associated with colder sites. In addition to
direct effects on the survival of waders, severe weather conditions can have indirect effects by
decreasing the availability of their invertebrate prey. Many intertidal invertebrates move or
burrow deeper into the sediment in cold conditions, becoming inaccessible for short-billed
waders (Evans, 1976). There is a tendency for long-billed waders to occur more frequently in
estuaries where winter temperature and precipitation are higher (Figure 2). Furthermore,
deep living invertebrates, such as Arenicola marina - a common wader prey species - become
less active and come to the surface less frequently at low temperatures, hence are less
accessible to birds (Evans, 1976). Thus, low temperature seems to strengthen environmental
filtering effects, favouring a limited range of trait states and reducing the spread of ecological
strategies, whereas higher temperatures seem to widen the filter, allowing more varied trait
states to be present in communities. Although estuaries in the south-west are generally
warmer than on the east coast, due to differences in estuarine morphology and tidal influence,
east coast estuaries are also generally muddier than those on the west coast. Under the
limiting similarity principle (MacArthur & Levins, 1967), we would expect an increase in
competition between species that are more similar in exploiting the available resource when
the latter becomes limiting. Consequently, the negative effect of fetch (greater fetch, indicates
greater turbidity associated with sandier sediments) on the difference between observed and
expected FD may indicate an increase in competition effects on sandier estuaries, if
invertebrate population here are more limited in abundance and availability. Invertebrate
abundance and availability to foraging waders is influenced by sediment particle size
(Quammen 1982; Yates et al., 1993; Rehfisch 1994), and is generally relatively higher in
estuaries that have muddy sediments (Austin & Rehfisch, 2003). Thus, despite south-western
warmer temperatures potentially relaxing environmental filters and allowing more trait states
to be present, sediment type may limit the similarity amongst those trait states.

Chapter four: Variations in functional diversity along environmental gradients
113
Despite the variance explained by climatic and physical conditions of the estuary, longitude
still accounted for a large amount of the variance in the difference between observed and
expected FD (Figure 4). This might be due to other factors that happen to be correlated with
longitude and have not been accounted for. However, longitude was previously shown to be
significantly associated with the composition and functional diversity of wader communities
(Hill et al., 1993; Rehfisch et al., 1997; Mendez et al., 2012), with the latter decreasing when
moving from west to east. Longitude could be acting as a proxy for proximity to species
migratory routes and position within wintering distributional ranges. As discussed above,
wader distribution can be influenced by food availability and climate. However, species
breeding to the northwest of the UK are also more likely to winter on western estuaries,
whereas those breeding to the northeast of the UK may occur more on eastern estuaries
(Wernham et al., 2002). As the UK also represents the edge of the wintering ranges of a
number of species (e.g. avocet), their distribution among estuaries may be more restricted
than for other species (e.g. oystercatcher) for which the UK represents the centre of their
wintering ranges. Longitude may therefore represent both an ecological gradient of local
environmental differences that influence wader communities among estuaries (e.g.
temperature) and a spatial gradient of dispersal/migratory limitation.
Variation in the rate of change of community structure
Overall, over the last 30 years, wader communities on British estuaries have become
functionally more dissimilar than expected by chance, suggesting that the levels of niche
partitioning may have become stronger through time and/or environmental filtering has
become weaker (Mendez et al., 2012). However, not all communities are changing at the same
rate, and some are even losing functional diversity (Figure 1). Given the effect of temperature
on community structure (discussed above), increases in winter temperatures might be
expected to relax or widen environmental filtering effects. Thus, estuaries experiencing the
greatest climatic changes may also experience the greatest changes in community structure.
However, we did not find any association between the annual rate of change in observed
minus expected FD and proportional changes or variability in climatic conditions. Instead, we
found a modest but nevertheless significant negative relationship between the annual rate of
change of SES and both fetch and estuary depth, with negative changes in SES being associated
with estuaries with greater depth and more turbid waters. This may imply that environmental
filters have become stronger and/or competition has become weaker in structuring
communities at sandier sites, whereas the reverse may occur in muddy estuaries. Some
species that favour sandy estuaries (e.g. bar-tailed godwit and knot) are undergoing shifts in
their distribution across north-west Europe (Maclean et al., 2008). Thus, if the abundance and

Chapter four: Variations in functional diversity along environmental gradients
114
presence of such species are decreasing at sandier sites, then the competitive interactions (for
the less abundant resource in sandy sediments) may also be reduced. At the same time,
expanding species such as avocet and black-tailed godwit, may be favouring muddy estuaries
and contributing to intensifying competitive interactions between coexisting species.
Furthermore, changes in wave action, currents and tide may influence the type of intertidal
sediment (Yates et al., 1996), leading to either more sand or more mud which will in turn
affect the abundance and distribution of invertebrates. As a consequence of these estuarine
morphological and physical changes, the influence of environmental filters on community
structure may become stronger or weaker if sediment becomes sandier or muddier,
respectively.
Ecosystems worldwide are being altered by human activities. Hence, we need to assess the
relative importance of abiotic and biotic processes for community structure, and how these
might be affected by environmental change, in order to understand the processes by which
communities are sustained. The present study investigates differences between observed and
expected FD increasing our understanding of changes in wader community structure along
different environmental gradients and pointing to likely processes driving changes in the
relative strength of the mechanisms by which communities are assembled. We highlight the
need to understand the potential importance of functional traits for specific ecosystem
functions, as waders are among the top predators in estuarine systems. Changes in the
processes structuring communities can lead to changes in the distribution of functional trait
states and hence, changes in estuarine ecological functions.

Chapter four: Variations in functional diversity along environmental gradients
115
References
Algar, A.C., Kerr, J.T. & Currie, D.J. (2011) Quantifying the importance of regional and local
filters for community trait structure in tropical and temperate zones. Ecology, 92, 903–
14.
Atkinson, P.W., Maclean, I.M.D. & Clark, N.A. (2010) Impacts of shellfisheries and nutrient
inputs on waterbird communities in the Wash, England. Journal of Applied Ecology, 47,
191–199.
Austin, G. & Rehfisch, M. (2003) The likely impact of sea level rise on waders (Charadrii)
wintering on estuaries. Journal for Nature Conservation, 58, 43–58.
Austin, G. & Rehfisch, M. (2005) Shifting nonbreeding distributions of migratory fauna in
relation to climatic change. Global Change Biology, 11, 31–38.
Austin, G., Rehfisch, M.M., Holloway, S.J., Clark, N.A., Balmer, D.E., Yates, M.G., Clarke, R.T.,
Swetnam, R.D., Eastwood, J.A., le V dit Durell, S.E.A., West, J.R. & Goss-Custard, J.D.
(1996) Estuaries, sediments and shorebirds III: Predicting waterfowl densities on
intertidal areas. BTO Research Report No. 160, ETSUT/04/00207/REP.
Bates, D., Maechler, M. & Bolker, B. (2011) lme4: Linear mixed-effects models using S4 classes.
R package version 0.999375-39. http://CRAN.R-project.org/package=lme4.
Bjornstad, O.N. (2009) ncf: spatial nonparametric covariance functions. R package version 1.1-
3.
Buck, A.L. (1993a) An Inventory of UK Estuaries. Volume 2. South-west Britain. Joint Nature
Conservation Committee, Peterborough.
Buck, A.L. (1993b) An Inventory of UK Estuaries. Volume 3. North-west Britain. Joint Nature
Conservation Committee, Peterborough.
Buck, A.L. (1997a) An Inventory of UK Estuaries. Volume 5. Eastern England. Joint Nature
Conservation Committee, Peterborough.
Buck, A.L. (1997b) An Inventory of UK Estuaries. Volume 6. Southern England. Joint Nature
Conservation Committee, Peterborough.
Burnham, K.P. & Anderson, D.R. (2004) Multimodel Inference. Sociological Methods Research,
33, 261–304.

Chapter four: Variations in functional diversity along environmental gradients
116
Burton, N.H.K., Armitage, M.J.S., Musgrove, A.J. & Rehfisch, M.M. (2002) Impacts of man-made
landscape features on numbers of estuarine waterbirds at low tide. Environmental
Management, 30, 857-864.
Burton, N.H.K., Cook, A., Thaxter, C., Austin, G. & Clark, N. (2010) Severn Tidal Power - SEA
Topic Paper: Waterbirds. Report to the Department of Energy and Climate Change.
Available at
http://www.decc.gov.uk/assets/decc/what%20we%20do/uk%20energy%20supply/en
ergy%20mix/renewable%20energy/severn-tp/861-stp-review-waterbirds-habitat.pdf
CBD (2012) Convention on Biological diversity. Available at http://www.cbd.int (accessed 22
August 2012).
Clark, N.A. & Prys-Jones, R.P. (1994) Low tide distribution of wintering waders and shelduck on
the Severn Estuary in relation to the proposed tidal barrage. Biological Journal of the
Linnean Society, 51, 199–217.
Cornwell, W.K., Schwilk, L.D.W. & Ackerly, D.D. (2006) A trait-based test for habitat filtering:
convex hull volume. Ecology, 87, 1465–1471.
Costanza, R., d’Arge, R., de Groot, R., Farberk, S., Grasso, M., Hannon, B., Limburg, K., Naeem,
S., O’Neill, R.V., Paruelo, J., Raskin, R.G., Suttonkk, P. & van den Belt, M. (1997) The value
of the world’s ecosystem services and natural capital. Nature, 387, 253-260.
Davidson, N.C., Laffoley, D. d’A., Doody, J.P., Way, L.S., Gordon, J., Key, R., Pienkowski, M.W.,
Mitchell, R. & Duff, K.L. (1991) Nature Conservation and Estuaries in Great Britain.
Nature Conservancy Council, Peterborough, UK.
de Bello, F.D. (2006) Variations in species and functional plant diversity along climatic and
grazing gradients. Ecography, 6, 801–810.
de Bello, F.D. (2012) The quest for trait convergence and divergence in community assembly:
are null-models the magic wand? Global Ecology and Biogeography, 21, 312–317.
Díaz, S. & Cabido, M. (2001) Vive la difference: plant functional diversity matters to ecosystem
processes. Trends in Ecology & Evolution, 16, 646–655.
Chapter four: Variations in functional diversity along environmental gradients
117
Díaz, S., Lavorel, S., De Bello, F., Quétier, F., Grigulis, K. & Robson, T. M. (2007) Incorporating
plant functional diversity effects in ecosystem service assessments. Proceedings of the
National Academy of Sciences of the United States of America, 104, 20684–20689.
Dolédec, S., Chessel, D., Braak, C.J.F. & Champely, S. (1996) Matching species traits to
environmental variables: a new three-table ordination method. Environmental and
Ecological Statistics, 3, 143–166.
Dray, S., Dufour, A.B. & Chessel, D. (2007) The ade4 package-II: Two-table and K-table methods.
R News, 7, 47-52.
Evans, P. (1976) Energy balance and optimal foraging strategies in shorebirds: some
implications for their distributions and movements in the non-breeding season. Ardea,
64, 117–139.
Flynn, D.F.B., Gogol-Prokurat, M., Nogeire, T., Molinari, N., Richers, B.T., Lin, B.B., Simpson, N.,
Mayfield, M.M. & DeClerck, F. (2009) Loss of functional diversity under land use
intensification across multiple taxa. Ecology letters, 12, 22–33.
Frid, C.L.J., Harwood, K.G., Hall, S.J. & Hall, J.A. (2000) Long-term changes in the benthic
communities on North Sea fishing grounds. ICES Journal of Marine Science, 57, 1303–
1309.
Fuller, R.M., Smith, G.M., Sanderson, J.M., Hill, R.A., Cox, R., Brown, N.J. & Gerard, F.F. (2002)
Countryside Survey 2000 Module 7: Land Cover Map 2000. Report to Department for
Transport, Environment and the Regions Centre for Ecology and Hydrology, Huntingdon,
UK.
Gerisch, M., Agostinelli, V., Henle, K. & Dziock, F. (2011) More species, but all do the same:
contrasting effects of flood disturbance on ground beetle functional and species
diversity. Oikos, 121, 508–515.
Gotelli, N.J. & McCabe, D.J. (2002) Species Co-Occurrence: a Meta-Analysis of J. M. Diamond’S
Assembly Rules Model. Ecology, 83, 2091–2096.
Gower, J. (1971) A general coefficient of similarity and some of its properties. Biometrics, 27,
857–871.
Griffith, D.A. (2006) Hidden negative spatial autocorrelation. Journal of Geographic Systems, 8,
335–355.

Chapter four: Variations in functional diversity along environmental gradients
118
Grime, J.P. (2001) Plant strategies, vegetation processes, and ecosystem properties. John Wiley
and Sons, Chichester, UK.
Grömping, U. (2006) Relative Importance for Linear Regression in R: The Package relaimpo.
Journal of Statistical Software, 17, 1-27.
Hill, D., Rushton, S., Clark, N. & Green, P. (1993) Shorebird communities on British estuaries:
factors affecting community composition. Journal of applied, 30, 220-234.
Holdaway, R.J. & Sparrow, A.D. (2006) Assembly rules operating along a primary riverbed-
grassland successional sequence. Journal of Ecology, 94, 1092–1102.
Holt, C.A., Austin, G.E., Calbrade, N.A., Mellan, H.J., Mitchell, C., Stroud, D.A., Wotton, S.R. &
Musgrove, A.J. (2011) Waterbirds in the UK 2009/10: The Wetland Bird Survey.
BTO/RSPB/JNCC, Thetford.
Hooper, D.U., Chapin, F.S., Ewel, J.J., Hector, A., Inchausti, P., Lavorel, S., Lawton, J.H., Lodge,
D.M., Loreau, M., Naeem, S., Setälä, H., Symstad, A.J., Vandermeer, J. & Wardle, D.A.
(2005). Effects of biodiversity on ecosystem functioning: A consensus of current
knowledge. Ecological Monographs, 75, 3–35.
Hutchinson, G.E. (1980) The Paradox of the Plankton. The American Naturalist, 95, 137–145.
Krebs, J.R. (1999) Species diversity measures. In: Ecological Methodology. eds. Krebs, J.R.,
Addison Wesley, Longman, CA, pp. 410–455.
Leibold, M.A., Holyoak, M., Mouquet, N., Amarasekare, P., Chase, J.M., Hoopes, M.F., Holt,
R.D., Shurin, J.B., Law, R., Tilman, D., Loreau, M. & Gonzalez, A. (2004) The
metacommunity concept: a framework for multi-scale community ecology. Ecology
Letters, 7, 601–613.
MacArthur, R.H. & Levins, R. (1967) Limiting similarity convergence and divergence of
coexisting species. The American Naturalist, 101, 377-385.
MacArthur, R.H. (1972) Geographical ecology: patterns in the distribution of species. Harper
and Row, New York.
Maclean, I.M.D., Austin, G.E., Rehfisch, M.M., Blew, J., Crowe, O., Delany, S., Devos, K.,
Deceuninck, B., Günther, K., Laursen, K., van Roomen, M. & Wahl, J. (2008) Climate

Chapter four: Variations in functional diversity along environmental gradients
119
change causes rapid changes in the distribution and site abundance of birds in winter.
Global Change Biology, 14, 2489-2500.
Mason, N., Mouillot, D., Lee, W. & Wilson, J. (2005) Functional richness, functional evenness
and functional divergence: the primary components of functional diversity. Oikos, 111,
112–118.
Mayfield, M.M., Ackerly, D. & Daily, G.C. (2006) The diversity and conservation of plant
reproductive and dispersal functional traits in human-dominated tropical landscapes.
Journal of Ecology, 94, 522–536.
Mayfield, M.M., Bonser, S.P., Morgan, J.W., Aubin, I., McNamara, S. & Vesk, P. A. (2010) What
does species richness tell us about functional trait diversity? Predictions and evidence for
responses of species and functional trait diversity to land-use change. Global Ecology and
Biogeography, 19, 423–431.
Mazerolle, M.J. (2010) AICcmodavg: Model selection and multimodel inference based on
(Q)AIC(c). R package version 1.13. http://CRAN.R-project.org/package=AICcmodavg.
McGill, B.J. (2010) Towards a unification of unified theories of biodiversity. Ecology Letters, 13,
627–642.
Mendez, V., Gill, J.A., Burton, N.H.K., Austin, G.E., Petchey, O.L. & Davies, R.G. (2012)
Functional diversity across space and time: trends in wader communities on British
estuaries. Diversity and Distributions, 18, 356–365.
Mouillot, D., Dumay, O. & Tomasini, J. A. (2007) Limiting similarity, niche filtering and
functional diversity in coastal lagoon fish communities. Estuarine, Coastal and Shelf
Science, 71, 443–456.
Münkemüller, T., de Bello, F., Meynard, C.N., Gravel, D., Lavergne, S., Mouillot, D., Mouquet,
N. & Thuiller, W. (2012) From diversity indices to community assembly processes: a test
with simulated data. Ecography, 35, 468-480.
Oliver, T., Roy, D.B., Hill, J.K., Brereton, T. & Thomas, C.D. (2010) Heterogeneous landscapes
promote population stability. Ecology letters, 13, 473–84.
Pavoine, S. & Bonsall, M.B. (2011) Measuring biodiversity to explain community assembly: a
unified approach. Biological reviews of the Cambridge Philosophical Society, 86, 792–812.

Chapter four: Variations in functional diversity along environmental gradients
120
Pavoine, S., Vallet, J., Dufour, A.B., Gachet, S. & Daniel, H. (2009) On the challenge of treating
various types of variables: application for improving the measurement of functional
diversity. Oikos, 118, 391–402.
Petchey, O.L., Evans, K.L., Fishburn, I.S. & Gaston, K.J. (2007) Low functional diversity and no
redundancy in British avian assemblages. The Journal of animal ecology, 76, 977–85.
Petchey, O.L. & Gaston, K.J. (2002) Extinction and the loss of functional diversity. Proceedings
of the Royal Society B Biological Sciences, 269, 1721–1727.
Petchey, O.L. & Gaston, K.J. (2006) Functional diversity: back to basics and looking forward.
Ecology letters, 9, 741–58.
Quammen, M.L. (1982) Influence of subtle substrate differences on feeding by shorebirds on
intertidal mudflats, 71, 339–343.
R Development Core Team (2011) R: A language and environment for statistical computing. R
Foundation for Statistical Computing, Vienna, Austria. ISBN 3-900051-07-0, URL
http://www.R-project.org/Stroud, D.A., Chambers, D., Cook, S., Buxton, N., Fraser, B.,
Clement, P., Lewis, P., McLean, I., Baker, H. & Whitehead, S. (eds) (2001). The UK SPA
network: its scope and content. JNCC, Peterborough.
Rehfisch, M. (1994) Man-made lagoons and how their attractiveness to waders might be
increased by manipulating the biomass of an insect benthos. Journal of Applied Ecology,
31, 383–401
Rehfisch, M.M., Austin, G.E., Clark, N.A., Clarke R.T., Holloway, S.J., Yates, M.G., Durrel, S.E.A.
le V. dit, Eastwood, J.A., Goss-Custard, J.D., Swetnam, R.D. & West, J.R. (2000) Predicting
densities of wintering Redshank Tringa totanus from estuary characteristics: a method
for assessing the likely impact of habitat change. Acta Ornithologica, 35, 25-32.
Rehfisch, M., Holloway, S., Yates, M. & Clarke, R. (1997) Predicting the effect of habitat change
on waterfowl communities: a novel empirical approach. In: Goss-Custard, J.D., Rufino, R.,
Luis, A., (eds) Effect of habitat loss and change on waterbirds. London, The Stationery
Office, 116-126, 144pp. (ITE Symposium, 30).
Ricklefs, R. & Travis, J. (1980) A morphological approach to the study of avian community
organization. The Auk, 97, 321–338.

Chapter four: Variations in functional diversity along environmental gradients
121
Suding, K.N., Lavorel, S., Chapin, F.S., Cornelissen, J.H.C., Díaz, S., Garnier, E., Goldberg, D.,
Hooper, D.U., Jackson, S.T. & Navas M.-L. (2008) Scaling environmental change through
the community-level: a trait-based response-and-effect framework for plants. Global
Change Biology, 14, 1125–1140.
Thompson, K., Petchey, O.L., Askew, A.P., Dunnett, N.P., Beckerman, A.P. & Willis, A.J. (2010)
Little evidence for limiting similarity in a long-term study of a roadside plant community.
Journal of Ecology, 98, 480–487.
Van de Kam, J., Ens, B., Piersma, T. & Zwarts, L. (2004) Shorebirds: an illustrated behavioural
ecology. KNNV Publishers, Utrecht, The Netherlands.
Wanink, J. & Zwarts, L. (1993) Environmental effects on the growth rate of intertidal
invertebrates and some implications for foraging waders. Netherlands journal of sea
research, 31, 407–418.
Wernham, C.V., Toms M.P., Marchant, J.H., Clark, J.A., Siriwardena, G.M. & Baillie, S.R. (eds).
(2002) The Migration Atlas: movements of the birds of Britain and Ireland. T. & A.D.
Poyser, London.
Yates, M.G., Goss-Custard, J.D., McGrorty, S., Lakhani, K.H., Durell, S.E.A.L.V.D., Clarke, R.T.,
Rispin, W.E., Moy, I., Yates, T., Plant, R.A. & Frost, A.J. (1993) Sediment Characteristics,
Invertebrate Densities and Shorebird Densities on the Inner Banks of the Wash. Journal of
Applied Ecology, 30, 599–614.
Yates, M.G., Clarke, R.T., Swetnam, R.D., Eastwood,J.A., Duren, S.E.A. le V. dit, West, J.R., Goss-
Custard, J.D., Clark, NA., Holloway, SJ. & Rehfisch, M.M. (1996) Estuary, sediments and
shorebirds I. Determinants of the intertidal sediments of estuaries. (Natural
Environment Research Council contract report to the Energy Technology Support Unit.)
Huntingdon: Institute of Terrestrial Ecology.

122
Chapter 5

Chapter five: Wader foraging distribution and co-occurrence patterns
123
Co-occurrence patterns of wintering wader species foraging in the intertidal area of British
estuaries
Abstract
Aim Many migratory wader species use estuarine wetlands during the non-breeding season
and these habitats face increasing anthropogenic pressures. Wader species throughout the
world are currently facing population declines, which raises concerns about the management
and conservation of the estuarine systems upon which they depend. In order to improve
management and design targeted conservation strategies, it is necessary to understand the
distribution of birds within estuaries, both within and between species. Here, we apply a co-
occurrence index and null model analysis to investigate co-occurrence patterns of wintering
wader species that feed in the intertidal area of different estuaries across Great Britain, and
assess whether species co-occurrence is associated with functional similarity or dissimilarity in
order to identify the processes driving species co-existence.
Methods We use low tide counts (WeBS Low Tide Counts) for 17 wintering wader species from
eight estuaries across Great Britain to examine patterns of spatial distribution within and
between species. We test for (1) evidence of non-random patterns of co-occurrence and (2)
relationship between species’ co-occurrence and species’ functional differences.
Results Locally abundant species tend to be widespread across the intertidal area of estuaries,
whereas rare species tend to be narrowly distributed. However, distribution patterns were
significantly non-random for only a few species on specific estuaries. On five of the eight
estuaries, non-random patterns of species co-occurrence were detected and there is a
tendency, though statistically non-significant, for functionally dissimilar species to segregate
within estuaries more than functionally similar species, which tend to aggregate.
Main conclusions The distribution of species abundances within estuaries varies within and
between species, suggesting that the distribution of species abundances is influenced by the
operation of local-scale processes. Furthermore, this study suggests that species co-occurrence
patterns were likely to be driven by species’ habitat affinities, because there was a tendency of
functionally similar species to aggregate. We discuss the potential drivers underlying these
patterns and the importance of identifying these drivers for the better management of
estuarine systems.
Keywords functional dissimilarity, species co-occurrence, species distribution, waders

Chapter five: Wader foraging distribution and co-occurrence patterns
124
Introduction
Understanding the processes underlying the co-existence of species and hence contributing to
the maintenance of levels of diversity of natural communities is a major research topic for
ecologists and conservationists. Recent advances in null model analysis have provided a means
of detecting the presence of non-random patterns of species co-occurrence. This is achieved
by comparing observed data with a null reference distribution constructed by reshuffling
sample data in a random procedure, in order to test whether observed patterns differ
significantly from null expectations (Gotelli, 2000). For example, recent meta-analyses carried
out on a large number of communities from different taxa and using different null models
demonstrated that non-random patterns are common across the majority of taxa studied and
indicated that species co-occurrence was often lower than expected by chance, suggesting
that species within natural communities were often segregated (Gotelli & McCabe, 2002;
Ulrich & Gotelli, 2010). However, the demonstration of non-random patterns in species co-
occurrence does not explicitly establish the mechanisms by which such patterns have emerged
(Connor & Simberloff, 1979; Stone & Roberts, 1992; Gotelli, 2000), and it is likely that these
might result from a number of alternative processes operating singly or in combination.
Non-random patterns of species co-occurrence can result from interspecific competition for
limited resources (Diamond, 1975), from environmental differences across habitats, where
species that are not adapted to specific environmental condition cannot occur (i.e.
environmental filtering, Zobel, 1997; Peres-Neto, 2004), from stochastic processes (Ulrich 2004)
or from differences in habitat histories (e.g. historical contingency or differences in
disturbance histories within sites) (Badano et al., 2005). These processes are not mutually
exclusive and might operate simultaneously (Mouillot et al., 2007; de Bello et al., 2006). For
example, low water availability, a stressful environmental condition, will select in favour of
drought resistant species, but it may also cause an intensification of competitive interactions
between drought resistant species with similar water acquiring traits, as a result of limiting
resources. Furthermore, the relative importance of the processes structuring communities
may vary along environmental gradients (Callaway & Walker, 1997; de Bello et al., 2006;
Maltez-Mouroa et al., 2010) and with spatial scale, with communities being assembled
through the influence of a combination of mechanisms, some operating at large spatial scales
and others at finer scales (Anderson et al., 1981; Gotelli & Ellison, 2002; Sanders et al., 2007).
Therefore, understanding the mechanisms by which natural communities are assembled, and
their relative importance in community structure, is currently a matter of great debate in
community ecology and is likely to inform management interventions for the maintenance of
biodiversity under current pressures of global environmental change.

Chapter five: Wader foraging distribution and co-occurrence patterns
125
Patterns of species co-existence are normally assessed using species-based (spatial dispersion)
or trait-based (trait dispersion) approaches to determine whether species aggregate or
segregate spatially or whether species traits converge (traits are more similar) or diverge
(traits are more different) relative to null expectations. Species-based approaches use co-
occurrence indices, which are single metrics that summarise the co-occurrence pattern in a
presence-absence matrix (Gotelli, 2000), with the most commonly used indices being the
‘Checker’ index (Diamond, 1975) and the C-Score (Stone & Roberts, 1990). All co-occurrence
indices identify levels of species’ spatial segregation, which is often attributed to competition
effects or habitat variability (e.g. Diamond, 1975, Sanders et al., 2007), or aggregation of
species, which is attributed to habitat variability and, in some cases, to species facilitation
(Callaway & Walker, 1997; Dullinger et al., 2007). However, these indices lack information
about species ecology and, as indicated by Diamond (1975), the coexistence of organisms with
differing traits or differing trait values can be among the key factors influencing co-existence of
species within communities. Trait-based approaches incorporate this information in terms of
functional traits, and focus on the similarity/dissimilarity of functional traits within
communities. Trait dispersion indices, known as functional diversity indices, detect trait
divergence and convergence (e.g. Petchey & Gaston, 2002; Mason et al., 2005; Cornwell et al.,
2006; Mouillot et al., 2007; Petchey et al., 2007; Algar et al., 2011; de Bello, 2012). Trait
divergence is often attributed to limiting similarity, where species within communities have
different/complementary functional traits, which allow them to exploit different parts of the
resource spectrum and hence, reduce competition amongst species (Petchey & Gaston, 2002).
Conversely, trait convergence is attributed to environmental filtering, where species within
communities share similar functional traits since they experience a common set of
environmental pressures or stresses (Cornwell et al., 2006). Despite species and trait-based
approaches sharing a common goal, it remains unknown whether a relationship between
spatial aggregation/segregation and trait convergence/divergence exists.
In this study, we apply a co-occurrence index and null model analysis to investigate co-
occurrence patterns of wintering wader species foraging in the intertidal areas of different
estuaries across Great Britain, and assess whether species co-occurrence is associated with
functional similarity or dissimilarity. Migratory wader species (Charadrii) mostly use estuarine
wetlands during the non-breeding season and these habitats face increasing anthropogenic
pressures (e.g. land claim, disturbance and sea level rise; Sutherland et al., 2012). Many wader
species are currently facing declines in their global population (Stroud et al., 2006), which
raises concerns about the management and conservation of the estuarine systems upon which
they depend. In order to improve management and design targeted conservation
interventions, it is necessary to understand the distribution of birds within estuaries, both

Chapter five: Wader foraging distribution and co-occurrence patterns
126
within species (as the individuals of some species might disperse across all available intertidal
area whereas those of others may cluster in particular areas) and between species (since co-
existing species might segregate or aggregate within estuaries). This information can also help
in identifying important intertidal foraging areas for waders and key factors determining
foraging site selection when species distribution patterns are associated with environmental
factors.
Here, we use low tide counts (WeBS Low Tide Counts) for 17 wintering wader species from
eight estuaries across Great Britain to examine patterns of spatial distribution within and
between species. We examine whether co-occurrence patterns differ from null expectations
and whether these differ across sites. We then examine the relationship between species
pairwise co-occurrence patterns with pairwise functional differences and test whether (1) co-
occurring species tend to be more functionally dissimilar (dashed line, Figure 1), due to
competition effects; (2) co-occurring species tend to be more functionally similar (solid line,
Figure 1), due to environmental filtering; or (3) co-occurrence patterns are not related to the
ecology (traits) of the species (dotted line, Figure 1), due to random processes.
Figure 1. Possible relationships between species co-occurrence and functional diversity. Solid
line indicates a negative relationship suggesting that co-occurring species tend to be more
functionally similar. Dashed line indicates a positive relationship, suggesting that co-occurring
species tend to be more functionally diverse. Dotted line indicates no relationship, arising from
random processes of species assembly.
Functional diversity
Co
-occ
urr
ence

Chapter five: Wader foraging distribution and co-occurrence patterns
127
Methods
Study sites and species selection
The study was carried out using survey data from eight estuaries across England and Wales
(Figure 2). These estuaries were selected because they have good coverage of Low Tide Counts
(see section below). They are representative of other estuaries across Britain in relation to the
abundance of wintering wader species, as they can hold both internationally and nationally
important wintering populations of species listed in Table 1. Each estuary is divided into sectors
of the intertidal habitat within estuaries, each of which can be counted by a single person in a
reasonable amount of time during a low tide period.
Figure 2. Distribution of the eight estuaries selected for this study, encompassing the coastal
areas of Britain and Wales.
Seventeen wintering species of waterbirds were selected because of their high winter
dependency on estuaries which are very dynamic systems and prone to environmental and
anthropogenic change (Davidson et al., 1991). All species are waders with the exception of
shelduck Tadorna tadorna which (as elsewhere, e.g. Clark & Prŷs-Jones, 1994; Mendez et al.,

Chapter five: Wader foraging distribution and co-occurrence patterns
128
2012) is included here as it is highly dependent on estuaries as feeding areas during winter,
and has a similar feeding ecology to waders being particularly reliant on intertidal invertebrate
prey.
WeBS Low Tide Counts
The WeBS Low Tide Counts (LTC) scheme is designed to survey the distribution of feeding
waterbirds over the intertidal area of a given estuary in order to assess the relative importance
of feeding areas for wintering populations (Holt et al., 2011). This scheme has taken place
throughout the majority of the UK estuaries since the winter 1992/93. Due to the fact that
many of the LTC are carried out by the same volunteers that participate in the Core Counts
(another surveying scheme run by WeBS), WeBS LTC aim to cover most of the UK estuaries
once every six years, but more frequent counts are made for several sites. On all sites, co-
ordinated monthly counts of waterbirds are made from November to February on pre-
established sectors of the intertidal area, in the period two hours either side of low tide (Holt
et al., 2011). Count accuracy is provided by the counter, assessing the count as complete (‘OK’)
or incomplete (‘LOW’). Detailed information on the survey type, methodology and count
accuracy are provided in Holt et al., (2011).
Species traits
Waders display a remarkably high level of behavioural and morphological variation, particularly
with regards to their feeding apparatus and feeding ecology (Burton, 1974). This results in
variation in the types of prey that are exploited. Seven trait types were chosen to capture this
key aspect of variation among waders that directly relates to their capacity to exploit food
resources (Table 2, chapter 1). Similar combinations of traits have already been used in other
studies of avian functional diversity (e.g. Petchey et al., 2007, Mendez et al., 2012). Trait values
were obtained from the BTO data base (BTO, 2012) and from The Birds of the Western
Palaearctic on interactive DVD-ROM (2006), using information for populations that occur in UK
whenever possible. Mean trait values for species were used for continuous traits, while diet
components, foraging methods and traits involved in prey location were divided into
independent binary traits, as these are not mutually exclusive (Petchey et al., 2007). A species
by trait matrix for all 17 species was generated.
Assessing species’ distribution within estuaries
We used WeBS LTC from the winter 2005/06 for all the estuaries, with the exception of Burry
Inlet and Carmarthen Bay, for which data from 2005/06 were unavailable and data from
2006/07 were used instead. Sectors with no species recorded were not included in the analysis.

Chapter five: Wader foraging distribution and co-occurrence patterns
129
We calculated the mean number of individuals of each species present for each estuary sector
over the winter, from November to February. As the number of sectors varies across sites, the
local occupancy of each species within each estuary was calculated as the proportion of
sectors occupied, thus the number of sectors where the species was present divided by the
total number of sectors. For each species, the local abundance within estuaries was calculated
as the sum of the abundances across sectors. We used generalised linear mixed models with
binomial error distribution and logit link function to model the variation in occupancy using the
lmer function of the lme4 package (Bates et al., 2011) in R (2.12.2, R Development Core Team,
2011). Occupancy was modelled as a function of local abundance, species and the interaction
between local abundance and species, fitted as fixed effects, and site fitted as a categorical
random effect to account for possible variation introduced by each estuary. Local abundance
was log-transformed prior to the analysis. The significance of the random structure was
assessed using log-likelihood, and the significance of the fixed structure was assessed by
comparing models applying maximum likelihood.
Table 1. The 17 species of wintering waterbirds included in the study
Code Common name Scientific name
av Avocet Recurvirostra avosetta
ba Bar-tailed godwit Limosa laponica
bw Black-tailed godwit Limosa limosa
cu Curlew Numenius arquata
dn Dunlin Calidris alpina
dr Spotted redshank Tringa erythropus
gk Greenshank Tringa nebularia
gp Golden plover Pluvialis apricaria
gv Grey plover Pluvialis squatarola
kn Knot Calidris canutus
l_ Lapwing Vanellus vanellus
oc Oystercatcher Haematopus ostralegus
rk Redshank Tringa totanus
rp Ringed plover Charadrius hiaticula
ss Sanderling Calidris alba
su Shelduck Tadorna tadorna
tt Turnstone Arenaria interpres

Chapter five: Wader foraging distribution and co-occurrence patterns
130
To examine the spatial variation in local abundances and examine how species distribute
within the intertidal area (whether species segregate, aggregate or their distribution is random
within the estuary), we used the global Moran’s I test, within the ape library (Paradis, Claude &
Strimmer, 2004) in R. Moran’s I tests the statistical significance of the degree of clustering
across a region (spatial autocorrelation). Moran’s I ranges from -1, which indicates dispersion,
to 1 which indicates clustering. However, if Moran’s I is not significant, then the spatial
distribution of abundances within estuaries is random.
Assessing species co-occurrence patterns
Species data were organized as a presence-absence distribution matrix for each estuary, where
rows were estuary sectors and columns were species. A co-occurrence index, the Stone and
Roberts’ (1990) C-score was calculated from the species matrix for each estuary and compared
to a frequency distribution produced by the C-scores of the random matrices to quantify the
degree of species co-occurrence within estuaries. The C-Score is negatively correlated to
species co-occurrence and commonly used as a measure of species segregation. If the C-score
from the original matrix lies within the 95% frequency distribution of the randomized matrices,
there is no evidence for deterministic processes influencing species co-occurrence, whereas if
the index lies outside the 95% confidence limits of randomized matrices, this indicates that
these processes may be operating.
C-score measures the average number of checkerboard units (CU) for all species pair
combinations within the site. CU is any submatrix of the form
Species A Species B Species A Species B
Sector 1 1 0
or
0 1 Sector 1
Sector 2 0 1 1 0 Sector 2
in which one species occurs on sector 1 but not on sector 2, whereas the other is on sector 2
but not on sector 1 (Stone & Roberts, 1990). Thus, when all sector pairs within an estuary are
taken into account, the total CUs for a species pair combination are calculated as the sum of all
CUs formed by these species. For example, considering an estuary with ten sectors and the
following distribution of two species,

Chapter five: Wader foraging distribution and co-occurrence patterns
131
Species A Species B
Sector 1 1 0
Sector 2 0 1
Sector 3 1 0
Sector 4 0 1
Sector 5 1 1
Sector 6 1 0
Sector 7 0 0
Sector 8 1 1
Sector 9 1 0
Sector 10 1 1
the index is calculated by removing the co-occurrences and co-absences (sectors in bold -
which do not contribute to the index), and multiplying together the number of events when a
species is present given the absence of the other. Thus, in the example above we obtain a
score of 4 x 2 = 8 CUs (species A occurs in 4 sectors where species B do not occur, and species
B occurs in 2 sectors where species A do not occur). The C-score for a particular estuary is
defined as the mean number of CUs per species-pair from the community.
As the number of sectors varied across estuaries and since there was a need to compare
results across estuaries, we used the standardised effect size for C-score values (SESC-score),
calculated as (observed C-score – mean of simulated random C-score) / standard deviation of
simulated C-score (for detailed statistical properties of this measure see Gotelli, 2000 and
Gotelli & Rohde, 2002). SESC-score measures the deviation from random expectations that are
centred around a mean of zero. Thus, a negative SESC-score indicates that the observed C-score
is lower than randomised expectations, suggesting that species pairs are co-occurring more
than expected by chance, hence, species tend to aggregate. In contrast, positive SESC-score
indicates segregation of species within the community, i.e. pairs of species tend to co-occur
less than expected by chance.
To detect significant co-occurrence between species’ pairs, we created random communities
for each estuary under different null models that incorporate only the occurrence features
(species richness of sectors and species frequencies in the estuary) of the original species
(presence/absence) distribution matrix. First, we used a ‘fixed-fixed’ null model (hereafter
referred to as FF), where species frequencies (column totals) and species richness across
Chapter five: Wader foraging distribution and co-occurrence patterns
132
sectors (row totals) from the species distribution matrix are maintained constant in the
random communities (Gotelli, 2000), making it suitable for data recorded across heterogenous
environments (Rooney, 2008). However, the differential power for detecting aggregation is
low for FF null models, which tend to reveal segregation patterns (Sfenthourakis et al., 2006;
Azeria et al., 2012). To back-up for comparison of co-occurrence patterns, we also used a
‘fixed-equiprobable’ null model (hereafter referred to as FE), where only species frequencies
from the species matrix are held constant and thus, sectors are considered to be colonized
with equal probability (Gotelli, 2000). Contrary to FF null models, FE null models tend to have
greater differential power for detecting aggregation (Gotelli & Graves, 1996; Azeria et al.,
2012). For each estuary, 1000 random matrices were created for each null model, using the
function permatfull, a wrapper for the commsimulator, in the vegan R- package (Oksanen et al.,
2011).
We calculated SESC-score under these two models to detect significant non-random patterns of
co-occurrence and compare the outcome between null models. The significance for the
observed C-score for each community was tested by comparing the observed C-score of each
estuary with the C-score of the simulated random communities. Statistically significant
patterns are indicated when the observed C-scores lie outside the 95% confidence interval of
the C-scores of the simulated matrices. In addition, to identify the species pairs that
contributed the most to the co-occurrence patterns at each estuary, we calculated the average
of CU for each pairwise combination of species. To explore overall co-occurrence patterns
across estuaries, we calculated the average of CU for each pairwise combination of species for
estuaries that show significant segregation or aggregation patterns, but excluding the species
that were not present in all the estuaries. For instance, if three estuaries showed significant
species aggregation, we calculated the average of CUs for all the pairwise combinations
common across the three estuaries, excluding those pair combinations that were not present
across all of them, to identify which pairwise combinations contributed the most to the overall
segregation pattern.
Associations between species co-occurrence and functional diversity
In order to estimate the functional dissimilarity between species, we performed a principal
coordinate analysis (PCoA), using a Gower distance matrix calculated from the species x trait
matrix and comprising the 17 species. The PCoA positions each species within
multidimensional functional trait space, determined by the combination of functional trait
states of each species. The PCoA was performed using the function pcoa from the R-package
ape (Paradis et al., 2004).

Chapter five: Wader foraging distribution and co-occurrence patterns
133
To assess whether species co-occurrence correlates with functional dissimilarity, we
performed a Mantel test. We used the pairwise matrix that reflects functional dissimilarities
(same as for the PCoA) and the pairwise matrix of co-occurrence. For the latter, we average
the CU of each species pair across estuaries.
Results
Distribution of wader local population within estuaries
Avocet, greenshank and spotted redshank are rare species within our data set, only occurring
at two or three of the eight estuaries. The other species are present in at least 75% of the
estuaries. An average of six species across all the estuaries was recorded (mean ± SD, 6.32 ±
2.18). Stour and Langstone had the highest mean species richness across all the sectors
surveyed (10.02 ± 2.33, 9 ± 1.41, respectively), whereas Burry Inlet, Kingsbridge and
Lindisfarne held on average the lowest number of species across all sectors (3.90 ± 1.99, 4.33 ±
1.93, 4.83 ± 2.65, respectively).
Wintering wader populations feeding on the intertidal area of British estuaries showed
variation in their local occupancies (the proportion of intertidal area occupied) (Figure 3), and
the effect of species’ local abundances on species local occupancy (the proportion of intertidal
area occupied) varied amongst species (the interaction term was Pr(>|Chisq|) = 0.0004 in the
model where occupancy was modelled as a function of abundance, species and the interaction
between local abundance and species, df=35). A positive association between species local
abundance and local occupancy was observed for the majority of species (Figure 3). Thus,
abundant species tend to be widespread across the intertidal area, whereas less abundant
species tend to be present in fewer areas of the estuary. However, for curlew, knot and
shelduck the relationship between local abundance and local occupancy was reversed (Figure
3).

Chapter five: Wader foraging distribution and co-occurrence patterns
134
Figure 3. Relationship between local abundance and local occupancy (proportion of sectors
occupied within estuaries) of 17 wintering wader species in Britain. Each point represents the
local abundance and local occupancy at one estuary. The dashed lines are the generalised
linear mixed model relationships between local occupancy, local abundance and species,
accounting for estuary variation. Species codes are given in Table 1.
Overall, species showed a random distribution within estuaries, but with a tendency for
dispersion of their abundances (Moran’s I < 0, P > 0.1). However, the distribution of species
abundances within the intertidal habitat varied within and between species across estuaries
(Figure 4), with some species showing significant aggregation patterns at certain estuaries
(Table 2), whereas ringed plover at Breydon Water (Moran’s I = -0.063, P = 0.03) and Burry
Inlet (Moran’s I = -0.05, P = 0.02), sanderling at Stour (Moran’s I = -0.013, P = 0.002) and golden
plover at Kingsbridge (Moran’s I = -0.09, P = 0.02) showed significant spatial dispersion at those
sites.

Chapter five: Wader foraging distribution and co-occurrence patterns
135
Table 2. Moran’s I estimates for the distribution of abundances of species that showed an
aggregated spatial distribution of abundances within estuaries. Species codes are given in
Table 1.
Species Estuary Moran's I P-value
bw Stour 0.086 0.001
cu Carmarthen 0.128 0.001
dn Stour 0.046 0.04
dn Breydon 0.064 0.03
dn Carmarthen 0.051 0.02
gk Carmarthen 0.039 0.0003
gp Carmarthen 0.08 0.0001
gv Stour 0.066 0.002
gv Carmarthen 0.09 0.001
kn Stour 0.069 0.007
kn Orwell 0.078 0.02
l_ Burry 0.135 0.003
rk Orwell 0.097 0.01
rk Breydon 0.192 0.005
rk Carmarthen 0.082 0.008
Species co-occurrence patterns
The community level C-scores were variable across estuaries. Under the FE null model, which
consider all sectors as having the same probability of being used by species, significant
aggregation patterns were observed at four estuaries (Table 3). Orwell and Stour presented
the highest levels of aggregation (Table 3). Under the FF null model, where species’ total
abundances within the estuary and richness within sectors are held constant, the SESC-score at
Lindisfarne and Breydon communities indicated a significant segregation pattern (Table 3),
suggesting that species feeding at those sites tend to disperse across the intertidal-area.
Communities at Langstone, Burry Inlet and Carmarthen Bay showed non-significant patterns
under both of the null models (Table 3), suggesting that feeding communities are randomly
distributed.

Chapter five: Wader foraging distribution and co-occurrence patterns
136
Figure 4. Moran’s I estimates for the spatial distribution of species abundances within eight
British estuaries. Negative Moran’s I values indicate dispersed spatial distribution whereas
positive values indicate clustered spatial distribution. Species codes are given in Table 1.
The species pairs that contributed the most to the overall segregation patterns were ringed
plover combined with knot or turnstone, and turnstone combined with golden plover, knot or
shelduck (Table 4). However, when estuaries that showed significant species’ segregation were
analysed separately (Lindisfarne and Breydon), other species pairs that are unique to those
sites had a higher contribution to the community mean C-score, such as ringed plover and
turnstone combined with other species (mean C-Score ± SD, 0.88 ± 0.28, 0.88 ± 0.28,
respectively) at both estuaries, but also combinations of species with avocet (1 ± 0) and
spotted redshank (1 ± 0) in Breydon, and combinations with sanderling (0.80 ± 0.12) in
Lindisfarne. In contrast, combinations of species together with dunlin or bar-tailed godwit
contributed the most to the overall aggregation patterns observed across British estuaries
(Table 4). However, when estuaries are analysed independently, if avocet or black-tailed
godwit were present in the estuary, they contributed the most to the aggregation pattern
when combined with other species (avocet together with any species has a mean C-Score of
0.23 ± 0.34, and black-tailed godwit of 0.24 ± 0.16).

Chapter five: Wader foraging distribution and co-occurrence patterns
137
Table 3. Standarized effect sizes (SES) for C-Scores under two null models, fixed-fixed (FF) and
fixed-equiprobable (FE) for wintering wader communities across eight different estuaries (see
“Methods” for differences in the null-models). Statistically significant patterns are indicated
when the observed C-Score lies within the tails of the distribution outside the 95% limits of the
C-Scores values of the simulated matrices. Significant values are in bold. Positive values
indicate segregated distribution whereas negative values indicate aggregated.
SES C-Score
FF null model FE null model
Lindisfarne (nsectors= 36) 2.604 -4.355
Stour (nsectors= 40) -0.334 -6.340
Orwell (nsectors= 27) 2.613 -11.102
Breydon (nsectors= 14) 4.412 -1.590
Langstone (nsectors= 10) 0.166 -0.452
Kingsbridge (nsectors= 9) -1.116 -3.890
Burry Inlet (nsectors= 21) 1.949 -1.743
Carmarthen(nsectors= 18) -0.596 -2.2413
The position in functional space of the species pairs that contributed the most to the
segregation and aggregation patterns are shown in Figure 5. Although not statistically
significant, there is a weak association between functional diversity and species co-occurrence
(Mantel-statistic r = 0.18, p=0.06). Thus, there is a tendency for functionally dissimilar species
to segregate more than functionally similar species, which tend to aggregate (Figure 5).
Table 4. Species pairs with the highest contribution to the mean C-score values for the co-
occurrence patterns observed across British estuaries. Only species pairs with significant co-
occurrence patterns on more than one estuary are shown. Mean and SD are given for the
combination of all species pairs. Species codes are given in Table 1.
Co-occurrence pattern Species pair C-Score
Segregated rp-kn, rp-tt 0.80 ± 0.002
tt-gp, tt-kn, tt-su, tt-rp 0.73 ± 0.05
Aggregated dn-cu, dn-ba, dn-oc 0.069 ± 0.03
ba-dn, ba-cu, ba- oc 0.061 ± 0.02

Chapter five: Wader foraging distribution and co-occurrence patterns
138
Figure 5. Position of the 17 species of wintering wader in functional (ecomorphological) space
from the Principal Coordinate Analysis (PCoA). Axis 1, axis 2 and axis 3 are displayed. Red lines
represent the position of the species pairs that contribute the most to segregation patterns
and black lines represent the species pairs that contribute the most to aggregation patterns
across estuaries. Species codes are given in Table 1.
Discussion
Distribution of local wader species’ abundances within estuaries
In agreement with the general abundance-occupancy relationship (e.g. Gaston et al., 2000), we
found that the majority of wader species included in this study showed a positive association
between their local abundances and the proportion of intertidal habitat occupied. Thus, locally

Chapter five: Wader foraging distribution and co-occurrence patterns
139
abundant species, such as redshank and oystercatcher, tended to occupy a larger proportion
of the intertidal habitat, whereas rare species, such as avocet and ringed plover, tended to be
narrowly distributed within an estuary. However, shelduck, knot and curlew did not show
positive abundance-occupancy associations. The negative association predicted by the model
for the abundance of knot and its occupancy is likely to be driven by the one estuary where
knot has low abundance and is present in a high proportion of the intertidal area (Figure 3). If
that estuary is not considered, a positive association appears for the other six estuaries.
Curlew and shelduck are amongst the most abundant and widespread species across and
within Britain estuaries (Holt et al., 2011). The lack of a positive association for these species
might be due to lack of suitable sectors (habitat) within some estuaries, reducing the
occupancy at higher local abundances.
Overall, species abundances were distributed randomly within estuaries. Some species,
however, showed significant non-random patterns across different sites. Thus, species
distribute differently within estuaries and the same species might aggregate in one estuary but
randomly distribute in another. The lack of consistency in the spatial distribution of foraging
wintering waders within estuaries suggests that the distribution of abundances is influenced by
the operation of local-scale processes, such as distribution of abundance and quality of
invertebrate prey across estuaries and location and availability of roosting sites. Most wader
species show high levels of prey specialization (Burton, 1974; van de Kam et al., 2004) and,
consequently, their distribution within estuaries will be influenced by the distribution of their
prey, which in turn is influenced by sediment type (Yates et al., 1996). Although we do not
have sediment type or prey data available at the sector level for the estuaries included here, it
is likely that each estuary will have idiosyncratic habitat configurations (i.e. different
combinations of sediment types), influencing the prey distribution and ultimately, wader
distribution. Furthermore, it has been shown that the location of roosting sites is very
important for the distribution of foraging waders, with bird density declining with distance
from their roost (Dias et al., 2006), probably as a result of strategies to minimize the energy
expenditure between foraging and roosting sites (Luís et al., 2001; Rogers, 2003). In addition,
the pattern of use of intertidal areas for some species can result from a trade-off between the
distance from roosting sites and the quality of foraging locations (van Gils et al., 2006) or safe
feeding grounds (Rogers et al., 2006). Thus, if location and availability of roosting grounds for
each species varies across sites, then different distribution of wader species across estuaries
can be expected. One way to test the variation in availability of roost sites across estuaries
may be to explore the sector-level variation in WeBS Core Counts, where birds are counted
while roosting, as estuaries with few roosting locations may have birds clustered in fewer
sectors during high tide roosts.

Chapter five: Wader foraging distribution and co-occurrence patterns
140
Knowledge of how birds distribute within estuaries is of major importance for conservation
planning of estuaries, because, as suggested here, different local processes may influence their
distribution. Moran’s I test has provided an overview of the spatial distribution of waders
within eight British estuaries, but it does not address the question of whether a clustered
abundance is concentrated into one or several parts of the intertidal area or whether
abundance is dispersed evenly or unevenly across the intertidal area. A more spatially explicitly
approach will be needed in order to address which estuarine sector/s are the most intensively
used by species.
Patterns of wader co-occurrence within and across estuaries
Of the eight wader communities examined in this study, five showed significant co-occurrence
patterns. However, the direction of co-occurrence (segregation or aggregation) varied across
sites, with two sites showing significant segregation and four sites showing significant species
aggregation. For one of these sites, Lindisfarne, co-occurrence was significant under both null
models, and showed significant segregation and aggregation of species pairs. It is possible that
C-score, as with other community level indices, may be sensitive to the inclusion of rare
species (e.g. ringed plover), emphasizing different aspects of co-occurrence patterns of the
same distribution matrix under the two null models (e.g. Stone & Roberts, 1992; Azeria et al.,
2009). Further analysis on how rare species may affect the differential power of different null
models for detecting aggregation or segregation patterns would be useful for drawing concise
conclusions on such patterns. We can, however, conclude that non-random patterns of species
co-occurrence can be detected across British estuaries. Overall, species that contribute the
most to segregation patterns were species pairs’ that occupied different parts of the functional
space (Figure 5, red lines). For example, turnstone, one of the species that contributes the
most to the pattern, has a unique foraging technique of using its bill to overturn stones, shells
and other items, allowing exploitation of resources unavailable to other species. In contrast,
species that contribute the most to aggregation patterns were species’ pairs that occupied
similar distribution within the functional space (Figure 5, black lines). For instance, bar-tailed
godwit, one of the species that contributed most to aggregation effects, feeds on all types of
benthic animals, small prey pecked from the surface and larger ones taken from deep in the
sediment. Such generalism is likely to result in species sharing similar functional trait values,
hence positioning them within similar functional space.
Following previous findings on the influence of environmental filtering on wader community
structure (chapter 1), this study suggests that species’ co-occurrence patterns were likely to be
driven by species’ habitat affinities. As discussed, there was a tendency for functionally similar
species to aggregate, whereas functionally dissimilar species tended to segregate within

Chapter five: Wader foraging distribution and co-occurrence patterns
141
estuaries. Several studies have suggested that the aggregation of species can arise due to
species having similar habitat affinities (e.g. Jackson et al., 1992; Peres-Neto et al., 2001;
Azeria et al., 2009), and that habitats and their complexity may change the nature of
interspecific interactions and their influence on co-occurrence patterns (Hughes & Grabowski,
2006; Azeria et al., 2009). By incorporating functional differences among co-occurring species,
our study reinforces these findings because aggregation patterns were associated with species
that are functionally similar being situated closer within their functional space (Figure 5). In
estuarine systems, waders often co-occur across habitats of varying complexity, and the
interaction between sediment type and prey will determine the variation in species
distribution within estuaries and consequently species pairwise co-occurrence (as discussed
above). In addition, other factors have been shown to be highly influential on the distribution
of birds within estuaries. For example, Granadeiro et al. (2007) showed the exposure period,
the mud content of the sediment and the presence of shell banks strongly influenced the
distribution of foraging wader species in the Tagus estuary. These types of habitat attributes
may be causing functionally similar species to spatially aggregate within estuaries, in order to
be able to exploit the resources available under certain environmental conditions. However,
the relationship was statistically non-significant, and we suggest incorporating more species
and estuaries in order to more rigorously test the relationship, since only 17 species and 8
estuaries comprised our data set. Nevertheless, there is a tendency that is in accordance with
the previous findings concerning the importance of environmental filters. Species interactions,
in particular competition, may also be important structuring wader communities. However, is
highly likely to operate at relatively finer spatial scales, for example among individuals foraging
within the same sector.
In summary, species distribute differently within estuaries, with functionally similar species
tending to aggregate within the intertidal area. This pattern varies between estuaries. We
suggest that these patterns are strongly influenced by habitat filtering effects, and that
interspecific interactions may be operating at finer scales (e.g. within the same habitat type).
Combining co-occurrence with functional diversity analysis could contribute to a better
understanding of the mechanisms underpinning the role of environmental and biotic filters in
the assembly of natural communities. Studies like the one presented here provide evidence for
the importance of environmental conditions, in particular habitat characteristics, in influencing
the distribution and co-occurrence of species within estuaries.

Chapter five: Wader foraging distribution and co-occurrence patterns
142
References
Algar, A.C., Kerr, J.T., & Currie, D.J. (2011) Quantifying the importance of regional and local
filters for community trait structure in tropical and temperate zones. Ecology, 92, 903–
14.
Anderson, G.R.V., Ehrlich, A.H. & Ehrlich, P.R. (1981) The community structure of coral reef
fishes. American Naturalist, 177, 476-495.
Azeria, E.T., Fortin, D., Lemaître, J., Janssen, P., Hébert, C., Darveau, M. & Cumming, S.G.
(2009) Fine-scale structure and cross-taxon congruence of bird and beetle assemblages in
an old-growth boreal forest mosaic. Global Ecology and Biogeography, 18, 333-345.
Azeria, E.T., Ibarzabal, J. & Hébert, C. (2012) Effects of habitat characteristics and interspecific
interactions on co-occurrence patterns of saproxylic beetles breding in tree boles after
forest fire: null model analyses. Oecologia, 168, 1123-1135.
Badano, E.I., Regidor, H.A., Núñez, H.A., Acosta, R. & Gianoli, E. (2005) Species richness and
structure of ant communities in a dynamic archipielago: effects of island area and age.
Journal of Biogeography, 32, 221-227.
Bates, D., Maechler, M. & Bolker, B. (2011) lme4: Linear mixed-effects models using S4 classes.
R package version 0.999375-39. http://CRAN.R-project.org/package=lme4.
Birds of the Western Paleartic interactive DVD-ROM (2006) Oxford University Press
British Trust for Ornithology (2012) BirdFacts. Available from http://www.bto.org/about-
birds/birdfacts, accessed on 28/11/2012
Burton, P.J.K. (1974) Feeding and Feeding Apparatus in Waders. British Museum (Natural
History), London.
Callaway, R. & Walker, L. (1997) Competition and facilitation: a synthetic approach to
interactions in plant communities. Ecology, 78, 1958-1965.
Clark, N.A. & Prys-Jones, R.P. (1994) Low tide distribution of wintering waders and Shelduck on
the Severn Estuary in relation to the proposed tidal barrage. Biological Journal of the
Linnean Society, 51, 199–217.

Chapter five: Wader foraging distribution and co-occurrence patterns
143
Connor, E.F. & Simberloff, D. (1979) The assembly of species communities: chance or
competition? Ecology, 60, 1132-1140.
Cornwell, W.K., Schwilk, L.D.W., & Ackerly, D.D. (2006) A trait-based test for habitat filtering:
convex hull volume. Ecology, 87, 1465–1471.
de Bello, F.D. (2012) The quest for trait convergence and divergence in community assembly:
are null-models the magic wand? Global Ecology and Biogeography, 21, 312–317.
de Bello, F.D., Lepš, J. & Sebastià, M.-T. (2006) Variations in species and functional plant
diversity along climatic and grazing gradients. Ecography, 6, 801–810.
Davidson, N.C., Laffoley, D. d’A., Doody, J.P., Way, L.S., Gordon, J., Key, R., Pienkowski, M.W.,
Mitchell, R. & Duff, K.L. (1991). Nature Conservation and Estuaries in Great Britain.
Nature Conservancy Council, Peterborough, UK.
Diamond, J.M. (1975) Assembly of species communities. pp 342-444. In: Ecology and evolution
of communities. (eds. Cody, M.L. & Diamond, J.M.). Harvard University Press, Cambridge.
Dias, M.P., Granadeiro, J.P., Lecoq, M., Santos, C.D. & Palmeirim, J.M. (2006) Distance to high-
tide roosts constrains the use of foraging areas by dunlins: Implications for the
management of estuarine wetlands. Biological Conservation, 131, 446-453.
Dullinger, S., Kleinbauer, I., Pauli, H., Gottfried, M., Brooker, R., Nagy, L., et al. (2007) Weak and
variable relationships between environmental severity and small-scale co-occurrence in
alpine plant communities. Journal of Ecology, 95, 1284–1295.
Gaston, K.J., Blackburn, T.M., Greenwood, J.J.D., Gregory, R.D., Quinn, R.M. & Lawton, J.H.
(2000) Abundance-occupancy relationships. Journal of Applied Ecology, 37, 39-59.
Gotelli, N.J. (2000) Null model analysis of species co-occurrence patterns. Ecology, 81, 2606-
2621.
Gotelli, N.J. & Ellison, A.M. (2002) Assembly rules for New England ant assemblages. Oikos, 99,
594-599.
Gotelli, N.J. & Graves, G.R. (1996) Null models in ecology. Smithsonian Institution, Washington.
Gotelli, N.J. & McCabe, D.J. (2002) Species co-occurrence: a meta-analysis of J.M. Diamond’s
assembly rules model. Ecology, 83, 2091-2096.

Chapter five: Wader foraging distribution and co-occurrence patterns
144
Gotelli, N.J. & Rohde, K. (2002) Co-occurrence of ectoparasites of marine fishes: a null model
analysis. Ecology letters, 5, 86-94.
Granadeiro, J.P., Santos, C.D., Dias, M.P. & Palmeirim, J.M. (2007) Environmental factors drive
habitat partitioning in birds feeding in intertidal flats: implications for conservation.
Hydrobiologia, 587, 291-302.
Holt, C.A., Austin, G.E., Calbrade, N.A., Mellan, H.J., Mitchell, C., Stroud, D.A., Wotton, S.R. &
Musgrove, A.J. (2011) Waterbirds in the UK 2009/10: The Wetland Bird Survey.
BTO/RSPB/JNCC, Thetford.
Hughes, A.R. & Grabowski, J.H. (2006) Habitat context influences predator interference
interactions and the strength of resource partitioning. Oecologia, 149, 256-264.
Jackson, D.A., Somers, K.M. & Harvey, H.H. (1992) Null models and fish communities: evidence
of non-random patterns. The American Naturalist, 139, 930-951.
Luís, A., Goss-Custard, J.D. & Moreira, M.H. (2001) A method for assessing the quality of roosts
used by waders during high tide. Wader Study Group Bulletin, 96, 71-73.
Maltez-Moura, S., Maestre, F.T. & Freitasa, H. (2010) Co-occurrence patterns and abiotic stress
in sand-dune communities: their relationship varies with spatial scale and the stress
estimator. Acta Oecologia, 36, 80-84.
Mason, N.W.H., Mouillot, D., Lee, W.G. & Wilson, J.B. (2005) Functional richness, functional
evenness and functional divergence: the primary components of functional diversity.
Oikos, 111, 112-118.
Mendez, V., Gill, J.A., Burton, N.H.K., Austin, G.E., Petchey, O.L. & Davies, R.G. (2012)
Functional diversity across space and time: trends in wader communities on British
estuaries. Diversity and Distributions, 18, 365-365.
Mouillot, D., Dumay, O. & Tomasini J.A. (2007) Limiting similarity, niche filtering and functional
diversity in coastal lagoon fish communities. Estuarine, Coastal and Shelf Science, 71,
443-456.
Oksanen, J.F., Blanchet, G., Kindt, R., Legendre, P., O'Hara, R.B., Simpson, G.L., Solymos, P.,
Henry, M., Stevens, H. & Wagner, H. (2011) vegan: Community Ecology Package. R
package version 1.17-9. http://CRAN.R-project.org/package=vegan

Chapter five: Wader foraging distribution and co-occurrence patterns
145
Paradis E., Claude J. & Strimmer K. (2004) APE: analyses of phylogenetics and evolution in R
language. Bioinformatics, 20, 289-290.
Peres-Neto, P. (2004) Patterns in the co-occurrence of fish species in streams: the role of site
suitability, morphology and phylogeny versus species interactions. Oecologia, 140, 352-
360.
Peres-Neto, P.R., Olden, J.D. & Jackson, D.A. (2001) Environmentally constrained null models:
site suitability as occupancy criterion. Oikos, 93, 110-120.
Petchey, O.L., Evans, K.L., Fishburn, I.S. & Gaston, K.J. (2007) Low functional diversity and no
redundancy in British avian assemblages. Journal of Animal Ecology, 76, 977-85.
Petchey, O.L. & Gaston, K.J. (2002) Functional diversity (FD), species richness and community
composition. Ecology letters, 5, 402-411.
R Development Core Team (2011). R: A language and environment for statistical computing. R
Foundation for Statistical Computing, Vienna, Austria. ISBN 3-900051-07-0, URL
http://www.R-project.org/.
Rogers, D.I. (2003) High-tide roost choice by coastal waders. Wader Study Group Bulletin, 100,
73-79.
Rogers, D.I., Piersma, T. & Hassel, C.J. (2006) Roost availability may constrain shorebird
distribution: Exploring the energetic costs of roosting and disturbance around a tropical
bay. Biological Conservation, 133, 225-235.
Rooney, T.P. (2008) Comparison of co-occurrence structure of temperate forest herb-layer
communities in 1949 and 2000. Acta Oecologia, 34, 354-360.
Sanders, N.J., Gotelli, N.J., Wittman, S.E., Ratchford, J.S., Ellison, A.M. & Jules, E.S. (2007)
Assembly rules of ground-foraging ant assemblages are contingent on disturbance,
habitat and spatial scale. Journal of Biogeography, 34, 1632-1641.
Sfenthourakis, S., Tzanatos, E. & Giokas, S. (2006) Species co-occurrence: the case of
congeneric species and a causal approach to patterns of species association. Global
Ecology and Biogeography, 15, 39-49.
Stone, L. & Roberts, A. (1990) The checkerboard score and species distributions. Oecologia, 85,
74-79.

Chapter five: Wader foraging distribution and co-occurrence patterns
146
Stone, L. & Roberts, A. (1992) Competitive exclusion, or species aggregation? An aid in
deciding. Oecologia, 91, 419-424.
Stroud, D.A., Baker, A., Blanco, D.E., Davidson, N.C., Delany, S., Ganter, B., Gill, R., González, P.,
Haanstra, L., Morrison, R.I.G., Piersma, T., Scott, D.A., Thorup, O.,West, R.,Wilson, J. &
Zöckler, C. (on behalf of the International Wader Study Group). 2006. The conservation
and population status of the world’s waders at the turn of the millennium. Waterbirds
around the world. Eds. G.C. Boere, C.A. Galbraith & D.A. Stroud. The Stationery Office,
Edinburgh, UK. pp. 643-648.
Sutherland, W.J., Alves, J.A., Amano, T., Chang, C.H., Davidson, N.C., Finlayson, C.M., Gill, J.A.,
Gill Jr, R.E., González, P.M., Gunnarsson, T.G., Kleijn, D., Spray, C.J., Székely, T. &
Thompson, D.B.A. (2012) A horizon scanning assessment of current and potential future
threats to migratory shorebirds. Ibis, 154, 663-679.
Ulrich, W. (2004) Species co-occurrences and neutral models: reassessing J.M. Diamond’s
assembly rules. Oikos, 107, 603-609.
Ulrich, W. & Gotelli, N.J. (2010) Null model analysis of species associations using abundance
data. Ecology, 91, 3384-3397.
van de Kam, J., Ens, B., Piersma, T. & Zwarts, L. (2004) Shorebirds: An illustrated behavioural
ecology. KNNV Publishers, Utrecht.
van Gils, J.A., Piersma, T., Dekinga, A., Spaans, B. & Kraan, C. (2006) Shellfish dredging pushes a
flexible avian top predator out of a Marine Protected Area. PLOS Biology, 4, 2399-2404.
Yates, M.G., Clarke, R.T., Swetnam, R.D., Eastwood,J.A., Duren, S.E.A. le V. dit, West, J.R., Goss-
Custard, J.D., Clark, NA., Holloway, Sj. & Rehfisch, M.M. (1996). Estuary, sediments and
shorebirds I. Determinants of the intertidal sediments of estuaries. (Natural Environment
Research Council contract report to the Energy Technology Support Unit.) Huntingdon:
Institute of Terrestrial Ecology.
Zobel, M. (1997) The relative role of species pools in determining plant species richness: an
alternative explanation of species coexistence? Trends in Ecology and Evolution, 12, 266-
269.

147
Conclusions

Conclusions
148
Conclusions
Migratory waders, and other migratory species, migrate annually between breeding and non-
breeding grounds. Many migratory wader species depend on the intertidal area of estuaries
for feeding during the non-breeding season, using these habitats as wintering area or as stop-
over sites during migration. However, many estuaries around the world are under intense
pressure from human impacts (Sutherland et al., 2012), greatly influencing the composition of
wintering wader communities to the extent that some species are suffering national and global
population declines (Sutherland et al., 2012). Understanding of the mechanisms by which
estuaries sustain wintering wader communities, and the environmental and anthropogenic
influences upon these, can greatly improve the conservation and management of estuarine
systems across the world. This thesis uses national-scale datasets to explore spatial and
temporal variation in the composition and structure of wintering wader communities across
the UK, and presents one of the few large-scale studies of wader communities for this area and
possibly the world. For the first time, morphological, behavioural and ecological characteristics
of wading bird species are used to estimate the functional diversity of wader community, and
to investigate the factors determining wader community composition and the functional
ecological significance of their community structures. The work presented in this thesis
provides evidence that wintering wader community composition and structure is spatially
variable across British estuaries, and that changes in both observed functional diversity (FD)
and in the difference between observed and expected FD (SES-FD) have taken place over the
last three decades (chapter 1).
The variation in observed FD is driven primarily by variation in the number of species present
in the community. Normally, measures of FD that do not account for species abundances (as in
this study) are naturally correlated with species richness (Schleuter et al., 2010). In this study,
wintering wader FD shows a strong correlation with species richness (R2 = 0.9, p < 0.0001),
providing relatively little evidence of functional redundancy among the 20 wader species
included here. Early work on the effects of species richness on FD suggested a linear increase
in FD with species richness (Díaz & Cabido, 2001), indicating that species’ traits are equally
complementary, and hence, contributing equally when species are added into communities
(Petchey & Gaston, 2002). Subsequently, asymptotic and quadratic relationships between
species richness and functional diversity have been described (Mayfield et al., 2005; Mason et
al., 2008; Villéger et al., 2010). The asymptotic relationship can occur when functional diversity
saturates at high levels of species richness due to functional redundancy amongst species. In
contrast, quadratic relationships can arise when the amount of functional space occupied does
not increase proportionally with species richness, because environmental conditions that are

Conclusions
149
conducive for species-rich communities might lead to the presence of many redundant species
due to niche specialization (Mason et al., 2008; Villéger et al., 2010). It is possible that the
levels of species richness represented in this study are too limited to encompass the ranges in
diversity at which asymptotic or quadratic phases of these relationships might be evident. It
would be interesting to increase the species pool to examine whether (1) wader species are
highly complementary at all levels of species richness, (2) high levels of wader functional
diversity saturates at higher levels of species richness (asymptotic relationship), or (3)
communities with high level of species include high levels of redundancy due to niche
specialization, resulting in levels of functional diversity lower than communities with an
intermediate number of species (quadratic relationship). However, it is highly likely that
increasing the species pool would not result in a quadratic relationship, as waders present a
high level of complementarity in morphological and behavioural traits through their
evolutionary adaptations for the exploitation of prey of different morphology, shape, size and
burrowing depth within the intertidal sediment (Burton, 1974; van de Kam et al., 2004).
To control for the effect of species richness on the observed patterns of functional diversity, I
used null models because the comparison between observed patterns and null expectations
allows us to test for non-random patterns which may reflect the underlying mechanisms that
structure community assembly (Gotelli, 2000; Mouillot et al., 2007; Thompson et al., 2010). I
thus focused on understanding variation in observed minus expected FD (SES), and for the rest
of the conclusions, will focus on variation in SES and the possible consequences for community
structure.
Spatial variation in wintering wader communities’ structure
Overall, species within wintering wader communities are more functionally similar than
expected by chance, reinforcing the role of environmental conditions in shaping communities.
However, species interactions appear to be having a stronger influence on some communities
around Britain (chapter 1), suggesting that the relative strength of these processes may vary
along environmental gradients. The analysis presented in chapter 4 showed that
environmental factors, such as tidal range and minimum temperature, accounted for a large
proportion (~70%) of the variation in community structure across Britain (Figure 4, chapter 4).
The increase in functional diversity (SES) along the temperature gradient may be evidence of a
widening of the filter, allowing more varied trait states to be present in communities, whereas
low minimum temperatures appeared to strengthen environmental filtering effects perhaps
due to a lack of sets of traits for persisting under very cold conditions. Severe weather
conditions can influence the distribution of birds, through mortality (Clark, 2009) and through
changes in prey abundance and distribution within the sediment (Esselink & Zwarts, 1989).
Conclusions
150
Thus, species that could reach the deep prey would be favoured in relation to species that
cannot reach the prey. Our results also indicate a relaxation in the intensity of competition in
estuaries with larger tidal ranges as this was also accompanied by an increase in species
richness, suggesting in turn an increase in the aggregation of species with more similar traits in
these estuaries. However, the links between species’ spatial distribution and
similarity/dissimilarity of their functional traits still remains unclear (Stubbs & Wilson, 2004).
Understanding how community processes vary along environmental gradients contributes to
the knowledge-base needed to predict and determine changes in community composition due
to changes in environmental conditions. For instance, reductions in tidal ranges may be likely
to increase competitive effects resulting in communities with more complementary traits.
In chapter 5, I attempted to test the relationship between species’ spatial distribution within
an estuary and functional diversity using a subset of estuaries for which low tide counts were
available. Although the relationship was not significant, there was a tendency for functionally
similar species to aggregate, whereas functionally dissimilar species tended to segregate
within estuaries. These results highlighted even more the importance of environmental filters
on structuring wader communities. These sets of results do not exclude the occurrence of
competition effects on the distribution of species and community patterns. However, limiting
similarity is likely to operate at relatively fine spatial and/or temporal scales, and the spatial
scale used here might be too broad in order to capture its influence on co-occurrence patterns,
as we consider the entire winter period and subsections of estuaries that are delimited for
counts but are not necessarily of relevance for birds. Despite the small number of estuaries
included in this study, it provided an opportunity to explore these associations and opened up
a field for further research on understanding links between spatial distribution and functional
diversity of foraging species.
Changes in wader wintering distribution community structure
The analyses reported in chapter 2 identified changes in wintering occupancy across Britain for
many of the wintering wader species and related these population changes to changes in
community functional diversity and structure. As discussed, levels of
redundancy/distinctiveness of functional traits contributed by each species will correlate with
the variation in functional diversity. Thus, our results showed that species that contribute
positively to functional diversity (i.e. making communities more functionally diverse) are
species that are more functionally distinctive within multivariate functional trait space, and
have also expanded their wintering ranges. The colonization of new sites is likely to be a
density-dependent response to increases in local abundances (chapter 3) and the
establishment and expansion of new local populations will depend, among other things, on the
Conclusions
151
number of suitable sites available and the amount of resources available within those sites (Gill
et al., 2001). Furthermore, avoiding niche overlap by being able to exploit different parts of the
resource spectrum and perform different functional roles within the community might thus
explain why these species have been able to successfully establish local populations in new
sites. A combination of both effects, increased competition by the presence of new species in
the communities and/or reduction of prey availability, and relaxation of environmental filters
by changes in environmental conditions allowing more species to be present in communities,
are thus likely to explain the observed changes in functional diversity.
Changes in the distribution of non-breeding waders have been studied within the UK and
across Europe in relation to climate change (Rehfisch et al., 2004; Austin & Rehfisch, 2005;
Maclean et al., 2008). These studies have shown that the overall winter distribution of some
species may have shifted in a northeasterly direction. However, we found no association
between the magnitude and direction of changes in functional diversity and climate. Instead,
we found a modest but nevertheless significant relationship between the rate of change of
functional diversity (SES) with estuary fetch and estuary depth (chapter 4). Fetch reflects
turbidity and the strength of wave action in the estuary and, hence, is a good indicator of the
sediments present within the estuary. Thus, the negative relationship suggests that species
within communities at sandier estuaries are becoming much functionally similar than species
within communities at muddier estuaries, which are becoming more functionally diverse. With
these results, the question becomes “why are wintering wader communities at different
habitat types changing in different ways?”. The increasing wintering temperatures may have
direct impacts on waders through reductions of mortality events and indirect impacts through
changes in the abundance, distribution and accessibility of invertebrate prey (Gill, 2012 and
references therein). For instance, some mollusc species that have metabolic systems adapted
to cold temperatures reduce their body conditions and breeding success with increases in
winter temperature (Beukema, 1992). The burrowing depth of the ragworm (H. diversicolor), a
common prey amongst waders, can also increase when sea temperatures are low (Esselink &
Zwarts, 1989), becoming out of reach for some wader species. Thus, it is likely that
invertebrate communities in different habitats may be affected in different ways by changes in
environmental conditions. Further work on understanding the mechanisms that are driving
variation in changes in functional diversity and wader community composition and the
interplay between habitat and climate are required.
Species’ responses to changes in environmental conditions may not correspond to the
responses of the community as a whole. For example, shifts in species’ distributions can
dissociate important species interactions if other species within the community do not

Conclusions
152
respond in a similar way (Walther et al., 2002; Schweiger et al., 2008). Increases in winter
temperatures across UK might be expected to relax environmental filtering effects, allowing
more wader species with different functional traits to be present in communities. However,
Figure 1 suggests a non-linear relationship between community structure (SES FD) and winter
minimum temperature. Such a trend suggests that at low and high winter minimum
temperatures, communities are less functionally diverse than expected by chance. As such,
environmental filters seem to be strengthening at the extremes of winter temperature range.
On the other hand, temperatures in the middle of the wintering range seem to relax those
environmental filters and/or increase competitive interactions, resulting in communities
around an intermediate temperature that are more functionally diverse than expected by
chance. The mechanisms by which this pattern may arise are not fully understood, but it is
highly likely that, as mentioned before, changes in winter temperatures may impact birds
directly (e.g. by reducing high mortality from very cold winters or not being able to
thermoregulate properly with warmer temperature as they are adapted to colder
temperatures) or indirectly through changes in prey behaviour, abundance and distribution.
Further analysis needs to be carried out in order to gain greater insight into how wintering
wader community structure may be responding to changes in climatic conditions. Such an
analysis could follow a similar approach to that in Godet et al. (2011), where they used a
community temperature index to relate long-term changes in the composition of wader
communities in France with climate change. The community temperature index was derived
from the temperature index of each species present in the community weighted by their
abundances. The species’ temperature index corresponds to the mean temperature within the
wintering range of each species. They found a change in wader community composition
towards species associated with higher temperatures, but consequences for community
structure were not explored. Thus, it would be very interesting to test for associations
between community temperature indices and community structure to further understanding
of community responses to environmental change.

Conclusions
153
Figure 1. Relationship between SES functional diversity (comparison between observed and
expected FD) and the winter minimum temperature. Filled circles represents the average of
functional diversity and winter minimum temperature for a given year. Data from winter
1980/81 to 2006/07 are used. Standard errors are provided.
Implications for conservation management
The increasing loss and degradation of wetland systems has been widespread and is currently
seen as a major conservation issue. Wetlands support vast numbers of waders and waterfowl
many of which are solely dependent on this habitat during the non-breeding season. As this
habitat decreases in quality many species face an increasing level of threat (Meyers 1990, 1993;
Goss-Custard et al., 1997). Motivated by the need to mitigate the negative impacts of habitat
loss and degradation, many wetland restoration projects have been implemented across the
world (e.g. Pethick 2002; Nakamura et al., 2006). However, despite increasing the amount of
habitat available for wintering waterbirds (Armitage et al., 2007), these projects do not
necessarily lead to the re-establishment of communities as, in some cases, many species
remain absent from the restored wetland or their relative abundances change (Brawley et al.,
1998; Melvin & Webb, 1998; Li et al., 2011). These alterations in community composition and
structure can disrupt the ecological functions performed by a given set of species (Hughes et
al., 2003). Waders, situated at the top of the estuarine food web, are among the main
predators of the invertebrate community and therefore likely to strongly influencing the entire
ecosystem. In fact, top predators are known to greatly influence ecosystem-level processes.
For example, Hughes (1994) described how the reduced abundances of herbivorous fishes and
high mortality of grazing sea urchins in early 1980s most likely caused the switch from coral to
algal-dominated reefs around Jamaica. Removing herbivorous species from the system also

Conclusions
154
removed the control of algal growth and reduced the resilience of these ecosystems (Hughes
1994). However, Hamilton et al. (2006) did not find evidence for a top-down trophic cascade
on an estuarine trophic web composed by semipalmated sandpipers, Calidris pusilla (top), the
amphipod Corophium volutator (middle), and benthic diatoms (bottom), which secrete a
substance that helps to bind the sediment together and contributes to the stability of the
mudflat. Despite birds exerting a top-down effect by reducing Corophium densities, there were
no increases of diatom densities, because snails found in the intertidal area compensated for
changes caused by shorebirds and fed on the diatoms. Both examples highlight the importance
of understanding how structural properties of communities are related to the ecological
functions performed by each species within the community. Our study provides the basis for
understanding the functional role played by each species within wintering wader communities.
We have shown that there is little evidence for redundancy amongst wintering wader species
in the way they use resources across UK estuaries, as the species are taxonomically distinct
and exhibit complementary ecological functions within the assemblage. Therefore, if wintering
communities in UK needed restoration following the extinction of certain species, functionally
equivalent species may not be available to replace them.
In order to conserve the present integrity of wader communities and ecosystem functioning,
the implementation of habitat and community restoration is required to compensate for the
loss of intertidal areas. The capacity to restore communities is challenging but much progress
has been made over the last decade. One of the greatest current challenges in wader ecology
and conservation is to protect and understand populations along the Asia-Pacific flyway. Land
claim is currently a major problem in eastern Asian wetlands, particularly in the Yellow Sea
region (Sutherland et al., 2012), a keystone site for waders during the non-breeding season.
Intertidal habitat loss has led to the decline of 19 species that use the Yellow Sea as non-
breeding grounds and to the concentration of the remaining populations in a few remaining
areas while planning for further development in that region continues (Sutherland et al. 2012).
Because these changes may be irreversible, understanding the functional role of species using
the Yellow Sea may help in predicting changes in functional diversity and in estimating levels of
redundancy. For example, losing functionally distinctive species will cause a relatively large
decrease in functional diversity (e.g. this might be the case if the spoon-billed sandpiper
Eurynorhynchus pygmeus goes extinct) whereas loss of functionally similar species will have
little effect on functional diversity. Studies like the ones presented in this thesis can provide
the basis for understanding wader community structure and composition around the world,
and can help to develop ideas for better conservation management, particularly on sites were
biodiversity is changing rapidly.

Conclusions
155
Future directions
The findings reported in this thesis represent only a subset of the wintering ranges of 20 wader
species, and suggest that, even within this subset, wintering community structure varies along
gradients, increasing or relaxing the effects of species interactions and/or environmental
filtering. Changes to wader communities are likely to result from estuarine development that
affects the estuarine morphology and other environmental variables, which may alter the
strength of the mechanism structuring communities. Data on prey availability should be
assessed on different estuaries across the UK to explore the influence of competition upon
communities.
Future work, including analysis at the flyway level and global scale, would enhance our
understanding of the processes determining community structure and how they vary along
environmental gradients. If data are available, comparing breeding and non-breeding season
functional diversity would allow for the testing of differences across the annual cycle and the
examination of possible factors that can drive differences within and between seasons. It is
well known that the behaviour and ecology of waders changes between seasons. For instance,
many gregarious species in winter become extremely territorial during the breeding season.
How these changes in behaviour and ecology affect community processes remains unknown.
Despite the many remaining gaps in our knowledge of population and community level
dynamics, studies like this one provide a chance to develop our understanding and steer a path
towards the protection and conservation of these species and biodiversity in general.

Conclusions
156
References
Armitage, A.R., Jensen, S.M., Yoon, J.E. & Ambrose, R.F. (2007) Wintering shorebird
assemblages and behavior in restored tidal wetlands in Southern California. Restoration
Ecology, 15, 139-148.
Austin, G. & Rehfisch, M. (2005) Shifting nonbreeding distributions of migratory fauna in
relation to climatic change. Global Change Biology, 11, 31–38.
Beukema, J.J. (1992) Expected changes in the Wadden Sea benthos in a warmer world: Lessons
from periods with mild winters. Netherlands Journal of Sea Research, 30, 73-79.
Brawley, A.H., Warren, R.S. & Askins, R.A. (1998) Bird use of restoration and reference marshes
within the barn island wildlife management area, Stonington, Connecticut, USA.
Environmental Management, 22, 625-633.
Burton, P.J.K. (1974) Feeding and Feeding Apparatus in Waders. British Museum (Natural
History), London.
Clark, J.A. (2009) Selective mortality of waders during severe weather. Bird Study, 56, 96-102.
Díaz, S. & Cabido, M. (2001) Vive la difference: plant functional diversity matters to ecosystem
processes. Trends in Ecology & Evolution, 16, 646–655.
Esselink, P. & Zwarts, L. (1989) Seasonal trend in burrow depth and tidal variation in feeding
activity of Nereis diversicolor. Marine Ecology Progress Series, 56, 243-254.
Gill, J.A. (2012) Processes influencing bird use of estuarine mudflats and saltmarshes in western
Europe. pp 307-333. In Birds and Habitat: Relationships in Changing Landscapes. (ed. R.J.
Fuller) Cambridge University Press.
Gill, J.A., Norris, K., Potts, P.M., Gunnarson, F.G., Atkinson, P.W. & Sutherland, W.J. (2001) The
buffer effect and large-scale population regulation in migratory birds. Nature, 412, 436-
438.
Godet, L., Jaffré, M. & Devictor, V. (2011) Waders in winter: long-term changes of migratory
bird assemblages facing climate change. Biology Letters, 7, 714-717.
Goss-Custard, J.D., Rufino, R. & Luis, A. (1997) Effect of habitat loss and change of waterbirds.
Proceedings of the 10th International Waterfowl Ecology Symposium held at the

Conclusions
157
University of Aveiro, Portugal 18-21 September 1995. 1991. London, Stationery Office.
Wetlands International Publication.
Gotelli, N.J. (2000) Null model analysis of species co-occurrence patterns. Ecology, 81, 2606-
2621.
Hamilton, D.J., Diamond, A.W. & Wells, P.G. (2006) Shorebirds, snails, and the amphipod
(Corophium volutator) in the upper Bay of Fundy: top-down vs. bottom-up factors, and
the influence of compensatory interactions on mudflat ecology. Hydrobiologia, 567, 285-
306.
Hughes, T.P. (1994) Catastrophes, phase shifts, and large-scale degradation of a Caribbean
coral reef. Science, 265, 1547-1551.
Hughes, T.P., Baird, A.H., Bellwood, D.R., Card, M., Connolly, S.R., Folke, C., Grosberg, R.,
Hoegh- Guldberg, O., Jackson, J.B.C., Kleypas, J., et al. (2003) Climate change, human
impacts and the resilience of coral reefs. Science, 301, 929–933.
Li., D., Chen, S., Guan, L., Lloyd, H., Liu, Y., Lv, J. & Zhang, Z. (2011) Patterns of waterbird
community composition across a natural and restored wetland landscape mosaic, Yellow
River Delta, China. Estuarine, Coastal and Shelf Science, 91, 325-332.
Maclean, I.M.D., Austin, G.E., Rehfisch, M.M., Blew, J., Crowe, O., Delany, S., Devos, K.,
Deceuninck, B. Gunther, K., Laursen, K., van Roomen, M. & Wahl, J. (2008) Climate
change causes rapid changes in the distribution and site abundance of birds in winter.
Global Change Biology, 14, 2489-2500.
Mason, N.W.H., Irz, P., Lanoiselée, C., Mouillot, D. & Argillier, C. (2008) Evidence that niche
specialization explains species-energy relationships in lake fish. Journal of Animal Ecology,
77, 285-296.
Mayfield, M.M., Boni, M.F., Daily, G.C. & Ackerly, D. (2005) Species and functional diversity of
native and human-dominated plant communities. Ecology, 86, 2365-2372.
Melvin, S.L. & Webb Jr., J.W. (1998) Differences in the avian community of natural and created
Spartina alterniflora salt marshes. Wetlands, 18, 59-69.
Meyers, N. (1990) The biodiversity challenge: expanded hot-spot analysis. The
Environmentalist, 10, 243-256.
Conclusions
158
Meyers, N. (1993) Biodiversity and the precautionary principle. Ambio, 22, 74-79.
Mouillot, D., Dumay, O. & Tomasini J.A. (2007) Limiting similarity, niche filtering and functional
diversity in coastal lagoon fish communities. Estuarine, Coastal and Shelf Science, 71, 443-
456.
Nakamura, K., Tockner, K. & Amano, K. (2006) River and wetland restoration: lessons from
Japan. Bioscience, 56, 419-429.
Petchey, O.L. & Gaston, K.J. (2002). Extinction and the loss of functional diversity. Proceedings
of the Royal Society B Biological Sciences, 269, 1721–1727.
Pethick, J. (2002) Estuarine and tidal wetland restoration in the United Kingdom: policy versus
practice. Restoration Ecology, 10, 431-437.
Rehfisch, M.M., Austin, G.E., Freeman, S.N., Armitage, M.J.S. & Burton, N.H.K. (2004) The
possible impact of climate change on the future distributions and numbers of waders on
Britain’s non-estuarine coast. Ibis, 146, 70-81.
Schleuter, D., Daufresne, M., Massol, F. & Argillier, C. (2010) A user's guide to functional
diversity indices. Ecological Monographs, 80, 469–484.
Stubbs, W.J. & Wilson, J.B. (2004) Evidence for limiting similarity in a sand dune community.
Journal of Ecology, 92, 557-567.
Sutherland, W.J., Alves, J.A., Amano, T., Chang, C.H., Davidson, N.C., Finlayson, C.M., Gill, J.A.,
Gill Jr, R.E., González, P.M., Gunnarsson, T.G., Kleijn, D., Spray, C.J., Székely, T. &
Thompson, D.B.A. (2012) A horizon scanning assessment of current and potential future
threats to migratory shorebirds. Ibis, 154, 663-679.
Schweiger, O., Settele, J., Kudrna, O., Klotz, S. & Kühn, I. (2008) Climate change can cause
spatial mismatch of trophically interacting species. Ecology, 89, 3472–3479.
Thompson, K., Petchey, O.L., Askew, A.P., Dunnett, N.P., Beckerman, A.P. & Willis, A.J. (2010)
Little evidence for limiting similarity in a long-term study of a roadside plant
community. Journal of Ecology, 98, 480-487.
van de Kam, J., Ens, B., Piersma, T. & Zwarts, L. (2004) Shorebirds: An illustrated behavioural
ecology. KNNV Publishers, Utrecht.

Conclusions
159
Villéger, S., Miranda, J.R., Hernandez, D.F. & Mouillot, D. (2010) Contrasting changes in
taxonomic vs. functional diversity of tropical fish communities after habitat
degradation. Ecological Applications, 20, 1512-1522.
Walther, G.-R., Post, E., Convey, P., Menzel, A., Parmesan, C., Beebee, T.J.C., Fromentin, J.-M.,
Hoegh-Guldberg, O. & Bairlein, F. (2002) Ecological responses to recent climate change.
Nature, 416, 389–395.

160
Appendix

161
Appendix
Appendix 1. Description of the foraging methods used to calculate functional diversity.
Foraging method Definition
1. Pecking Striking or biting with its beak with the beak touching the
substrate
2. Probing Bill partly or fully inserted in the substrate in search of prey
3. Jabbing Poking rapidly or quickly at a prey item.
4. Stitching Making rapid movement as stitches producing a particular
pattern. Often done in a dense flock.
5. Ploughing Turning over the upper layer of the substrate and bringing prey
to the surface
6. Scything Sweeping the bill quickly through the upper surface layer of
the mud or water
7. Foot trembling Placing one foot on the sediment, slightly forward of the other,
and vibrating it up and down to disturb invertebrates hidden in
the substrate.
8. Turning over objects Moving and rotating objects in search of prey
9. Hammering Hitting or beating repeatedly with the bill to open bivalves
10. Swimming Swimming in the water column while foraging.

162
Appendix 2. The functional relationships among 20 wader species that winter in British
estuaries. The dendrogram is produced by hierarchical clustering using UPGMA algorithm of
the distance matrix calculated from the functional traits of species. Horizontal distance
represents separation in trait space, vertical distance is for clarity.