spatial and temporal variation of acid rain in the mexico ... · rodolfo sosa-echeverrÍa1*, ana...
TRANSCRIPT

Spatial and temporal variation of acid rain in the Mexico City Metropolitan Zone
Rodolfo SOSA-ECHEVERRÍA1*, Ana Luisa ALARCÓN-JIMÉMEZ1, María del Carmen TORRES-BARRERA1, Mónica JAIMES-PALOMERA2, Armando RETAMA-HERNÁNDEZ2, Pablo SÁNCHEZ-ÁLVAREZ1,
Elías GRANADOS HERNÁNDEZ3 and Humberto BRAVO-ÁLVAREZ1†
1CentrodeCienciasdelaAtmósfera,UniversidadNacionalAutónomadeMéxico,CircuitodelaInvestigaciónCientíficas/n, Ciudad Universitaria, 04510 Ciudad de México
2 Gobierno de la Ciudad de México, Secretaría del Medio Ambiente, Av. Tlaxcoaque 8, piso 6, Col. Centro, 06090 Ciudad de México, México.
3 Centro Tecnológico Aragón, Facultad de Estudios Superiores Aragón, Avenida Hacienda de Rancho Seco s/n, Impulsora Popular Avícola, 57130 Nezahualcóyotl, Estado de México
* Corresponding author; email: [email protected]
Received: September 26, 2017; accepted: November 28, 2018
RESUMEN
A finales de la década de 1980, las partículas y el bióxido de azufre (SO2) fueron los principales contaminantes atmosféricos en la Zona Metropolitana de la Ciudad de México (ZMCM). Para reducir esta problemática, el combustóleo fue sustituido por gas natural en las centrales termoeléctricas localizadas dentro de la Ciu-dad de México. Actualmente, los niveles de SO2 no exceden la norma de calidad del aire para este gas; sin embargo, se presenta lluvia ácida con una alta contribución de sulfatos (SO4
2–). En este estudio, se analizó la variación espacial y temporal de la composición química de la lluvia en la Ciudad de México de 2003 a 2014. Se colectaron muestras semanales en las que se analizaron los iones principales (Na+, NH4
+, K+, Mg2+, Ca2+, SO4
2–, NO3– y Cl–), pH y conductividad eléctrica (CE) en 16 estaciones de muestreo ubicadas en la
ZMCM. El pH disminuyó de norte a sur, con el valor anual más bajo del promedio ponderado por volumen (PPV) de 4.16 en 2006. Las concentraciones ponderadas anuales de los iones fueron, en orden decreciente: NH4
+, SO42–, NO3
– y Ca2+ durante todo el periodo de estudio en casi todos los sitios de muestreo. Los valores máximos de depósito atmosférico húmedo (kg/ha) se encontraron en el área oeste de la zona de estudio, siendo los más altos los registrados en 2007. Los mayores niveles de depósito húmedo encontrados fueron de 24 y 20 kg ha–1 para SO4
2– y NO3–, respectivamente, y fueron similares a los niveles registrados en EUA en 2013
y 2014. Considerando que las fuentes de emisión externas juegan un papel decisivo en la lluvia ácida dentro de la Ciudad de México, es necesario establecer estrategias para la reducción de emisiones de precursores de lluvia ácida en las fuentes localizadas viento arriba.
ABSTRACT
At the end of the 1980´s particulates and sulfur dioxide (SO2) were the main atmospheric pollutants in the Mexico City Metropolitan Zone (MCMZ). To reduce emissions, fuel oil was replaced by natural gas at power plants located inside Mexico City. Currently, SO2 levels do not exceed its air quality standard; however, acid rain is present with a high contribution of sulfate (SO4
2–). In this study, spatial and temporal variations in the chemical composition of rain in Mexico City between 2003 and 2014 were analyzed. Major ions (Na+, NH4
+, K+, Mg2+, Ca2+, SO42–, NO3
– and Cl–), pH, and electrical conductivity (EC) were analyzed weekly at 16 sampling stations located in the MCMZ. The pH decreased from north to south, with the lowest an-nual volume weighted mean (VWM) of 4.16 in 2006. Annual ion concentrations were, in decreasing order: NH4
+, SO42 –, NO3
– and Ca2+ for the entire study period at most of the sampling sites. The highest values
Atmósfera 32(1), 55-69 (2019)doi: 10.20937/ATM.2019.32.01.05
© 2019 Universidad Nacional Autónoma de México, Centro de Ciencias de la Atmósfera. This is an open access article under the CC BY-NC License (http://creativecommons.org/licenses/by-nc/4.0/).

56 R. Sosa-Echeverría et al.
for wet atmospheric deposition (kg/ha) were found in the Western area and were the maximum in 2007. Wet deposition had major levels for SO4
2– and NO3– of 24 and 20 kg/ha, respectively, and were similar to the
levels registered in the USA in 2013 and 2014. Considering that external emission sources play a decisive role in acid rain within the City, it is necessary to establish strategies for the emission reductions of acid rain precursors from upwind sources.
Keywords: Mexico City Metropolitan Zone, wet deposition, acid rain, rain chemical composition, acid rain precursors.
1. IntroductionThe Mexico City Metropolitan Zone (MCMZ) is generally accepted as having critical levels of air pollution. In the 1980s, particulates and sulfur dioxide (SO2) were identified as the main atmospheric pol-lutants, and an effort to reduce emissions was made by changing from fuel oil to natural gas at power plants. This resulted in a reduction in the levels of both target pollutants; however, it was accompanied by an increase in nitrogen oxides (NOx) due to lack of control equipment (Aldana et al., 1999; Bravo et al., 2012).
The air quality monitoring network of the city (which measures particulates, NOx, SO2, CO, and O3) consists of 42 stations and has been operational since 1988. In the case of SO2, this network has been useful in evaluating the effectiveness of the switch from fuel oil to natural gas. Although the concentration of acid rain precursors (SO2 and NOx) has declined in recent decades (Fig. 1) (SIMAT, 2015), acid rain is an outgoing problem in the area (Alarcón et al., 2011).
This paper analyzes the temporal and spatial variation of the chemical composition (i.e., pH, electrical conductivity, sodium [Na+], ammoni-um [NH4
+], potassium [K+], magnesium [Mg2+], calcium [Ca2+], sulfate [SO4
2–], nitrate [NO3–]
and chloride [Cl–]) of wet atmospheric deposition during the period 2003-2014. The objective was to identify areas of greater importance, as well as the trends and behaviors of critical parameters to recommend prevention, minimization, and control strategies.
The Environmental Pollution Section of the Cen-ter for Atmospheric Sciences at the National Auton-omous University of Mexico (SCA-CCA-UNAM, Spanish acronym) has maintained a program for sampling and analysis of atmospheric deposition in several regions of Mexico (Heckel, 2007; Sosa et al.,
2017). Since 2002, the SCA-CCA-UNAM, together with the Atmospheric Monitoring System (SIMAT, Spanish acronym) of Mexico City, has continuously monitored wet deposition in this area.
2. Methodology2.1 Description of the study areaThe MCMZ is located in the southwestern corner of the Mexico basin at an altitude of 2240 masl. The basin’s topographical situation does not allow the free circulation of winds and good ventilation, and it presents diurnal patterns of wind blowing from the northwest and the northeast. The industrial area of the MCMZ comprises more than 30% of the national industry and is located in the northern sector of the study area.
There are important sources of acid rain precursors outside of the MCMZ: (1) the Popocatépetl, an active volcano (Delgado et al., 2001; Grutter et al., 2008) located 80.7 km to the east of the city, and (2) the Tula-Vito-Apasco industrial corridor, a critical zone containing power plants, refineries, and petrochemical and Portland cement industries, among others, located to the north of the study area. For example, the power plant in the industrial corridor utilized fuel oil until 2014, with a sulfur content of 4%, and estimated SO2 emissions of 113 000 t per year. Several options for controlling SO2 emissions have been recommended to the Mexican electric sector, such as scrubbing technologies, fuel oil hydro treating, desulphurization, and alternate fuel sources (Islas and Grande, 2007).
2.2 Location of atmospheric deposition sampling stationsThe atmospheric deposition network in Mexico City consists of 16 sampling stations that are spatially distributed as shown in Fig. 2. These sites comply with the USEPA criteria (US-EPA, 1994).

57Spatial and temporal variation of acid rain in the MCMZ
2.3 Sampling and analysisThe sampling and analysis program implemented by the SCA-CCA-UNAM consists of quality assurance and a quality control plans that yield reliable data complying with recommendations from the US-EPA (1994), the National Atmospheric Deposition Program (NADP, 2014), and the Global Atmosphere Watch Precipitation Chemistry Program of the World Meteorological Organization (WMO, 2004). The sampling and analysis program was adopted based
on the SCA-CCA-UNAM experience (Bravo et al., 1991, 2003, 2006) and recommendations from in-stitutions, as well as recognized researchers (Krupa, 2002; US-EPA, 1991).
Wet deposition samples were collected weekly using automatic wet/dry deposition collectors (En-vironmental Tisch Model TE-78-100 and Graseby T-100) during the rainy season in Mexico City (May to November). Each sample was collected into a stan-dard high-density polyethylene bucket, transferred to a
225
200
175
150
125
SO
2 con
cent
ratio
n (p
pb)
100
75
50
25
0
1988
1989
1990
1991
1992
1993
1994
1995
1996
1997
1998
1999
2000
2001
2002
2003
2004
2005
2006
2007
2008
2009
2010
2011
2012
2013
2014
Year
400
350
300
250
NO
X c
once
ntra
tion
(ppb
)
200
150
100
50
0
1988
1989
1990
1991
1992
1993
1994
1995
1996
1997
1998
1999
2000
2001
2002
2003
2004
2005
2006
2007
2008
2009
2010
2011
2012
2013
2014
Year
Fig. 1. Annual concentration boxplots of SO2 and NOx from 1988 to 2014 based on hourly concentrations from monitoring stations. The average, minimum, and maximum values are presented for each year, as well as the 10th and 90th percentiles (SIMAT, 2015).

58 R. Sosa-Echeverría et al.
polypropylene bottle (Nalgene®), and refrigerated at 4 ºC for preservation (NADP, 2017). Samples were sent to the SCA-CCA-UNAM laboratory for chemical analysis.
Samples greater than 1.0 mm were analyzed. Rain samples were filtered through a 0.22 µm Millipore membrane, and all materials were washed with deionized water before chemical analysis. The pH was measured within 24 h of the arrival to the laboratory using a pH meter (Corning 315, Methrom 827, and Orion 960). SO4
2–, NO3–, Cl–, Ca2+, Mg2+,
K+, NH4+, and Na+ were analyzed by high perfor-
mance liquid chromatography (HPLC); anions were analyzed with a Perkin Elmer equipped with an isocratic LC pump 250 and conductivity detector and a Hamilton PRPX-100 analytical anion column; and cations were analyzed with a Waters liquid chromatograph equipped with an isocratic Waters 510 pump and a conductivity detector (Waters 432) using a Waters analytical cationic column. High-pu-rity ion standards were used for calibration. This identification and quantification of ions was based on the US-EPA Method 300.1 (Hautman et al., 1997).
Alkalinity (HCO3−) was determined using the
Gran titration method with pH meters (Stumm and
Morgan, 1970). EC was determined with YSI 32 and HORIBA D-424 conductivity instruments.
The detection limits in µeq L–1 were: 2.29, 1.77, 2.26, 2.50, 3.29, 1.79, 2.22, and 1.74 for SO4
2–, NO3–, Cl–, Ca2+, Mg2+, K+, NH4
+, and Na+, respectively.
The quality of analysis of each sample was checked for ion balance and specific conductance calculations. Additionally, field blanks were analyzed to guarantee the cleanness of the sampling material, and replicates were analyzed routinely to assure appropriate precision and accuracy.
3. Results and discussionThe analysis of wet deposition in Mexico City for 12 consecutive years (2003-2014) at 16 stations resulted in 3867 total samples.
3.1 Spatial distribution of pH, SO42– and NO3
–
Box plots showing volume weighted means (VWMs) of the annual pH for different areas of the MCMZ (northeast [NE], northwest [NW], downtown [DT], southeast [SE], and southwest [SW]) are presented in Figure 3.
IBM Legaria
Lab de Análisis Ambientales
Tlalnepantla
Montecillos
Netzahualcoyotl Sur
Cerro del Tepeyac
Xalostoc
Museo de la Cd. de México
Diconsa
Ecoguardas Ajusco
Ex Convento Desierto de los Leones
Lomas
Ajusco
San Nicolás Totolapan
Corena
Milpa Alta
IBM
LAA
TLA
MON
NEZ
TEC
XAL
MCM
DIC
EAJ
EDL
LOM
AJU
SNT
COR
MPA
Station Acronyms
Fig. 2. Spatial distribution of the atmospheric deposition network in the MCMZ.

59Spatial and temporal variation of acid rain in the MCMZ
The pH values of collected samples at stations in the south were more acidic than samples collected in the north. This result is in line with meteorologi-cal conditions (i.e., prevailing winds blowing from the north to the south), as well as emission sources located in the north sector.
Box plots showing VWMs of the annual SO42–
and NO3– concentrations are presented in Figure 4.
SO42– wet deposition was higher in the south-
west, which was likely due to high precipitation in this area. This region also had more acidic pH values.
8.00
7.00
6.00
5.00
4.00
XA
L
NE
Z
TEC
MO
N
TLA
IBM
LAA
MC
M
LOM
DIC
EA
J
ED
L
SIN
AJU
CO
R
MPA
SW SE
5.6
DT
Station / Zone
NWNE
VW
M p
H
Fig. 3. Volume weighted means of the annual pH for 16 wet atmospheric deposition sam-pling stations in the MCMZ.
Fig. 4. Box plots showing the wet deposition of SO42– and NO3
– (kg ha–1) for 16 stations in the MCMZ.
60.00
40.00
20.00
0.00
XA
LN
EZ
TEC
MO
N
TLA
IBM
LAA
MC
M
LOM
DIC
EA
J
ED
LS
IN
AJU
CO
RM
PA
SW SEDTStation / Zone
NWNE
Sul
fate
dep
ositi
on (k
g / h
a) *
**
*
Station / Zone
80.00
60.00
40.00
20.00
0.00
XA
LN
EZ
TEC
MO
N
TLA
IBM
LAA
MC
M
LOM
DIC
EA
J
ED
LS
IN
AJU
CO
RM
PA
SW SEDTNWNE
Nitr
ate
depo
sitio
n (k
g / h
a)
*
*
*

60 R. Sosa-Echeverría et al.
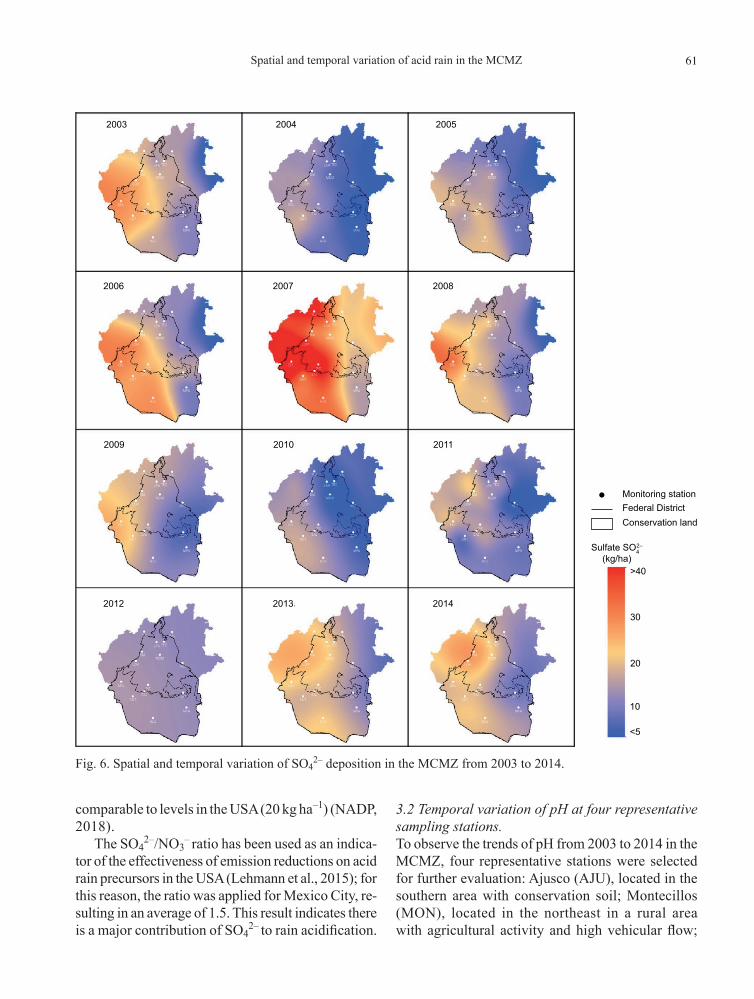
To visualize the spatial distribution of pH, SO42–,
and NO3– levels, maps were made using interpolation
of data from each of the 16 sampling stations showing the VWMs of pH, SO4
2–, and NO3– depositions (Figs. 5,
6 and 7, respectively). To observe the temporal vari-ation of the parameters, maps are presented for the study period 2003-2014.
SO42– and NO3
– wet deposition in Mexico City ranged from 5-40 kg ha–1 during the study period, with the highest level occurring in 2007. For the last two years (2013 and 2014) the values were 30 and 27 kg ha–1 for SO4
2–, respectively, which are similar to the level registered in the USA (24 kg ha–1); for NO3
–, the values were 22 and 25 kg/ha,
Fig. 5. Spatial and temporal variation of pH in the MCMZ from 2003 to 2014.
Monitoring station
2003 2004 2005
2006 2007 2008
2009 2010 2011
2012 2013 2014
Federal DistrictConservation land
7.0
6.5
5.5
4.5
6.0
5.0
pH
61Spatial and temporal variation of acid rain in the MCMZ
comparable to levels in the USA (20 kg ha–1) (NADP, 2018).
The SO42–/NO3
– ratio has been used as an indica-tor of the effectiveness of emission reductions on acid rain precursors in the USA (Lehmann et al., 2015); for this reason, the ratio was applied for Mexico City, re-sulting in an average of 1.5. This result indicates there is a major contribution of SO4
2– to rain acidification.
3.2 Temporal variation of pH at four representative sampling stations.To observe the trends of pH from 2003 to 2014 in the MCMZ, four representative stations were selected for further evaluation: Ajusco (AJU), located in the southern area with conservation soil; Montecillos (MON), located in the northeast in a rural area with agricultural activity and high vehicular flow;
Monitoring station
2003 2004 2005
2006 2007 2008
2009 2010 2011
2012 2013 2014
Federal DistrictConservation land
>40
20
10
<5
30
Sulfate SO42–
(kg/ha)
Fig. 6. Spatial and temporal variation of SO42– deposition in the MCMZ from 2003 to 2014.

62 R. Sosa-Echeverría et al.
Xalostoc (XAL), located to the north in an indus-trial area with high vehicular influence, and Lomas (LOM), located in the southwest in a urban area (i.e., residential and commercial) with high vehicular flow (Fig. 8).
At the XAL station, the VWM of pH decreased from 2003 until 2007. Values rise slightly in 2008,
2011, and 2014, and decreased again in 2012 and 2013. At the MON station, pH declined every year from 2003 to 2014 except in 2010; values became acidic in 2011. Values at the LOM station were acidic except during 2003 and 2008; there was a critical VWM value of 4.16 at this station in 2006. At the AJU station, the pH was acidic for all years
Monitoring station
2003 2004 2005
2006 2007 2008
2009 2010 2011
2012 2013 2014
Federal District
Conservation land
>40
20
10
<5
30
Nitrate NO3–
(kg/ha)
Fig. 7. Spatial and temporal variation of NO3– deposition in the MCMZ from 2003 to 2014.

63Spatial and temporal variation of acid rain in the MCMZ
Fig. 8. pH values and volume weighted mean annual pH at four representative stations located in the MCMZ.
10 XAL
8
6
4
pH v
alue
pH v
alue
MON
10 LOM
8
6
4
2003
2004
2005
2006
2007
2008
2009
2010
2011
2012
2013
2014
Year
AJU
2003
2004
2005
2006
2007
2008
2009
2010
2011
2012
2013
2014
YearpH Annual VWM pH
5.6
5.65.6
5.6
except 2003, when the average pH was 5.66. The stations located in the south (AJU and LOM) had more acidic pH values, which was likely due to the meteorological conditions in the region (i.e., north winds).
For these samples sites, accumulated rainfall is presented in Figure 9. LOM and AJU presented higher rainfall levels. The LOM sampling site, located in the west of the city, showed the highest level in 2014.
3.3 Ionic compositionFigure 10 shows the relative abundance of major ions determined at the four selected stations.
Figure 10 shows that NH4+ is the major cation in
all sampling sites, hence the importance of paying
attention to NH3 in vehicular emissions all over the city. The proportion of NH4
+ was higher in the MON station, likely due to agricultural activity in the area, as well as chemical reactions of NH3 emitted by mobile sources. NH3 emissions have been associated with traffic in different European cities (Elser et al., 2018) and can emanate from vehicles running under rich air to fuel conditions, with three-way catalytic converters designed to reduce NOx (Fraser and Cass, 1998).
A low contribution of NH4+ was observed in
samples collected in 2006 and 2013 from the LOM and AJU stations, which is consistent with a high percentage of H+ during those years at both stations. The proportions of H+ and Cl– are greater at AJU compared to other stations.

64 R. Sosa-Echeverría et al.
3.4 Ionic associationsTo identify associations between ion concentrations in all the wet deposition samples collected at each station, a linear Spearman correlation was applied to the four chosen stations. Results for the MON station are presented as a representative sample (Table I). Group solutes associated with potential sources are: (1) the acidic group, which is a combination of H+, SO4
2–, and NO3– primarily resulting from
the combustion of fossil fuels; (2) the salt group, which is mainly an association of Na+ and Cl– from sea salt and/or road salt, and (3) the agriculture and soil group, which is a combination of base cations (i.e., Ca2+, Mg2+, and K+) and nitrogenous solutes (i.e., NO3
– and NH4+) from fertilizers, feed lots,
and dust particles (Loÿe-Pilot and Morelli, 1988; Loÿe-Pilot and Martin, 1996; Herut et al., 2000; Praveen et al., 2007).
Based on the four representative stations, NH4+
correlates with Cl–, NO3–, and SO4
2–, with the predominant salts being (NH4)2 SO4 and NH4 NO3. The AJU station had a higher correlation between H+ and Cl–, The MON station had the highest correlation between H+ and SO4
2–, while H+ and NO3
– had the highest correlation at the AJU and LOM stations.
3.5 pH, SO42– and NO3
– trendsWe used a non-linear technique of an additive model to determine temporal variations of the most
important parameters for acid rain (i.e., pH, SO42–,
and NO3–). A trend analysis for the selected stations
(XAL, MON, LOM, and AJU) was used from 2003 to 2014 (Fig. 11). The generalized additive model (GAM) allows smooth trends to be estimated from data using penalized regression splines (Wood, 2006).
The following additive model was fitted to each series:
yi = β0 + f1 (timei) + f2 (juliani) + εi
where yi is the observed deposition; β0 is the intercept or constant term; f1 (timei) is the smooth function of time, which represents the trend in the response and describes the variation through time of level of the response; f2 (juliani) represents the seasonal varia-tion of deposition within a year, and εi is the area of model residuals, which are assumed to be zero mean for Gaussian random variables with variance of σ2.
Models were fitted in a GAM framework using the Mixed GAM Computation Vehicle (MGCV) with automatic smoothness estimation v. 1.8-4 (Wood, 2014) for the R statistical software package v. 2.15.2 (R Development Core Team, 2011). A log transfor-mation was applied to deposition variables SO4
2– and NO3
– to achieve constant variance.
The pH decreased at all stations, although for the LOM station the decrease was very light. The other three stations showed significant decreases throughout the study period; pH was lowest at the
1200
1000
800
600mm
400
200
02003 2004 2005 2006 2007 2008
LOM XAL MON AJU
2009Year
Accumulated rainfall
2010 2011 2012 2013 2014 2015
Fig. 9. Annual accumulated rainfall at four atmospheric sampling sites in the MCMZ.

65Spatial and temporal variation of acid rain in the MCMZ
LOM
100
XAL
MON
H+
K+
Na+
Ca2+
Mg2+
NH4+
H+
K+
Na+
Ca2+
Mg2+
NH4+
SO42–
NO3–
Cl–
80
60
40
Year Year
20
0
%
2003
2004
2005
2006
2007
2008
2009
2010
2011
2012
2013
2014
100
80
60
40
Year
20
0
%
2003
2004
2005
2006
2007
2008
2009
2010
2011
2012
2013
2014
H+
K+
Na+
Ca2+
Mg2+
NH4+
100
80
60
40
Year
20
0
%
2003
2004
2005
2006
2007
2008
2009
2010
2011
2012
2013
2014
H+
K+
Na+
Ca2+
Mg2+
NH4+
100
80
60
40
Year
20
0
%
2003
2004
2005
2006
2007
2008
2009
2010
2011
2012
2013
2014
100
80
60
40
20
0
%%
%%
2003
2004
2005
2006
2007
2008
2009
2010
2011
2012
2013
2014
SO42–
NO3–
Cl–
Year
100
80
60
40
20
020
03
2004
2005
2006
2007
2008
2009
2010
2011
2012
2013
2014
SO42–
NO3–
Cl–
Year
100
80
60
40
20
0
2003
2004
2005
2006
2007
2008
2009
2010
2011
2012
2013
2014
SO42–
NO3–
Cl–
Year
100
80
60
40
20
0
2003
2004
2005
2006
2007
2008
2009
2010
2011
2012
2013
2014
AJU
Fig. 10. Annual ion composition (%) for the XAL, MON, LOM, and AJU stations. The major ions from 2003 to 2014 were SO4
2– (50% of anions), NO3– (40% of anions), NH4
+ (60% of cations), and Ca2+ (30% of cations). The XAL and MON stations had the highest SO4
2– contribution (%); both stations are located in the northern section of the study area downwind from the critical zone Tula-Vito-Apasco.

66 R. Sosa-Echeverría et al.
Fig. 11. pH, SO42– and NO3
– trends for stations XAL, MON, LOM and AJU.
0.5
–0.5
0.0
XAL
0.5
–0.5
S(tr
end)
0.0
MON
pH SO42–
0.5
–0.5
0.0
LOM
0.5
–0.5
2003
2005
2007
2009
2011
2013
2003
2005
2007
2009
2011
2013
0.0
AJU
Year
NO3–
2003
2005
2007
2009
2011
2013
Table I. Spearman correlation for ion concentrations at the MON station.
H+ EC Na+ NH4+ K+ Mg2+ Ca2+ Cl– NO3
– SO42–
H+ 1.000 –0.017 –0.098 –0.159* –0.008 –0.047 –0.267** 0.098 0.059 0.191**EC 1.000 0.195** 0.732** 0.392** 0.380** 0.702** 0.487** 0.768** 0.770**Na+ 1.000 0.100 0.333** 0.466** 0.292** 0.179* 0.259** 0.192**NH4
+ 1.000 0.322** 0.152** 0.540** 0.498** 0.661** 0.648**K+ 1.000 0.511** 0.285** 0.285** 0.393** 0.402**Mg2+ 1.000 0.338** 0.175* 0.402** 0.303**Ca2+ 1.000 0.341** 0.531** 0.484**Cl– 1.000 0.442** 0.497**NO3
– 1.000 0.755**SO4
2– 1.000
*Correlation is significant at the 0.05 level (2-tailed).**Correlation is significant at the 0.01 level (2-tailed).

67Spatial and temporal variation of acid rain in the MCMZ
XAL, MON, and AJU stations in 2007, and SO42–
and NO3– concentrations were highest during this
year. In the above mentioned stations, the maximum pH occurred in 2010 and corresponded to minimum levels of SO4
2– and NO3–.
Higher deposition values for SO42– and NO3
– were observed in 2007 according to the maps in Figures 6 and 7, respectively, as well as in trends analysis, where the same behavior was also observed. When reviewing possible reasons for this situation, it was interesting to find that emissions from the Popocatépetl volcano presented an increase during 2007 (Carn et al., 2017).
LOM is located in the western part of Mexico City. This station showed a pH pattern similar to the other stations up to 2008; thereafter, the level was constant until the last year of the study when a small increase was recorded. However, there is a slight decrease with respect to the initial year (2003). NO3
– and SO4
2– increased from 2005 to a peak concentration in 2007, followed by a decline until 2011 and a slight increase in subsequent years. In the last year, levels at three stations (XAL, MON, and LOM) declined, while the AJU station, located in the south of the city, remained constant.
4. Conclusions and recommendationsThe spatial distribution of VWM pH shows its de-crease throughout the study from north to south in Mexico City, influenced by meteorological condi-tions. In most of the study sites, VWM pH decreased from 2003 to 2014. For example, at the MON station, values decreased from 7.48 in 2003 to 5.03 in 2014.
In the stations located in a rural area (MON and AJU), a strong correlation was found between NH4
+ and SO4
2–, NO3–, and Cl–; this is likely due to their
origin in soil (i.e., fertilizer use).It is recommended to analyze the source of NH4
+ in the study area because this is the most abundant cation. It is necessary to consider the chemical reac-tion of NH3 emitted by mobile sources.
The same concentration trend was observed for SO4
2– and NO3– in the Mexico City stations, which
indicates that the sources of acid rain precursors are upwind (i.e., to the north) of the study area.
The high wet deposition levels for SO42– and
NO3– in the MCMZ were similar to levels in the USA
(24 and 20 kg ha–1 in 2013 and 2014, respectively).
In all wet deposition samples, SO42– comprised a
higher percentage (60%) than NO3– and Cl–, indicat-
ing that the main precursor of acid rain is SO42–. The
SO42–/NO3
– observed ratio was of 1.5, confirming SO4
2– as the principal anion of wet atmospheric depo-sition and SO2 as the principal acid rain precursor.
It is important to establish strategies for emis-sion reduction of acid rain precursors from external sources north of Mexico City, such as the use of fuels with low-sulfur and substitution of fuel oil by natural gas, which could eliminate more than 99% of SO2 emissions.
When shifting from fuel oil to natural gas, it is im-portant to use the best available control technology for NOx, including low NOx burners, due to some negative impacts. These include acid rain and the formation of ozone, which is a severe problem in Mexico City.
AcknowledgmentsThe authors wish to thank the Mexico City sampling staff: Ernesto González C., Jorge Alberto Rodas R., Jorge Domínguez O., Miguel Sánchez R., Rocío Carmona M. and Olivia Rivera H., as well as the following personnel and students of the SCA-CCA-UNAM: Gilberto Fuentes G., Rocío Bautista B., Verónica Néquiz, Mónica Antúnez A., Cecilia Vargas C., Eduardo Zamora V, Edgardo Moreno T., Evelin Mateos D., Estivalis Rojas M. and Yael González R. We also want to express our gratitude to Ángeles López Portillo for the review of the English text, and to Dr. David Gay from the National Atmospheric Deposition Program of the USA for his comments and suggestions. We also want to acknowledge the PAPIIT-UNAM Program, projects “Evaluación de la deposición atmosférica húmeda y seca en la ZMCM y en la Costa del Golfo de México para la prevención del deterioro ambiental significativo” (PAPIIT IN116215) and “Establecimiento de la Red Nacional de Deposito Atmosférico” (PAPIIT IN112318).
ReferencesAlarcón J.A.L., Bravo A.H., Sosa E.R., Torres B.M.C.,
Sánchez A.P. 2011. Acid wet deposition in the Mex-ico City Metropolitan Zone (MCMZ). 104th Annual Conference and Exhibition of the Air and Waste Man-agement Association. Orlando, Florida. June.

68 R. Sosa-Echeverría et al.
Aldana T.P., Bravo A.H., Espinosa R.M., Sosa E.R., Tolivia M.E. and Torres B.R., 1999. Problemática de la con-taminación atmosférica en la Zona Metropolitana de la Ciudad de México. Revista del Instituto Mexicano de Ingenieros Químicos XL, 5-6, 36-37.
Bravo A.H., Saavedra R.M.I., Sánchez A.P., Sosa E.R. and Torres J.R., 1991. Impact of the acidic deposition in the decay of Mexican Mayan monuments (preliminary study). 84th Annual Conference and Exhibition of the Air and Waste Management Association. Vancouver, Canada, June 16-21.
Bravo A.H., Soto A.R., Sosa E.R. and Sánchez A.P., 2003. Efecto de la lluvia ácida en el material constituyente de los monumentos mayas mexicanos. Ingeniería, Investigación y Tecnología IV, 195-205.
Bravo A.H., Sosa E.R., Kahl J., Sánchez A.P., Alarcón J.A.L. and Soto A.R., 2006. Acid deposition events during the autumn of 2003 in a research cruise over the Gulf of Mexico. 99th Annual Conference and Ex-hibition of the Air and Waste Management Association. New Orleans, Louisiana, June.
Bravo A.H., Sosa E.R., Sánchez A.P., Quintana A.A., Paramo F.V.H., Retama A.H. and Jaimes M.P., 2012. Actual state of the air quality in Mexico City. 106th Annual Conference and Exhibition of the Air and Waste Management Association. Chicago, Illinois, June.
Carn S.A., Fioletov V.E., McLinden C.A., Li C. and Krotkov N.A., 2017. A decade of global volcanic SO2 emissions measured from space. Sci. Rep.-UK 7, 44095.DOI: 10.1038/srep44095
Delgado H.G., Cárdenas L.G. and Piedad N.S., 2001. Sulfur dioxide emissions from Popocatépetl volcano (Mexico): Case study of a high-emission rate, passively degassing erupting volcano. J. Volcanol. Geoth. Res. 108, 107-120.DOI: 10.1016/S0377-0273(00)00280-8
Elser M., El-Haddad I., Maasikmets M., Bozzetti C., Wolf R., Ciarelli G., Slowik F.G., Richter R., Teinemaa E., Huglin Ch., Baltensperger U. and Prevot A.S.H., 2018. High contributions of vehicular emissions to ammonia in three European cities derived from mobile measure-ments. Atmos. Environ. 175, 2010-2020.DOI: 10.1016/j.atmosenv.2017.11.030
Fraser M.P. and Cass G.R., 1998. Detection of excess of ammonia emissions from in-use vehicles and the impli-cations for fine particle control. Environ. Sci. Technol. 32, 1053-1057. DOI: 10.1021/es970382h
Grutter M., Basaldud R., Rivera C., Haring R., Junker-man W., Caetano E. and Delgado G.H., 2008. SO2 Emissions from Popocatépetl volcano: Emission rates and plume imaging using optical remote sensing tech-niques. Atmos. Chem. Phys. 8, 6655-6663.
Hautman D.P., Munch D. and Pfaff J.D., 1997. Deter-mination of inorganic anions in water and drinking water by ion chromatography. US-EPA Method 300.1. Available at: https://www.epa.gov/sites/production/files/2015-06/documents/epa-300.1.pdf (last accessed on May 22, 2018).
Heckel P.F., Keener T., Lu M., Bravo A.H. and 2007. A Summary of the International Workshop on the In-fluences of Air Quality on the Mayan Heritage Sites in Mesoamerica. EM: Air and Waste Management Association’s Magazine for Environmental Managers 57, 24-30.
Herut B., Starinsky A., Katz A. and Rosenfeld D., 2000. Relationship between the acidity and chemical com-position of rainwater and climatological conditions along a transition zone between large deserts and Mediterranean climate, Israel. Atmos. Environ.t 34, 1281-1292.DOI: 10.1016/S1352-2310(99)00291-5
Islas J. and Grande G., 2007. Optimization of alternative options for SO2 emissions control in the Mexican electrical sector. Energ. Policy 35, 4495-4503.DOI: 10.1016/j.enpol.2007.03.015
Krupa S.V., 2002. Sampling and physico-chemical analysis of precipitation: A review. Environ. Pollut. 120, 565-594.DOI: 10.1016/S0269-7491(02)00165-3
Lehmann C.M, Kerschner B. and Gay D., 2015. Impact of sulfur dioxide (SO2) and nitrogen oxide (NOx) emis-sions reductions on: Acidic deposition in the United States. EM: Air and Waste Management Association’s Magazine for Environmental Managers 65, 6-11.
Loÿe-Pilot M.D. and Morelli M., 1988. Fluctuations of ionic composition of precipitations collected in Corsica related to changes in the origins of incoming aerosols. J. Aerosol Sci. 19, 577-585.DOI: 10.1016/0021-8502(88)90209-1
Loÿe-Pilot M.D. and Martin J.M., 1996. Saharan dust input to the western Mediterranean: An eleven years record in Corsica. In: The impact of desert dust across the Mediterranean (Guerzoni S. and Chester R., Eds.). Envir. Sci. Tech. Lib. 11, 191-199.DOI: 10.1007/978-94-017-3354-0_18

69Spatial and temporal variation of acid rain in the MCMZ
NADP, 2014. Site selection and installation manual. Re-vised 2014-11, v. 1.9 Available at: http://nadp.slh.wisc.edu/lib/manuals/NADP_Site_Selection_and_Installa-tion_Manual_201_11.pdf (last accessed on October 15, 2018).
NADP, 2017. Atmospheric integrated research monitoring network site operations manual. AIRMoN operations manual v. 2.5. National Atmospheric Deposition Program. Available at: http://nadp.slh.wisc.edu/lib/manuals/AIRMoN_Operations_Manual_v_2-5.pdf (last accessed on October 15, 2018).
NADP, 2018. Retrieve NTN data for all sites. National Atmospheric Deposition Program. Available at: http://nadp.slh.wisc.edu/data/NTN/ntnAllsites.aspx (last accessed on October 15, 2018).
Praveen P.S., Rao P.S.P., Safai P.D., Devara P.C.S., Chate D.M., Ali K. and Momin G.A., 2007. Study of aerosol transport through precipitation chemistry over Arabian Sea during winter and summer monsoons. Atmos. Environ. 41, 825-836.DOI: 10.1016/j.atmosenv.2006.08.049
R Development Core Team, 2011. R: A language and en-vironment for statistical computing. The R Foundation for Statistical Computing, Vienna, Austria. Available at: http://www.R-project.org/ (last accessed on October 15, 2018).
Sosa R.E., Sánchez A.P., Alarcón J.A., Torres B.M., Granados H.E., Fuentes G.G. and González R.A., 2017. Análisis del estado del arte sobre el depósito atmosféri-co en México y su relación con el cambio climático. Informe Final INECC/RPA1.003/2017. Instituto Na-cional de Ecología y Cambio Climático, México, 317 pp. Available at: https://www.gob.mx/cms/uploads/attachment/file/311177/Informe_Final_Deposito_At-mosferico.pdf (last accessed on November 26, 2018).
SIMAT, 2015. Calidad del aire en la Ciudad de México. Informe anual 2014. Available at: http://www.aire.cdmx.gob.mx/descargas/publicaciones/flippingbook/informe-2014-calidad-del-aire-en-la-ciudad-de-mex-ico/mobile/index.html (last accessed on November 26, 2018).
Stumm W. and Morgan J.J., 1970. Aquatic chemistry: An introduction emphasizing chemical equilibria in natural waters. Wiley-Interscience, New York, 583 pp.DOI: 0.1002/aheh.19730010116
US-EPA, 1991. Guidelines: Air quality surveillance net-works. AP-98. United States Environmental Protection Agency, Research Triangle Park, NC, USA.
US-EPA, 1994. Quality assurance handbook for air pol-lution measurement systems. Vol. V. Precipitation measurement systems. EPA-600, R-94, 038e. United States Environmental Protection Agency, Research Triangle Park, NC, USA.
Wood S.N., 2006. Generalized additive models: An in-troduction with R. Chapman & Hall/CRC Texts in Statistical Science, 476 pp.
Wood S.N., 2014. Mixed GAM computation vehicle with GCV/AIC/REML smoothness estimation. Package mgcv v. 1.8-4. Available at: https://cran.r-project.org/web/packages/mgcv/mgcv.pdf (last accessed on November 26, 2018).
WMO, 2004. Guidelines, data quality objectives and stan-dard operating procedures. Manual for the GAW Pre-cipitation Chemistry Programme. Global Atmosphere Watch No. 160. World Meteorological Organization, Geneva, 182 pp.