spatial epidemiology: gis and geostatistical applications ... · spatial epidemiology: gis and...
TRANSCRIPT
Spatial Epidemiology: GIS and Geostatistical Applications for Public Health
Sacramento Area GIS Users Group Symposium
Sacramento, CA
November 27, 2012
Thomas J. Stopka, PhD, MHS Maternal, Child and Adolescent Health, CDPH,
University of California, Davis
Overview
• Epidemiology / Public Health
• **Spatial epidemiology**
• **GIS applications** for public health
– Infant nutrition in Africa: Social mapping
– Pharmacy availability: Hot-spot analysis
– Crime and HIV prevention: Areal interpolation
– HIV prevention and pharmacy use: Spatial analysis
– Women, Infants and Children (WIC): Hot-spot clusters
• Interactive online maps and future directions
???
• Public Health?
• Epidemiology?
Do you speak Greek?
• Epidemiology: "the study of what is upon the people“
– epi = upon, among
– demos = people, district
– logos = study, word, discourse
http://en.wikipedia.org/wiki/Epidemiology
What is epidemiology?
• Epidemiology: “The study of how diseases (health related states) are distributed in populations and the factors that influence or determine this distribution”
Source: Gordis, 3rd Edition
What is spatial epidemiology?
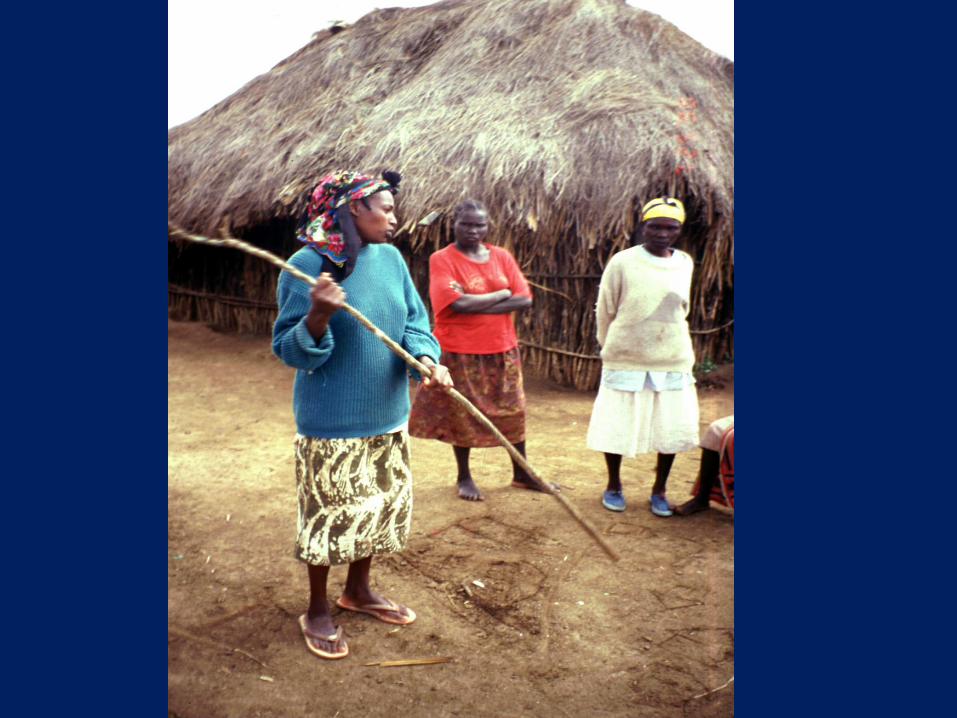
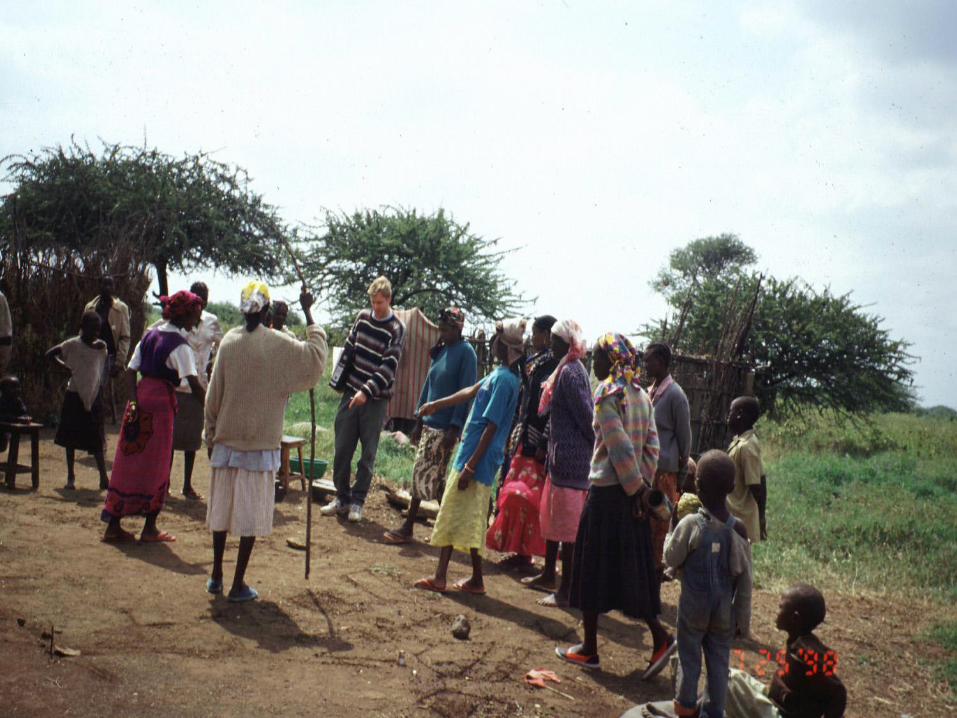
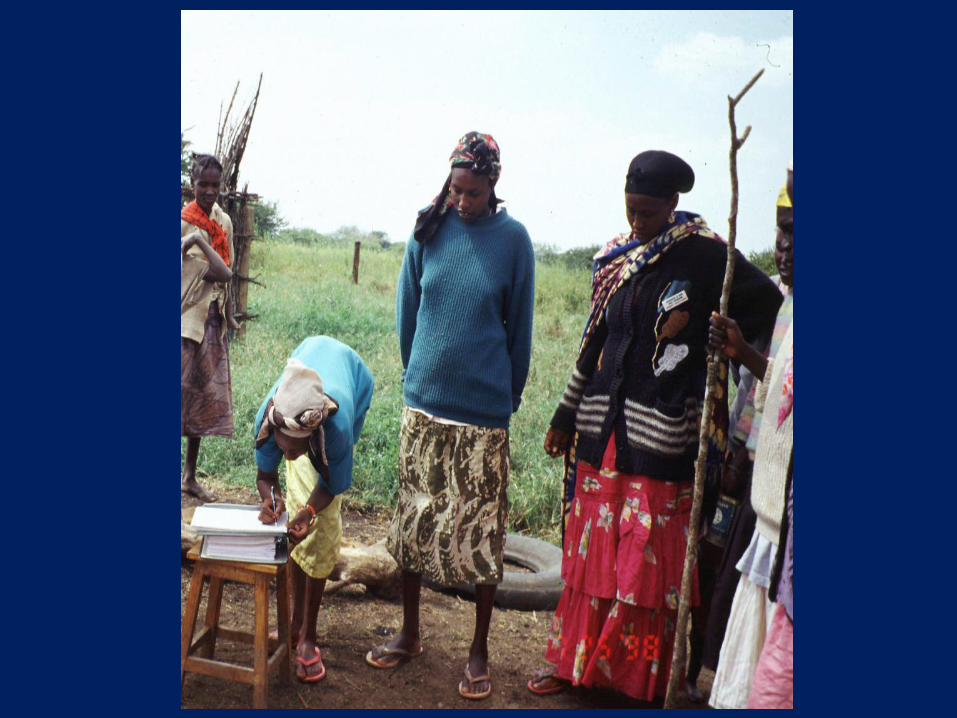
Example 1: Social Mapping** and Infant Feeding
• What foods are given to infants and when?
– Nyeri, Kenya
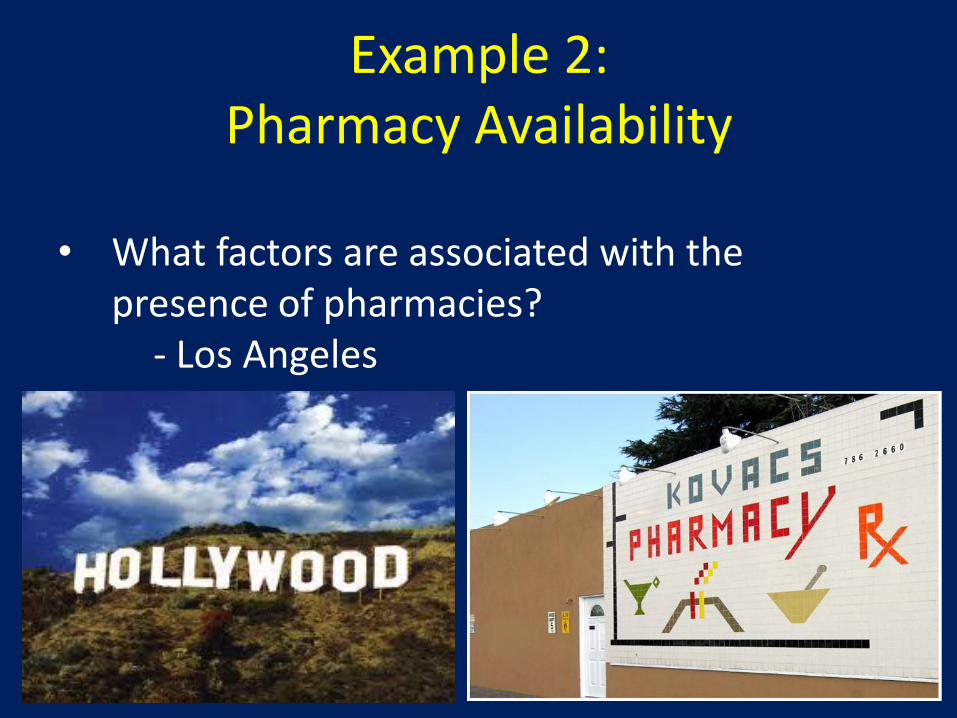
Example 2: Pharmacy Availability
• What factors are associated with the presence of pharmacies?
- Los Angeles
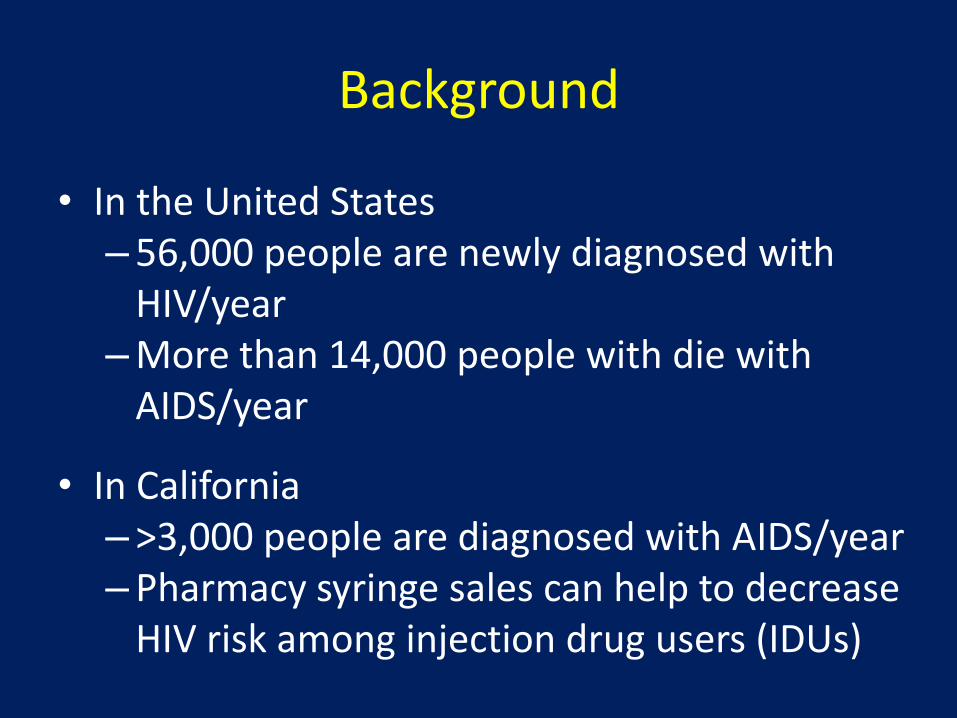
Background
• In the United States –56,000 people are newly diagnosed with
HIV/year –More than 14,000 people with die with
AIDS/year
• In California –>3,000 people are diagnosed with AIDS/year –Pharmacy syringe sales can help to decrease
HIV risk among injection drug users (IDUs)
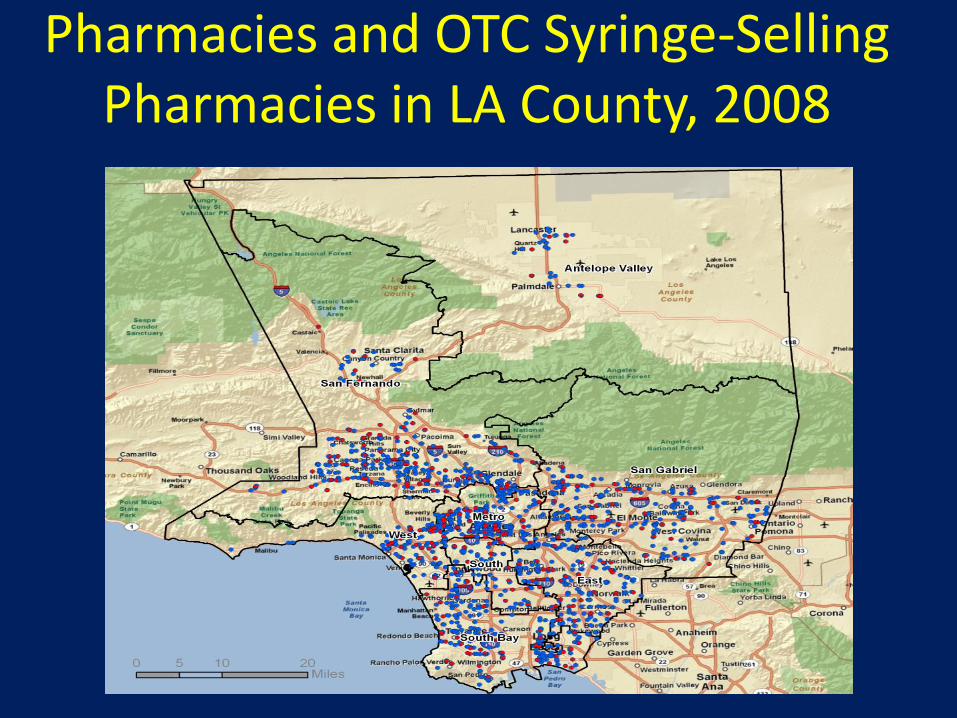
Pharmacies and OTC Syringe-Selling Pharmacies in LA County, 2008
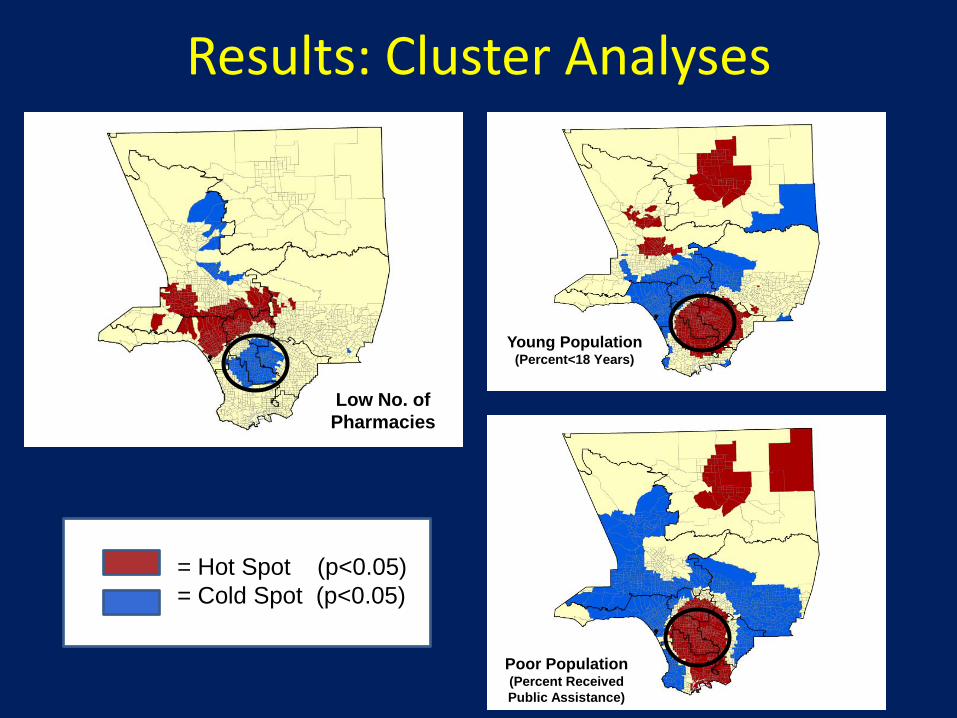
Results: Cluster Analyses
Young Population (Percent<18 Years)
Low No. of
Pharmacies
Poor Population (Percent Received
Public Assistance)
= Hot Spot (p<0.05)
= Cold Spot (p<0.05)
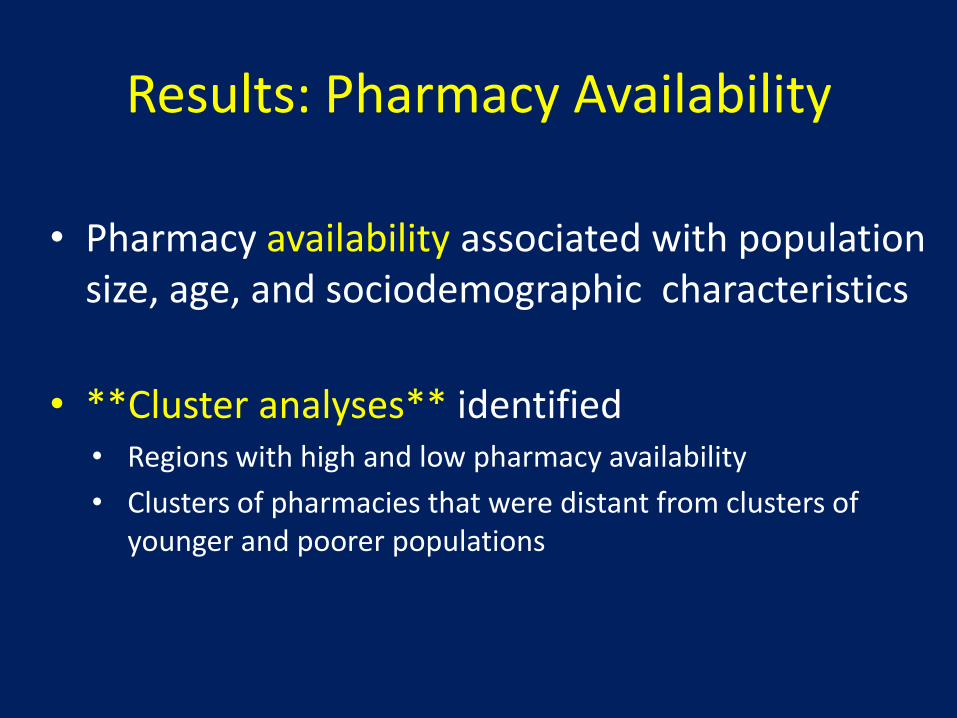
Results: Pharmacy Availability
• Pharmacy availability associated with population size, age, and sociodemographic characteristics
• **Cluster analyses** identified • Regions with high and low pharmacy availability
• Clusters of pharmacies that were distant from clusters of younger and poorer populations
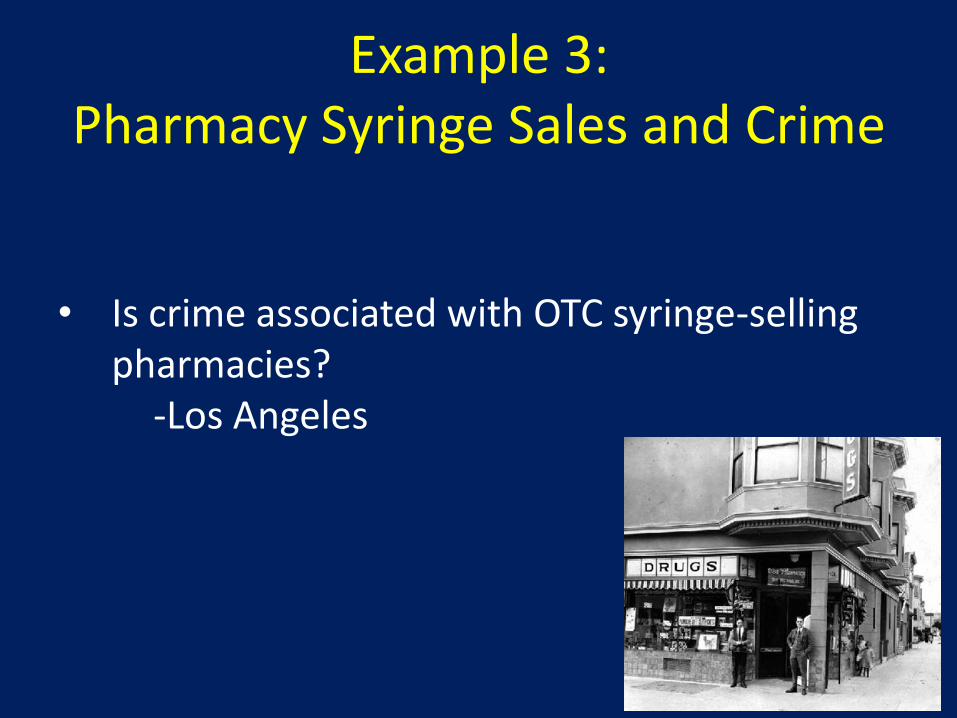
Example 3: Pharmacy Syringe Sales and Crime
• Is crime associated with OTC syringe-selling pharmacies?
-Los Angeles
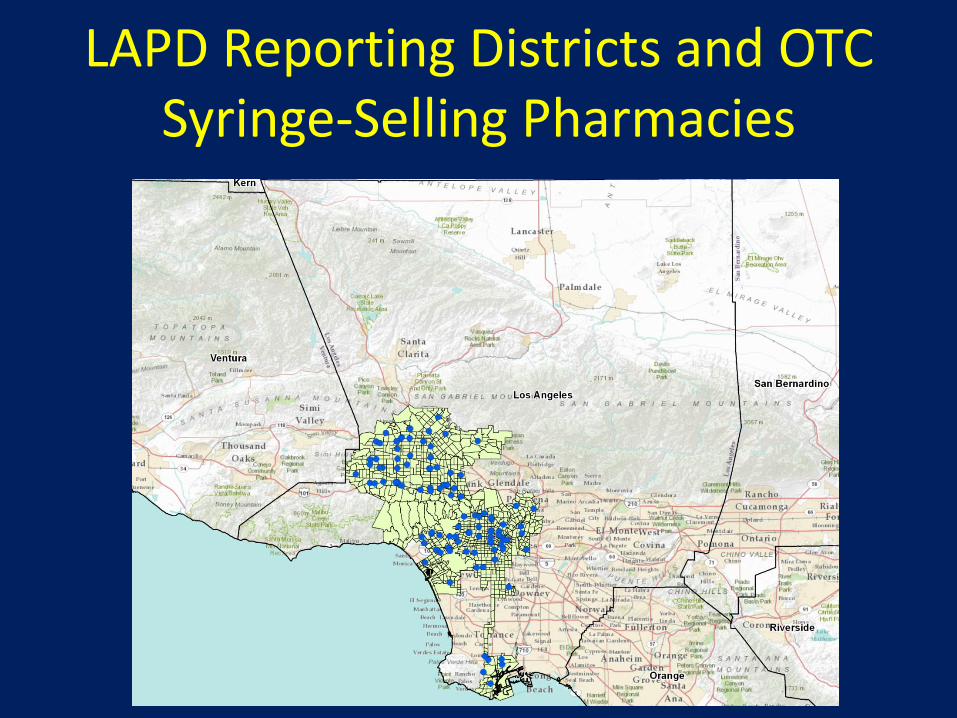
LAPD Reporting Districts and OTC Syringe-Selling Pharmacies
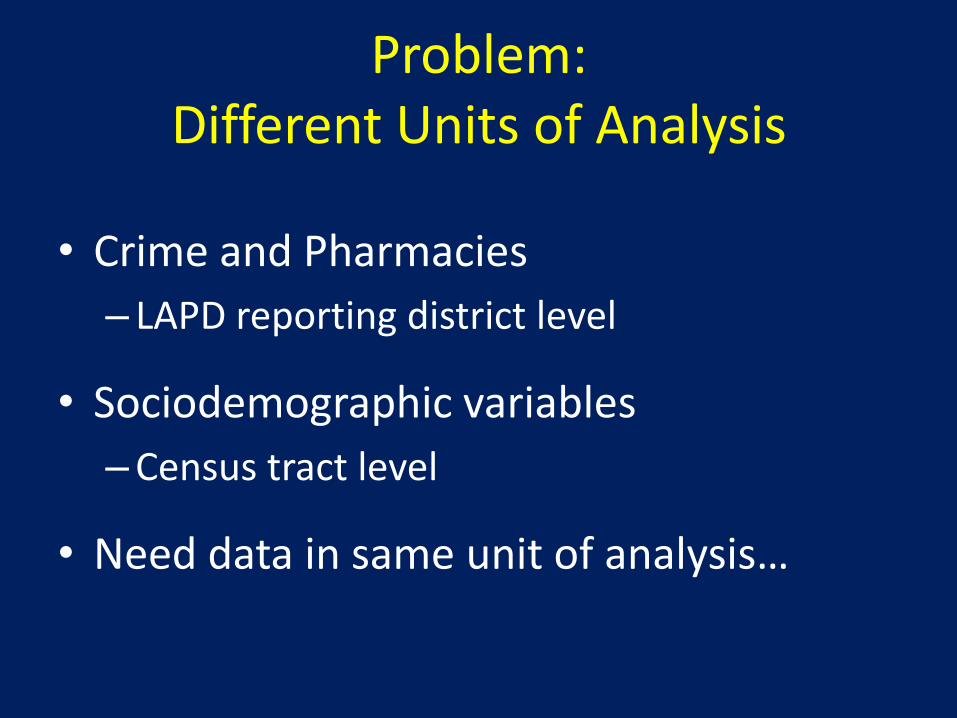
Problem: Different Units of Analysis
• Crime and Pharmacies
– LAPD reporting district level
• Sociodemographic variables
–Census tract level
• Need data in same unit of analysis…
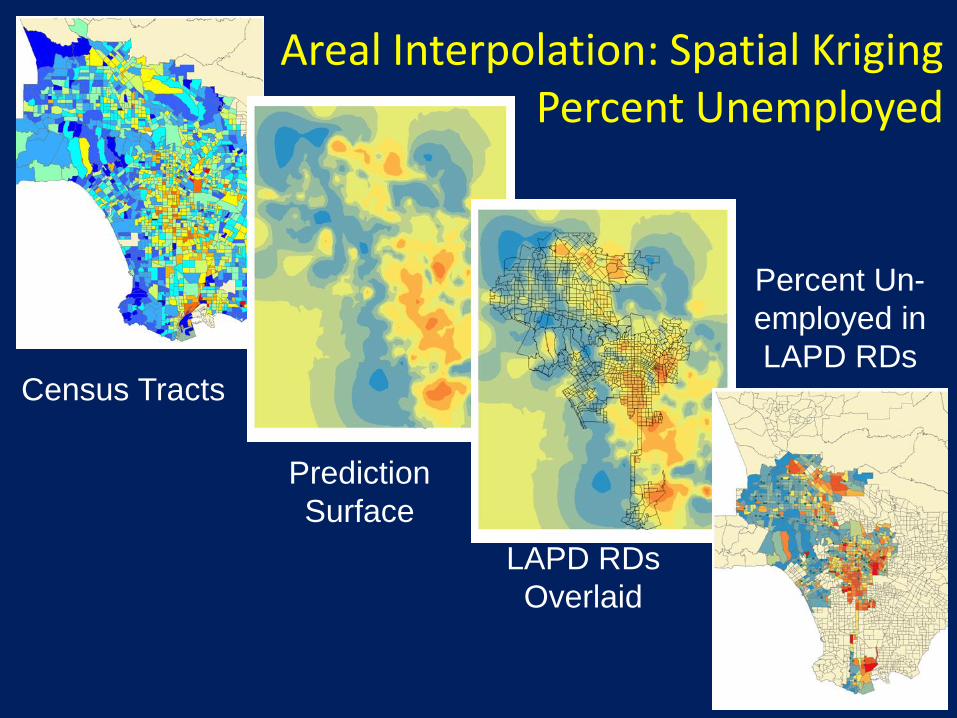
Areal Interpolation: Spatial Kriging Percent Unemployed
Census Tracts
Percent Un-
employed in
LAPD RDs
LAPD RDs
Overlaid
Prediction
Surface
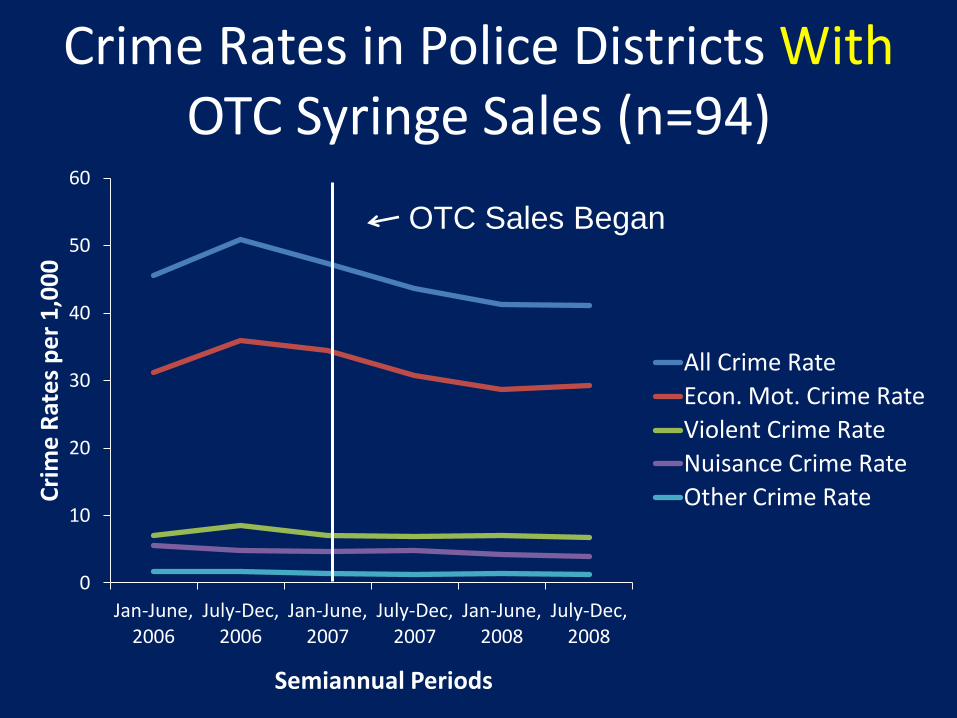
Crime Rates in Police Districts With OTC Syringe Sales (n=94)
0
10
20
30
40
50
60
Jan-June, 2006
July-Dec, 2006
Jan-June, 2007
July-Dec, 2007
Jan-June, 2008
July-Dec, 2008
Cri
me
Rat
es
pe
r 1
,00
0
Semiannual Periods
All Crime Rate
Econ. Mot. Crime Rate
Violent Crime Rate
Nuisance Crime Rate
Other Crime Rate
OTC Sales Began
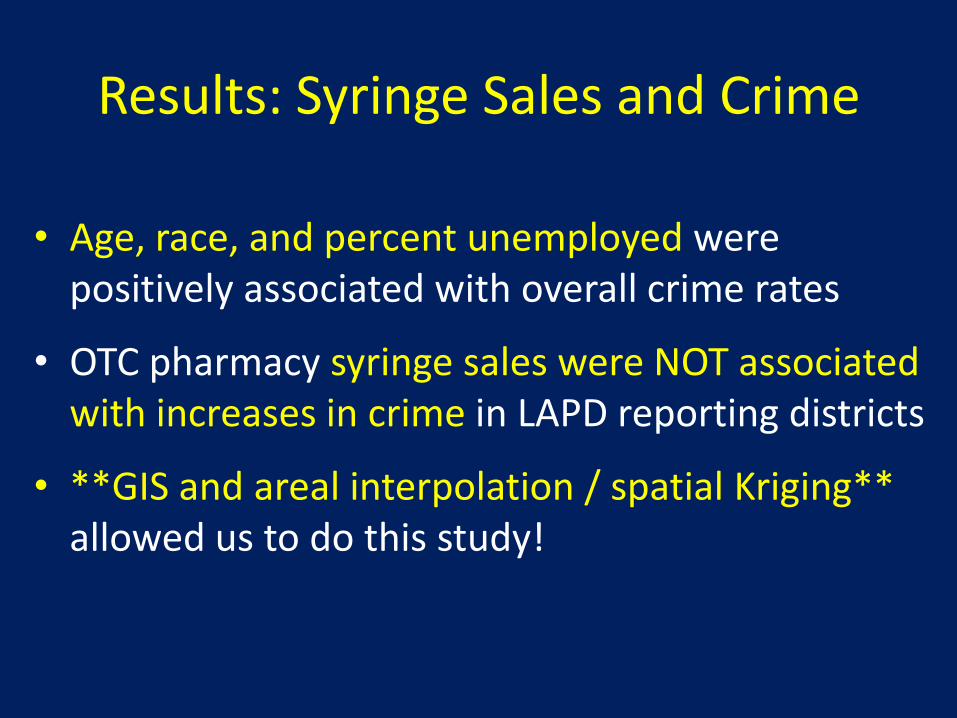
Results: Syringe Sales and Crime
• Age, race, and percent unemployed were positively associated with overall crime rates
• OTC pharmacy syringe sales were NOT associated with increases in crime in LAPD reporting districts
• **GIS and areal interpolation / spatial Kriging** allowed us to do this study!
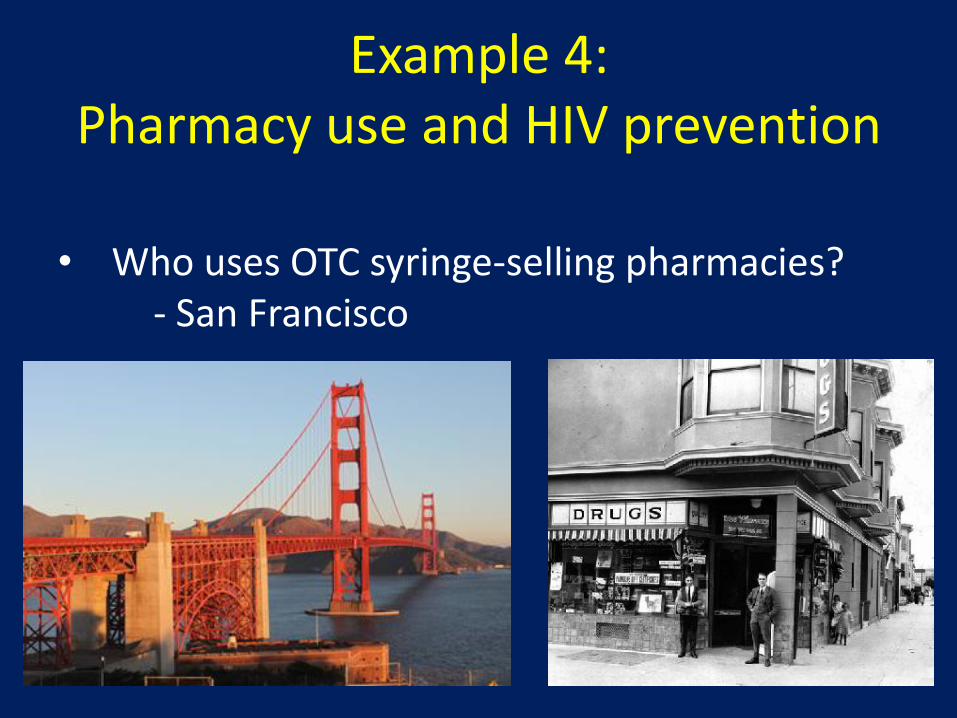
Example 4: Pharmacy use and HIV prevention
• Who uses OTC syringe-selling pharmacies? - San Francisco
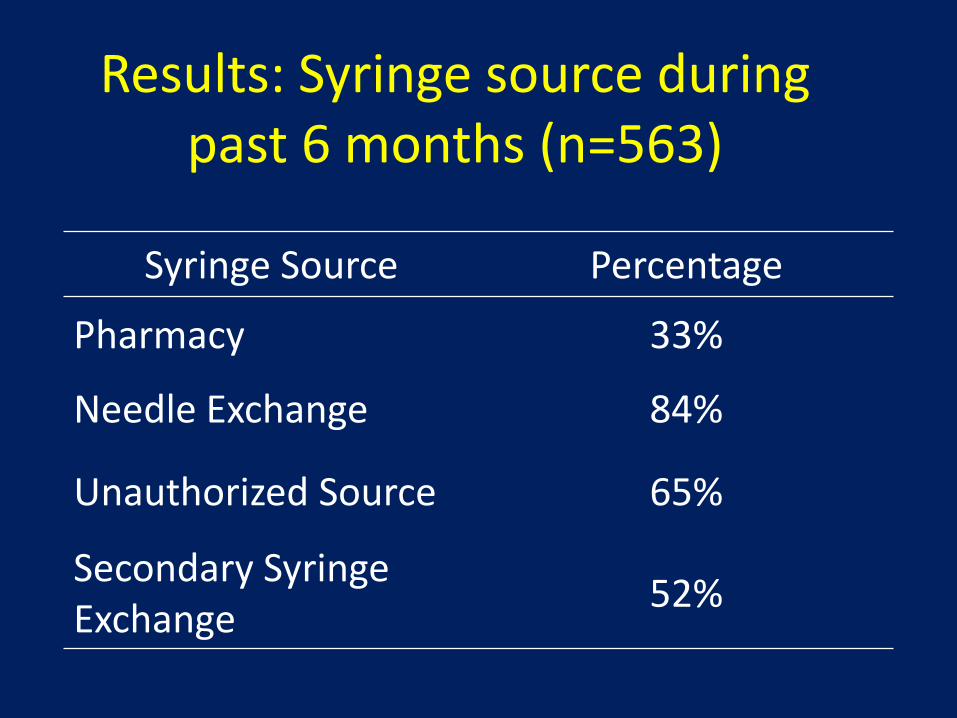
Results: Syringe source during past 6 months (n=563)
Syringe Source Percentage
Pharmacy 33%
Needle Exchange 84%
Unauthorized Source 65%
Secondary Syringe Exchange
52%
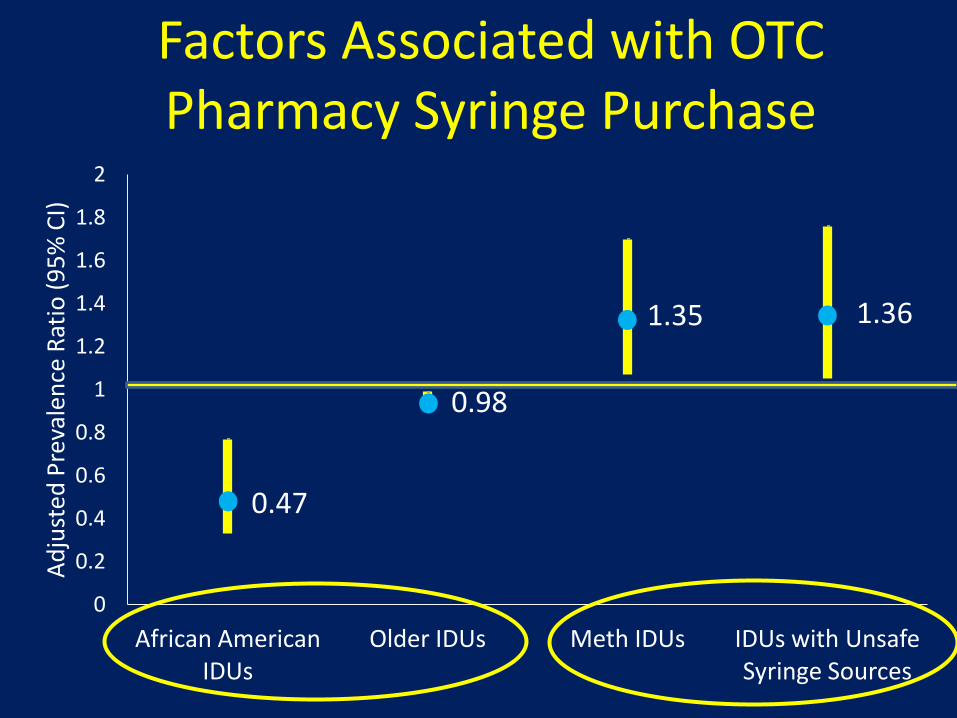
Factors Associated with OTC Pharmacy Syringe Purchase
0.47
0.98
1.35 1.36
0
0.2
0.4
0.6
0.8
1
1.2
1.4
1.6
1.8
2
African American IDUs
Older IDUs Meth IDUs IDUs with Unsafe Syringe Sources
Ad
just
ed P
reva
len
ce R
atio
(9
5%
CI)
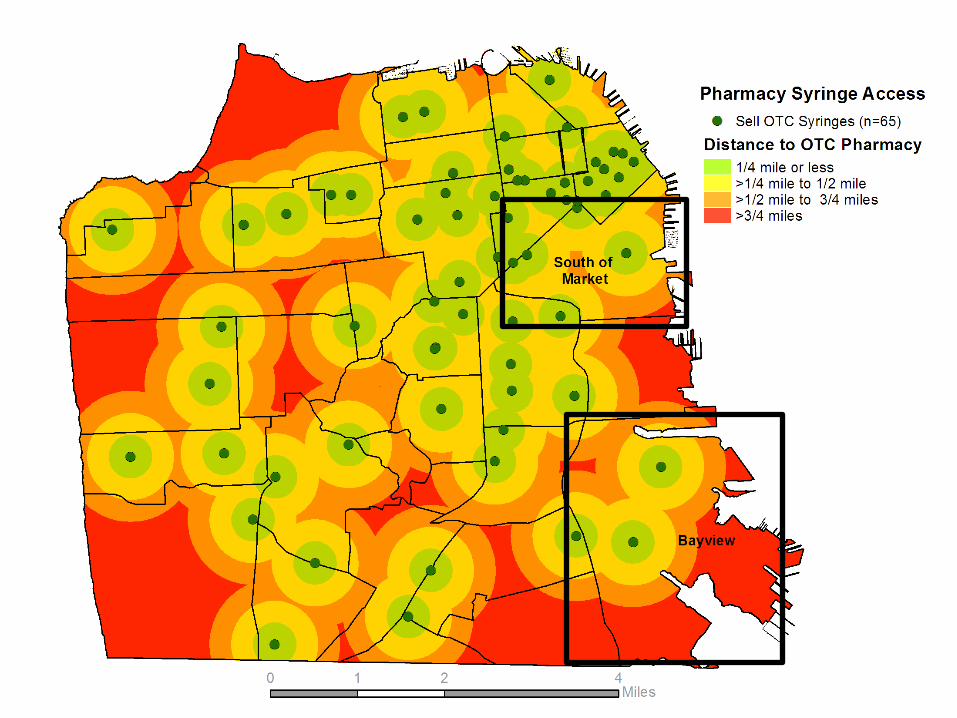
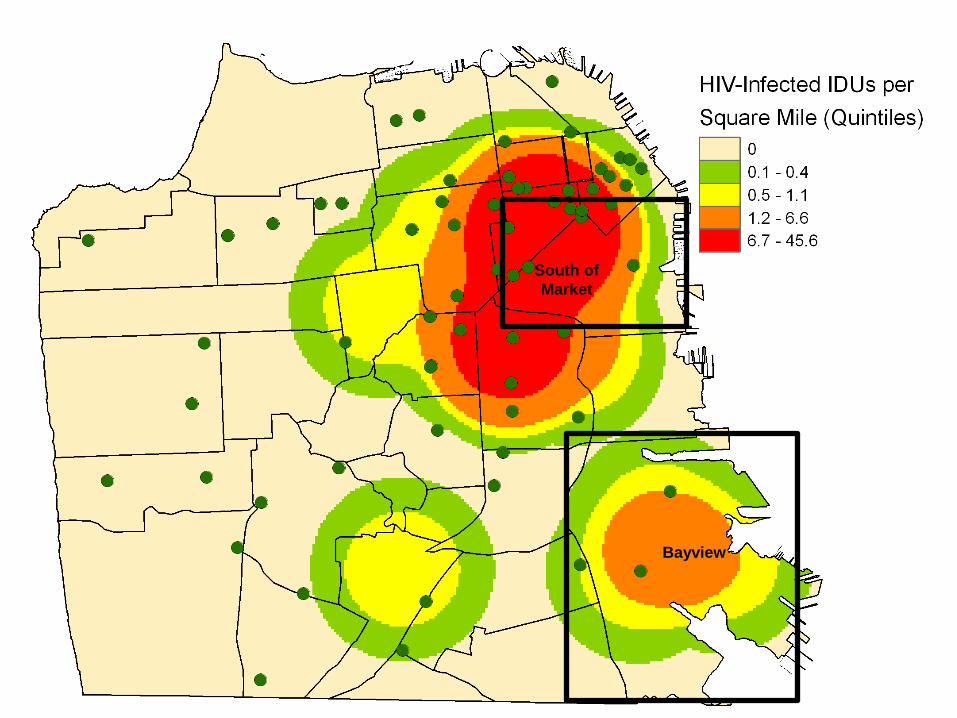
South of
Market
Bayview
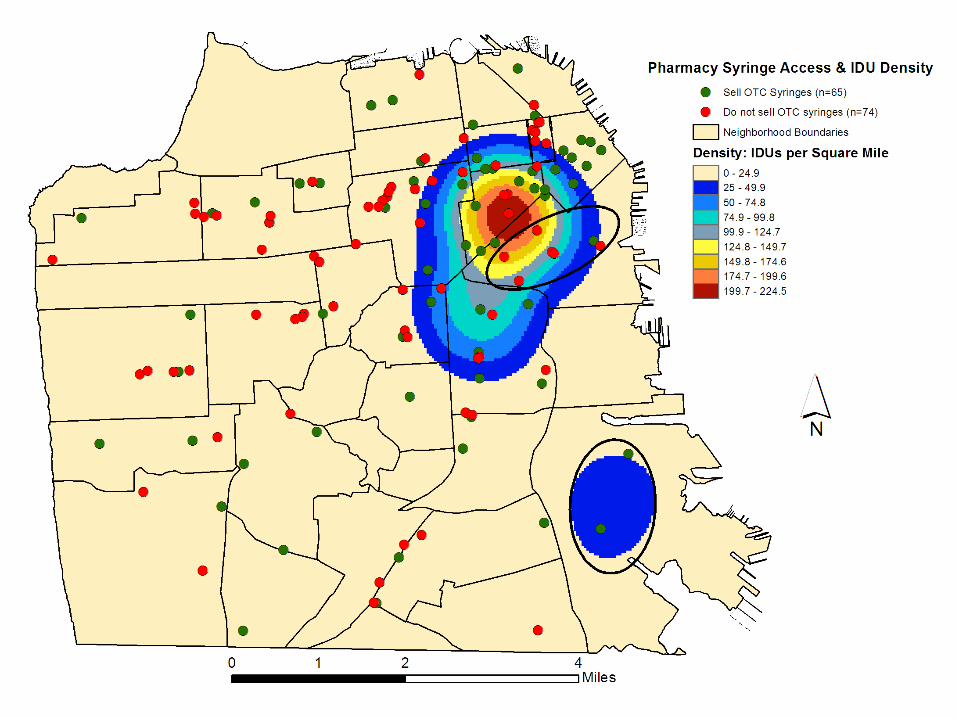
Results: Pharmacy use and HIV Prevention
• OTC pharmacy syringe purchase among IDUs was associated with race, drug of choice, and use of unsafe syringe sources
• **Spatial analyses** highlighted neighborhoods that need improved access to safe syringes and HIV prevention
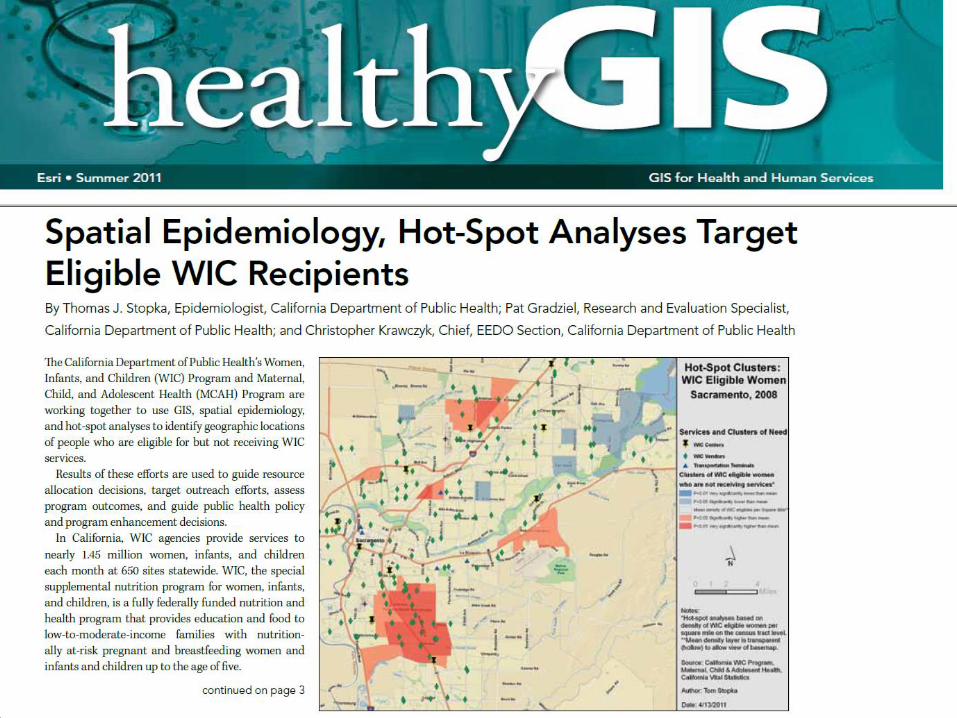
Example 5: Targeting Women Infant and Children (WIC)
Nutrition Services
• Where are clusters of WIC eligible non-participants (ENPs)?
– California
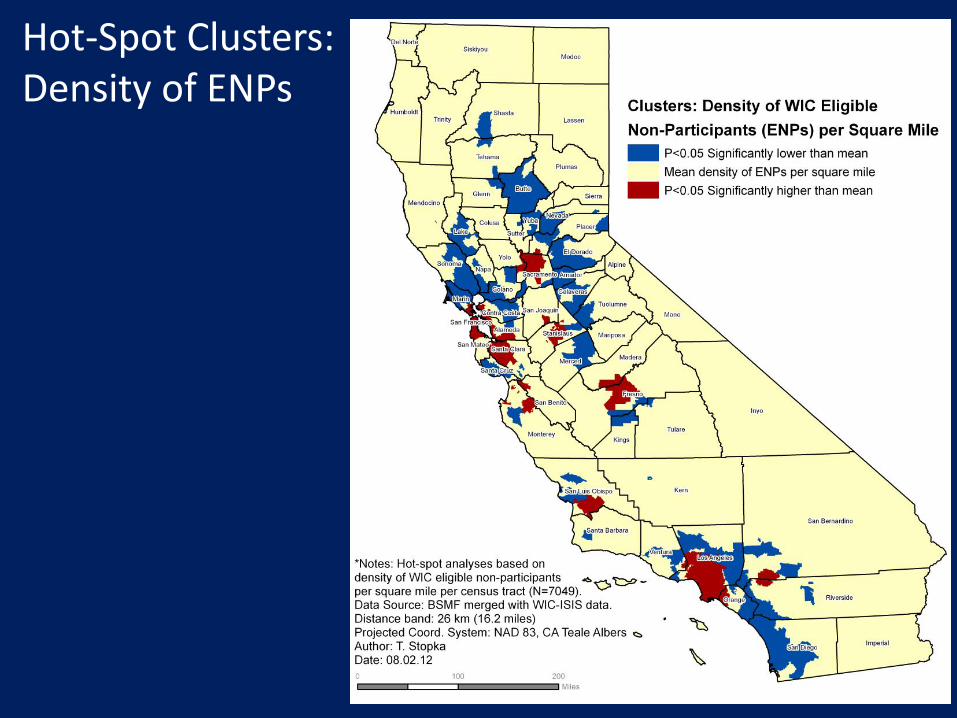
Hot-Spot Clusters: Density of ENPs
2010
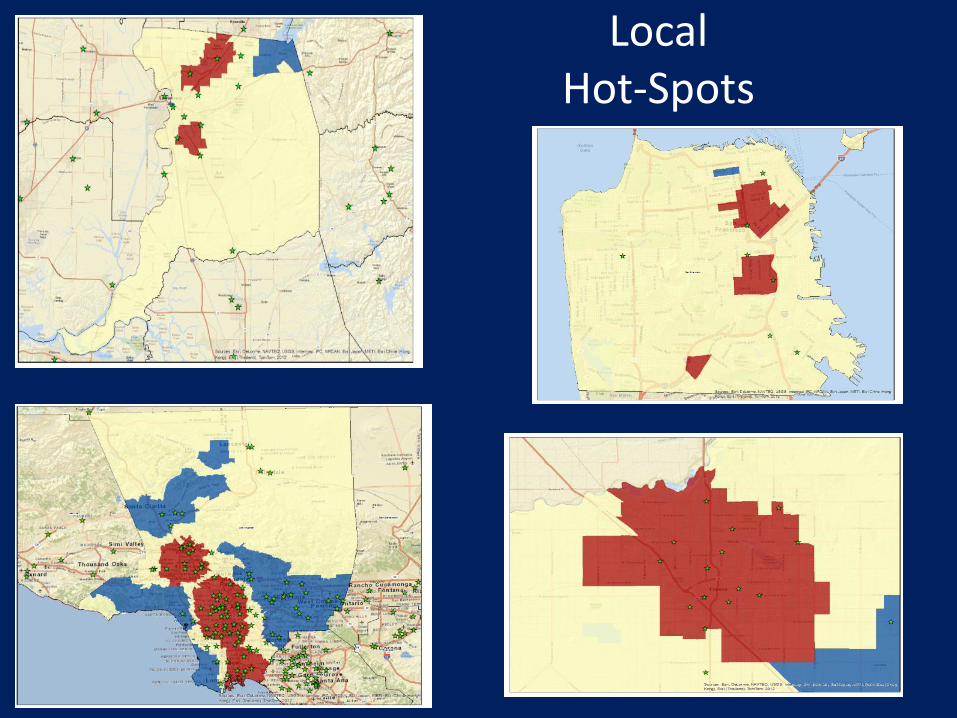
Local Hot-Spots
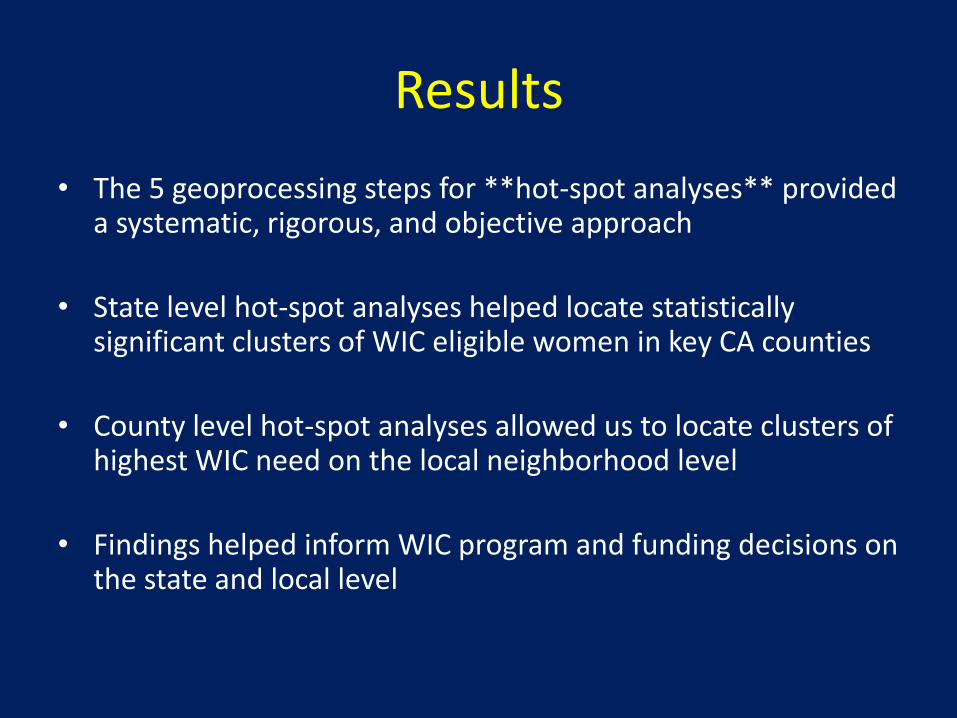
Results
• The 5 geoprocessing steps for **hot-spot analyses** provided a systematic, rigorous, and objective approach
• State level hot-spot analyses helped locate statistically significant clusters of WIC eligible women in key CA counties
• County level hot-spot analyses allowed us to locate clusters of highest WIC need on the local neighborhood level
• Findings helped inform WIC program and funding decisions on the state and local level
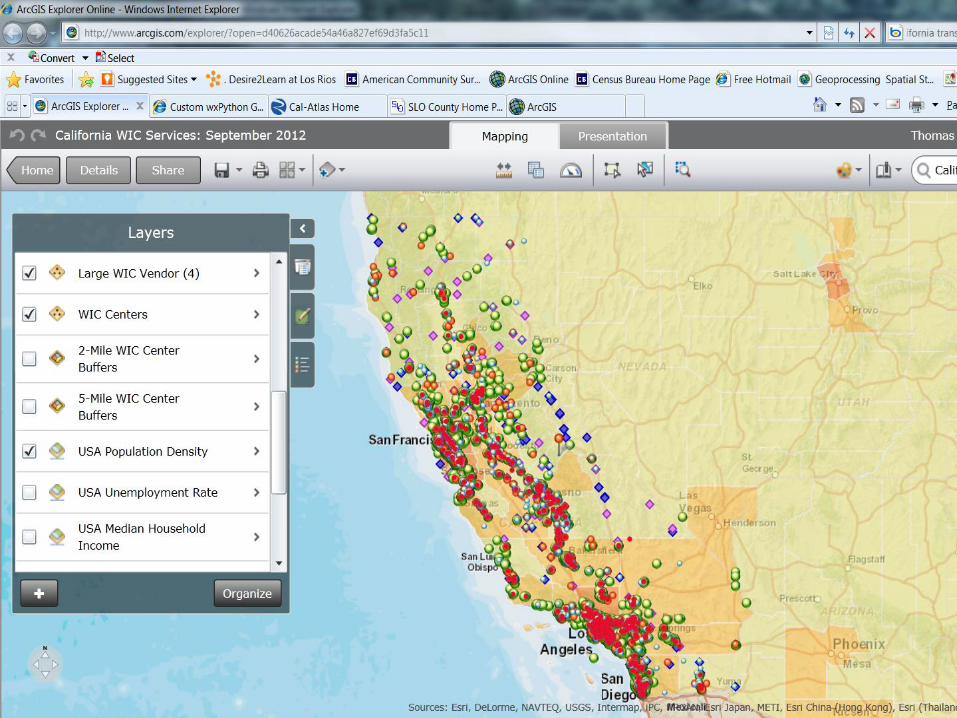
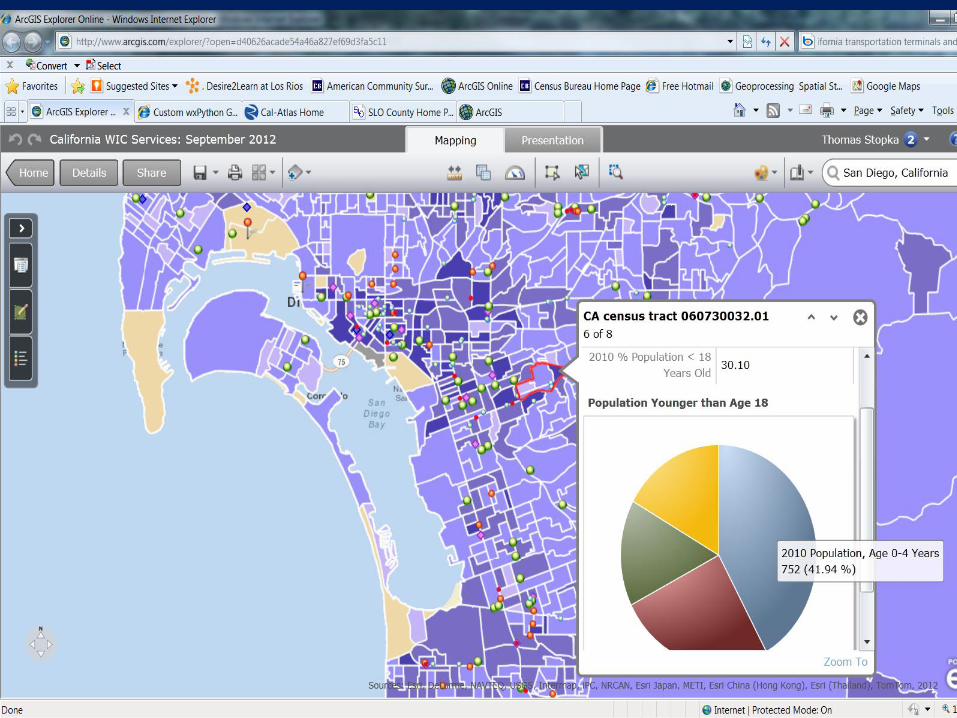
Interactive Maps and Future Directions
• Can we put helpful GIS and spatial analysis tools in the hands of stakeholders?
– California
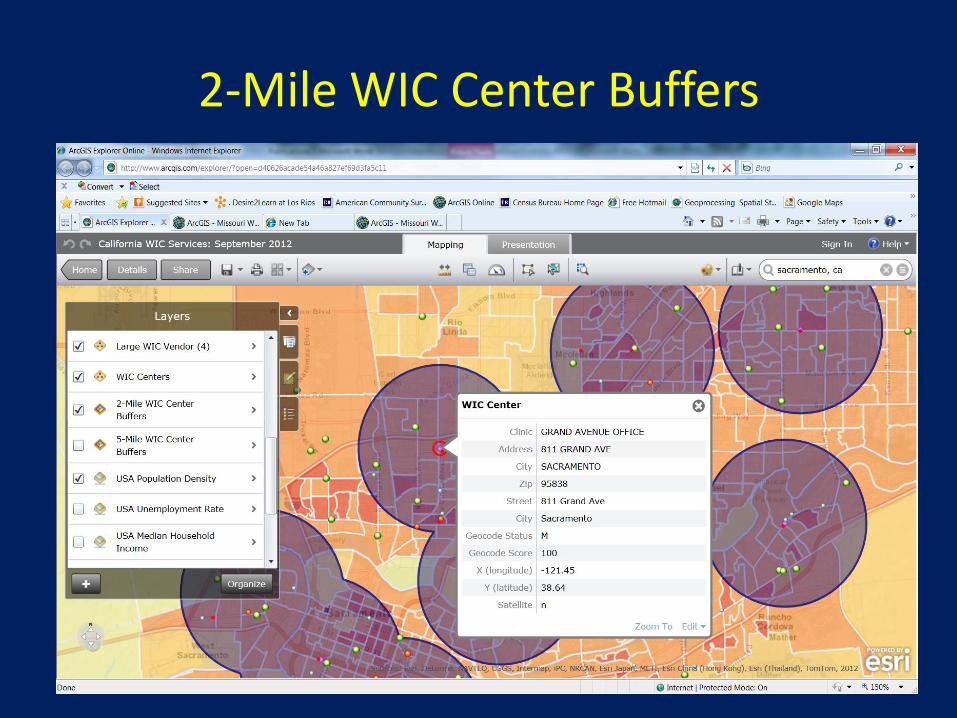
2-Mile WIC Center Buffers
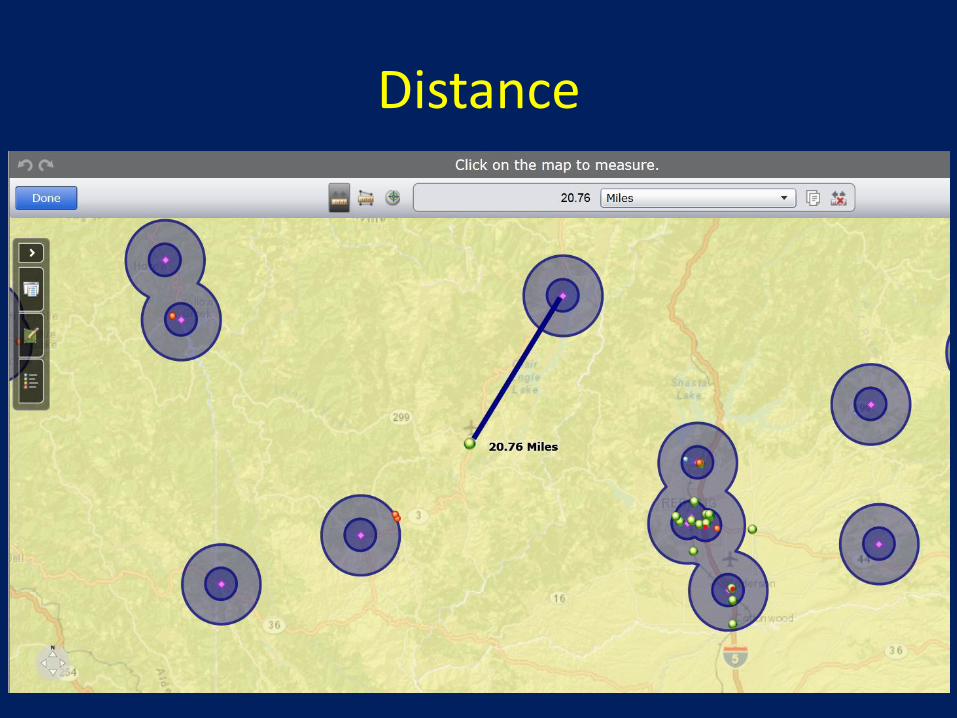
Distance
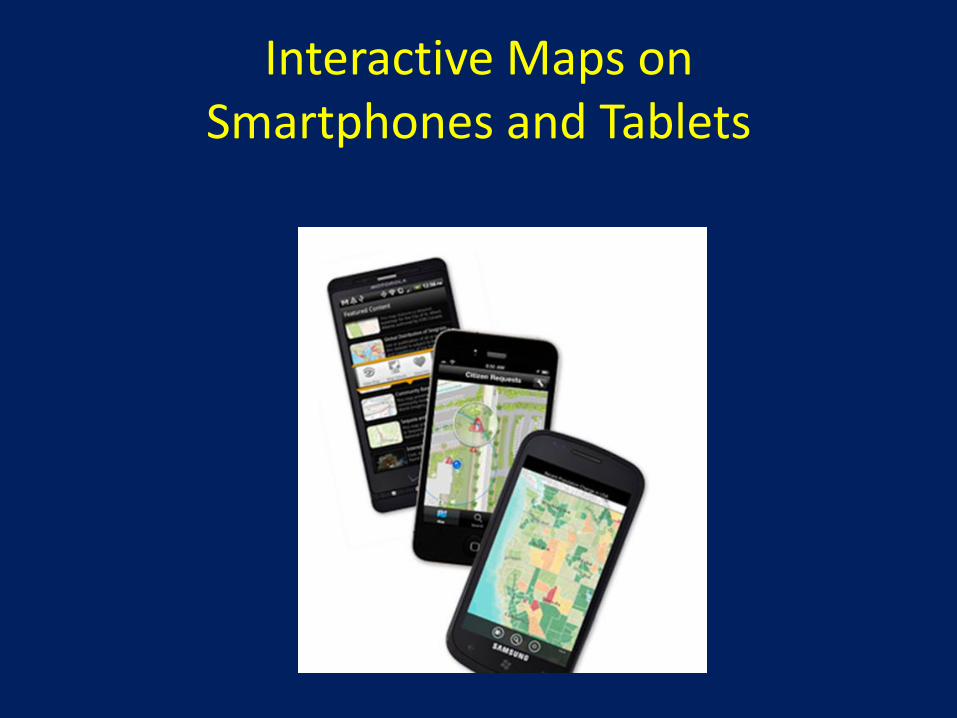
Interactive Maps on Smartphones and Tablets
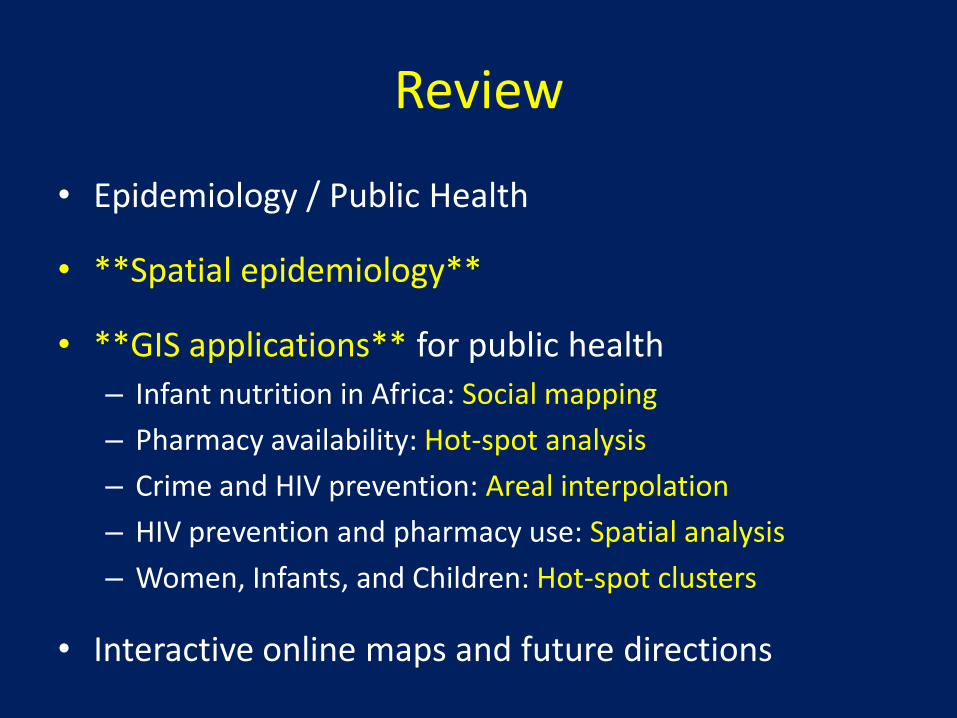
Review
• Epidemiology / Public Health
• **Spatial epidemiology**
• **GIS applications** for public health
– Infant nutrition in Africa: Social mapping
– Pharmacy availability: Hot-spot analysis
– Crime and HIV prevention: Areal interpolation
– HIV prevention and pharmacy use: Spatial analysis
– Women, Infants, and Children: Hot-spot clusters
• Interactive online maps and future directions
Public Health Impact
• Will science inform policy?
Public Health Impact
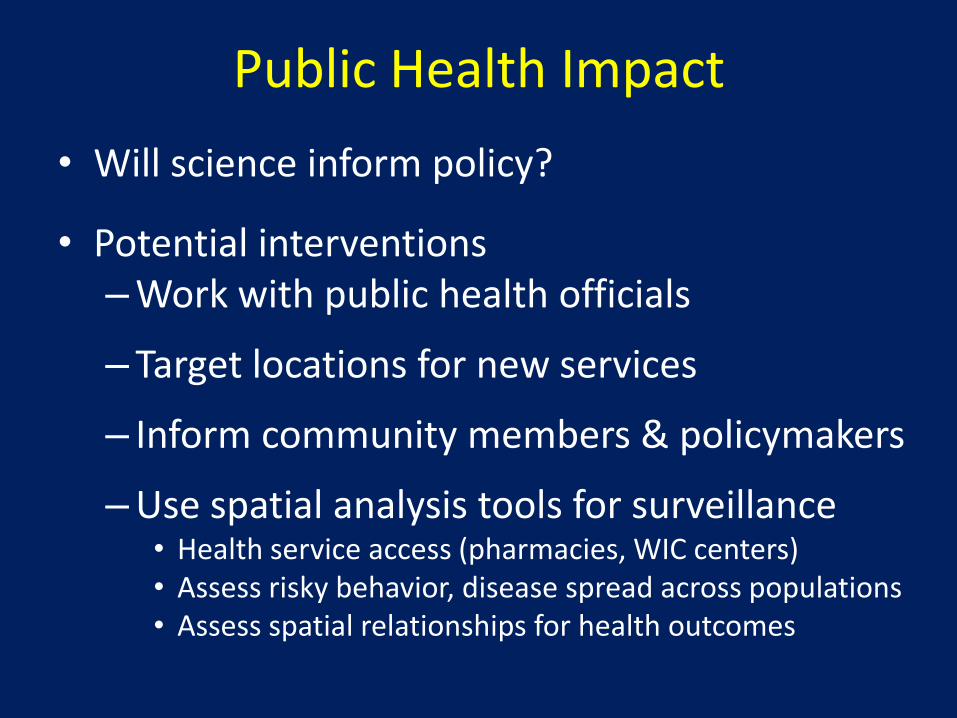
• Will science inform policy?
• Potential interventions –Work with public health officials
– Target locations for new services
– Inform community members & policymakers
–Use spatial analysis tools for surveillance • Health service access (pharmacies, WIC centers) • Assess risky behavior, disease spread across populations • Assess spatial relationships for health outcomes
Thank you!
Questions?
Sacramento Area GIS Users Group Symposium
Sacramento, CA
November 27, 2012
Thomas J. Stopka, PhD, MHS Maternal, Child and Adolescent Health, CDPH,
University of California, Davis