spatial heterogeneity in ecology
TRANSCRIPT

1
Spatial Heterogeneity in Ecology
Michael Arthur Mealor
Department of Biological and Environmental Sciences
University of Stirling
Submitted for the degree of Doctor of Philosophy
November 2004
2
Declaration
The work described here was carried out in the Department of Biological and
Environmental Sciences at the University of Stirling. All the work is my own, unless
stated otherwise, and it has not been submitted previously for a degree at this or any
other institution.
Signed…………………………………………………. Date………………………….

3
Acknowledgements
Thanks to Mike Boots for supervising and reading all the endless drafts. Thanks to
NERC for being named after a Ronnie Barker catchphrase and funding this work.
Cheers to Gillian Telford, who had to count endless numbers of Plodia and mix lots
of honey into a make of baby food that ceased to exist half way through the thesis.
The experimental stocks were started using moths donated by the kind people at the
universities of Liverpool and Dundee. Patrick Vail supplied virus all the way from
America. Kris Kirby was awfully nice, and showed me how to extract virus despite
Tony Blair’s failing government policy on broken ultracentrifuges. Heather Rae and
Rebecca Finley at Sheffield completely saved Chapter 5 by counting virus and
helping with the bioassays. Cheers Heather and Rebecca.
Thanks to Mum for giving birth to me and helping out in the final year. Dad can be
found in Chapters 5 and 6. Gran, Simon, Angela and Toni were very nice and offered
lots of support. Thanks Simon, Gran, Toni and Angela. Hello to Chris, Jenny and
Peter, who shared the Stirling office.
I’m obliged to all members of the Verbwhore collective: 2000-2003.
Finally I’m grateful to Tabetha Newman for showing me the urban foxes of Bristol.
This PhD killed me.

4
Chapter 1 General Introduction………………………………………………....….1
Aims…………………………………………………………………………………...…..2
Plodia interpunctella...…….……………….…………………………………………...….2
Plodia interpunctella and its granulosis virus…………………………...……...…4
Plodia interpunctella and laboratory experiments………………………...……….6
Granulosis Virus…………………………………………………………………………...8
Spatial Heterogeneity…………………………………………………………….………11
Life History Trade-Offs………………………………………………………...….….….14
Thesis Outline…………………………………………………………………...….….…18
Chapter 2 The Development of Spatial Techniques in the Laboratory…....……20 Introduction………………………………………………………………………...…….21
Method……………………………………………………………………………...…….27
Plodia and Ephestia………………………………………………...………...…..27
The food medium…………………………………………….……………...…….27
The effect of increasing food viscosity on larval movement rates…………….…..29
The effect food has on larval development time, pupal weight and survival…..….31
Results…………………………………………………………………………………....32
Viscosity and movement rates……………………………….………...………….32
The effect of food viscosity on development time, pupal weight and survival..…...38
Discussion………………………………………………………………………...……....40
Chapter 3 Spatial Structure and Competition in Two Lepidopteran Species
Plodia interpunctella and Ephestia cautella………………...…………………….45
Abstract……………………………………………………………...……….…………...46
Introduction…………………………………………………………...………………….47
Method…………………………………………………………………...…………….…51
Results……………………………………………………………………...…………….55
Growth rate in intraspecific competition……………………...……...…………..55
5
Growth rate in interspecific competition ………………..…………………....…..57
Survival in intraspecific competition……………………………………………………60
Survival in interspecific competition …………………………..…...…….………62
Discussion…………………………………….…………………...……………………...65
Intraspecific competition……………………………………………….…………65
Coexistence between Plodia and Ephestia……………………...………………...68
Previous empirical studies of spatial heterogeneity and competition…...…....…..71
Chapter 4 Spatial Heterogeneity and the Dynamics of the Plodia interpunctella –
Granulosis Virus system………………………………...…………….……………73
Abstract…………………………………………………...….…………………………...74
Introduction………………………………………………...…………………………….75
Method………………………………………………………..….….……………………80
Results…………………………………………………………...……………………….83
No virus populations……………………………………...………….……………83
With virus populations……………………………………...……….…………….88
Discussion…………………………………………………………...…….……………...94
Spatial dynamics in the absence of PiGV……………………...…………….……94
Spatial dynamics in the presence of PiGV……………………...………………...96
Chapter 5 The Evolution of Baculovirus Infectivity in Spatially Structured
Insect Populations system……………………….…………………..…………....102
Abstract……………………………………………………….…………...…………….103
Introduction………………………………………………………………...…………...104
Method……………………………………………………………………....…………..108
Results………………………………………………………………………...……...…112
Discussion………………………………………………………………….…...……….117
6
Chapter 6 Dimorphic Resistance Patterns Suggest a Decreasingly Costly
Resistance Mechanism in a Model Insect System.…………………..…...….…..121
Abstract……………………………………………………….………………...……….122
Introduction……………………………………………………………………...……...123
Method…………………………………………………...……………………………...126
The system…………………………………………...…………………………..126
The method of determining variation in resistance……...……………….……...126
Results……………………………………………………………...…………………...127
Discussion…………………………………………………………...……….………….131
Chapter 7 General Discussion…………………………………….......…………..134
Methods of Investigating Spatial Structure……………………………...……………...135
Differences between Plodia and Ephestia Movement……………………...…………...138
Competition and Space Structure………………………………………...……………..139
Infection and Host Spatial Structure………………………….……………...………….142
Variation in Life History Traits: Resistance……………………………….…...……….145
Concluding Remarks……………………………………………………………...…….146
Appendices…………………………………………….…………………………...147
Appendix 1 – Granulosis virus extraction……………………………………...……….148
Appendix 2 – Methods of virus counting……………………………………...………..152
References…………………………………………………………………...…….154

7
General Abstract
This project predominantly investigated the implications of spatial heterogeneity in
the ecological processes of competition and infection.
Empirical analysis of spatial heterogeneity was carried out using the lepidopteran
species Plodia interpunctella. Using differently viscous food media, it was possible to
alter the movement rate of larvae. Soft Foods allow the movement rate of larvae to be
high, so that individuals can disperse through the environment and avoid physical
encounters with conspecifics. Harder foods lower the movement rate of larvae,
restricting the ability of individuals to disperse away from birth sites and avoid
conspecifics encounters. Increasing food viscosity and lowering movement rate
therefore has the effect of making uniform distributed larval populations more
aggregated and patchy.
Different spatial structures changed the nature of intraspecific competition, with
patchy populations characterised by individuals experiencing lower growth rates and
greater mortality because of the reduced food and space available within densely
packed aggregations. At the population scale, the increased competition for food
individuals experience in aggregations emerges as longer generational cycles and
reduced population densities.
Aggregating individuals also altered the outcome of interspecific competition
between Plodia and Ephestia cautella. In food media that allowed high movement
rates, Plodia had a greater survival rate than Ephestia because the larger movement
rate of Plodia allowed it to more effectively avoid intraspecific competition. Also the
8
faster growth rate, and so larger size, of Plodia allowed it to dominate interspecific
encounters by either predating or interfering with the feeding of Ephestia. In food that
restricts movement, the resulting aggregations cause Plodia to experience more
intraspecific encounters relative to interspecific, reducing its competitive advantage
and levelling the survival of the two species.
Spatial structure also affected the dynamics of a Plodia-granulosis virus interaction
and the evolution of virus infectivity. Larval aggregation forced transmission to
become limited to within host patches, making the overall prevalence of the virus
low. However potentially high rates of cannibalism and multiple infections within
overcrowded host aggregations caused virus-induced mortality to be high, as
indicated by the low host population density when virus is presented. Also aggregated
host populations cause the evolution of lower virus infectivity, where less infective
virus strains maintain more susceptible hosts within the aggregation and so possess a
greater transmission rate.
The pattern of variation in resistance of Plodia interpunctella towards its granulosis
virus was found using two forms of graphical analysis. There was a bimodal pattern
of variation, with most individuals exhibiting either low or high levels of resistance.
This pattern was related to a resistance mechanism that is decreasingly costly to host
fitness.

1
Chapter 1
General Introduction
2
Aims
There will be two forms of biological heterogeneity discussed in this thesis. Most
chapters will focus on the importance of within population spatial heterogeneity,
while variation in resistance towards a pathogen is discussed in one chapter. Often the
spatial aspects of ecology are only considered when mapping the distribution of
species at broad scales. However the implications of the small-scale distribution of
individuals within populations upon ecological processes are often ignored. Until
recently, ecological systems were analysed using the simplifying assumptions of
uniform physical environments and randomly mixing individuals. The 1990’s and
early 21st century have seen more realistic population structures being considered
when we ask ecological and evolutionary questions. The work in my thesis attempts
to contribute to this field. The approach is empirical, using an insect model system to
examine the scaled effects of different spatial structures on pathogen transmission and
intra- and inter-specific competition.
Plodia interpunctella
The lepidopteran moth species Plodia interpunctella (Hübner) is a member of the
Pyralidae family. Its common name is the Indian meal moth, originating from the
destruction of ‘Indian’ wheat in the southern states of USA. It has a global
distribution resulting from human international trade and movement. The species is a
tropical and warm-temperate species but is moderately cold hardy and can survive
most winters in temperate climates (Arbogast et al., 2002). It is predominately found
in warehouses and barns where food is stored, and so is categorised as a ‘stored
product pest’ along with over forty other moth species (Cox & Bell, 1985). Food

3
stores affected by Plodia infestation include dried fruit, cereals, oilseeds, groundnuts
and botanicals (unrefined parts of medicinal plants).
There are five larval stages, each one identifiable by the size of the head
capsule. Development can only occur at a temperature range of 18-35ºC (Bell, 1975).
Larvae are negatively phototactic until they are about to pupate, and the pupal stage
lasts 7-8 days (at 27ºC). Diapause, where development is delayed, can occur when
temperatures are low, light periods are short and when population densities are high
(Bell, 1976; Tsuji, 1959). This allows wild populations to survive cold winters,
although laboratory populations display a reduced capacity for diapause. Larvae
secrete a mandibular substance when they make head to head contact with other
larvae. This substance acts to agitate larvae and so encourage larval wandering when
found in large quantities (Corbet, 1971).
Adults live for approximately seven days and females lay, on average, 150-200
eggs (Lum & Flaherty, 1969) that hatch after 4-5 days (at 27ºC). Adult male fertility
and female fecundity is reduced by exposure to continuous light or dark and
temperatures above 33ºC (Lum & Flaherty, 1970). Adults are mainly nocturnal, with
flight and reproductive activity peaking in the dark. Mating is initiated when females
emit a sex pheromone chiefly composed of cis-9 trans-12-tera-decadienyl acetate
(Kuwahara et al., 1971). The female lifts her abdomen between her wings and
releases scent from the tip. Males locate females by following the pheromone trails
and release their own in the final stages of courtship, eliciting timing behaviour in the
female (McLaughlin, 1982).
4
Plodia interpunctella and its granulosis virus
Infection with a granulosis virus often results in larval mortality (Granados, 1980),
however non-lethal, asymptomatic infection has been known to be theoretically
important (Anderson & May, 1981; Boots & Norman, 2000; Onstad & Maddox,
1989). Sait et al. (1994a) studied the effects of sublethal PiGV infection based on the
dose and age dependent effects of larval exposure. They found strong, if indirect,
evidence that sublethal infection causes a decrease in female fecundity and male
fertility. Such consequences may be explained by the virus exploiting reproductive
and other metabolically important tissues (O’Reilly & Miller, 1989; Silhacek &
Oberlander, 1975).
As larvae develop through the five larval instars they become increasingly
resistant to granulosis virus (PiGV) infection. This maturation resistance has two
distinct phases and mechanisms. The first mechanism of maturation resistance acts
from first to third instars and is a dilution effect (Sait et al., 1994c). This may be a
result of increasing body size reducing the surface-to-volume ratio of the midgut, and
so increasing the probability of virus particles passing through the gut without
attaching to target epithelial cells (Briese, 1986). Also the greater volume of food
ingested as larvae develop from first to third instar further reduces the probability of
infection (Engelhard et al., 1991).
A different mechanism of maturation resistance seems to occur within fourth
and fifth instars, a view developed because resistance here increases at a greater rate
than body size (Sait et al., 1994c). This additional maturation resistance renders fifth
instars totally immune to infection (Boots, 1998). The possible explanations for this
resistance in late instars include higher gut pH (Stiles & Paschke, 1980), greater gut
wall sloughing (Kirkpatrick et al., 1998), the short time available for viral

5
establishment before pupation occurs (Sait et al., 1994c) and changes in the
physiology of the gut wall and tracheae induced by hormones (Whitlock, 1977).
Plodia has an additional mechanism of resistance beyond passive maturation,
because changes in the prevalence of the resistance trait have been found in
populations exposed to granulosis virus (Boots & Begon, 1993). Such resistance was
associated with an increased development time, suggesting there is a cost to fitness
associated with maintaining resistance. Although the precise mechanism of
resistance is unknown, lepidopteran-virus studies have revealed a number of methods
that may be potentially displayed by Plodia. A well-studied insect phenomenon is gut
wall sloughing, a process by which infected epithelial columnar cells are discharged
into the gut lumen and replaced by maturing cells (Washburn et al, 1998). This has
been observed in many lepidopteran species (Briese, 1986) and has been shown to be
a mechanism that can completely clear AcMNPV infection in Trichoplusia ni
(Keddie et al., 1989). Sloughing is energetically equivalent to resistance through
thicker gut walls, a mechanism discussed in Boots & Haraguchi (1999). Sait et al.
(1994a) suggested the rate at which lepidopteran larvae ingest baculoviruses might
affect susceptibility, the idea being that slower feeding individuals may be able to
survive exposure to virus. One example of this is found in larvae of the mosquito
Culex quinquefasciatus. Resistant individuals lower the rate of feeding when toxin
produced by the bacteria Bacillus sphaericus is detected in the environment, so
enabling the toxin to be tolerated (Rodcharoen & Mulla, 1995). However a study of
the nucleopolyhedrosis virus of Trichoplusia ni found that the time taken for larvae to
ingest the pathogen did not alter mortality (Milks 1997a).
One potential mechanism of resistance that has received attention is the cellular
response to pathogens within the haemocoel. Foreign organisms such as fungi and

6
bacteria are surrounded and killed by haemocytes, which form a multicellular,
melanised capsule (Ratcliffe et al., 1984). This process has been seen to confer
resistance to AcMNPV infection in Helicoverpa zea, with infected tracheal cells
being encapsulated and cleared in exactly the same way that bacterial and fungal
infections are removed (Washburn et al., 1996). To further support the role of
haemocytes in lepidopteran resistance, they have also been thought to phagocytose
granulosis viruses within Plodia and Cydia pomonella individuals (Begon et al.,
1993; Hess & Falcon, 1987). It is known that the enzyme phenoloxidase is important
in this encapsulation process. Certain haemocytes release this enzyme when they
come into contact with infected cells and it catalyses greater rates of non-self
recognition and encapsulation (variations of this process are reviewed in Richards &
Edwards, 2000). The costs associated with phenoloxidase activity are the production
of toxic quinones and oxygen species that may damage the hosts own tissues (Nappi
et al., 1995; Slepneva et al., 1999). However these costs may be minimised by the
formation of the haemocyte capsule, which is a method of directly targeting these
toxins at the infected cell (Russo et al., 1996).
Plodia interpunctella and laboratory experiments
Plodia has been used in a large number of studies, many attempting to find suitable
biological and artificial pest control methods. The species has also been widely used
as an experimental model laboratory system. This is partly because of the ease at
which Plodia populations can be maintained and manipulated within the laboratory
environment. At temperatures above 20ºC and humidity levels as low as 25%,

7
reproduction and survivability rates are high. Also a wide range of food mediums can
be used with no significant changes in Plodia behaviour and dynamics.
The species has been involved in studies examining the processes by which
generation cycles are formed and the significance of stage-structured life histories
upon population dynamics (e.g. Begon et al., 1996; Bjørnstad et al., 1998; Gurney et
al., 1983). The generation cycles associated with Plodia are driven by asymmetric
competition between larvae at different developmental stages. Large, late instars can
both cannibalise and outcompete small, early instars (Gurney & Nisbet, 1985). As
cannibalism is a feature of Plodia intraspecific interactions, the species has been an
important tool to analyse the general importance of cannibalism in forming the
structure and dynamics of populations (Boots, 1998; Reed et al., 1996).
The relationship between competition and species diversity has also been
empirically explored using Plodia. There are many potential competitors for Plodia,
as several other stored product pest species share a similar geographical range,
climate tolerance and food preference (e.g. Ephestia cautella, Ephestia elutella &
Ephestia kuehniella). There is good evidence that competition between species occurs
in warehouses and the field (Soderstrom et al., 1987; Vick et al., 1987), often
resulting in the dominance of only one species (Allotey & Goswami, 1992).
Although my thesis will only consider the Plodia specific granulosis virus, the
species can form interactions with several other natural enemies. Hymenopteran
parasitoids such as ichneumonids (e.g. Venturia canescens) and braconids (e.g.
Bracon hebetor) lay their eggs in late larval instars (e.g. Sait et al., 1995; Sait et al.,
1996). The egg hatches and the larval parasitoid kills its host. Plodia larvae are also
susceptible to spore-forming bacteria such as Bacillus thuringiensis (Knell et al.,
1996, 1998a), due to the high pH in the gut environment. Sporulating Bt produce

8
crystallised insecticidal proteins within the bacterial cell wall (Aronson et al., 1986).
Larval midgut proteins activate these toxins, which bind to the brush border
membrane of the midgut epithelium (Van Rie et al., 1990). The toxin causes lysis of
affected cells and, together with septicaemia from germinating bacterial spores, can
result in the death of the host (Manthavan et al., 1989). Other pathogens include
fungi of the genera Entomophthora, which infect individuals through the outer
integument and spiracles, and protozoan microsporidians such as Nosema plodiae.
Microsporidian infection occurs through the ingestion of free-living infective spores
that are excreted by previously infected larvae. Early instars display high
susceptibility and infection often results in death, whilst infection of later instars
results in sublethal reductions in reproduction (Onstad et al., 1990).
Granulosis Virus
The pathogen used is the granulosis virus (reviewed in detail in Granados & Federici,
1986). It is a subgenus of the Baculovirus, the only genera of the Baculoviridae
family. This genus is the largest group of viruses pathogenic to arthropods, although
granulosis viruses have only been known to infect lepidoptera. The two other
Baculovirus subgenera are the Nucleopolyhedrosis and Nonoccluded viruses.
Baculoviruses have received a great deal of attention because they have potential to
be used as pest control agents (Moscardi, 1999). Although there is variation in the
morphology and replication of granulosis viruses, there are a number of structures
and behaviours distinct to the subgenus. The double stranded DNA is bound to a
protein that enables the supercoiled genome to be condensed and packaged within a
rod-shaped protein capsid (Kelly et al., 1983). The nucleocapsid is 40-50nm in

9
diameter (Beaton & Filshie, 1976) and is formed of protein subunits forming rings
spaced 5nm apart (Burley et al., 1982). The nucleocapsid in enveloped by a trilaminar
membrane 6-18nm thick, characterised by a lipid layer bound on both sides by layers
of protein (Hughes, 1972). Between the enveloped nucleocapsid and the inclusion
body is a matrix of protein molecules arranged into a cubic lattice (Harrap, 1972).
The inclusion body is composed of the protein granulin that is transcribed by the viral
genome (Summers & Smith, 1975). The occluded virion forms a distinct oval or
elliptical shape (Tweenten et al., 1981) and can persist in an ultraviolet free
environment for considerable periods.
The most common method by which lepidoptera become infected with the
granulosis virus is via the ingestion of occluded bodies in contaminated food, whilst
less frequent methods of host entry include vertical transmission from parent to
offspring (Kukan, 1999) and passage via the spiracles (Granados, 1980). Plodia
interpunctella larvae primarily acquire infection through the cannibalism of infected
larvae, which are moribund and easier to prey upon (Boots, 1998). Once the virions
have been ingested, the protein inclusion bodies are rapidly dissolved by the action of
the host’s alkaline digestive juices (proteases) in the gut lumen (Nagata & Tanada,
1983). The foregut and hindgut are covered by ectodermal cuticle, restricting the sites
of primary infection to epithelial cells in the midgut. The epithelium is lined by a
peritrophic membrane, composed of chitin and protein, which prevents the epithelium
from being damaged by the digestive process. The peritrophic membrane is not a
major barrier to virions coming into contact with the epithelium because it possesses
membranous pores and discontinuities, and is replaced at every moult (Begon et al.,
1993; Adang & Spence, 1983). The now nonoccluded nucleocapsids fuse with
susceptible columnar cells and travel to the nucleus, possibly along cellular

10
microtubules (Granados, 1978). At the nucleus, viral replication occurs and capsids
are enveloped in the cell cytoplasm (Summers, 1971). These nucleocapsids bud
through the basal lamina of the midgut into the haemocoel, where secondary
infections occur (Granados, 1980). Within the haemocoel, the hosts’ fat body is a
major site of secondary infections. Once the fat body is infected, the granulosis virus
triggers the rapid mitotic proliferation of new fat body cells that can be infected after
the next viral reproductive cycle (Walker et al., 1982). It is possible that both
haemocyte and tracheal cells act as important tissues by which the granulosis virus
spreads through the host body in advanced stages of infection (Begon et al., 1993;
Benz, 1963). However the alternative explanation for virus particles found in
haemocytes is that they have been phagocytosed in a defence response (Begon et al.,
1993).
The overt symptoms of granulosis virus infection appear after several days.
Larvae cease to feed and developing a white colouration as the epidermis becomes
infected (Hamm & Paschke, 1963). Growth stops and death occurs through a fatal
liquefaction of host tissues. The fragile integument breaks and releases occluded
virions into the environment. The period of time between initial infection and death
depends on the health and age of the host, microhabitat temperature as well as the
dose and virulence of the virus. Sublethal effects have been noted, where infection
has a detrimental effect yet the host still completes its life-cycle (Rothman & Myers,
1996). It is possible that such sublethal effects can emerge as either a result of the
host attempts to resist infection (e.g. Ratcliffe et al., 1984) or a consequence of a non-
lethal, limited infection of host tissues (e.g. Burand & Park, 1992). Latent infection
can become overt when individuals are infected with an heterologous pathogen or
become stressed through changes in diet, temperature and population density

11
(Longworth & Cunningham, 1968). A sublethal infection of male and female gonads
might allow the virus to be transmitted vertically to the offspring of infected
individuals (Burden et al., 2002). This method of transmission may well be important
for the persistence of the virus in small, sparse host populations where the
opportunities for infection through ingesting occluded bodies are few (Burden et al.,
2002).
Baculoviruses have been shown to exhibit a great deal of genetic variation.
Such variation has been found at a range of observations scales, from whole states
down to individual hosts. At the scale of the individual, up to 24 different
nucleopolyhedrosis virus genotypes have been found in one host (Hodgson et al.,
2001). This variation in the viral genome is generated by mutations, insertions,
deletions and the ability for parts of the host genome to be incorporated (Crozier et
al., 1988; Crozier & Ribeiro, 1992; Martin & Weber, 1997). At broader scales,
baculovirus strains have been shown to be more similar within USA states than
between states (Shapiro et al., 1991) because of geographical differences in founder
strains and selection processes (Cooper et al., 2003; Smith & Summers, 1978).
Spatial Heterogeneity
Most theoretical and empirical studies ignore the inherent spatial dimensions of real
ecological systems and replace them with an assumption of ‘mean-field’ spatial
homogeneity. The first mean-field assumption is that the environment in which the
population exists is uniform. However in real populations, the distribution of
preferential habitat and food tends to be irregular so forcing individuals into patches.
The second mean-field assumption is that any one individual has an equal probability
12
of encountering any other individual within the population (e.g. Anderson & May,
1992). However in reality, individual dispersal is restricted meaning an individual
will only experience a limited part of the whole environment. Therefore individuals
are only capable of interacting with the limited number of conspecifics that are
nearby. As a consequence of resource distribution and limited dispersal, real
populations are heterogeneous with individuals experiencing different biotic and
abiotic environments (Tilman et al., 1997).
The spatial structure of a population or community varies depending upon the
scale of observation (Husband & Barrett, 1996; Thomas & Kunin, 1999). There is a
hierarchy of spatial structures, as individuals form patches, patches form
subpopulations and subpopulations form complete populations. Each structure
involves an ever larger part of the population and each potentially possesses different
emergent properties. The finest scale of observation is that of the individual, the
minimum unit of the population. Each individual organism is a discrete entity that can
only interact directly with other organisms that are close by. The number of
individuals that any one individual can interact with constitutes a contact
neighbourhood, the size and stability of which depends crucially on the mobility of
individuals. A non-mobile species will only be affected by a few, nearby individuals
and the spatial position of the contact neighbourhood will persist over time. A highly
mobile species will interact with many individuals and the large contact
neighbourhood will be dynamic, with the position of neighbourhoods changing with
each movement step.
At a broader scale of population observation, individuals are clumped into
patches. Such patches may be caused through endogenous or exogenous forces, or a
mixture of the two. Endogenous spatial heterogeneity is generated by the combination
13
of localised interactions and short dispersal distances. Variation in abundance at small
scales is initially generated by localised interactions and then short dispersal fixes the
altered abundances (Durrett & Levin, 1994b; Hanski, 1998; Kareiva, 1990; Keeling,
1999a). This can create a patchy population, where the density of individuals varies
across space despite a uniform environment. Exogenous spatial heterogeneity is
generated through environmental factors. Should preferential habitat and food be
patchily distributed throughout the environment, the population will be
correspondingly distributed. Endogenous and exogenous forces can interact, with a
patch of individuals caused by short dispersal rapidly exploiting local resources and
so forming a patchy distribution of resources (Williamson, 1981).
The broadest scale at which a population’s distribution can be measured is
where each patch belongs to a subpopulation and dispersal between subpopulations
creates the whole (meta) population (Menéndez & Thomas, 2000). The concept of the
metapopulation has its origin in landscape ecology and is a large-scale study of local
populations based around ‘islands’ of suitable habitat. The metapopulation persists
despite each subpopulation being vulnerable to extinction. It is possible to distinguish
a patchy population from a metapopulation by examining the dispersal of individuals
between population clumps. In a metapopulation, dispersal is rare, involves a long
travel time (in proportion to life-span) and is associated with high mortality
(Nachman, 2000). In a patchy population, dispersal between patches is common and
involves little risk to the individual (Nachman, 2000; Roslin, 2000). Metapopulation
structures have been found in habitats such as fragmented grassland (Harrison et al.,
1988; Thomas & Harrison, 1992) and interconnected ponds (Bengtsson, 1991;
Sjögren, 1991).

14
A broad scale spatial structure functionally different to the metapopulation is
the source-sink model (Holt, 1993; Pulliam, 1988). This is characterised by ‘source’
habitats where births are greater than deaths and ‘sink’ habitats where deaths are
greater than births. Therefore the sink habitat population can only persist through
immigration from the source habitat. This form of spatial structure, in the form of
core-satellite models, has been used to understand the persistence of measles in
human populations (Bolker & Grenfell, 1995a, b). The disease is endemic in the
densely populated cities and movement maintains the presence of the pathogen in
surrounding small towns that would be too small to allow persistence alone.
Life History Trade-Offs
Most chapters in this thesis study the effect of spatial structure on host-pathogen and
competition systems. However Chapter 6 examines the variation of granulosis virus
resistance within a population of Plodia interpunctella. Variation in trait expression
may indicate the presence of a trade-off between aspects of life histories. This is
because should a trait carry no cost to fitness, then we would expect it to become
rapidly fixed within the population. Stearns (1989) defined trade-offs as “the costs
paid in the currency of fitness when a beneficial change in one trait is linked to a
detrimental change in another”. Trade-offs can act through phenotypic mechanisms,
with changes in resource allocation. However for a trade-off to have evolutionary
consequences, the traits must be negatively correlated at the genetic level (Stearns
1992) by either pleiotropy or coincidental genetic linkage (Fellowes et al., 1999;
Reznick 1985).

15
When there is a fitness cost to pathogen resistance, the trait will only be
selected for when there is a high frequency of contacts between susceptible hosts and
pathogen. Host susceptibility is favoured in the absence of the pathogen because, with
no pathogen, the costs of resistance outweigh the advantages. Therefore maintaining
populations in the presence and absence of the pathogen enables any life history
trade-offs to be measured. Insects have provided an effective method of testing trade-
offs between resistance and other life-history traits, as the immune system is
relatively simple. Insects lack lymphocytes and immunoglobulins (Gillespie et al.
1997) as well as antibody production associated with acquired immunity (Stevens et
al., 1997). Instead, cellular and humoral processes recognise and remove foreign
invaders either by killing them or by isolating them from the rest of the body. Insects
also exhibit rapid evolutionary responses to artificial selection in the laboratory, again
making them a useful tool for studying costs to resistance. Rapid evolution can occur
in many insect species because they have high growth rates and a low susceptibility to
crowding, resulting in large carrying capacity reached at a slow rate from low
densities (Boots & Bowers, 1999: Bowers et al., 1994).
Boots & Begon (1993) maintained long-term Plodia interpunctella populations
with and without PiGV. Populations exposed to the virus became 1.96 times more
resistant than controls but suffered a calculated 15% reduction in fitness as
development time increased and egg viability decreased. However the fitness costs
outside the laboratory may be significantly lower because the increase in
development time was correlated with an increase in pupal weight. The noctuid moths
Spodoptera frugiperda (Fuxa & Richter 1989) and Anticarsia gemmitalis (Fuxa &
Richter 1998) were selected for resistance towards their respective nuclear
polyhedroviruses. In comparison to control populations, resistant Spodoptera

16
frugiperda and Anticarsia gemmitalis displayed lower fecundity, lower egg viability
and shorter adult lifespan. Also Trichoplusia ni females resistant to a
nucleopolyhedrosis virus laid fewer eggs in comparison to susceptible females
(Milks, 1997b).
Populations of Drosophila melanogaster resistant towards its parasitoids,
Asobara tabida, Leptopilina boulardii and Pachycrepoideus vindemia, showed an 5-
60% increase in the rate of parasitoid egg encapsulation (Fellowes et al. 1998a;
Kraaijeveld & Godfray 1997). The costs associated with maintaining this higher rate
of encapsulation were reduced adult fecundity, a lower feeding rate (Fellowes et al.,
1999) and a thinner puparial wall increasing the susceptibility to attack by the pupal
parasite P. vindemiae (Fellowes et al., 1998b). These trade-offs could only be
observed when food levels were low and competition with susceptible strains was
intense (Kraaijeveld & Godfray 1997). Also diamondback moth Plutella xylostella
populations resistant to Bacillus thuringiensis displayed lower survival, fecundity and
egg viability than susceptible populations (Groeters et al. 1994).
Examples of non-lepidopteran invertebrate trade-offs with resistance include
the mosquito Aedes aegypti selected for resistance to carrying the avian malaria
parasite Plasmodium gallinaceum. The adults of resistant strains were smaller and
laid fewer eggs (Yan et al. 1997). Resistant lines of the snail Biomphalaria glabrata
to the schistosome Schistosoma mansoni displayed a lower fecundity than susceptible
lines (Webster and Woolhouse, 1999).
There can also be trade-offs within the immune system, so that resistance to
one pathogen confers susceptibility to another. Examples of this form of fitness cost
include populations of D. melanogaster resistant to one parasitoid species, A. tabida,
becoming more susceptible to another species, L. boulardii (Benassi et al. 1998).
17
Mosquitoes incompatible with one species of Plasmodium were found to be
susceptible to other species (Graves & Curtis 1982; Somboon & Takagi 1999). Also
strains of mice resistant to Trichinella spiralis displayed an increased susceptibility to
Trichinella musculi (Sorci et al., 1997), a feature that may be common in vertebrate
immune systems (Gill et al. 2000; Grencis, 1997).
One issue with experiments attempting to discover trade-offs between life
history traits is that a range of important selection pressures present in the wild are
often not considered within the confines of the laboratory. This means that
apparently deleterious impacts on fitness may not actually reduce the survival and
reproductive ability of individuals in the wild. For example, should a lower feeding
rate be correlated with resistance, it is often seen as a cost capable of severely
affecting the individual. However, there may be situations where large, well-fed,
individuals are more vulnerable to predation, and so balancing out the perceived costs
of resistance (Lanciani, 1975). Also the effects of environmental and demographic
stochasticity may over-ride any costs of resistance. An example is the toxicity of B.
thuringiensis towards the Gypsy Moth Lymantria dispar, which depends on diet of
the host. Pupae reared on Douglas-fir were more susceptible than those reared on
Alder (Moldenke et al., 1994). Another important consideration is that any costs of
resistance can themselves be selected against, reducing any negative impacts on
fitness. Studies into resistance of pesticides have shown that genetic mutations can
occur to reduce associated deleterious effects of pleiotropic resistance (Lenski, 1988).

18
Thesis Outline
Chapter 2 focuses on the laboratory techniques used to change the movement rates of
individual Plodia interpunctella and Ephestia cautella larvae. The food medium was
altered to create different viscosity levels and the movement rates of larvae within the
food types were measured. This was carried out with the aim of making food types
that generate a series of relative larval movement rates, ranging from high to low. The
development time and pupal weight of larvae fed on each food type were used to
ensure different the food types had the same energetic value. The potential effects
that movement rate change has upon the spatial structure of populations are then
discussed. Chapter 2 includes an overview of the theoretical and empirical techniques
used to study spatial heterogeneity.
Chapter 3 describes a laboratory competition experiment, using Plodia and
Ephestia larvae. With knowledge of the individual movement rates gained from
Chapter 2, we attempted to understand intra- and inter-specific competition at small
cohort scales. The intensity of intraspecific competition is inferred from insect growth
rate and mortality, with lower growth rates and higher mortality associated with
higher resource and interference competition. Interspecific competition between
Plodia and Ephestia is also tested by analysing the growth rates and mortality of
larvae in different food types and at different densities. The results for the intra- and
inter-specific competition studies are discussed in reference to the changes in spatial
structure due to the different food viscosities. Chapter 3 also reviews the relevant
theoretical and empirical literature concerning spatial heterogeneity and competition.
Chapter 4 uses the information gathered at the individual and cohort scale to
study dynamics at the population scale. Long term Plodia time series data were
gathered at three different food viscosity levels in the presence and absence of a

19
granulosis virus (PiGV). Population size, cycle length and number of infected
cadavers are discussed in reference to competition intensity and infection rates caused
by differences in population spatial structure. This chapter also includes a review of
the empirical data concerning the relationship between spatial heterogeneity and host-
parasite dynamics.
Chapter 5 describes experiments with selected granulosis virus extracted from
populations maintained in Chapter 4. As different host population spatial structures
can change the number of transmission opportunities for the virus, we might expect to
see corresponding evolution in infectivity. Bioassays reveal the larval mortality rate
associated with the concentration of virus particles within each strain. Larval
mortality is used to indicate the infectivity because successful transmission results in
overt infection and host death. This chapter also includes a review of the literature
discussing the relationship between the evolution of parasite infectivity with patchy
host spatial structure and localised transmission.
Chapter 6 focuses on a novel method of inferring the heterogeneity of parasite
resistance within a population. Plodia larvae were exposed to a range of PiGV dose
levels. Mortality across the dose range allowed the pattern of resistance variation to
be assumed. Depending on whether the pattern of resistance in the Plodia population
is gaussian or bimodal, we can potentially predict the shape of the trade-off curve
between increasing resistance and the detrimental consequences to fitness. The
implications of the pattern of variation and the corresponding shape of the trade-off
curve are discussed, as are the limitations of the methodology.

20
Chapter 2
The Development of Spatial Techniques in
the Laboratory

21
Introduction
The main aim of this thesis is to study the effect of population spatial structure on
disease dynamics and competition. To this end, a series of laboratory experiments and
simulations will be carried out. This chapter introduces the experimental procedures
used throughout the thesis, as well as a discussion of the general, non-specific,
methods by which spatial heterogeneity has been investigated. The annual number of
published papers addressing the implications of spatial dimensions in ecology and
evolution has increased dramatically since 1990 (Figure 2.1). Developments in
computing power, the theoretical underpinning of biology and empirical data
collections have all prompted an increase in the study of a wide range of biological
heterogeneities. The spatial structure of many populations is irregular, with the
density of individuals varying across the environment. This arises from the inability
of individuals to disperse evenly through the entire environment and the patchy nature
of favourable habitat. The central question in spatial ecology is whether the
distribution of individuals is an important consideration when studying ecological
processes such as competition, predation, and parasitism.
The simplifying assumption that individuals randomly mix in a uniform,
homogeneous environment has been made in the classic studies of competition
(Volterra, 1928; Macarthur & Levins, 1964), predation (Nicholson & Bailey, 1935)
and infection (Kermack & McKendrick, 1927). Such deterministic mean-field models
only consider the population densities at the global scale and are intrinsically
unstable. This instability failed to match observations in natural systems, which tend
to be characterised by stable, long-term population persistence.

22
Figure 2.1 - The number of spatial biology papers published on Web of Science.
The search key words are a) Spatial AND Heterogeneity and b) Spatial/Space/Spatially AND
Competition
The number of spatially orientated biological papers was low until 1991. There was a rapid increase in 1991 and ever since there has been a gradual, yet significant, rise in the number of spatial studies. The development of theoretical tools and computational power has increasingly allowed ecologists to study the relationships between the spatial distribution of populations and dynamical ecological processes.
a)
b)

23
The potential that population spatial structure might be a factor generating the
stability found in nature was highlighted in early laboratory experiments. Huffaker
used a predator-prey mite interaction to replicate the instabilities found in theoretical
models (Huffaker, 1958; Huffaker et al., 1963). The prey species, Eotetranychus
sexmaculatus, could persist in the absence of its predator, Typhlodromus occidentalis,
but the system was rapidly driven to extinction when the predator was included. It
was possible to render both prey and predator dynamics more stable by making food
isolated and allowing E. sexmaculatus to disperse at a faster rate than its predator.
This created local patches where prey populations increased exponentially in the
absence of the predator and local predator populations went extinct in the absence of
prey (Begon et al., 1996). The spatial heterogeneities created by dispersal and habitat
irregularity could generate a stable two-species interaction.
A series of spatially orientated theoretical models have been developed and
used in a wide variety of ecological and evolutionary studies. There are three general
types of spatial model: 1) reaction-diffusion; 2) metapopulation or patch and 3)
individual-based cellular automata. Reaction-diffusion models are the most widely
used method of simulating the effects of space in ecology. They are nonlinear, partial
differential equations that are more tractable than cellular automata models. Space is
treated as being implicit and continuous. The ‘reaction’ part of the model explains
deterministic population dynamics within locations and ‘diffusion’ explains the
movement processes linking dynamics across the environment. Such movement can
range from simple passive diffusion to more complex forms of dispersal (Okubo,
1980; Okubo et al., 1989; van den Bosch et al., 1990). Population densities have to be
large and therefore reaction-diffusion models tend to ignore interactions at small
scales. Such models have been used to analyse both pattern formation (Murray, 1989)

24
and the effect patch size and shape has on the persistence of populations (Cantrell &
Cosner, 1993).
A second form of spatial model is the metapopulation. The mathematics behind
metapopulation theory, constructed by Levins (1969, 1970), provided an extension to
the island biogeography concepts of colonisation and extinction (MacArthur &
Wilson, 1967). Populations are defined not numerically but in terms of the occupancy
or vacancy of local patches. The rate of population change is the difference between
the rate empty subpopulations are colonised by dispersal and the rate other
subpopulations go extinct. This simple model assumes that colonisation of one site
can result from anywhere in the population, carrying capacity is reached instantly,
subpopulations are equal in size and localised dynamics do not occur (Harrison et al.,
1995; Harrison & Taylor, 1997; Williamson, 1981). Incorporating these complexities
to metapopulation models is at the centre of attempts to apply theory to practical
conservation measures (Gilpin & Hanski, 1991; Hanski, 1989). Metapopulation
structures have been found in several natural populations, including butterflies (e.g.
Harrison et al., 1988; Thomas & Harrison, 1992), frogs (Sjögren, 1991) and Daphnia
species (Bengtsson, 1991). In these examples, suitable habitat is fragmented
throughout the environment and intermediate rates of dispersal allow the population
to persist despite localised extinction (Hess, 1996).
Probabilistic cellular automata are the third method of modelling spatial
structure. Individuals occupy discrete sites within a homogeneous lattice, interacting
predominately with locally positioned sites. As such, individuals only experience a
small effective population, constituting a contact neighbourhood. Population
dynamics are driven by the contact neighbourhood’s effect upon the status of each of
its constituting sites. This creates a complex array of heterogeneous patches across
25
the lattice, which can experience large, non-equilibrium fluctuations. The results of
such models are explicitly stochastic as there is a finite number of individuals. A
major problem with cellular automata is a tendency to be mathematically intractable,
with analysis restricted to computer simulations. However pair approximation
analysis (moment closure techniques) allows the mathematics of cellular automata to
be simplified and rendered tractable. The method examines the correlations between
interacting individuals by calculating the probability that any one site exhibits the
same state as an adjacent site. The spatial processes within cellular automata have
been shown to have a significant effect on ecological processes, such as parasite
epidemics (e.g. Mollison, 1977) and host-parasitoid systems (e.g. Comins et al.,
1993), as well evolutionary processes (e.g. Boots & Sasaki, 1999; Rand et al., 1995).
Associated with this spatial theory is a growing body of empirical data. It
would be impractical to summarise the methods used in such experimental studies, as
each natural system requires fundamentally different approaches to measure and
manipulate the degree of spatial heterogeneity experienced by the participating
species. Some methods associated with spatially orientated competition and host-
parasite experiments will be reviewed in Chapters 3 and 4. It is possible to group the
empirical approaches used in spatial ecology into three categories: 1) field work
mapping of movement and distribution of populations (e.g. Harrison et al., 1988;
Thomas & Harrison, 1992), 2) analysis of migration and habitat coverage over time
(e.g. Harrison, 1989; Kuussaari, et al., 1996; Doncaster et al. 1997; Turchin, 1998;
Raynor & Cliff, 1999) and 3) the manufacture and imposition of a spatial structure
onto a laboratory or field system (e.g. French & Travis, 2001; Huffaker et al., 1963;
Ims et al., 2004). There are a number of unique problems related to the spatial study
of ecology that any researcher must consider when formulating research plans. One is

26
that the scale of the study must correspond to the scale at which spatial heterogeneity
produces a measurable effect. If metapopulation dynamics are important then the
study must monitor subpopulations, uninhabited but suitable habitat and dispersal
between sites. This has the potential to involve a large study area and the collection of
a comprehensive dataset may prove impossible. Should fine scale spatial structure be
important, collecting detailed information of habitat preference and individual
movement at small scales might proof similarly awkward. Such difficulties are
increased when considering broader community interactions, where species differ in
their life-cycles, dispersal rates and responses to the environment. Also the
importance of spatial heterogeneity may vary over time, with demographic or
environmental fluctuations reducing or increasing the effect heterogeneity has on the
variables of scientific interest.
The methods applied in this thesis primarily involve an attempt to generate
endogenous spatial structure within a homogeneous food environment. I attempt to
manipulate the larval movement rates of two phycitid moth species within a
laboratory setting. By creating food media of differing viscosity, where movement
rates are altered but feeding remains unchanged, it is possible to allow individual
behaviour to generate different spatial structures at local and population scales. This
is a rather rare experimental approach as it is the individuals themselves that create
the spatial structure. A strictly defined spatial structure is not forced upon
populations, as has been the case in previous laboratory based patchy- and meta-
population experiments. The methodology described forms the basis for much of the
thesis.
27
Methods
Plodia and Ephestia
Plodia interpunctella and Ephestia cautella are laboratory model systems that lend
themselves to spatial studies. Adults lay batches of eggs directly in the food and the
resulting larvae of both species spend much of their existence within the food
medium provided. Only at the fifth and final instar do larvae display directed
movement out of the food medium. By this time, larvae neither compete for food nor
can their granulosis virus infect them. As larvae live within the food medium, it is
possible to render this medium more viscous and therefore restrict larval movement.
The methodology in this chapter describes the process by which food is made viscous
and the effect this has on the movement and thereby the spatial structure of Plodia
and Ephestia larvae. I also examine whether the manipulation of the media affects the
life-history characteristics of the larvae.
The food medium
The standard food medium is a mixture of 400g HiPP organic harvest breakfast
cereal, 80g brewers yeast, 100ml glycerol, 100ml organic clear honey, 0.5g sorbic
acid (SA) and 0.5g methyl paraben (MP). The cereal, yeast and honey combine to
create a nutritious medium. The glycerol adds moisture that prevents the negative
effects of dryness on larval survival and development. SA acts as an antibacterial
agent, important because Bacillus thuringiensis and other bacterial species frequently
contaminate stock populations and long running experiments. Similarly, MP is a
fungicide.

28
By adding water to this mixture, it is possible to change the texture of the food.
When no water is added, the food possesses a soft, loose texture (Figure 2.2a).
Adding distilled water makes the food harder and stickier, with the food clumping
together into a dense mass (Figure 2.2c). One has to be careful about how and when
the water is added to the mixture. Initially the cereal, yeast, SA and MP have to be
mixed thoroughly in an industrial food mixer. To this, add the water and mix for no
less than 10-15 minutes. Finally add the glycerol then honey, and mix until the texture
of the food is constant. For food with high water amounts, this final mixing stage has
to be observed carefully because if left too long, the food quickly hardens and
becomes difficult to work with.
Figure 2.2 - Photographs of three food viscosity types Food types are mixed with a) 0ml (Soft) water, b) 60ml (Intermediate) water and c) 140ml (Hard) water. The food with no water is powdery and loose. As water is added, the food clumps together and hardens. Each food type produces significantly different Plodia larvae movement rates.
a) b)
c)
29
The effect of increasing food viscosity on larval movement rates
If the hardened food is to be useful, it must have a significant limiting effect on the
movement of larvae. This was tested using equipment pictured in Figure 2.3. An 18
by 18cm cardboard structure was made, within which four confined lanes were
delineated, each 18 cm long and 4cm wide. Food was added into each lane so the
entire 18 by 4cm area was covered up to a depth of 0.5cm. The boxes were then
placed in a plastic container, covered to prevent free adults from ovipositing eggs and
left in an incubator for five days. This allows the sticky, dense food to dry out
allowing the media to be consistently hard by the time larvae were added.
Movement rates were measured by adding first instar larvae at one end of each
lane. Only one larva was placed in each lane and cardboard strips were weighted
down on lanes to prevent larvae moving along the surface of the food or move
between lanes. Each 4-lane box was placed in an aerated plastic container and left in
an incubator at 270C and 35% humidity for either 12 days (Plodia) or 14 days
(Ephestia). This ~2 week period covers the time taken by Plodia and Ephestia to
develop from the first instar stage to the third instar. Then the food was carefully
lifted from each lane and destructively sampled one centimetre at a time along its
entire 18cm length in order to find the larva. The distance moved by surviving larva
was measured. 40 Plodia larvae were tested in 6 food viscosity types, making a total
of 240 individuals. For Ephestia, 25 larvae were tested in 3 food types so that 75
individuals were tested in total.

30
Figure 2.3 – Method of measuring larval movement rates Larval movement rates were measured using boxes as above. At one end of each lane, first instar larvae were placed within the food. Plodia larvae were left for 12 days and Ephestia larvae were left for 14 days, allowing larvae to develop into third instars. The distance travelled up the lane after this period was determined.
31
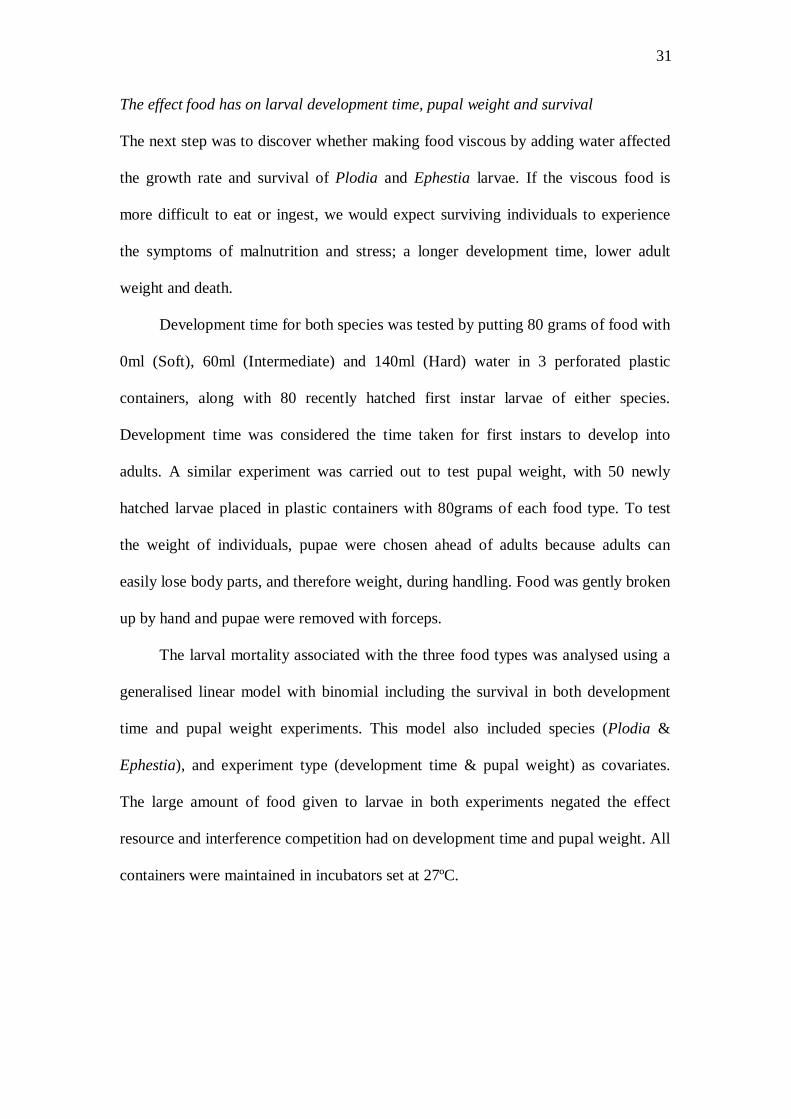
The effect food has on larval development time, pupal weight and survival
The next step was to discover whether making food viscous by adding water affected
the growth rate and survival of Plodia and Ephestia larvae. If the viscous food is
more difficult to eat or ingest, we would expect surviving individuals to experience
the symptoms of malnutrition and stress; a longer development time, lower adult
weight and death.
Development time for both species was tested by putting 80 grams of food with
0ml (Soft), 60ml (Intermediate) and 140ml (Hard) water in 3 perforated plastic
containers, along with 80 recently hatched first instar larvae of either species.
Development time was considered the time taken for first instars to develop into
adults. A similar experiment was carried out to test pupal weight, with 50 newly
hatched larvae placed in plastic containers with 80grams of each food type. To test
the weight of individuals, pupae were chosen ahead of adults because adults can
easily lose body parts, and therefore weight, during handling. Food was gently broken
up by hand and pupae were removed with forceps.
The larval mortality associated with the three food types was analysed using a
generalised linear model with binomial including the survival in both development
time and pupal weight experiments. This model also included species (Plodia &
Ephestia), and experiment type (development time & pupal weight) as covariates.
The large amount of food given to larvae in both experiments negated the effect
resource and interference competition had on development time and pupal weight. All
containers were maintained in incubators set at 27ºC.

32
Results
Viscosity and movement rates
Initially six different levels of food viscosity were used to measure the distances
travelled by Plodia larvae. The mean results are shown in Figures 4-6, with standard
errors and the number of surviving larvae from which measurements were taken. The
mean distance travelled was 10.63 cm (SE ±0.73) in food with no water, 5.08cm
(Standard Error ±0.61) in food with 60ml water, 3.97cm (±0.61) with 80ml, 3.75cm
(±0.46) in 100ml water, 3.48cm (±0.49) in 120ml water and 2.8cm (±0.26) in 140ml.
A one way analysis of variance (with square root transformed data for homogenous
variance) revealed there is a significant change in movement rates as the amount of
water mixed into the food increases (ANOVA sqrt(movement): F5,177 = 26.11, P
<0.001), with increasing viscosity lowering movement rate. Analysis of the model
coefficients showed there were significant differences between the movement in food
with 0ml, 60ml and 140ml water (sqrt(movement): 0ml coefficient= 3.192, 60ml
coefficient= 2.168, t= 5.857, p< 0.001; 60ml coefficient= 2.168, 140ml coefficient=
1.6, t= 3.07, p= 0.003). These three food types produce movement rates that are
significantly different to each other, and so are used throughout the thesis. Food with
0ml water is called Soft Food, food with 60ml water is Intermediate Food and food
with 140ml is Hard Food.
The movement of Ephestia larvae was measured in the three food viscosity
types and is shown along with the Plodia results in Figures 4-6. The mean distances
travelled were 3cm (SE ±0.65) in Soft Food, 2.62cm (±0.45) in Intermediate Food
and 2.57cm (±0.33) in Hard Food. There is a small, statistically insignificant decline
in Ephestia movement rates as the viscosity increases (ANOVA sqrt(movement): F2,46
= 0.475, P =0.625).

33
Figure 2.4 – Movement rates of larvae through different food types
a) The mean distance moved by Plodia interpunctella larvae with standard errors and number of larvae measured. Increasing the volume of water in food increases, so the distance moved declines. The three food levels that produce significantly different movement rates to each other were 0ml (Soft), 60ml (Intermediate) and 140ml (Hard). b) The distance moved by Plodia and Ephestia cautella larvae in the three food types. The distance moved by Ephestia larvae does not show any significant relationship with food viscosity, despite a small decrease in distance travelled (ANOVA; F2,48 = 0.235, P = 0.79).
b)
a)

34
Figure 5a – Dispersal kernels of Plodia larvae in three food types
In Soft Food (0ml), the range of movement was 3-17cm and movement over short distances was as common as it was over long distances. In Intermediate Food (60ml), the range of movement was 1-12cm but the most frequent distances moved were 3-5cm. In Hard Food (140ml), the range of movement was restricted to between 1-6cm and most individuals only moved 1-3cm. More viscous food acts to lower both the upper limit for larval movement and the most frequent distances travelled.
35
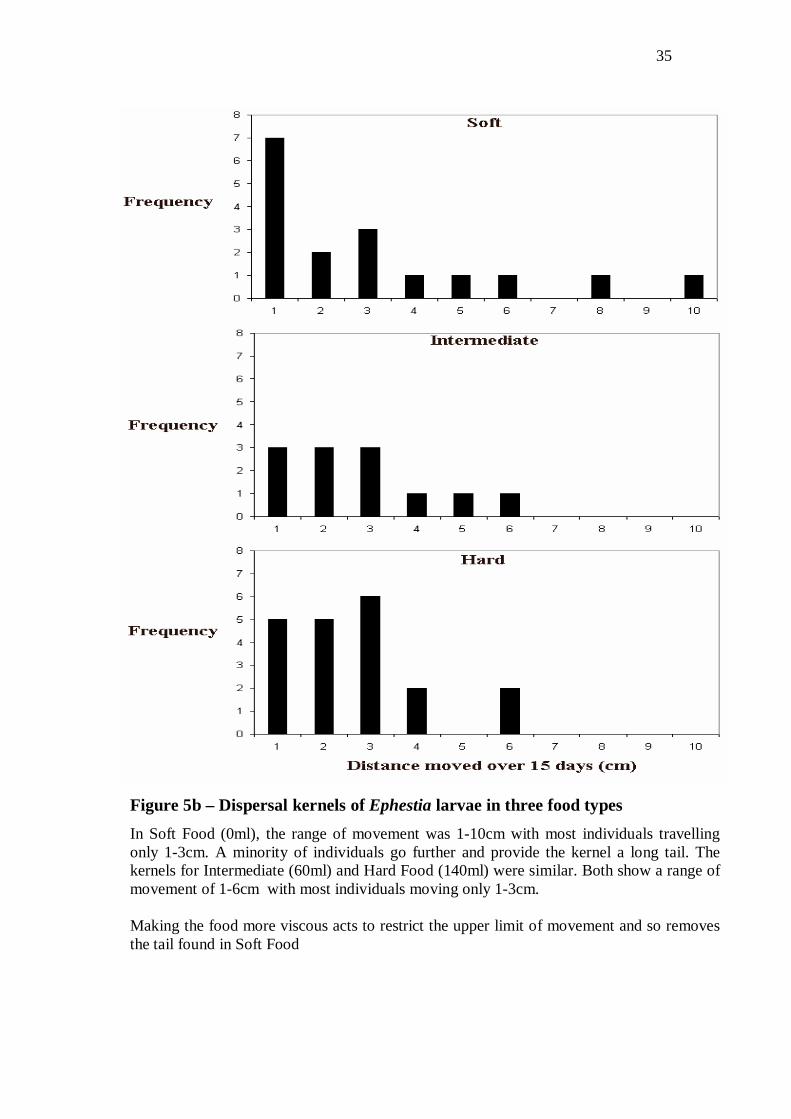
Figure 5b – Dispersal kernels of Ephestia larvae in three food types
In Soft Food (0ml), the range of movement was 1-10cm with most individuals travelling only 1-3cm. A minority of individuals go further and provide the kernel a long tail. The kernels for Intermediate (60ml) and Hard Food (140ml) were similar. Both show a range of movement of 1-6cm with most individuals moving only 1-3cm. Making the food more viscous acts to restrict the upper limit of movement and so removes the tail found in Soft Food

36
Figure 2.6a - The mean potential area Plodia larvae can experience in three food
types
In Soft Food (0ml), the diameter of the area larvae could experience is 10.63cm, making the size of the total area 88.74cm (6r2). In Intermediate Food (60ml), the diameter of the potential contact area is 5.08cm, therefore the total area is 20.26cm. In Hard Food (140ml), the diameter of the potential area is 2.8cm, creating an circle 6.15cm in size. Viscous food forces individuals to experience a much smaller effective environment.

37
Figure 2.6b - The mean potential area Ephestia larvae can experience in three
food types
In Soft Food (0ml), the diameter of the area larvae could experience is 3cm, making the size of the total area 7.07cm (6r2). In Intermediate Food (60ml), the diameter of the potential contact area is 2.62cm, therefore the total area is 5.39cm. In Hard Food (140ml), the diameter of the potential area is 2.57cm, creating a circle 5.18cm in size. Viscous food has a small effect in reducing the effective environment experienced by larvae.

38
The effect of food viscosity on development time, pupal weight and survival
The development time, pupal weight and mortality of Plodia and Ephestia were
measured in the three food types Soft (0ml water), Intermediate (60ml water) and
Hard (140ml). The mean times for development for Plodia larvae were 41.26 days
(SE ±2.21) in Soft Food, 42.57 days (±2.13) in Intermediate Food and 40.56 days
(±1.92) in Hard Food. This indicates that increasing the viscosity of food does not
change the development time for Plodia larvae (ANOVA; F2,121 = 0.22, P = 0.802).
Similarly, food viscosity had no effect on the development time of Ephestia larvae
(ANOVA; F2,188 = 0.44, P = 0.64). The development times for Ephestia were 47.4
days (±1.56) in Soft Food, 45.43 (±1.53) days in Intermediate Food and 47.13 days
(±1.66) in Hard Food. The mean development times for Plodia and Ephestia are
shown in Figure 2.7a, with standard errors and the number of surviving larvae from
which measurements were taken.
Mean Plodia pupal weights were 0.01261g (±5.81-4) in Soft Food, 0.01284g
(SE ±5.74-4) in Intermediate Food and 0.01314g (±5.62-4) in Hard Food. Therefore
there was no significant difference in the pupal weight of Plodia fed on the three food
types (ANOVA; F2,177 = 0.23, P = 0.79). For Ephestia, mean pupal weights were
0.00955g (±3.47-4) in Soft Food, 0.00988g (±3.66-4) in Intermediate Food and
0.00971g (±3.63-4) in Hard Food. Ephestia pupal weight is not affected by food
viscosity (ANOVA; F2,93 = 0.21, P = 0.81). The pupal weights for Plodia and
Ephestia are shown in Figure 2.7b.
Regarding mortality, a generalised linear model with binomial errors found no
significant effect of different food types on the survival of Plodia and Ephestia larvae
for either the time (F9,2= 2.64, p= 0.274) or weight experiments (F= 0.58, p = 0.63), as
well as no interaction existing between food type and species (F=1.69, p= 0.371).

39
Figure 2.7 – Development time and Pupal weight on different food types.
a) The mean development time (+SE) of Plodia and Ephestia in Soft (0ml), Intermediate (60ml) and Hard (140ml) food, with the number of larvae measured. Food viscosity does not significantly change the development time of both Plodia (ANOVA; F2,121 = 0.22, P = 0.802) and Ephestia (DF = F2,188 = 0.44, P = 0.64). b) The mean pupal weight (+SE) of Plodia and Ephestia in Soft (0ml), Intermediate (60ml) and Hard (140ml) food. Food viscosity does not significantly change the pupal weight of both Plodia (ANOVA; F2,177 = 0.23, P = 0.79) and Ephestia (F2,93 = 0.21, P = 0.81).
b)
a)

40
Discussion
An important question concerns how the addition of water produces such a significant
effect on the texture and viscosity of the food. The point at which the water is added
to the food is crucial, suggesting water added to the cereal-yeast mixture alters the
way in which honey and glycerol combine to the mix. A possible explanation is that
water forces the formation of small clumps of cereal-yeast, and honey attaches to the
outside of these small clumps so sticking them together. As more water is added, the
number of these clumps increases, so the effect of honey sticking them together
becomes more apparent. This forces the food to become denser and hardens as the
excess water evaporates. Water evaporation means the humidity of Hard Food is not
significantly different to food with no water. One effect of such clumping of food is
that resources may become unevenly distributed. This is countered by the long time
(10-15 minutes in an industrial food mixer) the water is mixed into the cereal-yeast.
Mixing makes small food clumps that are evenly distributed throughout the food,
preventing any variation in food quality.
The results indicate that rendering standard medium viscous by adding water
does have an effect on the movement rate of Plodia interpunctella larvae. Increasing
the amount of water always resulted in some reduction of movement rate (Figure
2.4a), however a multiple comparison analysis showed there were only three water
levels that produced significantly different movement rates. The movement rate was
10.6cm in food with no water, 5.08cm in food with 60ml water and 2.8cm in food
with 140ml water (Figure 2.4b). The results from these three distinct levels of food
viscosity (Soft = 0ml, Intermediate = 60ml and Hard = 140ml) were further examined
to produce dispersal kernels (Figure 2.5a). The distances moved by individual Plodia
larvae in Soft Food ranged from 3cm to 17cm. The frequency of distances moved was

41
relatively uniform, with as many individuals moving 5cm as moved 15cm. The
dispersal kernel in Intermediate Food showed movement ranging from 1-12cm.
Within this range, the majority of larval movement was restricted to 1cm to 5cm.
Movement in the Hard Food ranged from 1-6cm, with most individuals only moving
1-3cm. Therefore, despite considerable movement variation within each food type,
the upper limit and overall range of Plodia movement are both reduced with
increasing viscosity.
The significant decline in movement rate was not matched for Ephestia
cautella larvae (Figure 2.4b). For the three viscosity food levels there was a small but
insignificant decline in mean movement rate. The mean distance moved by Ephestia
larvae in Soft Food was 3cm, in Intermediate Food 2.62cm and in Hard Food 2.57cm.
The dispersal kernels for Ephestia movement are shown in Figure 2.5b. In all three
food types, movement is primarily restricted to 1-3cm. However the tail of dispersal
in the Soft Food is long, with individuals moving up to 10cm., contrasting to the 6cm
upward limit in Intermediate and Hard Foods. It appears the higher movement rate in
the Soft Food is brought about by a minority of individuals capable of long distance
dispersal, a capability removed by the increased viscosity of Intermediate and Hard
Foods. The possible reasons why Plodia larvae move at a faster rate than Ephestia
are discussed in Chapter 7.
For both Plodia and Ephestia, there was insignificant difference in the
development time, pupal weight and mortality of individuals fed on Soft,
Intermediate and Hard Food (Figure 2.7). This indicates that adding water does not
alter the nutritional value of the food nor has a detrimental impact on the ability of
larvae to feed. Also the humidity of food has an important effect on Plodia and
Ephestia, with low humidity causing higher mortality and longer development times
42
(Johnson et al., 1992). As no change was observed, this suggests the methods of
inducing are not associated with a change in food humidity.
These results indicate the method of altering food viscosity only changes larval
movement, so has potential to change the spatial structure of larval populations.
Figure 2.6 demonstrates the size of area in which individuals, for both species, have
the potential to experience in different food types. Regarding Plodia, the mean
potential area larvae can experience in Soft Food is 88.74cm, which is reduced to
20.26cm in Intermediate Food and 6.15cm in Hard Food. The effect is less dramatic
for Ephestia with the mean potential area declining from 7.07cm in Soft Food to
5.39cm in Intermediate Food and 5.17cm in Hard Food. This shows how restricting
larval movement may potentially cause aggregated clumping of individuals. Eggs are
laid in batches and in Soft Food hatched larvae rapidly move away from the
oviposition site and spread themselves across the environment. In the more viscous
food types, hatched individuals may be unable to move away from the oviposition site
and are therefore forced together into clumps.
The movement estimates discussed above are based on the assumption that
larvae move in a straight line through the food media. In larval populations, this is
unlikely to be a true reflection of larval dispersal, as larvae will primarily move to
avoid the competitive interactions they experience with other larvae. As such, the
direction of movement will be determined by the density and position of local
conspecifics, meaning the true movement of larvae through the food environment is
likely to be zig-zagged and may involve repeated movement through the same region
of space. However the movement estimates discussed in this chapter do give an
indication of the relative effects of food viscosity on movement and can indicate how
43
restriction determines spatial aggregation in combination with cohort and population
scale experiments described in later chapters.
The assessment of movement rates was considered only for the period of time
taken for individuals to develop from the first instar to third instar. However no
measurements were taken of the effect food viscosity has on the movement of fourth
and fifth instars, and therefore no direct inferences can be made about the spatial
structure of later instars. This limitation in the methodology may be important. Early
instars are crucial in host-granulosis virus dynamics because they lack maturation
resistance and so are highly vulnerable to infection (Sait et al., 1994c). However later
instars also have an important role in infection because large, late instars that are
infected with granulosis virus can be potentially cannibalised by a large number of
healthy larvae. The high concentration of virus particles within large, infected larvae
make it likely that many of the susceptible larvae that feed on the infected larva will
ingest enough virions to become infected (Knell, et al., 1998a). As a result, it is likely
that late infected larvae will be the primary source of infection within a Plodia-
granulosis virus system and their spatial distribution may ultimately determine how
differences in larval movement rate effect Plodia-granulosis virus interactions. Also
later instars are preferentially attacked by parasitoids such as Venturia canescens,
meaning further information concerning late instar movement would be essential for
the use of the methodology presented here in the study of host-parasitoid interactions.
Later instars are also important in larval competition processes. Their size
allows them to dominate competitive encounters with smaller instars, by either
cannibalising or interfering with the feeding of early instars. Such age structured
asymmetric encounters are crucial in driving the generation cycles characteristic of
Plodia and Ephestia populations (e.g. Gurney et al., 1983; Sait et al., 1994b). Also

44
later instars have a tendency to move out of the food medium in search of suitable
pupation sites, allowing them to disperse through the environment independent of
food viscosity and so escape highly competitive regions in space.
Both Plodia and Ephestia have characteristics that make them highly suitable
species for this type of experiment. Both species possess the ability to eat a wide
variety of foods, ranging from soft, elastic foods (e.g. wheat) to hard, rigid foods (e.g.
nuts). Therefore they already have the physical ability to gain nutrients from food
types matching the texture of the mediums created in this study. Whether monophagic
species could prosper equally well in soft and hard media is debatable. An important
problem in studying spatial host-parasite interactions is the difference in how hosts
and parasites disperse through the environment. In the Plodia-granulosis virus
interaction, the predominant infectious unit is the infected larva, which is
cannibalised by non-infected larvae. Therefore another advantage of using Plodia in
spatial studies is that the virus infectious unit possesses a fundamentally similar
behaviour to potential hosts. If we change the spatial structure of the host population,
the corresponding spatial structure of the virus population will be altered in a
qualitatively similar way. On a more general note, both species are easily bred and
maintained in laboratory incubators and controlled temperature rooms, with high
survivability and reproductive rates found at 27ºC and a 24 hour light:dark regime of
16h:8h.

45
Chapter 3
Spatial Structure and Competition in Two
Lepidopteran Species Plodia interpunctella
and Ephestia cautella

46
Abstract
Larval competition experiments within and between two lepidopteran stored product
pests Plodia interpunctella and Ephestia cautella were carried out in a range of food
viscosities. Restricting the movement of individuals altered the intensity of
intraspecific competition. In Soft Food, where movement rates were high, the growth
rate and survival of larvae were both high, indicating less intense competition. In
Hard Food, where movement rates were restricted, the intensity of competition
increased, with fewer individuals surviving and those that did displaying lower
growth rates. This difference is proposed to have occurred because high movement
rates allow individuals to disperse through the food environment and avoid
competitive encounters. When movement is low, individuals are forced into
aggregations and are unable to move away from competitive encounters.
Interspecific competition in Soft Food always resulted in the dominance of
Plodia over Ephestia. This superiority was lost when movement was restricted, with
no difference in the survival of Plodia and Ephestia larvae in the Hard Food. In Soft
Food, Plodia move at a greater rate than Ephestia and so are therefore likely to be
better able to escape competitive encounters and quickly exploit any competition-free
space in the environment. In viscous foods, the reduced movement rate of Plodia
prevents larvae from avoiding intraspecific encounters and the greater rate of
competition induced Plodia mortality reduces the number of detrimental interspecific
encounters experienced by Ephestia.

47
Introduction
The ecological mechanisms that promote coexistence between competing species are
of great interest to both theoretical and applied ecology. The processes by which
species utilise resources and interact with competitors of different species determine
the composition and evolution of community assemblages (Pacala & Levin, 1997;
Tilman, 1996). Early modelling of the competitive exclusion principle suggested that
superior competitors would always drive inferior competitors extinct and that
therefore the number of species that did coexist is restricted by the number of
resources (Buttel et al., 2002; MacArthur & Levins, 1964; Volterra, 1928). This fails
to describe much of the biodiversity in nature (Doncaster, 2001; Hutchinson, 1961)
and a range of ecological mechanisms generating species coexistence have been
proposed and discussed. The proposed mechanisms include population size
fluctuations offering temporal refuges for inferior competitors (Chesson & Warner,
1981; Levins, 1979), intermediate sized disturbances preventing competitive
exclusion (Grime, 1973; Mouquet et al., 2002) and inter-species similarity in life-
history traits (Chesson, 1991: Hubbell, 1979). A competition-colonisation life-history
trade off, with inferior competitors possessing a higher dispersal rate than superior
competitors (for empirical evidence for the trade-off see Armstrong, 1976; Hanski &
Ranta, 1983; Tilman, 1994), can also theoretically promote coexistence,
(Amarasekare & Nisbet, 2001; Bolker & Pacala 1999; Holmes & Wilson, 1998;
Skellem, 1951). This allows the inferior competitor to exploit parts of the
environment before the superior competitor and thereby avoid interspecific
competition.
Spatial heterogeneity is another factor that may explain how a competitively
inferior species can persist over time (Lehman & Tilman, 1997). Populations of

48
competing species tend to be aggregated, with individuals distributed in small,
restricted areas. Such inhomogeneous distributions can form through both
endogenous and exogenous processes. Exogenous heterogeneity is created by the
patchy distribution of resources, leading to spatial variation in habitat quality
(Doncaster, 2001; Molofsky et al., 1999). A mosaic pattern of resources can generate
aggregations and species segregation through species-specific preferences and
responses to the spatially variable environment (Grubb, 1986; Ives, 1988).
Endogenous heterogeneity is generated through the necessarily restricted dispersal of
organisms through the environment. This can result in populations with irregular
distributions that are entirely self-organised. The universal nature of both processes
underlying spatial heterogeneity means that all community dynamics possess a spatial
component.
The relationship between spatial heterogeneity and biodiversity has been the
subject of a large number of theoretical studies, with a correspondingly diverse range
of conclusions. In some models, it is the interaction between heterogeneity and life
history trade-offs that produces coexistence (Skellem, 1951). This is due to species
clusters being assumed to be dynamic, with interspecific interactions occurring at
cluster edges. In the absence of life-history trade-offs, the superior competitor wins
these interactions and so gradually spreads through the environment eliminating the
inferior species (Neuhauser, 2002; Neuhauser & Pacala, 1999). Modelling
aggregation caused through egg clutch laying also indicated that spatial heterogeneity
alone was not enough to generate coexistence (Atkinson & Shorrocks, 1981). Since
all the competing species experienced similar levels of intraspecific competition
within egg clutches (Green, 1986), the inferior species failed to coexist without a
competition-clutch size trade-off (Heard & Remer, 1997). Tilman (1994) showed that

49
competition-colonisation trade-offs within a heterogeneous environment could create
a broad spectrum of coexistence that can persist indefinitely. The trade-off functions
used were step-wise meaning the rate of inferior competitor displacement was
constant, regardless of the superiority of the winning competitor. Adler & Mosquera
(2000) smoothed the shape of these trade-off functions and found that the biodiversity
was entirely dependent upon the steepness of the function. The conclusion of this
particular work was that spatial heterogeneity was irrelevant, citing the sole
importance of life-history trade-offs in generating coexistence.
However there are a number of models that suggest spatial aggregation can
promote coexistence alone, without invoking life-history trade-offs. The requirement
for trade-offs is removed by coupling localised dispersal with non-instantaneous
displacement of inferior competitors (Higgins & Cain, 2002). This creates temporal
and spatial refuges, so reducing the need for a colonisation-competition trade-off. In
addition, high levels of intraspecific competition within aggregations of the superior
species can reduce its population size to the extent that interspecific competition is
reduced sufficiently to allow inferior competitors to coexist (Bolker & Pacala, 1999;
Neuhauser & Pacala, 1999; Pacala, 1986; Weiner & Conte, 1981). When species have
different dispersal rates, the sizes of their interaction neighbourhoods are also
different. This can lead to a situation where an individual of the superior competitor is
more likely to encounter an individual of a different species (Murrell & Law, 2003).
The superior competitor outcompetes the inferior individuals, leading to increasingly
less mixed populations. This in turn generates species aggregations that are both more
stable and segregated, with clusters of the superior species unable to spread across the
environment (Murrell & Law, 2003). Even if species aggregation cannot maintain an
indefinite coexistence, it can delay competitive exclusion for long enough so non-

50
spatial mechanisms of coexistence can start to influence the community dynamics
(Huston, 1979).
The contradictory nature of much competition theory is indicative of a
significant lack of empirical research. This chapter attempts to study the importance
of movement rates and aggregation in a competition system comprising of two
phycitid moth species. Plodia interpunctella (Plodia) and Ephestia cautella
(Ephestia) are cosmopolitan storage product pests with comparable life histories. As
they share a similar range of climatic tolerance and food preference, it is likely the
two species compete whenever their distributions overlap (Haines, 1981). A
competition experiment by Allotey and Goswami (1992) found the outcome of
competition depended entirely on which species colonised the food first and that
coexistence never happened. The process of exclusion can be explained through the
competitive effect of late instar larvae on early instar larvae. One species is
introduced first and lays its eggs. The second species is introduced but its eggs and
early instar larvae are both outcompeted and predated upon by the larger, older larvae
of the first species. Founder exclusion explains why it is very rare to find both species
infesting the same barn yet it is possible to find Plodia and Ephestia dominating barns
within the same locality (Allotey & Goswami, 1992).
It is possible to alter the movement rates of Plodia and Ephestia larvae by
changing the viscosity of the food medium. Figure 2.4 in Chapter 2 shows increasing
food viscosity restricts the movement rate of larvae. Reducing the movement rate can
potentially change the spatial structure of competing populations as individuals are
forced to experience a smaller part of the environment and so become aggregated
(Figure 2.6). Here I study the effect aggregation formation has on the intensity of
intraspecific competition over different densities for both species. Interspecific
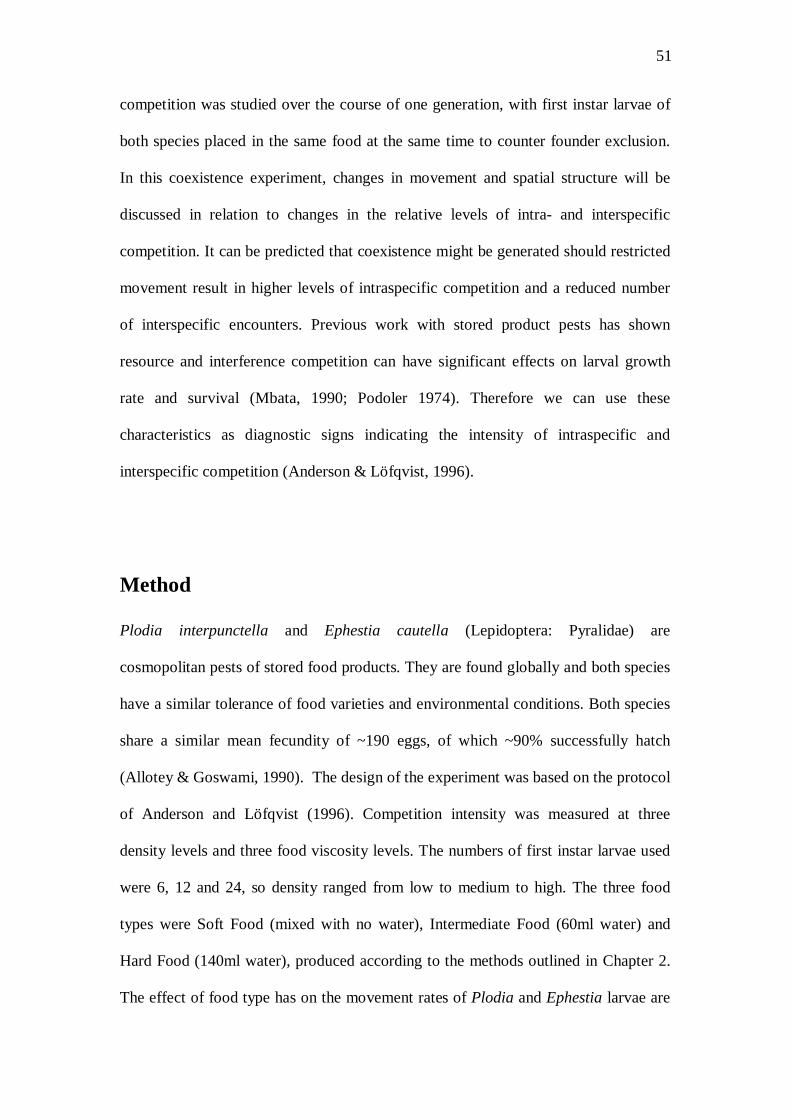
51
competition was studied over the course of one generation, with first instar larvae of
both species placed in the same food at the same time to counter founder exclusion.
In this coexistence experiment, changes in movement and spatial structure will be
discussed in relation to changes in the relative levels of intra- and interspecific
competition. It can be predicted that coexistence might be generated should restricted
movement result in higher levels of intraspecific competition and a reduced number
of interspecific encounters. Previous work with stored product pests has shown
resource and interference competition can have significant effects on larval growth
rate and survival (Mbata, 1990; Podoler 1974). Therefore we can use these
characteristics as diagnostic signs indicating the intensity of intraspecific and
interspecific competition (Anderson & Löfqvist, 1996).
Method
Plodia interpunctella and Ephestia cautella (Lepidoptera: Pyralidae) are
cosmopolitan pests of stored food products. They are found globally and both species
have a similar tolerance of food varieties and environmental conditions. Both species
share a similar mean fecundity of ~190 eggs, of which ~90% successfully hatch
(Allotey & Goswami, 1990). The design of the experiment was based on the protocol
of Anderson and Löfqvist (1996). Competition intensity was measured at three
density levels and three food viscosity levels. The numbers of first instar larvae used
were 6, 12 and 24, so density ranged from low to medium to high. The three food
types were Soft Food (mixed with no water), Intermediate Food (60ml water) and
Hard Food (140ml water), produced according to the methods outlined in Chapter 2.
The effect of food type has on the movement rates of Plodia and Ephestia larvae are

52
presented in Figure 2.4. For Plodia, the mean distance travelled was 10.63cm (se
±0.73) in Soft Food, 5.08cm (se ±0.61) in Intermediate Food and 2.8cm (se ±0.26) in
Hard Food. This significant reduction in Plodia movement rate was not matched for
Ephestia, with movement rates in Soft, Intermediate and Hard Foods 3cm (se ±0.65),
2.62cm (se ±0.45) and 2.57cm (se ±0.33) respectively. Food viscosity had no effect
on the development time and adult weight of either species (Figure 2.7).
For the study of intraspecific competition, 6, 12 or 24 newly hatched first instar
larvae of one or other of the species were placed upon 2-gram balls of food. For the
study of interspecific competition, the density levels were the same but half of the
larvae placed on each of the food balls were Plodia while the other half were
Ephestia. Each food ball was placed separately inside a sealed plastic pot to prevent
emerging adults escaping. The time required for first instar larvae to develop into
adults was used as a measure of the development time and each adult was removed,
sexed and weighed at emergence. From these measurements, the growth rate of
individuals was calculated by dividing adult weight by development time. The
proportion of larvae that survived into adulthood was also noted. Larval growth rate
and survival rate were used to indicate the degree of competition within different food
types and density levels because the smaller amounts of food and space available
under intense competition are associated with an increased probability of death
together with surviving individuals exhibiting longer development times and smaller
adult weights, and thus smaller growth rates (Mbata, 1990; Podoler 1974).
In all, there were nine density-food combinations: 6-Soft; 6-Intermediate, 6-
Hard; 12-Soft; 12-Intermediate; 12-Hard; 24-Soft; 24-Intermediate; and 24-Hard.
Each density-food combination was replicated twelve times for both the intra- and
inter-specific competition experiments, making a total of 216 pots for the intraspecific

53
experiments (108 Plodia and 108 Ephestia pots) and 108 pots in the interspecific
experiments. Blocking was carried out to prevent any differences between stock
Plodia and Ephestia generations from confounding the results. Each block consisted
of the nine possible density-food combinations and all the larvae used came from
eggs laid by the same group of adults. All larvae were kept in incubators set at 27ºC
and ~35% humidity, with a 16h:8h light:dark regime.
Statistical analysis was carried out in S-Plus. The effect of food type and
density level on growth rates was analysed using a linear mixed effects model.
Growth rate was included as a dependent variable and the covariates include food,
density, sex, species and replicate, with replicate included as a random factor. Sex
was not included in any interactions since we are interested in the effect food and
density has on competition intensity. To avoid pseudoreplication, the factor replicate
was nested within covariates. The data were square root transformed to generate a
homoscedastic scatter pattern of residuals.
Survival in the intra- and inter-specific experiments was analysed using a
generalised linear model with binomial errors. Survival was considered as the
proportion of the individuals placed on food balls as first instars that survived
competition and emerged as adult moths. The covariates in the generalised linear
model were food, density, species and the square rooted mean growth rate of
surviving individuals. Replicate was nested within covariates only in the analysis of
the interspecific experiment in order to group the survival of the Plodia and Ephestia
that were placed together in the same food balls. Nesting was not required for the
analysis of survival in intraspecific competition because there was only one value of
survival for each food ball.

54
For both mixed effects and binomial models, full models were fitted then
insignificant interactions were removed using the S-Plus ‘update’ procedures. The
tables of coefficients from the models were used to determine the effect of food type
in the intraspecific experiment and the difference between species in the interspecific
experiment. The treatment contrasts function of S-Plus was used to generate the
coefficients. S-Plus initially presents the coefficient outputs for the generalised linear
model in the form of logits (ln(p/1-p)). However in the results section, the logit
coefficients are given in the direct form of the proportion of individuals surviving
competition. Proportions were determined by transforming logits using the equation
1/(1+1(exp(coefficient))) (Crawley, 2002).

55
Results
The Effects of Food and Density on Growth Rate
Growth Rate in Intraspecific Competition
Table 3.1 shows the effect food type and density level have on the growth rate (adult
weight/development time ratio) of Plodia interpunctella and Ephestia cautella larvae
when experiencing solely intraspecific competition. Model coefficients are discussed.
There is a significant interaction between food and density, suggesting the effect
increasing density has on growth rate is different in Soft, Intermediate and Hard
Foods. There is also a significant species interaction with food and density suggesting
the way in which growth rate changes with density and food type is different for the
two species. Such interactions are explored graphically in Figure 3.1 showing the
mean growth rates (with standard errors). For Plodia in Soft Food, the growth rate at
density 24 was significantly lower than at densities 6 and 12 (Soft Food-density: 6
coefficient = 0.0189, 24 coefficient = 0.0173, d.f. = 179, t = 2.263, p = 0.0235: 12 =
0.0189, 24 = 0.0173, t = 2.2951, p = 0.0229). The same relationship between density
and growth rate was found in Intermediate Food, with the growth rate significantly
lower at density 24 compared to other densities (Intermediate Food-density: 6 =
Table 3.1. A mixed effects model examining the factors determining Plodia and Ephestia growth rate when experiencing intraspecific competition. Growth rate was square root transformed and replicate was fitted as a random factor nested within the other covariates.
Df Mean Sq F Pfood 2 0.000045 11.713 <0.001
density 2 0.000135 35.056 <0.001species 1 0.00824 2136.766 <0.001
sex 1 0.00512 1327.486 <0.001replicate 11 0.0000078 2.011 0.024
food:density 4 0.0000234 6.058 <0.001food:species 2 0.0000896 23.225 <0.001
food:density:species 6 0.0000207 5.374 <0.001Residuals 1395 0.0000039

56
0.0186, 24 = 0.0172, d.f. = 179, t = 2.29, p = 0.0231: 12 = 0.0188, 24 = 0.0172, t = -
3.792, p <0.001). In Hard Food, however, increasing density was not associated with
any significant change in growth rate (Hard Food-density: 6 = 0.0179, 24 = 0.0172,
d.f. = 179, t = 1.615, p = 0.106).
The relationship between food and density for Ephestia is broadly similar to
that of Plodia. In Soft Food, there was a significant decline in growth rate between
density 12 and 24 (12 coefficient = 0.0151, 24 coefficient = 0.013, d.f. = 179, t =
2.05, p = 0.048). There was a different relationship in Intermediate Food, with the
growth rates at density 6 and 12 both significantly larger than at 24 (Intermediate
Food-density: 6 = 0.0152, 24 = 0.0111, d.f. = 179, t = 4.58, p <0.001; 12 = 0.0143, 24
= 0.0111, t = -2.561, p = 0.0127). In Hard Food, density had no significant effect on
growth rate (Hard Food-density: 6 = 0.0102, 24 = 0.0107, d.f. = 179, t = 0.769, p =
0.445). Therefore in both species, increasing density forces growth rate to decline in
Soft and Intermediate Food but no change is found in Hard Food.
Overall, the model coefficients show that Plodia exhibited a greater growth rate
than Ephestia (sqrt(growth rate) x species: Plodia coefficient = 0.0177, Ephestia
coefficient = 0.013, d.f. = 179, t = 14.17, p <0.001). Also the coefficients relating to
the significant interaction between food and species reveals for Plodia, increasing
food viscosity failed to result in a significant decline in growth rate (Plodia-food: Soft
= 0.0179, Hard = 0.0174, d.f. = 179, t = 0.479, p = 0.633). For Ephestia, the growth
rate in Hard Food was significantly lower compared to Soft and Intermediate Foods
(Ephestia-food: Soft = 0.0136, Hard = 0.0108, d.f. = 179, t = 4.622, p <0.001;
Intermediate = 0.0134, Hard = 0.0108, t = 3.922, p <0.001).

57
Growth rates in Interspecific Competition
The effect covariates had upon the growth rate of Plodia and Ephestia larvae when
individuals competed in interspecific conditions is shown in Table 3.2. The
coefficients from the model are discussed.
A significant interaction between food, density and species is apparent in the analysis
and this three-way interaction is explored graphically in Figure 3.1. For Plodia, the
growth rate at density 24 was significantly lower than at other densities in every food
type, with no difference occurring between densities 6 and 12 (Plodia-Soft-density: 6
coefficient = 0.01864, 24 coefficient = 0.0173, d.f. = 153, t = 2.059, p = 0.0412;
Intermediate-density: 6 = 0.01852, 24 = 0.01711, t = 2.553, p = 0.012; Hard-density:
6 = 0.01797, 24 = 0.01663, t = 2.059, p = 0.0412). This Plodia food-density
relationship was different to that found in intraspecific competition, where increasing
density in Hard Food had no effect.
For Ephestia the growth rate at density 24 is significantly lower than other
densities only in Soft and Intermediate Food (Ephestia-Soft-density: 6 = 0.01559, 24
= 0.01296, d.f. = 153, t = 3.05, p = 0.0033; Intermediate-density: 6 = 0.015106, 24 =
0.01108, t = 5.138, p <0.001). There was no change in growth with density in Hard
Table 3.2. A mixed effects model examining the factors determining Plodia and Ephestia growth rate when experiencing interspecific competition. Growth rate was square root transformed and the random factor replicate was nested within covariates.
Df Mean Sq F Pfood 2 0.000569 173.994 <0.001
density 2 0.000141 43.18 <0.001species 1 0.0049 1498.04 <0.001
sex 1 0.00274 838.494 <0.001replicate 11 0.00000515 1.573 0.102
food:density 4 0.0000188 5.734 <0.001food:species 2 0.000106 32.415 <0.001
food:density:species 6 0.0000141 4.31 <0.001Residuals 812 0.00000327

58
Food (Hard-density: 6 = 0.01034, 24 = 0.01054, t = 0.332, p = 0.74). This Ephestia
food-density relationship was the same to that found in intraspecific competition,
where increasing density reduced growth rates in the softer food types but had no
effect in Hard Food.
Looking beyond the three way interaction to other aspects of the model output,
the overall growth rate of Plodia remained significantly greater than that of Ephestia
(sqrt(growth rate) x species: Plodia coefficient = 0.0177, Ephestia coefficient =
0.013, d.f. = 179, t = 14.17, p <0.001). In an additional piece of analysis, the growth
rates of the two species were directly compared between intra- and inter-specific
competition environments using a mixed model with growth rate square-rooted and
replicate fitted as a random effect. For both species, there was no difference in the
growth rate (Plodia-competition: Intra coefficient = 0.01768, Inter coefficient =
0.01769, t = -0.0852, p = 0.932; Ephestia-competition: Intra = 0.013, Inter = 0.01264,
t = 0.617, p = 0.5369).

59
Figure 3.1 – The effect food and density has on the growth rates of Plodia
interpunctella and Ephestia cautella in intraspecific and interspecific experiments.
Growth rate was considered the weight of adults divided by development time and were square root transformed to generate homogeneous variance. Mean growth rates are shown with standard errors. The blue points represent Plodia data points and the red represents Ephestia. In intraspecific competition experiments, increasing density caused the growth rate of both species to decline in Soft and Intermediate Food but there was no effect of density in Hard Food. In interspecific competition experiments, the growth rate of Plodia is larger than Ephestia in every food-density combination. For both species, increasing density caused significant growth rate declines in all food types except the insensitivity to density of Ephestia in Hard Food. At high densities, increasing food viscosity reduces the proportion of Plodia surviving competition but increases the proportion of Ephestia surviving. This makes the difference between the two species insignificant in Intermediate and Hard Food.

60
The Effects of Food and Density on Survival
Survival in Intraspecific Competition
The influence covariates had upon the survival of Plodia and Ephestia larvae is
shown in Table 3.3. The model logit coefficients transformed into proportions are
discussed below.
The analysis reveals the effect of increasing density on species survival rate is
dependent on food type and this three-way interaction is shown graphically in Figure
3.2. For Plodia, increasing density was only associated with lower survival in
Intermediate Food, with no difference occurring in Soft and Hard Food (Plodia
survival x Soft-density: 6 = 0.639, 24 = 0.67, t = 0.631, p = 0.529; Hard-density: 12 =
0.639, 24 = 0.441, t = 1.9, p = 0.065). In Intermediate Food, there was a significant
decline in survival between density level 6 and 24 (Intermediate-density: 6 coefficient
= 0.72, 24 coefficient = 0.51, t = 2.01, p = 0.0458).
For Ephestia, increasing density resulted in reduced survival in Soft and
Intermediate and Hard Food. In Soft Food, there was a significant decline in the
proportion surviving between density levels 6 to 12 and 12 to 24 (Ephestia survival x
Soft-density: 6 = 0.903, 12 = 0.646, t = 2.75, p = 0.0063; 12 = 0.646, 24 = 0.326, t =
2.24, p = 0.025). In Intermediate Food, there was a significant decline in survival
Table 3.3. A generalised linear model with binomial errors examining the factors determining Plodia and Ephestia mortality rate when experiencing intraspecific competition. Growth rate was square rooted.
Df Mean Sq F Pfood 2 31.418 17.371 <0.001
density 2 47.004 25.989 <0.00species 1 149.473 82.644 <0.00
growth rate 1 7.747 4.284 0.0398replicate 11 1.36 0.738 0.71
density:species 2 23.264 12.863 <0.001food:density:species 10 3.522 1.947 0.041
Residuals 197 1.809

61
between density 6 and 24 (Intermediate-density: 6 = 0.667, 24 = 0.194, t = 2.119, p =
0.0367). In Hard Food, there was a significant decline in survival between densities 6
and 24 (Hard-density: 6 = 0.333, 24 = 0.156, t = 2.717, p = 0.0072). Therefore for
Plodia the only change in survival with density occurs in Intermediate Food, whereas
in Ephestia density changes survival in all three food types.
Examining other features of the model reveals a significant difference in the
overall survival of Plodia and Ephestia, with Ephestia being characterised by a
generally lower survival rate when experiencing intraspecific competition than Plodia
(survival x species: Plodia coefficient = 0.599, Ephestia coefficient = 0.451, t =
3.091, p = 0.0023). Also food type had a significant effect on the survival of Plodia
and Ephestia larvae, with survival greater in Soft Food than in Intermediate and Hard
Foods (Soft = 0.643, Intermediate = 0.516, t = 2.85, p = 0.0048: Soft = 0.643, Hard =
0.397, t = 3.9591, p <0.001).

62
Survival in Interspecific Competition
The effect covariates had upon the survival of Plodia and Ephestia larvae when
individuals competed in interspecific conditions is shown in Table. 3.4 and the
coefficient outputs are discussed below, transformed from logits into proportions.
The significant interaction between food type and species is displayed in Figure 3.2.
The proportions of Plodia and Ephestia surviving competition in Soft Food were
significantly different compared to the survival in Intermediate and Hard Foods. For
Plodia, the proportion surviving competition in Soft Food was significantly larger
than in the more viscous food types (Plodia survival x food: Soft coefficient = 0.829,
Intermediate = 0.715, t = 2.225, p = 0.0274; Soft = 0.829, Hard = 0.639, t = 2.9945, p
= 0.0036).
For Ephestia, the reverse was true, as the proportion surviving in Soft Food was
significantly smaller than in more viscous foods (Ephestia survival x food: Soft =
0.472, Intermediate = 0.625, t = -4.584, p<0.001; Soft = 0.472, Hard = 0.602, t = -
3.917, p<0.001). Therefore the survival rate of Plodia is negatively affected by
increasing food viscosity whereas Ephestia is positively affected by increasing food
viscosity. This results in a convergence in the proportion of Plodia and Ephestia
Table 3.4. A generalised linear model with binomial errors examining the factors determining Plodia and Ephestia survival when experiencing interspecific competition. Replicate was nested within the other covariates.
Df Mean Sq F Pfood 2 1.339 1.118 0.329
density 2 47.849 39.935 <0.001species 1 67.289 56.16 <0.001
growth rate 1 0.749 0.625 0.43replicate 11 1.038 0.869 0.572
density:species 2 4.335 3.619 0.0286food:species 2 29.523 24.64 <0.001
Residuals 205 1.198

63
surviving interspecific competition, with the numerical difference between the species
decreasing with food viscosity.
In a piece of additional analysis similar to that carried out for growth rates, the
survival of the two species was compared between intra- and inter-specific
competition environments using a generalised linear model with binomial errors. For
Plodia, there was no significant difference between the two environments (Plodia-
competition: Intra = -0.599, Inter = 0.682, t = 1.438, p = 0.152). However, there was a
significant difference for Ephestia, as the survival in interspecific competition is
greater than intraspecific (Ephestia-competition: Intra = 0.451, Inter = 0.566, t = -
5.88, p <0.001). Further examination of the coefficients shows this difference for
Ephestia is dependent on food type, with intraspecific survival greater than
interspecific in Soft Food (Ephestia in Soft Food: Intra = 0.625, Inter = 0.472, t =
4.42, p <0.001). The opposite is true in Intermediate and Hard Food, where survival is
greater in interspecific competition (Intermediate Food: Intra = 0.456, Inter = 0.625, t
= -4.02, p <0.001; Hard Food: Intra = 0.272, Inter = 0.602, t = -8.221, p <0.001).
64
Figure 3.2 – The effect food and density has on the survival of Plodia interpunctella
and Ephestia cautella in intraspecific and interspecific experiments.
Mean survival rates are shown with standard errors. The blue points represent Plodia data points and the red represents Ephestia. In intraspecific competition experiments involving Plodia, increasing density only affected survival in Intermediate Food. For Ephestia, density reduced survival in all food types. In interspecific competition experiments, At high densities, increasing food viscosity from Soft to Hard reduces the proportion of Plodia surviving competition but increases the proportion of Ephestia surviving. This renders the difference between the two species found in Soft Food insignificant in Intermediate and Hard Food. At high densities, increasing food viscosity reduces the proportion of Plodia surviving competition but increases the proportion of Ephestia surviving. This makes the difference between the two species insignificant in Intermediate and Hard Food.

65
Discussion
In this chapter, I studied the effects of restricted movement on intraspecific and
interspecific competition in two lepidopteran species Plodia interpunctella and
Ephestia cautella. Growth rate and survival were used as measures for competition
intensity, with larval resource and interference competition associated with decreased
growth rates and increased mortality (Mbata, 1990; Podoler 1974). The intensity of
competition of Plodia and Ephestia was studied at three different density levels and
three food viscosity levels. The density levels were low (6 individuals), medium (12)
and high (24) and the viscosity levels were Soft (0ml water), Intermediate (60ml) and
Hard (140ml).
Intraspecific competition
For Plodia and Ephestia, the survival and growth rate of larvae were greater in
Soft Food than in more viscous food types. In Hard Food, the growth rate of larvae
was lower than in Soft Food, although the decrease in Plodia was not significant
(Figure 3.1). Also for both species the proportion surviving competition was
significantly greater in Soft Food than in Intermediate and Hard Food (Figure 3.2).
These changes in competition characteristics indicate the intensity of competition
increased as the movement rate of individuals was restricted. A potential explanation
for this is that high movement rates allow larvae to move away from competitive
encounters with nearby conspecifics, and move into competition-free where they can
feed without interference. Restricting movement, using more viscous foods, prevents
larvae from moving away from competitive encounters and the reduced access to
food and space causes lower growth rates and greater mortality.

66
The lack of sensitivity of Plodia growth rate to food viscosity, relative to
Ephestia, is perhaps counter intuitive considering the great effect food viscosity has
on Plodia movement rate (Figure 2.4). However it might be explained by considering
the fast growth rate of Plodia, which results in individuals spending a shorter time in
the larval state than Ephestia. This reduces the degree of food and interference
competition experienced.
The effect of increasing density in the three food types also indicates restricting
larval movement causes the intensity of intraspecific competition to increase. Plodia
and Ephestia growth rates significantly decline with density in Soft and Intermediate
Food but there is no effect of increasing density in the Hard Food (Figure 3.1). Lets’
first consider the reasons for declining growth rate within foods that permit relatively
high movement. At low density, when there is ample food and space, such high rates
of movement mean individuals have the ability to escape competitive encounters and
disperse into competition-free environments. Through this ‘race for space’ process,
individuals at low density can spread themselves evenly across the environment and
minimise the detrimental consequences of competition. Therefore individuals have a
rapid growth rate. At high density in Soft and Intermediate Food, the amount of food
and space available for individuals diminishes. High movement rates no longer enable
individuals to avoid encounters with conspecifics because there is little competition-
free space available. The resulting intense resource and interference competition
causes growth rates to decline.
In Hard Food, where movement rates are restricted, density does not result in
any significant change in the growth rates of either species (Figure 3.1) indicating that
increasing density does not change the intensity of intraspecific competition. This can
be explained by considering competition at low densities. Despite the ample food and

67
space available low density, low movement means larvae are incapable of escaping
competitive encounters and dispersing into the surrounding competition-free
environment. Therefore increasing density has no further effect on the level of
competition each individual faces and so growth rate remains the same.
The relationship between Ephestia survival and increasing density is the same as
Ephestia growth rate, since density was only found to reduce survival in Soft and
Intermediate Foods (Figure 3.2). This matches the explanation of the growth rate
patterns, where restricted movement prevent individuals from avoiding competition
and freely utilising the food resources available at low densities. The intense
competition that results causes high levels of mortality that does not proportionately
change at higher densities. However Plodia survival has a different pattern, with
density only affecting survival in Intermediate Food. As previously discussed,
increasing density in Soft Food did result in reduced Plodia growth rates and
therefore more intense competition. However the very high movement rates of Plodia
in Soft Food allow individuals to disperse rapidly through the environment so
competitive encounters, though frequent, are short and so not associated with death.
This means that mortality does not proportionately increase with density. In
Intermediate Food, the moderately restricted movement still allows larvae to avoid
competition at low densities but is not enough to permit individuals to successfully
avoid long competitive encounters at high densities. This leads to a decline in the
proportion that survive with density.

68
Coexistence between Plodia and Ephestia
The coexistence experiment examined larval survival and growth rates associated
with interspecific competition between Plodia interpunctella and Ephestia cautella in
different food types. Figure 3.2 shows the proportion of surviving Plodia and
Ephestia in Soft, Intermediate and Hard Food at low (6), medium (12) and high (24)
densities.
At low densities, there is no difference between the proportion of Plodia and
Ephestia that survive interspecific competition. This is a result of the ample food and
space available for individuals, causing the intensity of detrimental competition to be
low. This pattern of coexistence breaks down at medium and high densities in Soft
Food, with the number of surviving Plodia significantly greater than Ephestia. The
numerical difference is cancelled out by increasing food viscosity, with the proportion
of Ephestia surviving increasing and the proportion of Plodia decreasing in
Intermediate and Hard Food. In these viscous food types, there is no significant
difference in the proportion of Plodia and Ephestia that survive interspecific
competition.
In general this pattern can be explained by considering the growth and dispersal
rates of the two species in different food types. In Soft Food, Plodia possess a greater
dispersal rate (Figure 2.4) and growth rate (Figure 3.1) than Ephestia. Being faster
means Plodia are better able to escape intraspecific competitive encounters and find
competition-free space. The higher movement rates allow a more uniform distribution
of individuals to emerge, where interspecific encounters are likely to occur at a
similar frequency to intraspecific encounters. Also the greater growth rate means
Plodia larvae will be physically larger than Ephestia throughout development and so
dominate any interspecific encounters. This asymmetric competition can result in

69
intense competition on Ephestia larvae through the disruption of their feeding and
their predation by Plodia. Ephestia, with a slow movement rate, are unable to escape
both intraspecific and deleterious interspecific encounters and so experience intense
competition resulting in mortality.
In contrast to Soft Food, there is no significant difference between Plodia and
Ephestia survival at higher densities in Intermediate and Hard Food (Figure 3.2). This
is because increasing food viscosity reduces the movement rate of Plodia larvae, and
so the species no longer has a significant competitive advantage over Ephestia. As
dispersal is limited, individuals are unable to escape competitive encounters and are
forced into aggregations. This aggregated spatial structure results in Plodia suffering
high rates of intraspecific encounters. The resulting decline in the intensity of
interspecific competition allows Ephestia larvae increased access to food and reduces
the degree of predation and interference from Plodia. This work provides cautious
support to theoretical models that suggest aggregation alone can promote coexistence
(Higgins & Cain, 2002; Murrell & Law, 2003). However the experiment was only
conducted over one larval generation, and therefore questions over long term
coexistence remain to be asked.
Further analysis directly comparing the survival and growth rates of the species
in intra- and inter-specific competition environments adds system specific detail to
this general description of competition between Plodia and Ephestia. Analysis of the
proportion of Plodia surviving competition in different food types revealed there was
not a significant difference between the competition environments. However for
Ephestia, significantly fewer individuals survived in interspecific competition in Soft
Food compared to intraspecific competition, but this situation was reversed in more
viscous food types. The proportion of Ephestia surviving interspecific competition

70
was larger in Intermediate and Hard Foods than in intraspecific competition. This
shows the removal of the competitive superiority of Plodia in more viscous food is a
result of more Ephestia surviving competition, rather than a decline in Plodia
survival.
Regarding the growth rates of the two species competing together, the growth
rate of Plodia was larger than Ephestia in every combination of food and density
(Figure 3.1). Also the direct comparison between the two competition environments
showed there was no significant change in the values of growth rate associated with
each food type, and this is true for both species. Therefore there is no relationship
between growth rate and survival in interspecific competition, as the greater survival
of Ephestia in viscous foods is not matched by any increase in growth rate compared
to either that of Plodia or the growth rate of Ephestia in intraspecific competition.
This difference between the survival and growth rate of Plodia and Ephestia
indicates the possible mechanics of interspecific coexistence in more viscous foods
over space and time. Chapter 2 Figure 2.4 shows increasing food viscosity restricts
Plodia movement to a much greater degree than Ephestia. The shorter dispersal of
Plodia in Intermediate and Hard Foods results in individuals unable to avoid
intraspecific encounters. These intraspecific encounters are intense because of the
rapid development of body size asymmetries resulting from the large Plodia growth
rate. These body size asymmetries cause those larvae with the most rapid growth rate
to out compete and predate the smaller Plodia larvae they are locked into competition
with. This explanation may account for the discrepancy in Plodia between the low
survival and high growth rates found in Hard Food, with the few individuals that
survive being those with the highest growth rates. At the same time, Ephestia also
experience intraspecific competition but it is less intense due to the smaller

71
requirement for food associated with their lower growth rate. Also the intense
intraspecific competition and mortality experienced by Plodia provides a window of
growth for Ephestia, where they can feed without experiencing the predation and
competition associated with encounters with Plodia. This window allows Ephestia to
grow to a larger size than would be expected in Soft Food (where Plodia experience
less intraspecific competition), and so are better equipped to survive competitive
encounters with Plodia at later stages of competition. Therefore Ephestia survival is
greater in more viscous foods because of a combination of the reduced number of
Plodia encounters early in competition and the resulting larger Ephestia larvae being
less vulnerable to predation at later stages of competition.
Previous empirical studies of spatial heterogeneity and competition
There are many mathematical models investigating competition within aggregated
communities. However there is a significant lack of empirical data examining the
implication of spatial structure on intra- and inter-specific competition (Rejmánek,
2002; Murrell et al., 2001; Stoll & Prati, 2001). Stoll & Prati (2001) tested the
coexistence of four plant species when seeds were either sown randomly or in
intraspecific clumps. Aggregation of species had the effect of reducing the biomass of
the superior competitor and improving the performance of the other species. This
result became clearer at higher densities, with increasing intraspecific competition
benefiting inferior competitors. Another experimental study of plant aggregation
found the competitive effect of barnyard grass on tomato yield was reduced and
sometimes rendered negligible by clumped grass distributions (Norris et al., 2001). In
contrast to regular and random distributions, aggregations of barnyard grass increased

72
the proportion of tomato plants evading interspecific competition, as well as
increasing the effect of intraspecific competition upon barnyard grass. Such plant
experiments have shown the more aggregated the population of competitors is, the
more intraspecific interactions become dominant (Rejmánek et al., 1992).
A rare study of animal competition was carried out to test the results of the
Atkinson & Shorrocks (1981) model of aggregation through clutch laying. By using
two species of Drosophila, the inferior competitor could persist when egg laying was
artificially restricted in space. The resulting aggregations may have promoted
coexistence by increasing intraspecific competition and creating refuges that allowed
the inferior competitor to persist despite local interspecific competition (Shorrocks,
1991). All these studies suggest that aggregated distributions result in increased
intraspecific competition and reduced interspecific competition. However there are
few studies that collect data for a long enough period of time to be sure that
population aggregation is sufficient to produce long term species coexistence.

73
Chapter 4
Spatial Heterogeneity and the Dynamics of
the Plodia interpunctella – Granulosis
Virus system

74
Abstract
Populations of Plodia interpunctella were maintained in the presence or absence of
the granulosis virus within three food viscosity types. In the no virus populations,
competition between larvae determined the size and dynamics of populations. Adult
females lay eggs in batches, causing populations to be initially aggregated. The high
movement rates in Soft Food allow these aggregations to dissipate and so populations
become evenly distributed. The resulting low larval mortality and high growth rates
mean that Soft Food populations were characterised by large population sizes and
short, regular 37.47-day cycles. The low movement rates in Hard Food prevent larvae
moving away from their oviposition site and so populations remain aggregated. The
intense competition within such aggregations causes high larval mortality and low
growth rates. Therefore Hard Food populations were characterised by small
population sizes and extended, 41.96-day cycles.
Restricting larval movement rates also had a significant impact upon the
dynamics of the Plodia-granulosis virus interaction. In Soft Food populations, the
uniform distribution of larvae led to a high viral infection rate, resulting in lower
larval growth rates and a correspondingly extended cycle periodicity, due to either
sublethal infection or as a cost of evolved resistance. In contrast, the high contact rate
within Hard Food population causes high rates of localised infection within larval
aggregations, inducing great larval mortality and so preventing the asymmetric larval
interactions necessary for the maintenance of regular population cycling.

75
Introduction
The spatial relationships of natural enemy interactions have recently become the
subject of a great deal of study. Much of the work has been theoretical and indicates
the characteristics of many natural enemy systems cannot always be understood by
considering populations to be spatially homogeneous (Tilman & Kareiva, 1997).
Instead, it is the fine scale relationships within and between clumps of individuals that
can be important. Spatially orientated approaches have been used to examine the
persistence, dynamics and evolution of a variety of host-parasite interactions (e.g.
Cliff et al., 1981; Dwyer, 1992; Hassell et al., 1991; Murray et al., 1986). The
empirical work in spatial heterogeneous systems has been restricted by a lack of
general theory and the awkwardness of measuring the distribution and movement of
individuals (Doncaster et al., 1997; Harrison, 1989; Turchin, 1998). However the
work that has been carried out supports many of the theoretical conclusions made and
broadly falls into one of two categories: 1) parasite spatial heterogeneity creating
spatial refuges for hosts and 2) host heterogeneity creating reservoirs for parasites.
Patchily distributed populations can change natural enemy interactions by
generating new density dependent relationships (McCauley et al., 2000). One
arrangement where this change in density-dependence occurs is through the
heterogeneous aggregation of a host population. Large and persistent host
subpopulations act to maintain parasite presence despite extinction in smaller host
subpopulations (Keeling, 2000a; Schrag & Mittler, 1996). Such spatial reservoirs
have been observed in metapopulation structures of plant specific fungal parasites
(Burdon & Jarosz, 1991; Burdon et al., 1995; Ericson et al., 1999; Thrall &
Antonovics, 1995). The parasite is able to become endemic in large plant
subpopulations and movement from these reservoirs sustain the parasite within

76
smaller subpopulations vulnerable to extinction (Antonovics et al., 1994; Thrall &
Antonovics, 1995). A parasite reservoir system has also been shown to be important
for the dynamics of human measles (Bolker & Grenfell, 1995a, b). Towns and cities
with high population densities support measles endemicity, and from these reservoirs
the pathogen disperses to surrounding small villages and towns. The populations of
small towns are too low to maintain measles themselves but the reservoir allows
localised, short-lived epidemics to occur (Grenfell & Bolker, 1998).
Spatial heterogeneity in the distribution of the pathogen can also modify the
existing density-dependence in natural enemy systems. An area of the environment
can act as a refuge if a pathogen or predator population cannot invade or persist.
(Abrams & Walters, 1996; Hassell & May, 1973; Hochberg & Hawkins, 1992).
Refuges may have important consequences for a host-parasite interaction, with the
refuge potentially acting to stabilise the dynamics (Hochberg, 1989; Hochberg et al.,
1990; McNair, 1986, 1987). In a refuge either a fixed number or proportion of the
host cannot be infected, stabilising the interaction in two ways. First, the parasite is
prevented from driving the host extinct because not all the host population is
vulnerable. Second, movement out of the refuge provides new hosts for infection, so
preventing parasite extinction (Lynch et al., 1998).
Although the empirical support for the importance of spatial refuges is weak,
the relationship between spatial refuges and host-parasite interactions has been
examined across a range of species interactions. The parasitoid Venturia canescens
attacks Plodia interpunctella hosts by sitting on the surface of the food medium,
inserting its ovipositor and laying eggs in larvae (Harvey et al., 1994; May & Hassell,
1988). If the food medium is over 0.5cm in depth, there is a region in which larvae
cannot be parasitised. Without this refuge, the host is driven extinct by the parasitoid,
77
which then suffers the same fate (Begon et al., 1995). With the refuge, the individual
larvae that spend part of their life in the deeper food show a lower probability of
becoming parasitised (Murdoch et al., 1989) and the lowered parasitoid attack rate
allows the system to persist indefinitely (Begon et al., 1995). Bacteria-phage
interactions have also been shown to be stabilised by host refuges (Schrag & Mittler,
1996). Bacteria that were allowed to grow near the side of the container were
invulnerable to infection by two different phage types. This refuge allows both phage
types to persist much longer compared to spatially homogeneous bacteria
populations.
Spatial refuges do not need to be a fixed part of the environment in order to
change victim-enemy interactions. Instead, refuges can be temporally dynamical,
changing in position and size according to differential dispersal by enemies and
victims. An example of this is found in laboratory herbivorous mite-predatory mite
interactions, where the spatial structure of populations is dependent upon the
arrangement of plants (Janssen & Sabelis, 1992; Janssen et al., 1997; McCauley et
al., 2000; Zemek & Nachman, 1998). On individual plants, the prey species is rapidly
driven extinct by the predator, which is followed by predator extinction (Pels &
Sabelis, 1999). The same instability was found in multi-plant populations when
dispersal for both species was unrestricted. Persistence is only observed when plants
are subdivided into a group of interconnected patches. This arrangement alters the
movement rates so prey species disperse locally and predators disperse globally,
reducing the rate at which prey outbreaks are discovered by predators (McCauley et
al., 2000). The temporal lag between prey growth and predator discovery allows
some prey subpopulations to increase and, before being rendered extinct by predators,
repopulate nearby plants (Ellner et al., 2001).

78
Within this context of limited empirical work, we examine the dynamics of a
Plodia interpunctella-granulosis virus (PiGV) host-pathogen interaction within
different spatial environments. I attempt to generate endogenous spatial structure
within Plodia populations by changing the dispersal ability of individual larvae.
Populations were fed on food media of differing viscosity, which alters movement
rates but not the ability of larvae to gain nutrients by feeding. Should different
movement rates generate different spatial structures, we may be able to observe
resulting changes in competition and infection processes in the population dynamics.
This is a rather rare experimental approach as it is the individuals themselves that
create the spatial structure. A strictly defined spatial structure is not forced upon
populations, as is the case in laboratory based patchy- and meta-populations.
The dynamics of the insect species Plodia interpunctella have been the centre
of much theoretical and experimental work (Begon et al., 1996; Bjørnstad et al.,
1998; Bjørnstad et al., 2001; Briggs et al., 2000; Gurney & Nisbet, 1985; Gurney et
al., 1983; Jones et al., 1990; Sait et al, 1994b). They can be characterised by a cycle
length that is a little longer than the generation time (Begon et al., 1996; Sait et al.,
1994b). There are three significant density-dependent lags generating the population
dynamics. A negative lag at week 2 dominates the dynamics and is caused by strong
asymmetric competition between large and small instars, including the cannibalism of
eggs (Gurney & Nisbet, 1985; Bjørnstad et al., 1998). There is a less important
negative lag at week 1 representing symmetric competition within early instars, and a
positive lag at week 5-6 for the eggs laid by adults in the preceding generation
(Briggs et al., 2000). The addition of the granulosis virus of Plodia interpunctella
(PiGV) causes a reduction in the Plodia population size due to pathogen-induced
mortality and lower fecundity. Infection occurs primarily through the cannibalism of
79
infected larvae, so cadavers can be considered to be the primary infectious unit of
infection (Boots, 1998). PiGV also extends the period of the host cycle, as
development time increases due to either sublethal infection or as a trade-off with
increased host resistance (Boots & Begon, 1993; Sait et al., 1994a, b). However the
strong competition between larvae prevents the host-pathogen interaction from
becoming coupled. Therefore an increase in the density of infectious units in one
generation does not have a correspondingly negative impact on the host population
size in the next generation (Bjørnstad et al., 2001). The virus only acts to change the
existing density-dependence caused by competition.
Through rendering the food medium more viscous, the movement of Plodia
larvae becomes increasingly restricted. Female adults lay their eggs in batches and if
movement is restricted then individuals will be unable to move away from nearby kin.
Therefore individuals may be forced into aggregations and the more movement is
restricted, the more clumped the population distribution becomes. This aggregation
process may have a number of significant effects on the dynamics of an insect-
pathogen system, where the density of hosts (Carter et al., 1983; Fleming et al., 1986;
Woods & Elkinton, 1987) and infectious units (Crawford & Kalmakoff, 1977;
Entwistle et al., 1983; Fuxa & Geaghan, 1983) determines the invasion and spread of
disease. Within aggregations, the density of individuals will be high, so increasing
both the contact rates between individuals and the competition between larvae for
food and space. The aggregation of individuals has been shown to be associated with
high levels of competition (Charnov et al., 1976) and an increased vulnerability to
infection (Dobson, 1988; Hochberg, 1991). Indeed, such aggregations may be crucial
for the persistence of a pathogen (Hassell, 1978; Jones & Hassell, 1988; Tinsley &
Jackson, 1986).

80
It is therefore likely that making Plodia populations more aggregated will
change competition between larvae and the infection of susceptible larvae with PiGV.
In terms of infection, the contact structure within aggregated populations may alter
both the chances of susceptible hosts encountering infected cadavers (Dwyer, 1991)
and that cannibalism will occur when this contact is made (Knell et al., 1998b).
Enforced aggregation may also increase the intensity of larval competition, with
competition for food and space potentially resulting in a higher mortality rate and
changes in aspects of Plodia life history, such as development time and reproductive
rates (e.g. Mbata, 1990; Podoler, 1973). Increased rates of head-to-head larval contact
within aggregations can also affect larval behaviour, due to the secretion of
mandibular substance associated with agitation and dispersal (Anderson & Löfqvist,
1996; Corbet, 1971).
Therefore it should be possible to study the effect restricted movement has on
the intensity of competition and the rate of infection by examining the population
dynamics of Plodia populations in the presence and absence of PiGV. The cyclical
behaviour of populations will be measured using autocorrelation function and spectral
analysis. The density of populations will be determined using three measures; the
mean number of adults counted each week, the mean density within population cycle
and the mean amplitude of cycles.
Method
Populations of Plodia interpunctella were established using three different types of
food media. The process by which food is made and the effect it has on movement
rates is discussed in Chapter 2. Media with no water is called Soft Food, media with

81
60ml water is Intermediate Food and media with 140ml water is Hard Food.
Increasing the amount of water added to the food medium increases the media’s
viscosity and reduces the movement rate of larvae (Chapter 2). Preliminary
experiments show the average movement of Plodia larvae is 10.63cm (SE ±0.73) in
Soft Food, 5.08cm (SE ±0.61) in Intermediate Food and is 2.8cm (SE ±0.26) in Hard
Food (Figure 2.4). Changes in food viscosity had no effect on Plodia development
time and pupal weight (Figure 2.7).
The Plodia used came from a strain donated by The University of Liverpool.
Each population was started with 170g of food placed along the base of 20x20cm
plastic containers. This food was divided into six sections. The Plodia populations
were initiated using 15 fifth instar males and 15 fifth instar females, distinguishable
through the visible male testes. For the with-virus populations, 12 late instar
granulosis virus infected cadavers were placed on the food, 2 cadavers on each of the
six sections. The lid of each container was perforated to aerate populations and net
curtain sleeves were made to prevent adult moths from escaping whilst population
counts were being made. Once started, populations were placed in incubators set at
27±2ºC and 35±5% humidity and maintained for 40 weeks.
9 Plodia populations were set without the granulosis virus (PiGV), three of
each food type. 15 populations were set up with the granulosis virus, five of each
food type. This unbalanced design was chosen in order to obtain more replicates with
the virus, in the expectation a broader range of dynamics would be displayed. Every
week, one section of food was removed and replaced so any particular section of food
was replaced every six weeks. At the same time, all the dead adults were removed
from each population and counted. As adults usually live no longer than a week, the
dead adult count tells us the size of the population from the previous week. For the
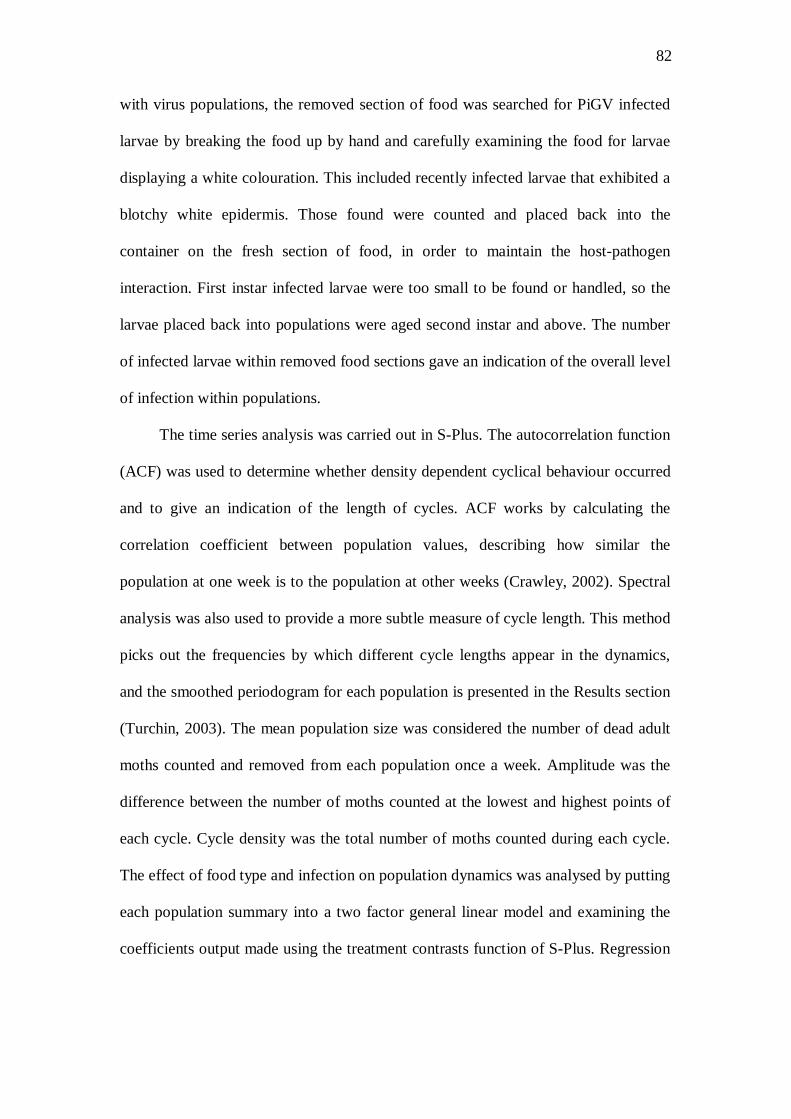
82
with virus populations, the removed section of food was searched for PiGV infected
larvae by breaking the food up by hand and carefully examining the food for larvae
displaying a white colouration. This included recently infected larvae that exhibited a
blotchy white epidermis. Those found were counted and placed back into the
container on the fresh section of food, in order to maintain the host-pathogen
interaction. First instar infected larvae were too small to be found or handled, so the
larvae placed back into populations were aged second instar and above. The number
of infected larvae within removed food sections gave an indication of the overall level
of infection within populations.
The time series analysis was carried out in S-Plus. The autocorrelation function
(ACF) was used to determine whether density dependent cyclical behaviour occurred
and to give an indication of the length of cycles. ACF works by calculating the
correlation coefficient between population values, describing how similar the
population at one week is to the population at other weeks (Crawley, 2002). Spectral
analysis was also used to provide a more subtle measure of cycle length. This method
picks out the frequencies by which different cycle lengths appear in the dynamics,
and the smoothed periodogram for each population is presented in the Results section
(Turchin, 2003). The mean population size was considered the number of dead adult
moths counted and removed from each population once a week. Amplitude was the
difference between the number of moths counted at the lowest and highest points of
each cycle. Cycle density was the total number of moths counted during each cycle.
The effect of food type and infection on population dynamics was analysed by putting
each population summary into a two factor general linear model and examining the
coefficients output made using the treatment contrasts function of S-Plus. Regression

83
analysis of both the Plodia and PiGV populations revealed no significant trends that
required detrending prior to time series analysis.
Results
No Virus Plodia Populations
In total, nine Plodia interpunctella populations were set up in the absence of the
granulosis virus (PiGV) (see Table 4.1). Figure 4.1 shows the dynamics of Plodia in
three Soft Food populations, a diet in which no water was added. Autocorrelation
function (ACF) analysis shows there was evidence for cyclical behaviour of
approximately 5-weeks and the spectral analysis indicated the mean length of these
cycles was 37.47 days (standard deviation ±0.48). The mean adult population density
was 148.81 (±10.46) per week, the mean number of adults within each cycle was
851.77 (±33.11) and the mean cycle amplitude was 380.52 (±26.6).
Figure 4.2 shows the dynamics of Plodia fed upon food with Intermediate
viscosity, a mixture made with 60ml water. Again ACF analysis provides evidence
for regular cyclical behaviour and the mean cycle length indicated by spectral
analysis was 37.3 days (±0.09), which was not significantly different to Soft Food
populations (Cycle Length coefficients; t5,18 =-0.1586, p =0.876). In Intermediate
Food, both the mean population density of 127.57 (±11.08) and the mean amplitude
of 407.04 (±63.75) were not significantly different to Soft Food values (Population
Density; t5,18 =-2.082, p=0.052; Amplitude; t =-0.64, p =0.53). In contrast the mean
cycle density of 721.33 (±62) was significantly lower than Soft Food populations
(Cycle Density, t=-2.13, p=0.047).
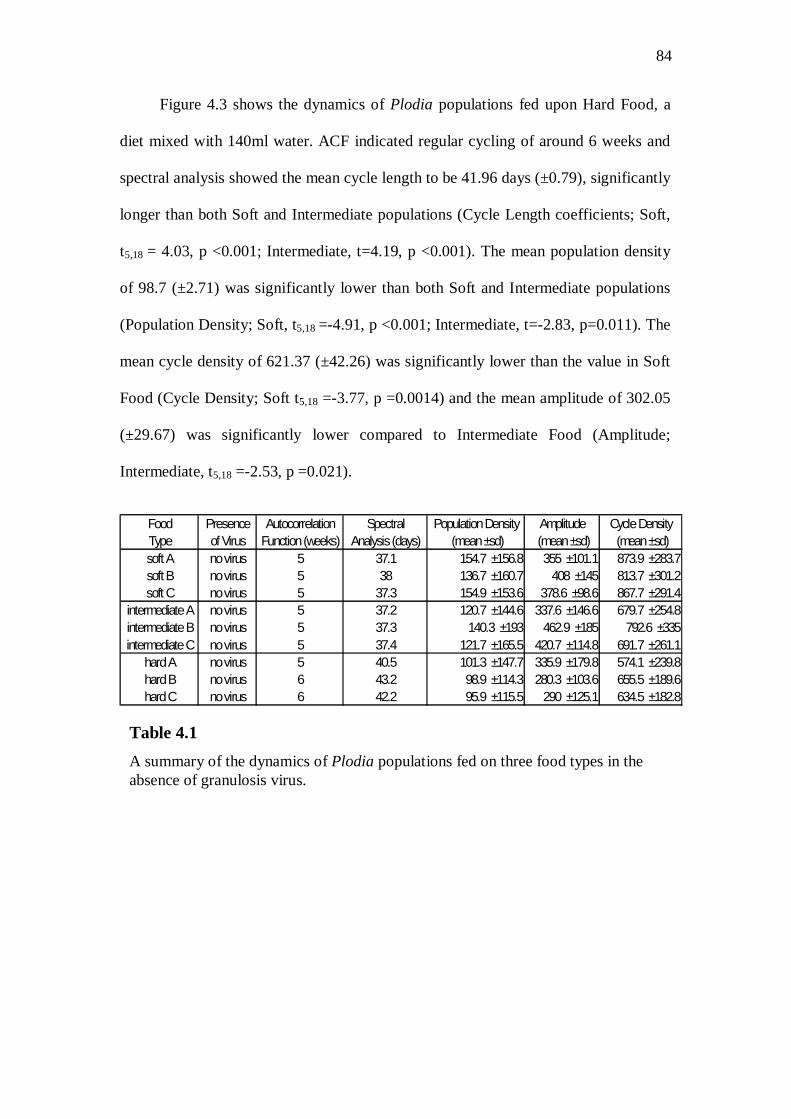
84
Figure 4.3 shows the dynamics of Plodia populations fed upon Hard Food, a
diet mixed with 140ml water. ACF indicated regular cycling of around 6 weeks and
spectral analysis showed the mean cycle length to be 41.96 days (±0.79), significantly
longer than both Soft and Intermediate populations (Cycle Length coefficients; Soft,
t5,18 = 4.03, p <0.001; Intermediate, t=4.19, p <0.001). The mean population density
of 98.7 (±2.71) was significantly lower than both Soft and Intermediate populations
(Population Density; Soft, t5,18 =-4.91, p <0.001; Intermediate, t=-2.83, p=0.011). The
mean cycle density of 621.37 (±42.26) was significantly lower than the value in Soft
Food (Cycle Density; Soft t5,18 =-3.77, p =0.0014) and the mean amplitude of 302.05
(±29.67) was significantly lower compared to Intermediate Food (Amplitude;
Intermediate, t5,18 =-2.53, p =0.021).
Table 4.1
A summary of the dynamics of Plodia populations fed on three food types in the absence of granulosis virus.
Food Presence Autocorrelation Spectral Population Density Amplitude Cycle DensityType of Virus Function (weeks) Analysis (days) (mean ±sd) (mean ±sd) (mean ±sd)soft A no virus 5 37.1 154.7 ±156.8 355 ±101.1 873.9 ±283.7soft B no virus 5 38 136.7 ±160.7 408 ±145 813.7 ±301.2soft C no virus 5 37.3 154.9 ±153.6 378.6 ±98.6 867.7 ±291.4
intermediate A no virus 5 37.2 120.7 ±144.6 337.6 ±146.6 679.7 ±254.8intermediate B no virus 5 37.3 140.3 ±193 462.9 ±185 792.6 ±335intermediate C no virus 5 37.4 121.7 ±165.5 420.7 ±114.8 691.7 ±261.1
hard A no virus 5 40.5 101.3 ±147.7 335.9 ±179.8 574.1 ±239.8hard B no virus 6 43.2 98.9 ±114.3 280.3 ±103.6 655.5 ±189.6hard C no virus 6 42.2 95.9 ±115.5 290 ±125.1 634.5 ±182.8
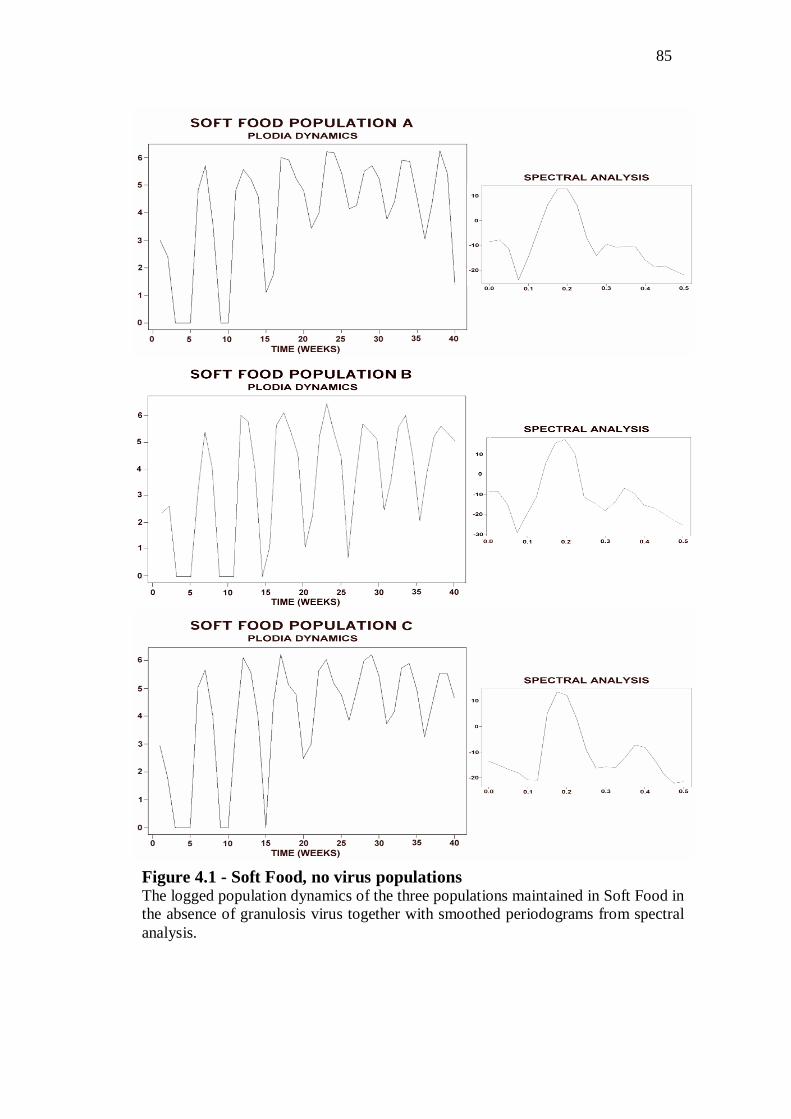
85
Figure 4.1 - Soft Food, no virus populations The logged population dynamics of the three populations maintained in Soft Food in the absence of granulosis virus together with smoothed periodograms from spectral analysis.
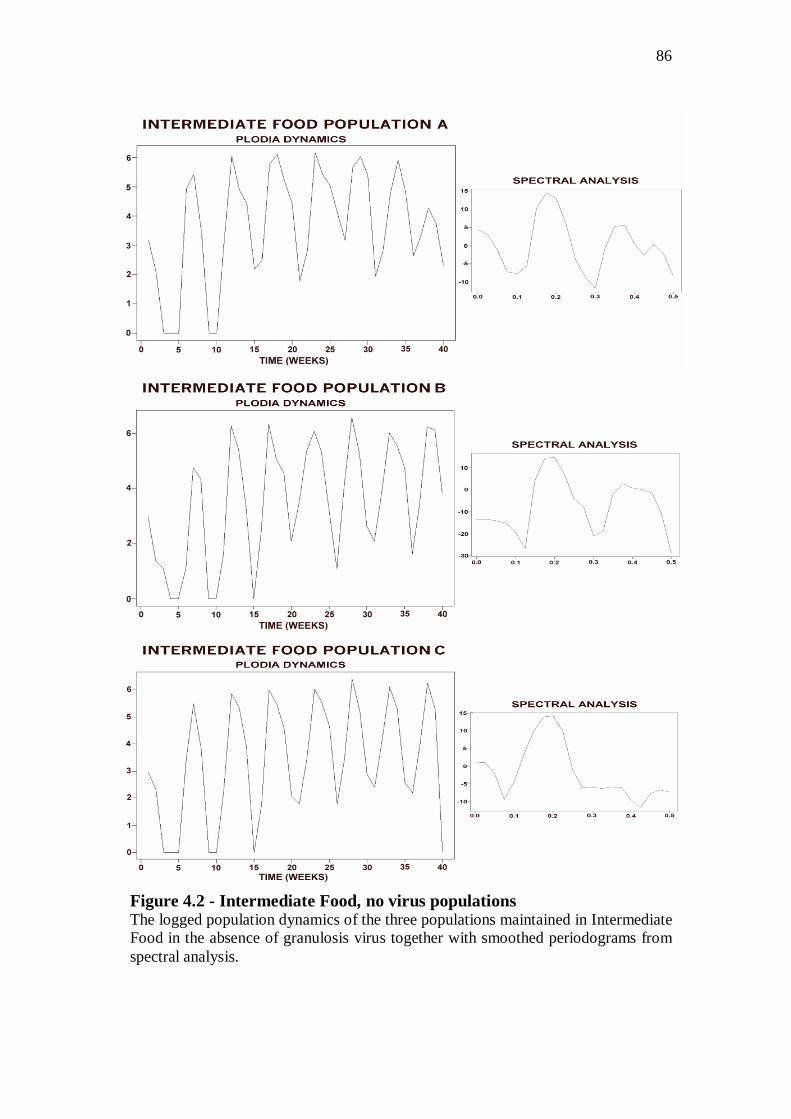
86
Figure 4.2 - Intermediate Food, no virus populations The logged population dynamics of the three populations maintained in Intermediate Food in the absence of granulosis virus together with smoothed periodograms from spectral analysis.

87
Figure 4.3 - Hard Food, no virus populations The logged population dynamics of the three populations maintained in Hard Food in the absence of granulosis virus together with smoothed periodograms from spectral analysis.
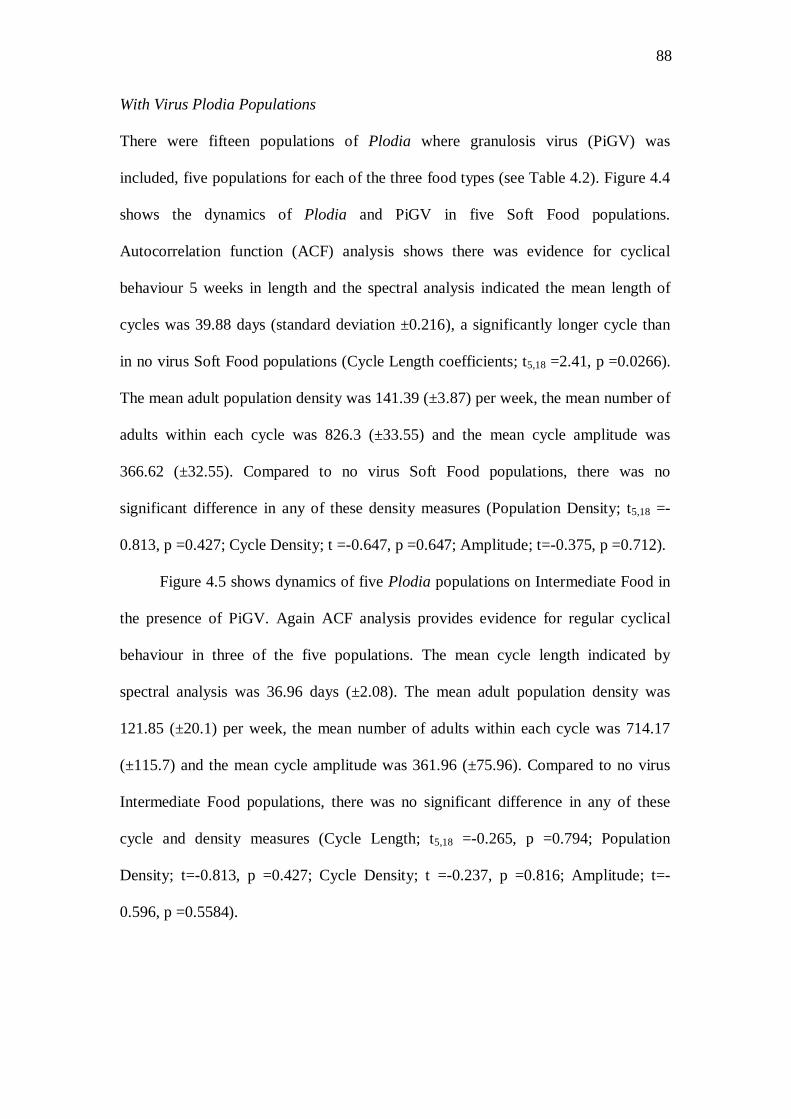
88
With Virus Plodia Populations
There were fifteen populations of Plodia where granulosis virus (PiGV) was
included, five populations for each of the three food types (see Table 4.2). Figure 4.4
shows the dynamics of Plodia and PiGV in five Soft Food populations.
Autocorrelation function (ACF) analysis shows there was evidence for cyclical
behaviour 5 weeks in length and the spectral analysis indicated the mean length of
cycles was 39.88 days (standard deviation ±0.216), a significantly longer cycle than
in no virus Soft Food populations (Cycle Length coefficients; t5,18 =2.41, p =0.0266).
The mean adult population density was 141.39 (±3.87) per week, the mean number of
adults within each cycle was 826.3 (±33.55) and the mean cycle amplitude was
366.62 (±32.55). Compared to no virus Soft Food populations, there was no
significant difference in any of these density measures (Population Density; t5,18 =-
0.813, p =0.427; Cycle Density; t =-0.647, p =0.647; Amplitude; t=-0.375, p =0.712).
Figure 4.5 shows dynamics of five Plodia populations on Intermediate Food in
the presence of PiGV. Again ACF analysis provides evidence for regular cyclical
behaviour in three of the five populations. The mean cycle length indicated by
spectral analysis was 36.96 days (±2.08). The mean adult population density was
121.85 (±20.1) per week, the mean number of adults within each cycle was 714.17
(±115.7) and the mean cycle amplitude was 361.96 (±75.96). Compared to no virus
Intermediate Food populations, there was no significant difference in any of these
cycle and density measures (Cycle Length; t5,18 =-0.265, p =0.794; Population
Density; t=-0.813, p =0.427; Cycle Density; t =-0.237, p =0.816; Amplitude; t=-
0.596, p =0.5584).

89
Figure 4.6 shows the dynamics of five Plodia populations on Hard Food in the
presence of PiGV. ACF analysis shows there was no evidence for regular cyclical
behaviour in such populations. The spectral analysis indicated the continued presence
of generational cycles whose mean length was 41.25 days (±1.72). However the
spectral analysis also provided evidence for the emergence of a new 20-week
multigenerational cycle (as indicated with the peak in the power spectrum at 0.05 on
the x axis), consisting of three generational cycles whose density appears to decrease
as the multigenerational cycle progressed. In terms of density measures, the mean
adult population density was 57.56 (±12.79) per week, the mean number of adults
within each generational cycle was 379.43 (±85.7) and the mean generational cycle
amplitude was 172.18 (±44.2). Compared to no virus Hard Food populations, all
density measures saw a significant decline caused by the addition of PiGV
(Population Density coefficient; t5,18 =-4.507, p <0.001; Cycle Density; t =-4.425, p
<0.001; Amplitude; t=-3.5, p =0.0025).
Table 4.2
A summary of the dynamics of Plodia populations fed on three food types in the presence of granulosis virus.
Food Presence Autocorrelation Spectral Population Density Amplitude Cycle DensityType of Virus Function (weeks) Analysis (days) (mean ±sd) (mean ±sd) (mean ±sd)soft A with virus 5 40 138.5 ±145.4 341.7 ±84.1 787.6 ±228.1soft B with virus 6 40 136.7 ±145.3 372.2 ±100.8 851 ±247.8soft C with virus 6 39.9 146.3 ±163.5 391.7 ±144.2 869.8 ±271soft D with virus 5 40 143.8 ±136.3 325.4 ±83.5 817.4 ±206.4soft E with virus 5 39.5 141.7 ±164 402.1 ±151.5 805.7 ±256.8
intermediate A with virus 5 35 148.3 ±181.9 448 ±184.2 844.3 ±312.2intermediate B with virus 5 37.5 133.9 ±167.5 426.7 ±89.5 761.6 ±264.1intermediate C with virus 5 37.3 117.1 ±134.8 334.4 ±92.4 665 ±195.4intermediate D with virus N/A 40 114.5 ±136.7 339.3 ±106.5 758.8 ±207.5intermediate E with virus N/A 35 95.4 ±122.4 260.9 ±117.5 541.1 ±191.7
hard A with virus N/A 40 67.3 ±88.5 179.7 ±121.3 444.8 ±126.7hard B with virus N/A 40 57.8 ±77.6 164.3 ±120.9 380.5 ±118.4hard C with virus N/A 40 58.2 ±77.9 169.5 ±125.5 384 ±112.3hard D with virus N/A 43.2 36.4 ±58.6 111.7 ±98.7 237.7 ±74.1hard E with virus N/A 43.1 68 ±110 235.7 ±189.5 450.1 ±168.9

90
Virus Populations
The mean densities of PiGV populations are shown in Table 4.3. ACF and spectral
analysis does not provide any evidence for regular cycling in viral populations. The
mean density of infected larvae counted in food sections each week was significantly
lower in Hard Food than in Soft and Intermediate Food populations. In Soft Food, the
mean density of larvae was 5.18 (±0.982), 5.31 (±1.259) in Intermediate Food and
3.392 (±0.554) in Hard Food (Soft-Hard, t2,12=2.91, p =0.013; Intermediate-Hard, t
=3.12, p =0.0088).
Table 4.3
A summary of PiGV populations in three different food types.
Food Density of Infecteds AutocorrelationType per Food Section (mean ±sd) Function (weeks)soft A 4.6 ±5.2 N/Asoft B 4.1 ±5.5 N/Asoft C 6.7 ±7.3 N/Asoft D 5.4 ±4.8 N/Asoft E 5.2 ±5.6 N/A
intermediate A 6.9 ±7.1 N/Aintermediate B 5.7 ±5.9 N/Aintermediate C 3.4 ±3.5 N/Aintermediate D 5.3 ±5.2 N/Aintermediate E 5.2 ±3.7 N/A
hard A 3.6 ±3.1 N/Ahard B 4 ± 3.2 N/Ahard C 2.5 ±3.1 N/Ahard D 3.3 ±3 N/Ahard E 3.5 ±3.1 N/A
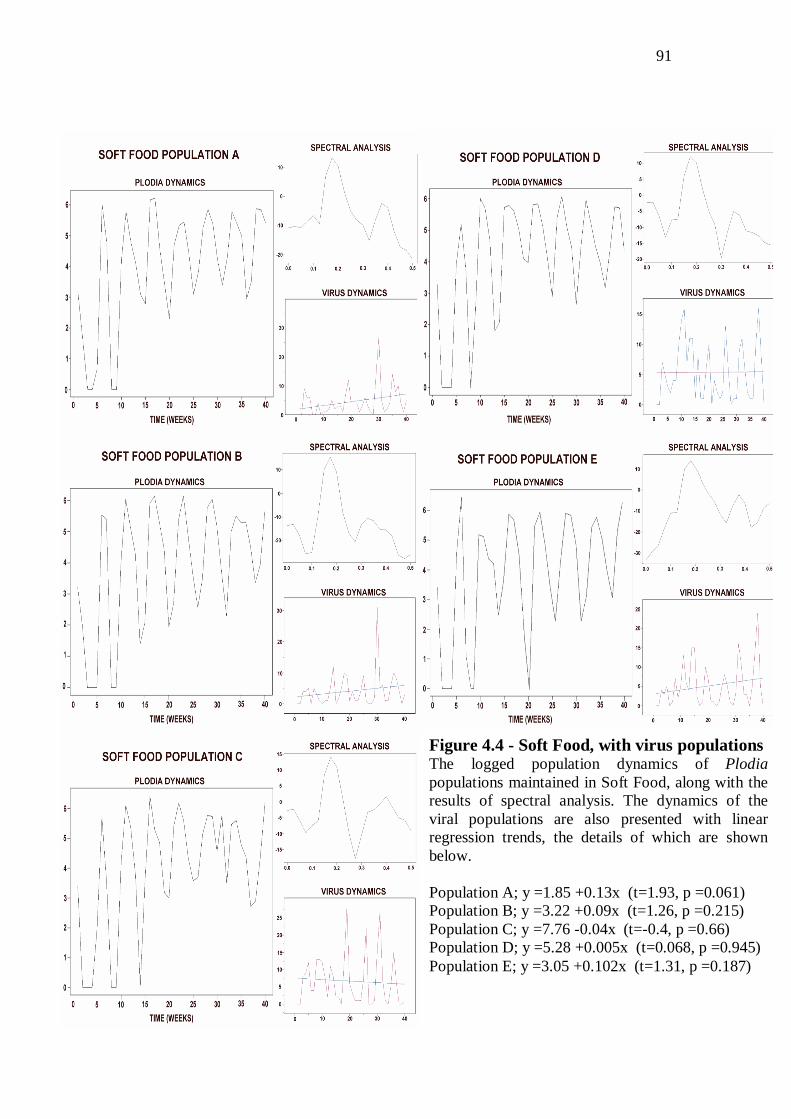
91
Figure 4.4 - Soft Food, with virus populations The logged population dynamics of Plodia populations maintained in Soft Food, along with the results of spectral analysis. The dynamics of the viral populations are also presented with linear regression trends, the details of which are shown below. Population A; y =1.85 +0.13x (t=1.93, p =0.061) Population B; y =3.22 +0.09x (t=1.26, p =0.215) Population C; y =7.76 -0.04x (t=-0.4, p =0.66) Population D; y =5.28 +0.005x (t=0.068, p =0.945) Population E; y =3.05 +0.102x (t=1.31, p =0.187)

92
Figure 4.5 - Intermediate Food, with virus populations The logged population dynamics of Plodia populations maintained in Intermediate Food, along with the results of spectral analysis. The dynamics of the viral populations are presented with linear regression trends. Population A; y =7 -0.0037x (t=-0.037, p =0.97) Population B; y =2.96 +0.13x (t=1.72, p =0.095) Population C; y =2.39 +0.049x (t=1.04, p =0.31) Population D; y =2.5 +0.13x (t=1.92, p =0.06) Population E; y =5.31 –0.007x (t=-0.137, p =0.892)

93
Figure 4.6 – Hard Food, with virus populations The logged population dynamics of Plodia populations maintained in Hard Food, along with the results of spectral analysis. The dynamics of the viral populations are presented with linear regression trends. Population A; y =3.81 -0.019x (t=-0.373, p =0.71) Population B; y =4.67 –0.024x (t=-0.51, p =0.615) Population C; y =3 –0.022x (t=-0.511, p =0.612) Population D; y =3.35 -0.001x (t=-0.03, p =0.977) Population E; y =4.52 –0.05x (t=-1.18, p =0.245)

94
Discussion
Spatial dynamics in the absence of PiGV
In comparison to Soft Food (Figure 4.1), Hard Food (Figure 4.3) produced distinct
changes in the population dynamics of Plodia interpunctella. The cycle length of
populations in Hard Food was significantly longer than in Soft Food, with a mean
increase of 4.49 days. Also the size of populations maintained in Hard Food was
significantly smaller than Soft Food populations, as indicated by smaller weekly adult
density, cycle density and cycle amplitude.
These changes can be explained by the effect that restricting the movement of
larvae has on the intensity of larval competition. In Soft Food, individuals have a high
rate of movement and so can rapidly move away from any competitive encounters.
This generates a mixed population in which competition intensity is lowered by the
ability of larvae to avoid it. In Hard Food, larval movement is restricted to such a
degree that it is not possible to move away from competitive encounters. The
resulting aggregation of individuals mean there is less food and space available,
forcing competition to increase. Also, density-dependent cannibalism is likely to be
higher in these aggregations than in the mixed Soft Food populations (Boots, 1998).
The effects of an increased intensity of competition can be observed in the Hard Food
dynamics. The smaller population size is a result of competition causing higher larval
mortality and a lower reproductive rate associated with smaller, nutritionally
deprived, adults. A longer cycle length is associated with the lower growth rates of
larvae when resource and interference competition is high, as individuals require
more time to develop from egg to adult. This is supported by the results of the
competition experiments discussed in Chapter 3, where survival and growth rate of
larvae in Hard Food were both lower than Soft Food (Figures 3.1& 3.2).

95
The difference in competition intensity, generated by restricted movement, is
exacerbated by the oviposition behaviour of Plodia females. First, they select
oviposition sites according to food quality as opposed to the larval density within the
food (Anderson & Löfqvist, 1996). Second, adult females lay eggs in batches. This
means the population of eggs is aggregated when oviposited, so guaranteeing high
rates of competition between early instars. In Soft Food, larval movement dissipates
such spatial aggregations rapidly. In Hard Food, these aggregations become fixed.
The dynamics of the Intermediate Food populations indicate competition
processes falling between those found in Soft and Hard Food populations (Figure
4.2). The population density was significantly smaller than in Soft Food, by a mean
value of 24.58 adults per week. This suggests the intensity of competition in
Intermediate Food is greater, with mortality and reduced fecundity lowering
population size. However this increase in competition is not reflected in a change in
the periodicity, with the mean length of 37.3 days not significantly different to Soft
Food values. An explanation for this difference is indicated in the competition
experiments of Chapter 3, where different densities only produced different mortality
rates in Intermediate Food (Figure 3.2). This suggests the intensity of competition
experienced by larvae across Intermediate Food populations varies according to
different local density levels. Within Intermediate Food populations, the moderate
movement rates of larvae allow early instar larvae enough freedom to move away
from competitive encounters with kin in the same egg batch. This is advantageous to
larvae that experience a sparsely populated surrounding environment, as these
individuals will be able to disperse away from the oviposition site, avoid competition
and grow at a normal rate. This accounts for the similar cycle length in Intermediate
populations compared to Soft Food. However because Intermediate Food restricts

96
larval movement, those individuals that experience a high-density surrounding
environment will not be able to disperse far enough to escape this highly competitive
region. These individuals account for the lower population density in Intermediate
Food, as they will suffer high competition-induced mortality and those surviving to
adulthood will be smaller and exhibit a lower reproductive rate.
Spatial dynamics in the presence of PiGV
Previous studies have shown the spatial structure of insect populations can have an
important impact on the transmission of pathogens. Dwyer (1991) found that
transmission of the nucleopolyhedrosis virus of the Tussock moth was dependent on
the spatial distribution and density of infected individuals and the mobility of
different larval instars. When the virus has a patchy distribution, slow moving early
instars are less likely to become infected through low exposure to the pathogen. Later
instars have a higher probability of becoming infected because they are highly mobile
and experience a much larger portion of the environment, including pathogen
aggregations (Dwyer, 1991).
In relation to the work carried out in this chapter, the addition of a granulosis
virus creates a number of changes in the dynamics of Soft Food populations (Figure
4.4). The addition of the granulosis virus (PiGV) caused the length of Plodia
population cycles to significantly increase by an average of 2.41 days. Measures of
Plodia population size indicated that PiGV caused a small, but statistically
insignificant, decline in population density (smaller by 4.98%), cycle density (smaller
by 3%) and cycle amplitude (3.7%). These changes may be attributed to the effect of
PiGV, which was highly prevalent in Soft Food populations (the mean number of

97
infected larvae was 5.18 per week). Larvae in Soft Food possess a high movement
rate, generating a mixed population in which competition is relatively low and
infection occurs evenly throughout the environment. Infectious units have the
potential to encounter many susceptible larvae and so the virus has a high infection
rate. This can explain the observed changes in cycle length and population size, as a
high infection rate throughout the Plodia population may result in either selection for
host resistance or the emergence of detrimental sublethal infection (Sait et al.,
1994b). One or both of these processes can result in a slower growth rate for larvae,
significantly increasing the cycle length. Also both processes may result in a lower
reproductive rate which, coupled with pathogen-induced mortality, might reduce the
mean size of Plodia populations slightly.
Hard Food populations showed a number of dynamical differences when PiGV
was included (Figure 4.6). Populations were significantly smaller, with the mean
population density of 57.56 per week being 41.69% smaller than the Plodia density in
no virus Hard Food populations. ACF analysis revealed all five with-virus
populations lacked a regular periodicity, a feature unique to with-virus Hard Food
populations. These changes might be attributed to the effect the aggregation of
individuals has on competition, PiGV infection and the interaction between the two
processes.
One apparent contradiction in the Hard Food dynamics is the very large
reduction in population was caused by a small number of infectious cadavers. The
mean weekly count of infected larvae was 3.39 in Hard Food, a significantly smaller
number than counted in Soft and Intermediate Food. Yet the effect PiGV has in
reducing population is much greater than the other food types. This amplified effect
of infection may be due to the spatial distribution of hosts and infectious units, rather

98
than their overall number (Richter et al., 1987). As individuals are forced into small
patches by restricted movement, the localised density of these aggregations becomes
high. Should infected cadavers exist within such a patch, the high density will
increase the probability of susceptible larvae becoming infected. This higher infection
rate within aggregations has two explanations. The first is there is a higher contact
rate associated with high densities, which increases the chance of individuals coming
into contact with the cadaver. Secondly, high local densities reduce the amount of
food available to larvae, making it more likely they will cannibalise the primary
cadaver or any secondary infected hosts (Polis, 1981; Knell et al., 1998b) as well as
the potential effect of reduced food making larvae more susceptible to infection
(Steinhaus, 1958). As a result of higher infection rates, individuals within
aggregations experience either pathogen induced mortality or deleterious sublethal
effects. There may also be multiple infections, increasing the probability of infected
individuals dying (Knell et al., 1998b). However the epidemic is necessarily
contained within the locality because there are few interactions between aggregations
(Knell et al., 1998a). Therefore, as the number of susceptible individuals declines
through infection and maturation resistance, the force of infection falls and the
localised epidemic fades out (Knell et al., 1996). This may be the reason for the small
number of infected larvae counted within the Hard Food populations.
Within infected aggregations of individuals, the reduced number of healthy
individuals will lower the intensity of competition. This contrasts to the larval
aggregations in which no virus was present, where the density of larvae is high and so
competition is intense. The competition within these no virus aggregations is similar
to that discussed in the no virus Hard Food populations. Therefore Hard Food with-
virus populations can be characterised by two spatially segregated ecological

99
processes, competition and infection. Where there is infection, there is little
competition. Where there is no infection, there is intense competition. Within this
context, it is possible to explain the lack of regular cycling in Hard Food. The high
infection rates in the with-virus aggregations causes the mortality of highly
susceptible early instars (Sait et al., 1994c). The intense competition in the no-virus
aggregations causes the mortality of later, larger instars that require more food and
more space and so are more susceptible to competition. The mortality of early instars
through infection and late instars through competition remove the age structure of the
larval population (Knell, 1998). This may result in a break down if the asymmetric
larval interactions necessary for the discrete bursts of population characteristic of
generational cycles. Also the lower population size in Hard Food might render the
dynamics more sensitive to demographic stochasticity, such that regular cyclical
behaviour becomes indistinct (Knell, et al., 1998a).
There is also an appearance of weak multigenerational 20-week cycle in with
virus Hard Food 20-week cycle, characterised by three generational cycles becoming
smaller as the extended cycle progresses. One possible explanation for this cycle is
the highly localised nature of transmission means PiGV prevalence is initially low,
allowing the first larval generational to be largely unaffected by infection. The large
number of eggs laid by this generation throughout the food environment acts to
generate a correspondingly large, mixed larval population. A greater number of
individuals will be positioned close to infectious larvae, so forcing infection rates and
PiGV prevalence to increase. The mortality and reduced fecundity associated with
infection causes the size of the second and third generations of Plodia adults to be
progressively smaller. The low adult population at the third generation reduces the
number of eggs laid and so the size of the resulting larval population is

100
correspondingly small. A density-dependent decline in PiGV infection at low larval
densities allows more larvae to survive into adulthood and so generate the large adult
population found at the fourth generational peak. This proposed pattern of infection
might not found in the viral dynamics in Hard Food because the local nature of
infection may make the weekly counts of infected larvae from one food section (1/6
of the total environment) unrepresentative of subtle changes in virus density across
space and time.
As in the no virus populations, the dynamics of populations in Intermediate
Food are complex (Figure 4.5). The mean density of Plodia populations on
Intermediate Food with PiGV was 121.85, a 4.19% reduction in comparison to the no
virus populations. The mean weekly number of infected larvae was 5.31, significantly
larger than the Hard Food populations and similar to the Soft Food populations. These
dynamical changes induced by PiGV in Intermediate Food are very similar to the
changes in Soft Food. However the one difference between the two food types is the
cycle length, which lengthens when PiGV is added in Soft Food but does not
significantly change in the Intermediate Food. The Soft Food no virus populations
had an extended periodicity most likely because the high rate of PiGV infection
caused larval growth rate to decline through either sublethal infection or as a cost of
resistance. Despite a similar number of infected larvae in the Intermediate Food,
larval growth rate did not decline enough to alter cycle length. This difference might
be explained by considering the movement rate of individuals in Intermediate Food.
In no virus Intermediate Food populations, the level of movement restriction
gave individuals enough freedom to move from initial competitive encounters. At low
densities this creates a lower contact rate between individuals and so a lower rate of
competition. At high densities, an intermediary level of movement no longer confers
101
an advantage because individuals cannot move far enough to escape secondary
competitive encounters within the dense, local environment. When PiGV is added to
an Intermediate Food population, the relationship between density, movement and
competition interacts with the infection process. In areas of low host densities the
contact rate between individuals is minimal, meaning both the intensity of
competition and the transmission of PiGV is low. Therefore host development time is
not altered by either intense competition (like in Hard Food) or by pathogen-induced
effects (like in Soft Food). In areas of high host density, individuals cannot avoid
contact and so infection rates are high, lowering the density of hosts and so relaxing
competition. The infection rate at high densities accounts for the high prevalence of
infectious cadavers in the Intermediate food populations. However as the density in
these areas is lowered overtime by infection, the rate of contact between individuals
necessarily declines causing a density dependent reduction in PiGV infection. As a
result, there is either limited selection for host resistance or few sublethal effects,
corresponding to no increase in host development time.

102
Chapter 5
The Evolution of Baculovirus Infectivity in
Spatially Structured Insect Populations

103
Abstract Altering the movement of Plodia interpunctella larvae was found to change the
infectivity of a species-specific granulosis virus. This was understood by considering
the relationship between movement rate and the spatial range of transmission. When
movement is restricted, the resulting population aggregation and localised
transmission causes highly infectious strains to rapidly infect neighbouring a large
proportion of available susceptible hosts, reducing infection opportunities and so
lowering the transmission rate of the parasite. This process of ‘self-shading’ favours
strains with lower infectivity, as such parasites are surrounded by a greater proportion
of susceptible hosts. These strains possess a higher transmission rate as a result and so
become prevalent. These results suggest that even subtle changes in the spatial
structure of populations may constrain the transmission rate of infectious organisms.
104
Introduction
The emergence of new parasitic species and the evolution of virulent strains of
endemic parasites can have severe effects upon both human populations and
economically important species. General theory of parasite evolution shows that
natural selection will act to maximise the basic reproductive ratio R0: the number of
secondary infections resulting from one infected host in a naïve host population
(Anderson & May, 1991; May & Anderson, 1983). Parasite reproductive rate is a
combination of transmission and virulence, with transmission acting to increase
reproduction by increasing the number of infectious units and virulence acting to
reduce it by lowering the number of infectious units through mortality. From the point
of view of a directly transmitted parasite, transmission is the probability of an
infectious unit successfully infecting a susceptible host upon contact (infectivity). We
would therefore predict the parasite would evolve maximal infectivity and zero
virulence (Levin & Pimental, 1981).
However, when there is a positive correlation between infectivity and
virulence, and depending on the shape of the relationship, intermediate levels of
transmission may be favoured (Ebert & Herre, 1996; May & Anderson, 1979). The
mechanisms behind this correlation are assumed to be that a greater rate of replication
within the host increases the potential for transmission, with more infective units
released into the environment, picked up by vector species or passed onto
neighbouring individuals by contact. However a high replication rate within the host
also has the effect of inducing higher host mortality through increased tissue damage
and the build up of metabolic toxins. Therefore the optimum reproductive rate of the
parasite involves balancing the positive (transmission) and negative (host death)
aspects of host exploitation. This ‘trade-off’ concept has become central to the study

105
of parasite evolution and has increasing empirical support. For example, a few host-
parasite studies have directly shown positive relationships between the degree of
replication within the host with increased parasite infectivity and detrimental effects
on host health (Davies et al., 2001; Ebert, 1994; Herre, 1993). Also several field
studies provide indirect evidence of long-term changes in virulence that is consistent
with the ‘trade-off’ concept (Ebert & Mangin, 1997; Ewald, 1993, 1994; Frank, 1996;
Levin, 1996), including the human parasite HIV (Ewald, 1993) and the myxoma virus
(see Bull, 1994 for review).
There are others factors not taken into account in the basic theory that may also
select a level of infectivity different to that at the maximum reproductive ratio. For
instance, when an individual host is co-infected by differently virulent strains, there
may be within-host parasite competition (Bremermann & Pickering, 1983). This
selects for strains with higher infectivity that quickly exploit and leave their host
before experiencing the deleterious aspects of strain competition (Nowak & May,
1994; van Baalen & Sabelis, 1995). Another factor that may influence the evolution
of infectivity is the spatial structure of host and parasite populations. Most work on
parasite evolution makes the assumption the populations are homogeneously mixed
and any susceptible host can become infected with any parasite in the population.
However many natural host-parasite systems can be characterised by both localised
transmission, where secondary infections are more frequent in neighbouring
individuals of infected hosts, and patchy host distributions. This means only a small
proportion of the host population is available to any one infectious unit. The
relationships between the spatial aspects of real populations and the evolution of
infectivity have been the subject of a limited series of papers (Boots & Sasaki, 1999,
2000; Claessen & de Roos, 1995; Haraguchi & Sasaki, 2000; Rand et al., 1995).
106
Boots & Sasaki (1999 & 2000) modelled a host-parasite system using a lattice-
based host structure and pair approximations to correlate the state of nearest
neighbours. When host reproduction occurred only between neighbours, localised
transmission favoured the persistence of strains with lower infectivity than when
infection was global. This has two explanations. First, local transmission combined
with high infectivity rapidly reduced the number of surrounding susceptible hosts by
mortality (Boots & Sasaki, 1999). This process of ‘self-shading’ favours low
infectivity, with the parasite maintaining a large number of surrounding susceptible
hosts. Second, localised transmission creates distinct patches of susceptible and
infected hosts. A highly infective parasite will rapidly infect and kill hosts within the
patch before there is an opportunity to “jump” to a new patch of susceptibles (Boots
& Sasaki, 1999). When host reproduction occurs globally, there is greater mixing of
susceptible individuals within the lattice and so reducing the constraints ‘self-
shading’ imposes on the spread of parasites. Therefore global reproduction allows a
higher infectivity than local reproduction at the evolutionarily stable strategy (ESS)
(Boots & Sasaki, 2000). However, even with completely global reproduction, local
transmission constrains infectivity to some degree (Boots & Sasaki 2000).
In spatially structured models where the infectivity-virulence ‘trade-off’ is not
invoked, similar changes in infectivity are observed (Haraguchi & Sasaki, 2000; Rand
et al., 1995). In a latticed structured probabilistic cellular automaton, Rand et al.
(1995) showed that localised transmission could result in a finite upper limit for
infectivity, above which the parasite went extinct. This contrasts to mean-field
models of homogeneous populations where there was no such limit on the evolution
of infectivity. Haraguchi & Sasaki (2000) used pair-approximation techniques to
show, in comparison to mixed populations, lower infectivity was favoured in lattice-

107
structured populations in which transmission was local (Haraguchi & Sasaki, 2000).
Again it is the duel processes of ‘self-shading’ and reduced opportunities for
“jumping” to new susceptible patches that select against high infectivity (Boots &
Sasaki, 1999; Haraguchi & Sasaki, 2000).
The study of infectivity evolution in spatially structured populations has
predominately been a theoretical exercise. However there are studies of host-parasite
systems where changes in spatial structure, infectivity and virulence can be
correlated. Serial passage experiments frequently result in increased virulence over
time (Doroshenko et al., 1996; John & John, 1994). One explanation for this is that
each passage involves mixing the host population and disrupting any spatial
restrictions on transmission (Haraguchi & Sasaki, 2000). Also, parasites with the
capacity for long distance dispersal tend to possess a higher virulence than parasites
transmitted over short distances (Ewald, 1991, 1993, 1994). A comparison between
bacterial parasites reveals that water-borne species cause higher host mortality than
those directly transmitted from host to host. Water-borne transmission allows the
parasite to contact a larger proportion of the host population over a greater spatial
range.
In this chapter, I present a selection experiment observing the evolution of an
insect virus in differently structured host populations. Larvae of the moth species
Plodia interpunctella can be infected with a species-specific granulosis virus (PiGV).
Infection results from ingesting contaminated food, predominately involving the
cannibalisation of infected larvae. Therefore the primary infectious unit for PiGV are
infected host cadavers (Boots, 1998). There is a high mortality rate associated with
infection, although sublethal effects can be observed when older larvae are infected
(Sait et al., 1994a). By using food mediums of different viscosities, the movement of

108
larvae is altered. This changes the spatial structure of host-parasite populations, with
the high mobility in soft mediums allowing greater larval mixing and more distant
dispersal of infectious units. Larvae in harder mediums are forced into overcrowded
high-density patches, and it within such aggregations that localised PiGV
transmission occurs.
Long-term host-parasite interactions were maintained in different food
mediums, then destructively sampled to analyse the infectivity of selected viral
particles compared to a stock strain. This was determined by finding the mortality rate
associated with the concentration of virus particles. Mortality rate does not inform us
about any change in virulence because overt infection always results in host death.
Therefore the mortality rate solely reveals the probability of virus particles entering
the host through the midgut and evading immune responses, and so indicates the
strains infectivity.
Method
Populations of Plodia interpunctella and its granulosis virus were established using
three different viscosities of food media. The process by which the food types are
made and the effect they have on larval movement rates is described in Chapter 2.
Media with 0ml water is Soft Food, media with 60ml water is Intermediate Food and
media with 140ml water is Hard Food. Increasing the amount of water added to the
food medium increases the media’s viscosity and reduces the movement rate of
larvae. Preliminary experiments show that the average movement of Plodia larvae
from 1st to 3rd instar is 10.65cm (SE ±0.73) in Soft Food, 5.09cm (±0.61) in
109
Intermediate Food and is 2.8cm (±0.26) in Hard Food (Figure 2.4). Changes in food
viscosity had no effect on Plodia development time and pupal weight (Figure 2.7).
Out of the fifteen long-term Plodia-PiGV populations discussed in Chapter 4,
twelve populations were destructively sampled at the end of the 40-week experiment.
The populations sampled for cadavers were four Soft Food (a, b c, d), four
Intermediate Food (b, c, d, e) and four Hard Food (b, c, d, e) populations. The
methods by which these populations were started and maintained are detailed in
Chapter 4 (p 81) and the dynamics of the twelve populations can be seen in Figures
4.4-4.6. Sampling involved crumbling the food by hand and removing and counting
infected larvae. These were easily distinguishable from healthy larvae by their white
colouration indicative of virus infection. Only heavily infected fourth and fifth instar
larvae were selected for this experiment, meaning the number of virus particles
extracted from each infected larvae was similar. Also larger instars were easily found
and handled. The total number of larvae removed from each population at the end of
the experiment is shown in Table 5.1, and is indicative of the virus population
prevalence in differently viscous food environments.
Virus was extracting from infected larvae using sucrose gradients and
centrifugation according to Smith & Crook (1988), with the methodology detailed in
Appendix One. The relative concentration of virus particles in each extracted strain
was determined using fluorescent activated cell sorting (FACS). This method
involved making 10-2, 10-3, 10-4 and 10-5 dilutions of each of the twelve selected
strains (making a total of 48 viral counts) and the stock strain, then dying the nucleic
acid of the virus with Sybr Gold. Each dilution was run once through the FACS
machine for 60 seconds, and the mean concentration of virus particles counted in each
dilution is shown in Table 5.2. It would have been preferable to measure the total
110
number of virus particles in each sample, but time restrictions prevented the
necessary preliminary work to be carried out. However, comparing the counts of the
four dilutions made for each strain can act to test the veracity of the FACS output.
Should the virus concentration of one strain at dilution factor 10-2 be greater than
other strains, and the sampling error of the FACS method is low, then this should
remain be the case in the other dilutions. Regarding the overall accuracy of FACS
methods, work by Heather Rae at the University of Sheffield found calculations of
total viral concentration gathered from FACS and more traditional Zeiss electron
microscopy to be similar (Appendix Two).
Droplet feeding bioassays were then carried out with the selected strains and
the original stock strain (Hughes & Wood, 1981). For the bioassay, each strain was
diluted to 10% viral concentration using a solution consisting of distilled water, 0.1%
Coomassie Brilliant Blue R dye and 2% sucrose. Larval cultures were started by
allowing adults to lay eggs in abundant food for 24 hours, then waiting 12 days for
the eggs to develop into early third instars. The third instar larvae were then placed
individually into segmented petri dishes, covered with damp tissue paper to prevent
dehydration and starved for one hour. Small droplets of the diluted virus were placed
in each petri dish chamber using a 10µl Hamilton syringe, with the sucrose
encouraging larvae to feed. Larvae were left to feed for a period and those that had
fed enough to fill at least half the gut (as indicated by the blue dye) were removed and
placed individually into a new segmented dish with fresh food. Dishes were
maintained in incubators set at 27ºC and 35% humidity. Each treated larva was
checked regularly and infected larvae were recorded and removed. Individuals that
survived to adulthood were considered to have resisted infection.

111
For each viral strain, the larval numbers exposed and corresponding mortality
rates are shown in Table 5.1. Thirteen bioassays were carried out, four testing the
mortality of strains taken from Soft Food populations, four testing strains taken from
Intermediate Food populations and four using strains from Hard Food populations.
One bioassay tested the mortality associated with the stock strain that was used to
initiate the presence of PiGV in Plodia populations. Three control bioassays were
also carried out, one for each food type, to find a base level of mortality. Such
bioassays found negligible mortality associated with the handling and exposure of
larvae to dye/distilled water solutions (results not shown).

112
Results
Table 5.1 shows the number of larvae treated in each bioassay with a 10% solution of
PiGV as well as the percentage larval mortality in each bioassay and the number of
infected larvae removed from each Plodia-PiGV population during destructive
sampling.
The concentrations of virus particles calculated through fluorescent activated cell
sorting (FACS) and the associated infectivity are shown in Table 5.2. The infectivity
of each selected strain and the stock virus was determined by dividing the respective
bioassay mortality rate by the concentration of virus particles within the 10% viral
solutions. This calculation shows the relative ability of virus particles from different
populations to infect hosts and induce virus-induced mortality. A higher value shows
that any one virus particle has a greater probability of successfully infecting a host,
and therefore the infectivity is higher. Infectivity was calculated for the four dilutions
Table 5.1 – The number of larvae removed from each population from which granulosis
virus was extracted and the mortality rate associated with bioassays testing the
infectivity of each viral strain.
Population Infected Larvae Removed Number of Larvae Mortality in Type from Population Treated in Bioassay Bioassays (%)
Soft a 48 162 30.86Soft b 56 189 53.4Soft c 50 173 68.7Soft d 54 169 49.7
Intermediate b 37 174 85.6Intermediate c 23 182 52.2Intermediate d 34 150 31.3Intermediate e 33 147 19
Hard b 26 200 23.5Hard c 16 193 35.8Hard d 25 185 43.8Hard e 21 146 2.7
Stock Strain n/a 150 14.5

113
made of each strain (10-2, 10-3, 10-4 and 10-5), to measure the potential effect of
sampling error in the FACS method upon estimates of virus concentration.
To measure the effect food viscosity had on infectivity across the dilution range, a
two-way analysis of variance was carried out on the complete data set. Infectivity
data was log transformed in order to generate homogeneous variance and normally
distributed errors. Both food type and the dilution effect had a significant negative
impact on infectivity (Food type, F2,45= 6.602, P =0.0036; Dilution, F3,44 = 3.805, P =
0.0182) and there was an insignificant interaction between the two (Interaction, F6,41
= 0.445, P = 0.844).
Analysis of the coefficients show the logged infectivity of strains maintained in
Hard Food populations was significantly lower than Soft and Intermediate Food
strains (Soft = 0.0062, Hard = 0.0029, t = 3.775, p <0.001: Intermediate = 0.0048,
Table 5.2 – The mean concentration of virus particles at each dilution level and the
corresponding mean infectivity, as determined by dividing the mortality rate with the
concentration. The strains tested include the original stock virus and the virus as
selected in differently viscous food environments.
Virus strain Mean concentration of Mean Infectivity (+se):dilutions of virus particles (+se) mortality/concentrationSoft -2 30571 (1764) 0.001636 (1.83e-4)Soft -3 12699 (1934) 0.00435 (9.9e-4)Soft -4 14013 (5500) 0.00601 (2.27e-3)Soft -5 9610 (2147) 0.007173 (2.87e-3)
Intermediate -2 25816 (7023) 0.0018445 (2.96e-4)Intermediate -3 14100 (1497) 0.003136 (6.95e-4)Intermediate -4 11513 (574) 0.00402 (1.22e-3)Intermediate -5 10522 (371) 0.00452 (1.49e-3)
Hard -2 40553 (11473) 0.000587 (1.42e-4)Hard -3 23719 (8501) 0.001149 (3.66e-4)Hard -4 12668 (1165) 0.002011 (6.12e-4)Hard -5 11499 (302) 0.00227 (7.62e-4)
Stock Strain -2 12146 (NA) 0.00119 (NA)

114
Hard = 0.0029, t = 2.15, p =0.037), although there was no significant difference
between Soft and Intermediate Food strains (Soft = 0.0062, Intermediate = 0.0048, t =
1.62, p =0.112). The dilution effect can be simply understood as an artefact of the
decrease in viral concentrations as the strain becomes more diluted. The insignificant
interaction term is important as it indicates that the effect food type has on infectivity
occurs at all dilution levels, suggesting that any sampling error associated with FACS
methods is not large enough to either obscure, or erroneously give the impression of,
relationships between food type and infectivity. The negative relationship between
food type and infectivity in the four dilutions is shown in Figure 5.1.
Comparing the infectivity of the stock strain to the selected strains (in Table
5.2), it is apparent that the stock’s value is similar to the rate found in Soft and
Intermediate Food and is larger than the value in Hard Food. This suggests the
direction of selection has been to lower infectivity in Hard Food, rather than to
increase infectivity in less viscous foods. Also, because there was no difference in the
average size of infected larvae removed from the three food types (all were fourth and
fifth instars), we can say that strains with a measured low infectivity do not boost
their infectivity indirectly by increasing the size of infected hosts and so increasing
the number of virus particles produced by infection.

115
Figure 5.1 – Granulosis virus infectivity in Soft, Intermediate and Hard Food at
four dilution levels.
Mean values of logged infectivity are presented with standard errors at four dilution levels. Regardless of the dilution, the relationship between infectivity and food type is similar. As food viscosity increases, infectivity declines (Food type, F2,45= 6.602, P =0.0036).
10-4
10-3
10-2
10-5

116
The results shown in Tables 5.1 and 5.2 indicate the number of fourth and fifth instar
larvae removed from populations and PiGV infectivity share the same relationship
with food type, with both displaying significant declines with increasing food
viscosity. Following from this, spearman’s rank correlation analysis (in Figure 5.2)
revealed significant positive relationships between infectivity and the number of
larvae removed from populations in three of the four dilutions, supporting the link
between the two factors.
Figure 5.2 – The relationship between granulosis virus infectivity and infected
larvae numbers
Spearman’s rank correlation analysis reveals significant positive relationships between infectivity and the number of infected larvae in dilutions 10-2 (rS = 0.671, P = 0.0134), 10-3 (rS = 0.734, P = 0.0077) and 10-5 (rS = 0.594, P = 0.025). The results of the correlation analysis for dilution 10-4 were insignificant (rS = 0.483, P = 0.0561).
10-3 10-2
10-5 10-4

117
Discussion
In this chapter, I examined the evolution of granulosis virus (PiGV) infectivity in host
Plodia interpunctella populations. Previous work in Chapters 2, 3 and 4 has shown
that Soft, Intermediate and Hard Foods produce significantly different larval
movement rates and generate different spatial population structures. This chapter
shows that lower movement rates and more aggregated populations are also
associated with significant declines in the ability of virus particles to infect larvae
(Figure 5.1). Figure 5.2 reveals the correlation between the number of infected larvae
in populations and infectivity, with Hard Food populations characterised by low viral
infected larvae numbers and low infectivity. This suggests that it is possible to
understand changes in infectivity by considering how shorter dispersal distances of
susceptible and infected Plodia larvae change both the spatial scale and rate of
transmission.
In Hard Food, susceptible larvae can only disperse short distances and so can
only encounter and cannibalise infected larvae within a very small region around their
oviposition site. Also recently infected larvae are unable to move away from the
location of initial infection, preventing viral strains from spreading through the
environment. Such factors make host and virus populations highly aggregated, where
the only hosts vulnerable to infection from infected larvae are those that occupy the
same spatial aggregation. In this patchy form of population structure, virus strains
with high infectivity will rapidly infect all the neighbouring susceptible larvae, a
process accelerated by the high larval contact rate within overcrowded host
aggregations. As all the nearby susceptible hosts become infected, the opportunities
for new infections decline, so reducing the infection rate of highly infective strains. In
contrast, strains with a low infectivity maintain a greater number of surrounding

118
susceptible hosts, meaning such strains have a higher transmission rate compared to
more infective strains. Therefore, as populations become more aggregated, we see the
evolution of lower virus infectivity.
The overall processes discussed above can be seen to be analogous to the
relationship between localised infection and the evolution of infectivity described in
theoretical work (Boots & Sasaki, 1999, 2000; Claessen & de Roos, 1995; Haraguchi
& Sasaki, 2000; Rand et al., 1995). In the Plodia-PiGV system, parasite dispersal
ability is dependent on its host, with infected larvae acting as the dispersal agent and
primary infectious unit. Therefore by restricting larval movement, the dispersal ability
of the virus is also restricted. As a result, viscous food types prevent the virus from
“jumping” to new patches of susceptible hosts, forcing the virus to remain within its
original host aggregation. The small number of hosts available for infection within
such aggregations causes “self-shading” of highly infective strains, so favouring the
evolution of lower infectivity (Boots & Sasaki, 1999, 2000; Haraguchi & Sasaki,
2000).
These results can be seen to be complimentary to the dynamical study of PiGV
transmission carried out by Knell et al. (1998b). They found the transmission
coefficient, the probability of new infections occurring within a population, was
dependent on the relative densities of susceptible hosts and infected larvae. When the
density of infected larvae increased in relation to host density, the transmission
coefficient of PiGV was found to decline. This was suggested to be a product of the
rapid removal of susceptible hosts through infection, so preventing later interactions
between host and PiGV resulting in new infections. Such changes in the dynamics of
transmission due to host-PiGV density match the evolutionary changes in infectivity
found in this Chapter. In aggregated Hard Food populations, strains with high
119
infectivity rapidly lower the density of surrounding hosts through infection, and
thereby increase the local density of PiGV. The resulting reduction in transmission
opportunities may well lower the transmission coefficient in the short term in a
similar way to that found in Knell et al. (1998b). However my work appears to
suggest that selection acts in the long term to favour strains with low infectivity, a
parasite trait that maintains a large local density of susceptible hosts and so confers a
high coefficient upon the transmission dynamics of the strain.
Boots & Sasaki (1999) showed the ability of spatial structure to constrain
parasite infectivity was not only manifested in highly structured populations.
Populations that are nearly completely mixed still lead to lower infectivity than more
mixed ones. The important question is whether even small degrees of spatial
structure can have an effect on parasite evolution. Clearly, the spatial characteristics
of the Plodia populations are a long way from the models, but it seems this different
structure can still constrain parasite evolution. This is an important result because it
shows that very subtle changes in mixing, within highly mixed systems, can lead to
measurable changes in the evolution of parasites.
This chapter presents one of the first empirical studies of the effect host spatial
structure and localised transmission can have on the evolution of parasite infectivity.
Theoretical approaches have been the primary tool to analyse parasite evolution, but
hopefully this work may encourage empiricists to develop further laboratory and field
methods of testing the interaction between spatial structure, infection and the
evolution of parasite infectivity and virulence. I show that even in homogeneous
environments, changing the dispersal ability of hosts and parasites can significantly
alter the selection pressure on parasites. A particular advantage of the laboratory
Plodia-PiGV system is that restricting the movement of larvae changes the population
120
structure of both hosts and parasites to a similar degree. This may not be the case in
other host-parasite systems, where the small-scale spatial distribution of infectious
units may be independent of the host distribution. Another strength of the Plodia-
PiGV system is that successful transmission results in overt infection and death,
making the mortality rate an indicator of transmission. Systems where parasite
infection is primarily associated with sublethal effects may require more complex
experimental work to determine the infectivity and virulence traits of the parasite.

121
Chapter 6
Dimorphic Resistance Patterns Suggest a
Decreasingly Costly Resistance
Mechanism in a Model Insect System.
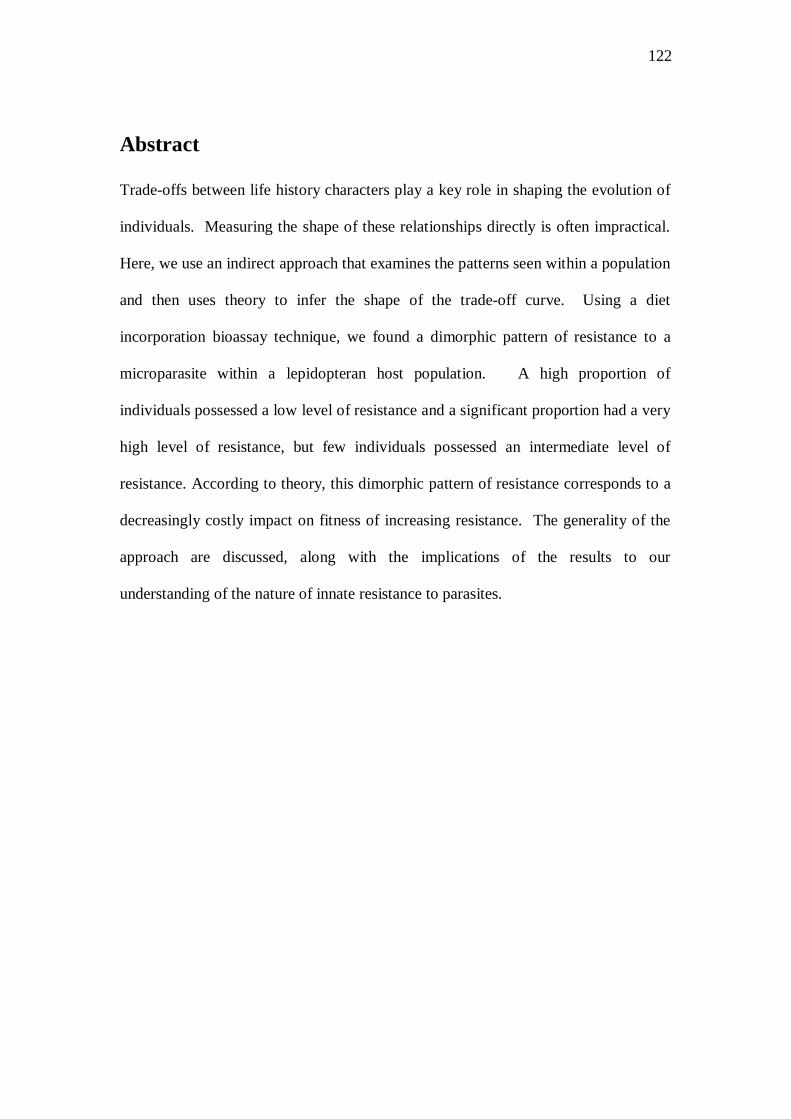
122
Abstract
Trade-offs between life history characters play a key role in shaping the evolution of
individuals. Measuring the shape of these relationships directly is often impractical.
Here, we use an indirect approach that examines the patterns seen within a population
and then uses theory to infer the shape of the trade-off curve. Using a diet
incorporation bioassay technique, we found a dimorphic pattern of resistance to a
microparasite within a lepidopteran host population. A high proportion of
individuals possessed a low level of resistance and a significant proportion had a very
high level of resistance, but few individuals possessed an intermediate level of
resistance. According to theory, this dimorphic pattern of resistance corresponds to a
decreasingly costly impact on fitness of increasing resistance. The generality of the
approach are discussed, along with the implications of the results to our
understanding of the nature of innate resistance to parasites.
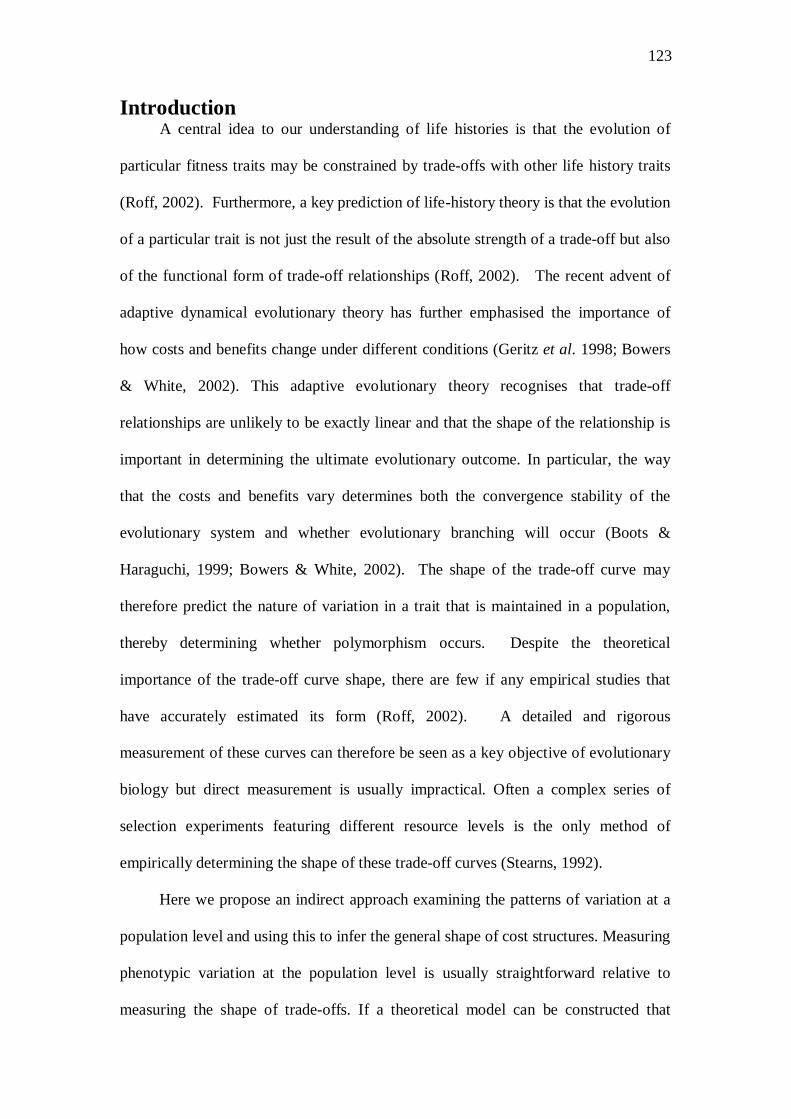
123
Introduction A central idea to our understanding of life histories is that the evolution of
particular fitness traits may be constrained by trade-offs with other life history traits
(Roff, 2002). Furthermore, a key prediction of life-history theory is that the evolution
of a particular trait is not just the result of the absolute strength of a trade-off but also
of the functional form of trade-off relationships (Roff, 2002). The recent advent of
adaptive dynamical evolutionary theory has further emphasised the importance of
how costs and benefits change under different conditions (Geritz et al. 1998; Bowers
& White, 2002). This adaptive evolutionary theory recognises that trade-off
relationships are unlikely to be exactly linear and that the shape of the relationship is
important in determining the ultimate evolutionary outcome. In particular, the way
that the costs and benefits vary determines both the convergence stability of the
evolutionary system and whether evolutionary branching will occur (Boots &
Haraguchi, 1999; Bowers & White, 2002). The shape of the trade-off curve may
therefore predict the nature of variation in a trait that is maintained in a population,
thereby determining whether polymorphism occurs. Despite the theoretical
importance of the trade-off curve shape, there are few if any empirical studies that
have accurately estimated its form (Roff, 2002). A detailed and rigorous
measurement of these curves can therefore be seen as a key objective of evolutionary
biology but direct measurement is usually impractical. Often a complex series of
selection experiments featuring different resource levels is the only method of
empirically determining the shape of these trade-off curves (Stearns, 1992).
Here we propose an indirect approach examining the patterns of variation at a
population level and using this to infer the general shape of cost structures. Measuring
phenotypic variation at the population level is usually straightforward relative to
measuring the shape of trade-offs. If a theoretical model can be constructed that

124
predicts how different cost structures lead to particular patterns of population level
variation, an empirical examination of the actual within population variation can be
used to suggest particular costs structures. The functionality of this approach will
depend on the quality of the theory, which will in-turn be determined by the
knowledge of the genetic basis of the traits concerned. Here we give an example of
this approach by examining the pattern of resistance to a parasite within a laboratory
model insect system. This is then related to theory by Boots & Haraguchi (1999) that
predicts the patterns of variation in resistance likely with particular shapes of trade-
off curves. In this instance, our definition of the pattern of resistance is simply the
proportions of a population exhibiting particular levels of quantitative resistance,
ranging from susceptibility to low viral doses to resistance to high doses. Boots &
Haraguchi (1999) found that if resistance was increasingly costly (Figure 6.1a), then
the pattern of resistance would be expected to be gaussian around an optimal
evolutionarily stable strategy resistance level (Figure 6.1b). Should the evolutionary
trade-off curve be exponential, an increase in resistance from low to intermediate
levels of resistance is associated with only a small additional cost to fitness. Therefore
an ESS forms at intermediate resistance levels, beyond which the cost to any
additional increase in resistance level becomes disproportionately high. Conversely,
an asymptotic trade-off curve (Figure 6.1a) (costs reduce as resistance increases) is
associated with a dimorphic pattern of resistance, with individuals in the population
having either low or high levels of resistance (Figure 6.1b). An asymptotic curve
selects against the evolution of intermediate resistance levels, with large fitness costs
prohibiting the evolution of intermediate resistance from low levels but the low cost
of additional resistance beyond intermediate levels favours the evolution of high
resistance. Therefore there is evolutionary divergence from intermediate resistance.

125
Figure 6.1 - Trade-off curves and the pattern of variation
a) Two potential trade-off curves: an exponential curve with costs increasing with the level of resistance; and an asymptotic curve with costs decreasing with the level of resistance. b) The resulting pattern of variation with populations: an exponential trade-off produces a gaussian variation around and an asymptotic trade-off produces bimodal variation.
b)
a)

126
Method
The system: Plodia interpunctella and its granulosis virus
Plodia interpunctella is a well-studied phycitid species of lepidoptera. The larval
stage is vulnerable to the granulosis virus (PiGV), a microparasite belonging to the
family Baculoviridae. Plodia suffers a fitness trade-off associated with being resistant
to PiGV, with resistant cohorts taking longer to develop and producing fewer viable
offspring when compared to susceptible individuals (Boots and Begon, 1993).
Bioassays were carried out using a similar technique to the one described in Vail &
Tebbets (1990). The virus was prepared through diluting a stock supply with sterile
distilled water (SDW). Twelve doses of the virus were administered through
thoroughly mixing 4ml of diluted virus into 20g of food. The 12 doses were 0.01,
0.03, 0.05, 0.1, 0.3, 0.5, 1, 3, 5, 10, 30, and 50 µg/g, providing a range of viral
challenges to the host. 50 first instar larvae were placed into each diet/dose mixture
and resistant individuals were counted as they emerged as adults. All larvae were
taken from one inbred, laboratory strain of Plodia to minimise genetic variation
within samples. Altogether there were five replicates: each replicate consisted of the
12 dose levels and 1 control assay (with only SDW). The larvae were maintained at
270C in a 16h light: 8h dark regime.
Method of determining the within-population variation in resistance
We apply methods of statistical analysis more commonly used in pharmacological
studies of drug metabolism in order to determine the pattern of resistance within the
population. In these studies, the genetic variation in a metabolic trait is determined
through sampling a population and creating a probit plot from the cumulated

127
frequency of the levels of trait expression (Eichelbaum & Woolhouse, 1985). The
linearity of the probit plot is used to determine the pattern of variation, with linear
plots corresponding to a normal (gaussian) pattern of variation while non-linearities
are associated with other patterns (Penno & Vesell, 1983; Nakamura et al., 1985). We
use an updated method of these probit analyses and include a discussion of the how a
pharmacological tool can be used in an ecological setting (Vessel & Gaylor, 1995).
Jackson et al. (1989) randomly generated data describing a range of patterns of
variation, including normal, log-normal and bimodal distributions. From these data,
they found the corresponding shape of the probit line. Therefore we can associate a
particular probit plot to its underlying pattern of variation. Here we use logit analysis,
which produces equivalent results to probit plots (Crawley, 2002). Using this
technique in a laboratory based ecological experiment, such as this one, confers an
advantages over its standard use in pharmacological studies as the degree of non-
linearity in the logit regression can be accurately determined in our study using
simple polynomial regression. This often cannot be carried out in pharmacology
studies because of a lack of replication.
Results
The results of the five bioassay replicates are presented in Figure 6.2, showing the
number resistant to infection at a range of virus doses. Blocking analysis shows no
relationship between the shape of the data and the five replicated blocks (DF = 4, F
value = 1.028, P = 0.403). The data was subjected to two forms of analysis:
polynomial regression and generalised linear modelling with binomial errors (logit).
The complete dataset, with all data points included, was found to contravene the data

128
requirements for both models. Regarding the polynomial regression, the variance was
inhomogeneous and the residuals non-normally distributed. Regarding the generalised
linear model, the residual deviance was much larger than the residual degrees of
freedom meaning the variance was over-dispersed (quadratic model: residual
deviance = 150.0546 on 57 degrees of freedom). Transformation was found not to
improve the error and variance distribution and so outliers were carefully removed,
with the output of models compared with and without certain outlying data points.
Seven data points were eventually removed, solving the overdispersion (quadratic
model: residual deviance = 53.7929 on 50 degrees of freedom) and making the error
distribution normal and the variance more homogeneous. Therefore the data set used
in the analyses contained 53 data points, some of which may be not be visible on
Figure 6.2 due to overlapping.
The results of the logit regression are shown in Figure 6.2a. A cubic
polynomial logit regression gives the best fit (Y= 0.203 – 3.6X – 1.42X2 – -0.76X3,
DF = 49, T value = -2.53, P = 0.01). The slope of this regression line is steepest at
low and very high virus concentrations, and is relatively flat at intermediate dose
ranges. According to the previously discussed work of Jackson et al. (1989), this line
corresponds to a bimodal pattern of resistance (Figure 6.1b). The accuracy of this
cubic fit was tested by jacknifing the logit regression, which examines the influence
of outlying data points on parameters. The mean jacknife estimates for the cubic fit
were Y= 0.2065 – 3.54X – 1.367X2 – 0.728X3, and these slope estimates were all
smaller than their respective regression predictions by 1.58%, 4.09% and 4.55%. The
slightly smaller jacknife estimates were still large enough to be considered as
explaining a significant degree of variance (T value = -2.32, P = 0.02 on 49 d.f.) and
the jacknifed cubic regression remained the simplest model. Bootstrapping also

129
indicated that the cubic regression is robust to outlying data points, with the 95%
confidence limit for the cubic term having the end points –1.24 and –0.104 and so
excluded zero.
The second form of statistical analysis also reveals a bimodal shape of
variation. Figure 6.2b shows the number of individuals surviving a viral challenge
over a range of doses. The cubic regression line fitted to this data explains 75.7% of
error and maximum likelihood analysis shows that the cubic is the simplest necessary
model as it is not significantly different to the quartic (L. Ratio = 1.04, p = 0.31) but
is a better fit than the quadratic (L. Ratio = 6.83, P = 0.009). The slope of the cubic
regression line can be used to determine the proportion resistant over the dose range
of the experiment, assuming that individuals resistant to one dose are also resistant to
all doses below it. The line slopes steeply through the low dose region of the graph,
which means there are a high number of individuals with their maximum level of
resistance at low doses. In other words, there is a proportion of the population that is
killed at low viral doses, and therefore has a high susceptibility to infection. Over
intermediate doses, the slope levels off, signifying that the individuals resistant to
these doses are also resistant to higher doses. This means there are few individuals
with a maximum level of resistance in this intermediate range. At high dose levels the
slope once again declines, indicating there is another distinct proportion of the
population susceptible only to these higher doses. The interpretation of both logit and
polynomial graphs therefore reveal a bimodal pattern of resistance within the Plodia
population.
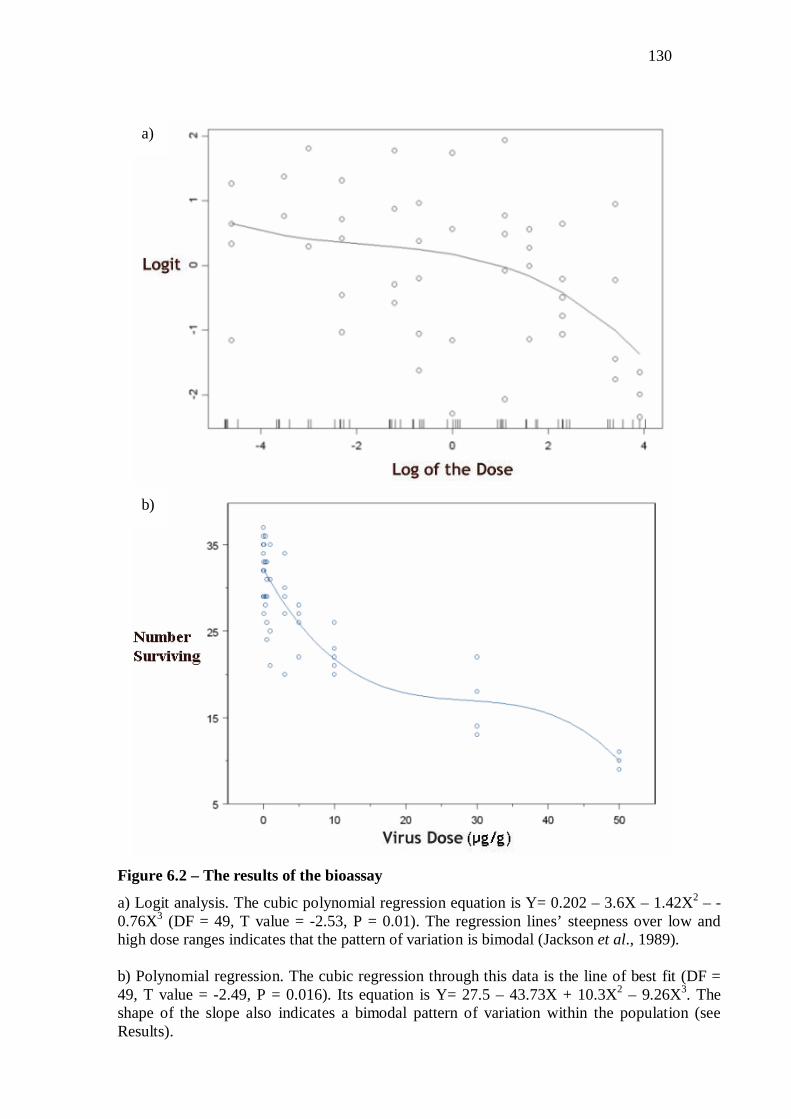
130
Figure 6.2 – The results of the bioassay
a) Logit analysis. The cubic polynomial regression equation is Y= 0.202 – 3.6X – 1.42X2 – -0.76X3 (DF = 49, T value = -2.53, P = 0.01). The regression lines’ steepness over low and high dose ranges indicates that the pattern of variation is bimodal (Jackson et al., 1989). b) Polynomial regression. The cubic regression through this data is the line of best fit (DF = 49, T value = -2.49, P = 0.016). Its equation is Y= 27.5 – 43.73X + 10.3X2 – 9.26X3. The shape of the slope also indicates a bimodal pattern of variation within the population (see Results).
a)
b)

131
Discussion
Resistance towards a granulosis virus in Plodia interpunctella has been shown to
carry a cost such that there is a fitness trade-off with respect to other aspects of life
history (Boots & Begon, 1993). The aim of this study was to infer the shape of the
trade-off curve associated with resistance. Using mathematical theory constructed by
Boots & Haraguchi (1999) it was possible to infer the trade-off curve by finding the
pattern of resistance in a population. A bioassay indicated a dimorphic pattern of
resistance, with most individuals possessing either a low or high level of resistance
and very few with an intermediate level (Figure 6.1b). Since other possible causes of
variation in resistance, such as stochasticity and spatial heterogeneity, have been
minimized in this experiment, it is possible that this pattern is caused by the
associated cost structure. According to theory, a dimorphic pattern of resistance
relates to an asymptotic trade-off curve shape where the rate of costs to fitness
decrease as resistance increases (Figure 6.1a).
This paper presents a potential method for studying both the shape of the trade-
off curve associated with resistance and the variation within populations resulting
from this cost structure. The concept of trade-offs existing between different
components of life history is a fundamental aspect of evolutionary ecology, yet the
exact nature of such trade-off relationships is very difficult to find empirically
(Stearns, 1992). This paper, in conjunction with Boots & Haraguchi (1999), shows
that it might be possible to infer the shape of the trade-off curve simply from standard
bioassay techniques, using logit and polynomial regression analysis to discover the
variation of resistance within a population. Particular patterns of resistance within a
species are generated by specific trade-off curve shapes, which are determined by the
mechanism of resistance. Therefore estimating the cost structure of resistance using

132
these methods means that we gain insights into the mechanisms of resistance within
the host. This follows because a particular mechanism implies particular cost
structures (Boots & Haraguchi, 1999).
The indirect nature of these concepts means the methodology requires careful
application and interpretation. Without studies examining the genetic basis to
resistance and the variation of such genes in populations, it is difficult to confidently
state that the pattern of Plodia resistance is caused solely by the trade-off curve.
Despite the quantitative nature of Plodia resistance, it is possible that bimodal
variation emerged through broad gene-for-gene interactions between Plodia and
PiGV. If this were the case, any within-population variation would be a product of the
ratios of corresponding host and parasite genes rather than phenotypic variation
resulting from the cost structure. Another potential explanation of the variation is that
the relationship between parasite dose and infection is non-linear, generated by
transmission and virulence thresholds. However in this experiment, infection was
observed at each dose level suggesting the absence of any transmission thresholds
within the experimental dose range. Also virulence thresholds, where high parasite
loads produce non-linear effects on host mortality, are perhaps more likely to be
observed in macroparasitic infections where sublethal effects of infection are
commonly used as the measure of host susceptibility. The methods presented in this
chapter may be useful in identifying non-linearities in parasite transmission and
virulence in well-understood gene-for-gene systems, where the genetic susceptibility
within each host strain is uniform.
A final consideration is the potential application of this methodology for
sampling the variation of resistance within field populations. Populations can be
subdivided into patches, with the population density at each patch dictated by habitat

133
and interspecific interactions. In this instance, the most suitable method of sampling
the variation would involve initially concentrating sampling effort on the largest
subpopulation with no recent history of extinction and recolonisation. This approach
would allow most of the variation to be captured whilst minimising the effects of
spatial stochasticity. Smaller subpopulations might then be sampled to ensure the
upper and lower limits of the initial variation discovered were representative of the
population as a whole.
For clarity, this work has focussed on the particular trade-off with resistance to
parasites. However the general approach of using theory to predict patterns that arise
from particular cost structures and then examining the patterns directly at the level of
the population has good applicability. Indeed recent general theory (Bowers & White,
2002) suggests that the curvature of trade-off functions, interpreted in terms of
accelerating or decelerating costs, have a good general predictive ability beyond host-
parasite interactions. Measuring trade-off curves directly will always be difficult, but
tightly controlled examinations of population level variation may help us understand
fundamental selective pressures.

134
Chapter 7
General Discussion
135
This thesis examined two forms of ecological heterogeneity. In terms of spatial
heterogeneity, the implications of different spatial structures upon competition and
parasite infection were investigated using both insect laboratory systems and
probabilistic cellular automata. In terms of life history heterogeneity, novel
applications of statistical methods were used to determine the variation of resistance
within an insect population.
Methods of Investigating Spatial Structure
This thesis focussed on methods of creating different forms of spatial heterogeneity in
laboratory populations of Plodia interpunctella and Ephestia cautella. The approach
involved changing the ability of individual larvae to disperse through a homogeneous
food environment. Changing the viscosity of the food medium generated different
movement rates and the method was successful because it incorporated two important
aspects of the insect’s life history: 1) larval movement predominately occurs within
and through the food medium; 2) both species are capable of feeding and surviving on
a wide range of food types. These factors meant that changing food viscosity would
alter larval movement rates and yet not affect their ability to feed and develop. In
Plodia, the larval stages critical for determining infection and competition are early
instars, which have yet to show full maturation resistance towards the granulosis virus
and are highly sensitive to the amount of food available. Crucially, it is these early
instars that are most affected by the viscosity of food, with later instars naturally
moving out the food to search for pupation sites. Therefore, in this system, increasing
the viscosity of food has a clear, significant impact on competition and infection
processes. Future work with other systems would require an understanding of the

136
stages in a species’ life history that are critical in determining the dynamics of
ecological processes. Then techniques would have to be implemented to change the
movement rate of these particular stages. The importance of this is shown in the
Plodia populations maintained on Soft Food (Chapter 4). At the egg stage,
populations are intrinsically aggregated because eggs are laid in batches throughout
the environment. The rapid movement of hatched larvae soon breaks down this
aggregated distribution and a more homogeneous structure emerges. It is this
relatively homogeneous larval structure that is important in determining the overall
dynamics, not the aggregated egg structure, because competition and infection only
occur at the larval stage.
Many previous attempts to generate different population spatial structures in
the laboratory have involved plants, either to test directly (e.g. Norris et al., 2001) or
to create different spatial distributions for plant parasites or herbivorous species (e.g.
Burdon & Jarosz, 1991; Janssen & Sabelis, 1992). Also, the distributions of animal
populations in the field are often measured by the position of the plant species known
to provide food or habitat to the animal (e.g. Harrison et al., 1988). The advantage of
using plants in spatial studies is that they are stationary, so the experimenter can
measure their position and easily monitor the state of individuals or patches over
time. As a result of this work, much of the emphasis in spatially orientated
experimental studies has been on exogenous forms of spatial heterogeneity, where
populations are divided into distinct, discontinuous clumps. In contrast, this thesis
shows the importance of endogenous forms of heterogeneity, where individual
dispersal and local interactions generate different, continuous spatial structures
despite a uniform, homogeneous environment. Endogenous heterogeneity is normally
difficult to create, as it requires each individual in the population to be monitored and

137
manipulated. My work solves this problem by using preliminary experiments (as in
Chapter 2) to gain an understanding of the relative behaviour of individuals, then
inferring the effect of such behaviour at broader cohort and population scales.
Exciting future work may involve methods of creating endogenous heterogeneity but
in variable, resource patchy environments, such that both endogenous and exogenous
factors can be combined.
The methodology developed in this thesis was laboratory based, using insects
in microcosms to study population structure. An advantage of this approach is that
different spatial structures can be easily replicated. Also the Soft Food populations
provide an excellent spatial ‘control’, because the population structure of larvae is
relatively homogeneous. This means both the degree and the effect of patchiness in
other food types can be easily estimated in comparison to the homogeneous control. It
is the small environment size associated with the insect microcosms that allows
homogeneous structures to emerge in Soft Food, because larger scale experiments
would be too big for individual larvae to travel through a significant proportion of the
food.
The disadvantages associated with this laboratory microcosm approach are that
the spatial structure is not directly observed, instead it is inferred from larval
movement rates and competition and infection processes. This means that dynamical,
temporal changes in spatial structure are missed. Such spatial patterns may have a
significant impact upon host and host-parasite dynamics and could explain some of
the variation found between replicates in the competition and infection experiments
discussed throughout the thesis. To overcome this problem, the direct monitoring of
at least some individuals is required, together with destructive sampling of
populations and the mapping of individuals. Also the preliminary experiments in

138
Chapter 2 show there is considerable variation in movement among individuals, with
some Plodia larvae moving 18cm and some 3cm (Figure 2.5a). The implications for
such variation upon the fate of individuals are unknown and again require monitoring
selected larvae. It is difficult to see how this may be possible in microcosm
experiments with highly mobile, short-lived individuals moving through a
homogeneous environment. Also the small size of the environment, which offers
some advantages, can also be seen as a limiting factor in interpreting the laboratory
results. This is because potentially important long-tailed dispersal of both insects and
parasites cannot be replicated in 20x20cm food environments. Such dispersal may be
important for baculovirus spread, with wind and bird vectors acting to spread virus
particles long distances (Entwistle et al., 1983). Adult moths can also move relatively
large distances, and this may play a very important role in defining the spatial
distribution and dynamics of natural host-parasite populations.
Differences between Plodia and Ephestia Movement
The preliminary experiments in Chapter 2 show a large difference between the
movement rates of Plodia interpunctella and Ephestia cautella. Over a period of
development from first to third instar, Plodia larvae travelled an average distance of
10.63 ± 0.73cm in Soft Food, with Ephestia only travelling an average 3cm ± 0.65
(Figure 2.4). The different larval movement rates of the two species may be explained
as an evolutionary response to the different oviposition behaviours of Plodia and
Ephestia female adults. Plodia females preferentially lay eggs in food that is high in
quality, with high larval densities not deterring oviposition (Anderson & Löfqvist,
1996). Therefore it is probable that Plodia larvae exist in local environments

139
surrounded by many conspecifics, making competition for food and space intense. A
high larval movement rate might then enable individuals to escape local competition
and disperse into less stressful competition environments.
It is possible that Ephestia oviposition behaviour is different to Plodia, as a
study of the sister species Ephestia kuehniella found adult females actively avoid
laying eggs in densely populated larval regions (Anderson & Löfqvist, 1996).
Females select oviposition sites by detecting the presence of mandibular pheromones
in the food, a substance that is released when the heads of larvae make contact
(Corbet, 1971). The more pheromone there is in the food, the more larvae are present.
Should Ephestia cautella behave the same way, the lower movement rates of larvae
could be considered to be the optimum to avoid competition. A hatched larva would
experience competition mainly from kin, as a result of the low number of nearby
individuals from other egg batches. A low to moderate movement rate is all that is
required to avoid this, with larvae moving into the surrounding, competition-free,
environment. Indeed, a high movement rate for Ephestia might be detrimental, as the
more distance individuals travel the greater the likelihood of encountering
competition from unrelated individuals.
Competition and Space Structure
Chapter 3 shows that changing the spatial structure of larvae can significantly change
the nature of interspecific competition. Plodia interpunctella was shown to be a
superior competitor to Ephestia cautella in Soft Food (Figures 3.1& 3.2). In this food
type, Plodia larvae outcompete Ephestia for two main reasons: 1) a faster growth rate
allows Plodia to develop faster and so dominate interspecific encounters; 2) a faster
140
movement rate allows Plodia individuals to avoid intraspecific encounters and more
rapidly exploit available resources. The importance of movement rate in conferring a
competitive advantage is shown in Hard Food, where the movement rates of Plodia
and Ephestia are similar. Here the competitive advantage of Plodia larvae disappears,
with no significant difference found in the numbers from either species surviving
competition (Figure 3.2). Although movement rate determines the outcome of
competitive encounters when first instar larvae of both are placed together in the
laboratory, in the wild the outcome is determined predominately by founder
competition (Allotey and Goswami, 1992). In founder competition, the species that
first colonises a region will have the advantage because its hatched larvae will be able
to exert asymmetric competition on the eggs and young larvae of a secondary
invading species. Therefore the dispersal rate of the two species, although critical in
determining the outcome of interspecific competition in my work, has likely not
evolved in response to community selection pressure. Rather, it has more likely
evolved through the need to avoid intraspecific competition associated with the egg
laying behaviour in the adult stage.
Broadly, these results show the importance of dispersal in determining the
outcomes of competition between species. The dispersal ability of species has often
been incorporated into competition studies by using a competition-colonisation, life
history trade-off. This trade-off involves the distinct separation of dispersal and
competitive ability, with individuals with high movement rates being weak
competitors. However in Plodia-Ephestia laboratory interactions, it is the movement
rate that defines competition, with the species capable of moving the furthest distance
being the best competitor. Here, the dominant species is the one best able to avoid
141
competitive encounters, and this is perhaps true of many competitive interactions
between mobile species that share similar life histories and habitat preference.
There has been a large body of work attempting to appreciate the relationship
between the coexistence of competitors and population spatial heterogeneity (Bolker
& Pacala, 1999; Neuhauser & Pacala, 1999; Pacala, 1986; Weiner & Conte, 1981).
The experiments in Chapter 3 show that aggregating the distribution of species can
reduce interspecific encounters and increase intraspecific encounters, resulting in the
greater survival of the inferior competitor (Ephestia). However this experiment only
examined small-scale competition over one generation. Therefore larger scale studies
are required over longer time periods to understand whether aggregated distributions
have the potential to induce long-term coexistence of competing species. Such
experiments will reveal whether population aggregation can lead to species
segregation and the threshold “arena size” below which coexistence cannot occur
(Steinberg & Kareiva, 1997). Measuring the threshold “arena size” and relating it to
specific aspects of the insect system will be crucial for broadening the use of the
experimental approach, because it might indicate the scale of study required to
observe segregation and coexistence in other competition systems. Populations of
Plodia and Ephestia could be maintained in different food types then destructively
sampled to analyse both the overall number of both species and the small-scale spatial
structure of larval populations. The small-scale larval structure may also reveal
important spatial patterns associated with the dispersal ability of larvae, different
adult behaviours and the coexistence or otherwise of competing species.

142
Infection and Host Spatial Structure
The effect of different spatial structures upon a host-parasite interaction was studied
in Chapters 4 and 5. In Soft Food populations, Plodia larvae movement rates were
high, making the population structure relatively homogeneous. This allowed a large
proportion of the population to encounter larvae infected with granulosis virus,
causing a high viral prevalence in populations (Figure 4.4). The effect of
homogeneous host-parasite interactions on the Plodia host was a significant reduction
in growth rate, either due to the evolution of resistance or to sublethal infection. The
effect on the virus was to maintain the relatively high infectivity of the initial stock
strain (Table 5.2).
In Hard Food populations, Plodia larvae movement rates were low forcing
individuals within populations into overcrowded aggregations. The resulting highly
localised nature of infection caused the population prevalence of the virus to be low.
However, high contact rates within aggregations caused local infection and multiple
infection rates to be very high, explaining the large parasite-induced decline in Hard
Food population sizes (Figure 4.6). Aggregated host and parasite spatial structures
were also associated with the evolution of lower viral infectivity (Figure 5.1), because
strains with less ability to infect hosts maintain a larger number of surrounding
susceptible larvae. This causes strains with low infectivity to possess a greater
transmission rate compared to highly infective strains, which rapidly infect
neighbouring susceptibles and reduce the number of infection opportunities.
These results allow broader conclusions to be made about the methods required
to understand the effect parasites have upon host populations. Field populations are
often fragmented due to the patchy distribution of suitable habitat, with fragments
linked by migration. In such aggregated populations, the overall prevalence of a
143
parasite may not give a true indication of its effect on the host dynamics. This is
because a parasite with low overall prevalence may have a very high local prevalence
within individual host patches, due to localised overcrowding and high host contact
rates. As a result, the localised mortality and sublethal effects associated with
infection may significantly reduce the host population size despite only a small
number of patches containing the parasite and the evolution of less infective strains.
This idea has been previously expressed in relation to highly virulent parasites, which
have a significant effect on host mortality but remain at a low prevalence in the
population (McCallum & Dobson, 1995). Such evolutionary mechanisms may be
difficult to distinguish from the ecological mechanisms of localised infection within
host patches.
Another potential difficulty with studying aggregated host-parasite interactions
is the relationship between host evolution and parasite-induced mortality. Should the
highest parasite-induced mortality be associated aggregated hosts, we might expect to
see significant evolutionary changes in host resistance. However, in this environment,
the highest mortality rate is also associated with low overall parasite prevalence. Low
population prevalence means the selection pressure for increased resistance is weak
for a large proportion of hosts. Also should resistance be associated with a cost to
fitness, susceptible hosts will be superior competitors in the absence of the parasite
and so further restrict the evolution of host resistance. Therefore spatial heterogeneity
may separate the parasite’s effect on population size and host evolution, with
evolution only occurring alongside low parasite-induced mortality.
The work in this thesis suggests that spatial heterogeneity needs to be
incorporated into host-parasite studies if the interaction is to be completely
understood. This is especially true when the dispersal of the parasite is associated

144
with host movement. In the laboratory Plodia interpunctella-granulosis virus
interaction, the primary infectious unit is infected larvae. Therefore the spread of the
virus through the environment depends directly upon the movement of such infected
larvae. This results in a distribution of the parasite that matches the host distribution.
Parasite’s, whose transmission and spread is associated with free-living stages or
vectors, may have a spatial distribution that is independent of the host. In such cases,
the spatial heterogeneity in the parasite cannot be inferred from host heterogeneity
and so requires separate spatial analysis.
There have been a number of theoretical studies linking the creation of habitat
corridors in fragmented habitats to an increase in the spread of disease (Hess, 1996;
Keeling, 1999). The work in this thesis suggests that conservation measures restricted
to connecting small, overcrowded host patches may render such patches more
vulnerable to parasite-induced extinction. Instead, increasing the size of patches, in
conjunction with corridor formation, may be the best conservation method. This is
because high densities of hosts within a restricted area will lead to high host contact
rates and so high rates of direct parasite infection. Increasing the size of habitat
patches has the effect of increasing the area available to individuals, reducing both the
host contact rate and density, so lowering the parasite infection rate. Habitat corridors
will then enable density-dependent emigration from patches in order to prevent host
density and infection rate rising, so reducing the probability of parasite-induced, local
population extinction.
145
Variation in Life History Traits: Resistance
Chapter 6 focussed on heterogeneity in the expression of resistance within a
population of Plodia interpunctella towards its granulosis virus (PiGV). A series of
replicated bioassays found the mortality rate associated with twelve viral doses and
the shape of polynomial regression and logit plots (Figure 6.2) were analysed to
determine the shape of variation within the population. A dimorphic pattern was
found with most individuals having either a low or high level of resistance (Figure
6.1).
A dimorphic pattern of resistance within the population may have a variety of
implications for the dynamics and evolution of the host-parasite interaction. In the
absence of a virus, the highly resistant proportion will be outcompeted by susceptible
individuals with a faster development time and larger reproductive capacity (Boots &
Begon, 1993). Indeed, the variation in resistance found within the stock population is
only maintained because the large quantities of high quality food supplied reduce
competition between the two classes. An introduction of a virus with intermediate or
high virulence will result in the removal of the susceptible proportion with only the
resistant individuals persisting (Boots & Haraguchi, 1999). This may cause the mean
level of resistance to change quickly, with resistance initially increasing as the
susceptible population is removed by the virus, followed by a potential decline in the
level of resistance should the virus then be lost from the population.
A number of mathematical and simulation based models have examined the
interaction between a susceptible and a resistant class of hosts, together with a non-
evolving parasite. Several gene-for-gene coevolutionary models have generally
concluded that the presence of a parasite can create a stable polymorphism within the
host population (reviewed in Sasaki, 2000). This stability occurs because the

146
susceptible class maintains the presence of the parasite, which the resistant hosts
could not do alone. The consequence of parasite maintenance is that a selective
advantage remains for the resistant phenotype, so preserving the host polymorphism
(Antonovics & Thrall, 1994; Bowers et al., 1994).
Concluding Remarks
This study highlights the importance of the spatial structure of populations in
determining the outcome of competition and infection processes. Laboratory
techniques to change the movement of individual Plodia interpunctella larvae created
different levels of population aggregation. Increasing aggregation had the effect of
making intraspecific competition more intense, which changed the survival and
development of larvae at cohort and population scales. An increase in intraspecific
competition when movement was associated with a decline in interspecific
encounters, thereby encouraging greater coexistence with the inferior competitor
Ephestia cautella. Aggregated population structures were associated with lower
granulosis virus prevalence and the evolution of lower infectivity. However, in such
populations, the virus had a greater effect on the host because of high, localised
infection rates within overcrowded host clumps. Finally, graphical analysis was used
to analyse the results of a bioassay with Plodia interpunctella and its granulosis virus.
A dimorphic pattern of resistance was measured, characterised by most individuals
possessing either a low or high level of resistance.

147
Appendices

148
Appendix One - GV Extraction from Plodia interpunctella
Day before extraction…
Make up sucrose gradients – Series of solutions - 40%-65% in 5% gradations.
Concentrations made up on weight basis – e.g. 40% solution = 40g sucrose with 60g
solvent (60ml). Solvent is either water or TE with 100th volume of 10% SDS (added
to reduce aggregation of occlusion bodies). Note- highest concentration may need to
be heated to dissolve sucrose (50 degrees C for few hours). Solutions then transferred
in series to centrifuge tubes. Volume of tubes around 14ml so 2ml of each
concentrations added to each tube, beginning with the highest conc. – results in layers
of different solutions with interface lines visible between them. These are left
overnight at room temperature for gradients to form.
Step 1…
Before beginning the extraction or handling of the infected cadavers a solution of
sodium carbonate is made up. This is used to clean equipment following
contamination with occlusion bodies – all glassware is transferred here after use.
Concentration should be around 0.05-0.1M. Infected larvae are then ground up in
solution of TE or water. Volumes aren’t particularly important, as long as the larvae
are submerged. A white solution is produced of insect tissues and virus occlusion
bodies. The solution is then transferred to eppendorfs - around 2/3 full roughly, using
a dropper pipette.
Eppendorfs roughly balanced in Micro Centaur centrifuge so that equally
filled pairs placed opposite in the rotor. Virus/insect tissue solution may be
redistributed between eppendorfs if needed. Tubes then spun at 3000rpm for 1 minute
to pellet most of the insect tissue, leaving the virus occlusion bodies suspended in the
149
solution. The resulting supernatant is removed using a pipette and transferred into a
clean eppendorf. As much supernatant should be removed as possible without taking
up the pellet of insect tissue (however, if it is, it doesn’t matter, it’ll be separated out
later). Note – don’t block tip of pipette with insect tissue! Could result in rest of
pipette becoming contaminated! Note - If more virus is required, more TE can be
added to the eppendorfs of insect tissue and these can be whirlimixed and the above
centrifuge process repeated again. The resulting virus supernatant can then be added
to the supernatant tubes. The removed supernatant then consists of virus solution with
the bulk of the insect tissue removed. To pellet the virus occlusion bodies the
eppendorfs are spun in the micro centrifuge again (balancing them as before), this
time at 13 000rpm for 3 minutes.
Step 2…
The pellets of virus OBs are suspended in 0.5ml of TE or water by pumping the
pipette, then removed by pipette from the tubes and transferred carefully to the
surface of the sucrose gradient ultra centrifuge tubes. These tubes should be as full as
possible – about 5mm from the top – otherwise they may collapse! Before the ultra
centrifuge, the tubes should be pair balanced accurately by weighing and if tubes need
to be matched the required volume of TE or water may be added. Technically,
opposite pairs must be matched to within 0.5g.
Once tubes are prepared they can be transferred to the rotor buckets and the lids
screwed on. The buckets are then hooked onto the rotor pins, free hanging. Note –
the tubes are Beckman ultra clear centrifuge tubes and the centrifuge is the Beckman
XL 100. With buckets attached, the rotor is transferred to the centrifuge – the notches

150
on the rotor base fit in at right angles to the centrifuge pins. The centrifuge is then set
at 20 000rpm for one hour at 20 degrees C.
Step 3…
After centrifuge a white band of virus OBs is visible in the tube. The solution above
this band is carefully removed using a dropper pipette, beginning with the pipette tip
on the surface and working down, rotating the tube to pick up all surface layers. Care
must be taken not to pump the pipette and thus mix up the layers. This solution is
disposed of into a bottle to be autoclaved. When there are a few mm of solution
remaining above the virus band, small amounts of virus can be seen being sucked
towards the pipette – the virus band should now be removed. A new dropper pipette
should be used. The tip of the pipette is immersed inside the virus band and the band
is drawn off with one motion if possible, rotating the tube to remove OBs from the
sides and avoiding squirting back into the tube (Note – to increase purification of the
virus, the last step of centrifugation should be repeated on the virus band removed).
The separated virus band is then transferred to a new ultra centrifuge tube, not more
than 1/3 filling it, taking care not to transfer too much sucrose solution. This is then
diluted with TE or water to fill the tube. Mixing of the solution is ensured by
pumping the pipette used. As before, the tubes are filled to 0.5mm from the top, pair
balanced and transferred to the ultra centrifuge – 15 000rpm for 20 minutes at 20
degrees C.
Step 4…
Following centrifugation, the virus OBs will be visible as a white pellet at the bottom
of the centrifuge tube. The supernatant is removed, again by pipette, avoiding

151
removing as much of the virus pellet as possible. 250µl of water are added to the
pellet by pipette and the solution mixed. This can then be added to a container for
storage.
152
Appendix Two – Comparison of Virus Counting Methods
Traditional techniques for calculating the concentration of granulosis virus particles
within a solution involved transmission electron microscopy, using 0.01mm depth
counting chambers. Such counting chambers are no longer made with the necessary
slide part for dark field illumination, so a 0.02mm depth chamber was used to
compare the results of electron microscopy to fluorescent activated cell sorting
(FACS) methods. Chambers with a greater depth make virus counting more difficult,
therefore to reduce the variance the focus was adjusted and several people counted the
same sample (personal communication from Dr. Doreen Winstanley at Warwick
Horticulture Research International). The methods used are listed below:
1. Vortex and sonicate the virus sample briefly before use. Transfer 2ul of the viral
suspension onto the grid of the counting chamber. Press a toughened coverslip firmly
onto the sample until Newton rings occur.
2. Count the viral PiGV using a Zeiss microscope fitted with an oil condenser, a 20x
Objective and a 10x eyepiece using dark field illumination. Only count the shining
particles moving by Brownian motion.
3. Dilute the virus sample to give approximately 100-200 PiGV per large square (64
small squares). Prepare duplicate samples at this dilution. Carry out two counts at
each dilution. For each of the 4 individual counts, 4 large squares (i.e. 64 small
squares) are counted diagonally across the grid.

153
4. Use the following equation to determine the total number of PiGV: x 105 x
dilution factor
5. Calculate the standard error of the mean for the counted samples.
Heather Rae and Rebecca Finley at the University of Sheffield compared the total
concentration of two PiGV strains as calculated by the microscopy techniques above
with FACS methods.
The results of the two methods are similar, although more work is required in the
future before the output from FACS can be said to be equivalent to standard electron
microscopy.
Strain Microscope FACS1 9.58E+08 1.36E+092 1.46E+09 9.72E+09

154
References

155
Abrams, P. A. & Walters, C. J. 1996. Invulnerable prey and the paradox of
enrichment. Ecology, 77, 1125-1133.
Adang, M. J. & Spence, K. D. 1983. Permeability of the peritrophic membrane of the
Douglas Fir tussock moth, (Orgyia pseudotsugata). Comparative Biochemistry
and Physiology A., 74, 233.
Adler, F. R. & Mosquera, J. 2000. Is space necessary? Interference competition and
limits to biodiversity. Ecology, 81, 3226-3232.
Allen, J. C. 1975. Mathematical models of species interactions in time and space.
American Naturalist, 109, 319-341.
Allen, J. C., Schaffer, W. M. & Rosko, D. 1993. Chaos reduces species extinction by
amplifying local population noise. Nature, 364, 229-232.
Allotey, J. & Goswami, L. 1990. Comparative biology of two phycitid moths, Plodia
interpunctella (Hubn.) and Ephestia cautella (Wlk.) on some selected food
media. Insect Science Applications, 11, 209-215.
Allotey, J. & Goswami, L. 1992. Competition between the phycitid moths Plodia
interpunctella (Hubn.) and Ephestia cautella (Wlk.) in groundnuts and on a
laboratory diet. Insect Science Applications, 13, 719-723.
Amarasekare, P. & Nisbet, R. M. 2001. Spatial heterogeneity, source-sink dynamics
and the local coexistence of competing species. The American Naturalist, 158,
572-584.
Anderson, P. & Löfqvist, J. 1996. Asymmetric oviposition behaviour and the
influence of larval competition in the two pyralid moths Ephestia kuehniella
and Plodia interpunctella. Oikos, 76, 47-56.
Anderson, R. M. & May, R. M. 1980. Infectious disease and population cycles of
forest insects. Science, 210, 658-661.

156
Anderson, R. M. & May, R. M. 1981. The population dynamics of microparasites
and their invertebrate hosts. Philosophical Transactions of the Royal Society of
London B, 291, 451-524.
Anderson, R. M. & May, R. M. 1992. Infectious Diseases of Humans. Oxford
University Press, Oxford.
Antonovics, J. & Thrall, P. H. 1994. The cost of resistance and the maintenance of
genetic polymorphism in host-pathogen systems, Proceedings of the Royal
Society of London B, 257, 105-110.
Antonovics, J., Thrall, P. H., Jarosz, A. M. & Stratton, D. 1994. Ecological genetics
of metapopulations: the Silene-Ustilago plant-pathogen system. Pages 146-170
in L. Read, ed., Ecological Genetics. Princeton University Press, Princeton.
Arbogast, R. T., Kendra, P. E. & McDonald, R. C. 2002. Infestation of a botanicals
warehouse Plodia interpunctella and Ephestia elutella (Lepidoptera:
Pyralidae). Entomological News, 113, 41-49.
Armstrong, R. A. 1976. Fugitive species: experiments with fungi and some
theoretical considerations. Ecology, 57, 953-963.
Aronson, A. I, Beckman, W. & Dunn, P. 1986. Bacillus thuringiensis and related
insect pathogens. Microbial Review, 50, 1-24.
Atkinson, W. D. & Shorrocks, B. 1981. Competition on a divided and ephemeral
resource: a simulation model. Journal of Animal Ecology, 50, 461-471.
Bailey, N. J. T. 1975. The Mathematical Theory of Infectious Diseases and its
Applications. Oxford University Press, Oxford.
Barbour, A. & Mollison, D. 1990. Epidemics and random graphs. Pages 86-89 in J. P.
Gabriel, C. Lefevre & P. Picard eds., Stochastic Processes in Epidemic Theory.
Springer, New York.
157
Bascompte, J. & Solé, R. V. 1994. Spatially-induced bifurcations in single-species
population dynamics. Journal of Animal Ecology, 63, 256-264.
Beaton, C. D. & Filshie, B. K. 1976. Comparative ultrastructural studies of insect
granulosis and nuclear polyhedrosis viruses. Journal of General Virology, 31,
151.
Begon, M., Haji Daud, K. B., Young, P. & Howells, R. E. 1993. The invasion and
replication of a granulosis virus in the Indian meal moth, Plodia interpunctella:
An electron microscope study. Journal of Invertebrate Pathology, 61, 281-295.
Begon, M., Mortimer, M & Thompson, D. J. 1996. Population Ecology: A Unified
Study of Animal and Plants. Blackwell Sciences Ltd, Oxford.
Begon, M., Sait, S. M. & Thompson, D. J. 1995. Persistence of a parasitoid-host
system: refuges and generation cycles. Proceedings of the Royal Society of
London B, 260, 131-137.
Begon, M., Sait, S. M. & Thompson, D. J. 1996. Predator-prey cycles with period
shifts between two and three-species systems. Nature, 381, 311-315.
Bell, C. H. 1975. Effects of temperature and humidity of four Pyralid moth pests of
stored products. Journal of Stored Product Research, 11, 167-175.
Bell, C. H. 1976. Factors governing the induction of diapause in Ephestia cautella
and Plodia interpunctella (Lep., Pyralidae). Physiological Entomology, 1, 83-
91.
Benassi, V., Frey, F. & Carton, Y. 1998. A new specific gene for wasp cellular
immune resistance in Drosophila. Heredity, 80, 347-352.
Bengtsson, J. 1991. Interspecific competition in metapopulations. Biological Journal
of the Linnean Society, 42, 219-237.
Benz, G. 1963. A nuclear polyhedrosis virus of Malacosoma aplicola (Staudinger).

158
Journal of Invertebrate Pathology, 5, 215.
Bjørnstad, O. N., Begon, M., Stenseth, N. C., Falck, W., Sait, S. M. & Thompson, D.
J. 1998. Population dynamics of the Indian meal moth: demographic
stochasticity and delayed regulatory mechanisms. Journal of Animal Ecology,
67, 110-126.
Bjørnstad, O. R., Sait, S. M., Stenseth, N. C., Thompson, D. J. & Begon, M. 2001.
The impact of specialized enemies on the dimensionality of host dynamics.
Nature, 409, 1001-1006.
Bolker, B. M. 1999. Analytic models for the patchy spread of plant disease. Bulletin
of Mathematical Biology, 61, 849-874.
Bolker, B. M. & Grenfell, B. T. 1995a. Impact of vaccination on the spatial
correlation and persistence of measles dynamics. Proceedings of the National
Academy of Sciences, 93, 12648-12653.
Bolker, B. M. & Grenfell, B. T. 1995b. Space, persistence and dynamics of measles
epidemics. Proceedings of the Royal Society of London B, 348, 308-320.
Bolker, B. M. & Pacala, S. W. 1999. Spatial moment equations for plant competition:
understanding spatial strategies and the advantages of short dispersal.
American Naturalist, 153, 575-602.
Boots, M. 1998. Cannibalism and the stage-dependent transmission of a viral
pathogen of the Indian meal moth, Plodia interpunctella. Ecological
Entomology, 23, 118-122.
Boots, M & Begon, M. 1993. Trade-offs with resistance to a granulosis virus in the
Indian meal moth, examined by a laboratory evolution experiment. Functional
Ecology, 7, 528-534.
Boots, M. & Bowers, R. G. 1999. Three mechanisms of host resistance to

159
microparasites- avoidance, recovery and tolerance- show different evolutionary
dynamics. Journal of Theoretical Biology, 201, 13-23.
Boots, M. & Haraguchi, Y. 1999. The evolution of costly resistance in host-parasite
systems. American Naturalist, 153, 359-370.
Boots, M. & Norman, R. 2000. Sublethal infection and the population dynamics of
host-microparasite interactions. Journal of Animal Ecology, 69, 517-524.
Boots, M. & Sasaki, A. 1999. ‘Small worlds’ and the evolution of virulence: infection
occurs locally and at a distance. Proceedings of the Royal Society of London B,
266, 1933-1938.
Boots, M. & Sasaki, A. 2000. The evolutionary dynamics of local infection and
global reproduction in host-parasite interactions. Ecology Letters, 3, 181-185.
Boots, M. & Sasaki, A. 2001. Parasite-driven extinction in spatially explicit host-
parasite systems. American Naturalist, 34, 706-713.
Bowers, R. G., Boots, M. & Begon, M. 1994. Life-history trade-offs and the
evolution of pathogen resistance: competition between host strains.
Proceedings of the Royal Society of London B, 257, 247-253.
Bowers, R.G. & White, A. 2002. The adaptive dynamics of Lotka-Volterra systems
with trade-offs. Mathematical Biosciences, 175, 67-81.
Bremermann, H. J. & Pickering, J. 1983. A game-theoretical model of parasite
virulence. Journal of Theoretical Biology, 100, 411-426.
Briese, D. T. 1986. Insect resistance to baculoviruses. Pages 237-265 in R. R.
Granados & B. A. Federici, eds in The Biology of Baculoviruses Volume II,
CRC Press, Florida.
Briggs, C. J., Sait, S. M., Begon, M., Thompson, D. J. & Godfray, H. C. J. 2000.
What causes generation cycles in populations of stored product moths? Journal
160
of Animal Ecology, 69, 352-366.
Brown, J. H. & Kodric-Brown, A. 1977. Turnover rates in insular biogeography:
effects of immigration on extinction. Ecology, 58, 445-449.
Bull, J. J. 1994. Perspective: virulence. Evolution, 48, 1423-1437.
Burand, J. P. & Park, E. J. 1992. Effect of nuclear polyhedrosis virus infection on the
development and pupation of gypsy moth larvae. Journal of Invertebrate
Pathology, 60, 171-175.
Burden, J. P., Griffiths, C. M., Cory, J. S., Smith, P. & Sait, S. M. 2002. Vertical
transmission of sublethal granulosis virus infection in the Indian meal moth,
Plodia interpunctella. Molecular Ecology, 11, 547-555.
Burdon, J. J., Ericson, L. & Müller, W. J. 1995. Temporal and spatial changes in a
metapopulation of the rust pathogen Triphragmium ulmariae and its host,
Filipendula ulmaria. Journal of Ecology, 83, 979-989.
Burdon, J.J. & Jarosz, A. M. 1991. Host-pathogen interactions in natural populations
of Linum marginale and Melampsora lini: I. Patterns of resistance and racial
variation in a large host population. Evolution, 45, 205-217.
Burley, S. K., Miller, A., Harrap, K. A. & Kelly, D. C. 1982. Structure of the
baculovirus nucleocapsid. Virology, 120, 433.
Buttel, L. A., Durrett, R. & Levin, S. A. 2002. Competition and species packing in
patchy environments. Theoretical Population Ecology, 61, 265-276.
Carter, J. B., Green, E. I. & Kirkham, A. J.1983. A Tipula paludosa population with a
high incidence of two pathogens. Journal of Invertebrate Pathology, 42, 312-
318.
Cantrell, S. & Cosner, C. 1993. Should a park be an island? SIAM Journal of Applied
Mathematics, 53, 219-252.

161
Charnov, E. L., Orians, G. H. & Hyatt, K. 1976. Ecological implications of resource
depression. American Naturalist, 110, 247-259.
Chesson, P. L. 1991. A need for niches? Trends in Evolution and Ecology, 6, 26-28.
Chesson, P. L. & Murdoch, W. W. 1986. Aggregation of risk: relationships among
host-parasitoid models. American Naturalist, 127, 696-715.
Chesson, P. L. & Warner, R. W. 1981. Environmental variability promotes
coexistence in lottery competitive systems. American Naturalist, 117, 923-943.
Claessen, D. & de Roos, A. M. 1995. Evolution of virulence in a host-pathogen
system with local pathogen transmission. Oikos, 74, 401-143.
Cliff, A. D., Haggett, P. & Smallman-Raynor, M. 1981. Spatial Diffusion.
Cambridge University Press, Cambridge.
Comins, H. N., Hassell, M. P. & May, R. M. 1992. The spatial dynamics of host-
parasitoid systems. Journal of Animal Ecology, 61, 735-748.
Cooper, D., Cory, J. S. & Myers, J. H. 2003. Hierarchical spatial structure of
genetically variable nucleopolyhedroviruses infecting cyclic populations of
western tend caterpillars. Molecular Ecology, 12, 881-890.
Corbet, S. A. 1971. Mandibular gland secretion of larvae of the flour moth, Anagasta
kuehniella, contains an epideitic pheromone and elicits oviposition movements
in a hymenopteran parasite. Nature, 232, 481-484.
Cox, P. D. & Bell, C. H. 1985. A Review of the Biology of Moth Pests on Stored
Products, Second Edition. Slough Laboratory, England.
Crawford, A. M. & Kalmakoff, J. 1977. A host-virus interaction in a pasture habitat.
Journal of Invertebrate Pathology, 29, 81-87.
Crawley, M. J. 2002. Statistical Computing: An Introduction to Data Analysis using
S-Plus. John Wiley & Sons, Chichester, England.

162
Crozier, G., Crozier, L., Quiot, J. M. & Lereclus, D. 1988. Recombination of
Autographa californica and Rachiplusia ou nuclear polyhedrosis viruses in
Galleria mellonella L. Journal of General Virology, 69, 179-185.
Crozier, G. & Ribeiro, H. C. T. 1992. Recombination as a possible major cause of
genetic heterogeneity in Anticarsia gemmatalis nuclear polyhedrosis virus wild
populations. Virus Research, 26, 183-196.
Davies, C. M., Webster, J. P. & Woolhouse, M. E. J. 2001. Trade-offs in the
evolution of virulence in an indirectly transmitted macroparasite. Proceedings
of The Royal Society of London B, 268, 251-257.
Dieckmann, U., Law, R. & Metz, J. eds. 2000. The Geometry of Ecological
Interactions. Cambridge University Press, Cambridge.
Dobson, A. P. 1988. The population biology of parasite-induced changes in host
behaviour. Quarterly Review of Biology, 63, 139-165.
Doncaster, C. P. 2001. Healthy wrinkles for population dynamics: unevenly spread
resources can support more users. Journal of Animal Ecology, 70, 91-100.
Doncaster, C. P., Clobert, J., Doligez, B. Gustafsson, L. & Danchin, E. 1997.
Balanced dispersal between spatially varying local populations: an alternative
to the source-sink model. American Naturalist, 150, 425-445.
Doroshenko, E. P., Vasil, E. & Kiseleva, A. K. 1996. The virulence of Yersinia pestis
strains in serial-passage in guinea pig peritoneal macrophages. Zhurnal
Mikrobiogii, Epidemiologii I Immunobiologgi, 1, 14-16.
Durrett, R. & Levin, S. A. 1994a. Stochastic spatial models: a user’s guide to
ecological applications. Philosophical Transactions of the Royal Society of
London B, 343, 329-350.
Durrett, R. & Levin, S. A. 1994b. The importance of being discrete and spatial.

163
Theoretical Population Biology, 46, 363-394.
Dwyer, G. 1991. The role of density, stage, and patchiness in the transmission of an
insect virus. Ecology, 72, 559-574.
Dwyer, G. 1992. On the spatial spread of insect pathogens: theory and experiment.
Ecology, 73, 479-494.
Ebert, D. 1994. Virulence and local adaptation of a horizontally transmitted parasite.
Science, 265, 1084-1086.
Ebert, D. & Herre, E. A. 1996. The evolution of parasitic diseases. Parasitology
Today, 12, 96-101.
Ebert, D. & Mangin, K. L. 1997. The influence of host demography on the evolution
of virulence of a microsporidian gut parasite. Evolution , 51, 1828-1837.
Eichelbaum, M., Woolhouse, N. M. 1985. Inter-ethnic difference in sparteine
oxidation among Ghanaians and Germans. European Journal of Clinical
Pharmacology, 28, 79-83.
Ellner, S. P., McCauley, E., Kendall, B. E., Briggs, C. J., Hosseini, P. R., Wood, S.
N., Janssen, A., Sabelis, M. W., Turchin, P., Nisbet, R. M. & Murdoch, W. W.
2001. Habitat structure and population persistence in an experimental
community. Nature, 412, 538-543.
Entwistle, P. F., Adams, P. H. W., Evans, H. F., Rivers, C. F. 1983. Epizootiology of
a nuclear polyhedrosis virus (Baculoviridae) in European spruce sawfly
(Gilpinia hercyniae): spread of disease from small epicentres in comparison to
spread of baculovirus diseases in other hosts. Journal of Applied ecology, 20,
473-487.
Ericson, L., Burdon, J. J. & Müller, W. J. 1999. Spatial and temporal dynamics of
epidemics of the rust fungus Uromyces valerianae on populations of its host
164
Valeriana salina. Journal of Ecology, 87, 649-658.
Ewald, P. W. 1991. Waterborne transmission and the evolution of virulence among
gastrointestinal bacteria. Epidemiology and Infection, 106, 83-119.
Ewald, P. W. 1993. The evolution of virulence. Scientific American, 268, 56-62.
Ewald, P. W. 1994. Evolution of Infectious Disease. Oxford University Press.
Fellowes, M. D. E., Kraaijeveld, A. R. & Godfray, H. C. J. 1999. Cross-resistance
following artificial selection for increased defense against parasitoids in
Drosophila melanogaster. Evolution, 53, 966-972.
Fellowes, M. D. E., Kraaijeveld, A. R. & Godfray, H. C. J. 1998a. Trade-offs
associated with selection for increased ability to resist parasitoid attack in
Drosophila melanogaster. Proceedings of the Royal Society of London Series
B, 265, 1553-1558.
Fellowes, M. D. E., Masnatta, P., Kraaijeveld, A. R. & Godfray, H. C. J. 1998b.
Pupal parasitoid attack influences the relative fitness of Drosophila that have
encapsulated larval parasitoids. Ecological Entomology, 23, 281-284.
Fleming, S. B., Kalmakoff, J., Archibald, R. D., Stewart, K. M. 1986. Density-
dependent virus mortality in populations of Wiseana (Lepidoptera:
Hepialidae). Journal of Invertebrate Pathology, 48, 193-198.
Frank, S. A. 1996. Models of parasite virulence. Quarterly Review of Biology, 71, 31-
78.
French, D. R. & Travis, J. M. J. 2001. Density-dependent dispersal in host-parasitoid
assemblages. Oikos, 95, 125–135.
Fuxa, J. R. & Geaghan, J. P. 1983. Multiple-regression analysis of factors affecting
prevalence of nuclear polyhedrosis virus in Spodoptera frugiperda
(Lepidoptera: Noctuidae). Environmental Entomology, 12, 311-316.

165
Fuxa, J. R. & Richter, A. R. 1989. Reversion of resistance by Spodoptera frugiperda
to nuclear polyhedrosis-virus. Journal of Invertebrate Pathology, 53, 52-56.
Fuxa, J. R. & Richter, A. R. 1998. Repeated reversion of resistance to
nucleopolyhedrovirus by Anticarsia gemmatalis. Journal of Invertebrate
Pathology, 71, 159.
Geritz, S. A. H., Kisdi, E., Meszena, G., & Metz, J. A. J. 1998. Evolutionarily
singular strategies and the adaptive growth and branching of the evolutionary
tree. Evolutionary Ecology, 12, 35-57.
Gill, H. S., Altmann, K., Cross, M. L. & Husband, A. J. 2000. Induction of T helper
1- and T helper 2-type immune responses during Haemonchus contortus
infection in sheep. Immunology, 99, 458-463.
Gillespie, J. P., Kanost, M. R. & Trenczek, T. 1997. Biological mediators of insect
immunity. Annual Review of Entomology, 42, 611-643.
Gilpin, M. & Hanski, I. 1991. Metapopulation Dynamics: Empirical and Theoretical
Investigations. Academics Press, London.
Granados, R. R. 1978. Early events in the infection of Heliothis zea midgut cells by a
baculovirus. Virology, 90, 170.
Granados, R. R. 1980. Infectivity and mode of action of baculoviruses. Biotechnology
and Bioengineering, 22, 1377-1405.
Granados, R. R. & Federici, B. A. eds. 1986. The Biology of Baculoviruses. Volume
1; Biological Properties and Molecular Biology. CRC Press Inc, Boca Raton
Florida.
Graves, P.M. & Curtis, C.F. 1982. Susceptibility of Anopheles gambiae to
Plasmodium yoelii nigeriensis and Plasmodium falciparum. Annals of
Tropical Medicine and Parasitology, 76, 633-639.
166
Green, R. F. 1986. Does Aggregation prevent competitive exclusion? A response to
Atkinson and Shorrocks. American Naturalist, 128, 301-304.
Grencis, R. K. 1997. Th2-mediated host protective immunity to intestinal nematode
infections. Philosophical Transactions of the Royal Society of London B, 352,
1377-1384.
Grenfell, B. T. & Bolker, B. M. 1998. Cities and villages: infection hierarchies in a
measles metapopulation. Ecology Letters, 1, 63-70.
Grenfell, B. & Harwood, J. 1997. Metapopulation dynamics of infectious diseases.
Trends in Ecology and Evolution, 12, 395-399.
Grime, J. P. 1973. Competitive exclusion in herbaceous vegetation. Nature, 242, 344-
347.
Groeters, F. R., Tabashnik, B. E., Finson, N. & Johnson, M. W. 1994. Fitness costs of
resistance to Bacillus thuringiensis in the diamondback moth. Evolution, 48,
197-201.
Grubb, P. J. 1986. Problems posed by sparse and patchily distributed species in
species-rich plant communities. Pages 207-226 in J. Diamond and T. Case, eds.
Community Ecology. Harper & Row, New York.
Gurney, W. S. C & Nisbet, R. M. 1985. Fluctuation periodicity, generation separation
and the expression of larval competition. Theoretical Population Biology, 28,
150-180.
Gurney, W. S. C., Nisbet, R. M. & Lawton, J. H. 1983. The systematic formulation
of tractable single-species population models incorporating age structure.
Journal of Animal Ecology, 52, 479-495.
Haines, C. P. 1981. Insects and arachnids from stored products: A report on
specimens received by the Tropical Stored Products Centre 1973-1977. Report

167
of the Tropical Products Institute, L54, iv+73.
Hamm, J. J. & Paschke, J. D. 1963. On the pathology of a granulosis virus of the
cabbage looper, Trichoplusia ni (Hübner). Journal of Invertebrate Pathology,
5, 187.
Hanski, I. 1989. Metapopulation dynamics: does it help to have more of the same?
Trends in Ecology and Evolution, 4, 113-114.
Hanski, I. 1998. Metapopulation dynamics. Nature, 396, 41-49.
Hanski, I. 1999. Metapopulation Ecology. Oxford University Press, Oxford.
Hanski, I. & Ranta, E. 1983. Coexistence in a patchy environment – three species of
Daphnia in rock pools. Journal of Animal Ecology, 52, 263-279.
Haraguchi, Y. & Sasaki, A. 2000. The evolution of parasite virulence and
transmission rate in a spatially structured population. Journal of Theoretical
Biology, 203, 85-96.
Harrap, K. A. 1972. The structure of the nuclear polyhedrosis viruses I. The inclusion
body. Virology, 50, 114.
Harrison, S. 1989. Long-distance dispersal and colonization in the bay checkerspot
butterfly. Ecology, 70, 1236-1243.
Harrison, S., Murphy, D. D. & Ehrlich, P. R. 1988. Distribution of the bay
checkerspot butterfly, Euphydryas editha bayensis: evidence for a
metapopulation model. American Naturalist, 132, 360-382.
Harrison, S. & Taylor, A. D. 1997. Empirical evidence for metapopulation dynamics.
Pages 27-42 in I. Hanski & M. Gilpin, eds., Metapopulation Biology: Ecology,
Genetics and Evolution. Academic Press, San Diego.
Harrison, S., Thomas, C. & Lewinsohn, T. 1995. Testing a metapopulation model of
coexistence in the insect community of ragwort. American Naturalist, 45, 546-
168
567.
Harvey, J. A., Harvey, I. F. & Thompson, D. J. 1994. Flexible larval growth allows
use of a range of host sizes by a parasitoid wasp. Ecology, 75, 1420-1428.
Hassell, M. P. 1978. The Dynamics of Arthropod Predator-Prey Systems. Princeton
University Press, Princeton.
Hassell, M. P, Comins, H. N. & May, R. M. 1991. Spatial structure and chaos in
insect populations. Nature, 353, 255-258.
Hassell, M. P & May, R. M. 1973. Stability in insect host-parasite models. Journal of
Animal Ecology, 42, 693-726.
Heard, S. B. & Remer, L. C. 1997. Clutch size behaviour and coexistence in
ephemeral-patch competition models. American Naturalist, 150, 744-770.
Heino, M., Kaitala, V., Ranta, E. & Lindstrom, J. 1997. Synchronous dynamics and
rates of extinction in spatially structured populations. Proceedings of the Royal
Society of London B, 264, 481-486.
Herre, E. A. 1993. Population structure and the evolution of virulence in nematode
parasites of fig wasps. Science, 259, 1442-1444.
Hess, G. 1996. Disease in metapopulations models: implications for conservation.
Ecology, 77, 1617-1632.
Hess, R. T. & Falcon, L. A. 1987. Temporal events in the invasion of the codling
moth, Cydia pomonella, by a granulosis virus: An electron microscope study.
Journal of Invertebrate Pathology, 50, 85-105.
Higgins, S. I. & Cain, M. L. 2002. Spatially realistic plant metapopulation models and
the colonisation-competition trade-off. Journal of Animal Ecology, 90, 616-
626.
Hochberg, M. E. 1989. The potential role of pathogens in biological control. Nature,

169
337, 262-265.
Hochberg, M. E. 1991. Viruses as costs to gregarious feeding behaviour in the
lepidoptera. Oikos, 61, 291-296.
Hochberg, M. E., Hassell, M. P. & May, R. M. 1990. The dynamics of host-
parasitoid-pathogen interactions. The American Naturalist, 135, 74-94.
Hochberg, M. E. & Hawkins, B. A. 1992. Refuges as a predictor of parasitoid
diversity. Science, 255, 973-976.
Hodgson, D. J., Vanbergen, A. J., Watt, A. D., Hails, R. S. & Cory, J. S. 2001.
Phenotypic variation between naturally coexisting genotypes of a Lepidopteran
baculovirus. Evolutionary Ecology Research, 3, 687-701.
Holmes, E. E. 1997. Basic epidemiological concepts in a spatial context. Pages 111-
136 in D. Tilman & P. Kareiva eds., Spatial Ecology: The Role of Space in
Population Dynamics and Interspecific Interactions. Princeton University
Press, Chichester, UK.
Holmes, E. E. & Wilson, H. B. 1998. Running from trouble: Long-distance dispersal
and the competitive coexistence of inferior species. American Naturalist,
151, 578-586.
Holt, R. D. 1993. Ecology of the mesoscale: the influence of regional processes on
local communities. Pages 77-88 in R. E. Ricklefs and D. Shluter eds., Species
Diversity in Ecological Communities: Historical and Geographical
Perspectives. University of Chicago Press, Chicago.
Hubbell, S. P. 1979. Tree dispersion, abundance and diversity in a tropical dry forest.
Science, 203, 1299-1309.
Huffaker, C. B. 1958. Experimental studies on predation: dispersion factors and
predator-prey oscillations. Hilgardia, 27, 343-383.

170
Huffaker, C. B., Shea, K. P. & Herman, S. G. 1963. Experimental studies on
predation. Hilgardia, 34, 305-330.
Hughes, K. M. 1972. Fine structure and development of two polyhedrosis viruses.
Journal of Invertebrate Pathology, 19, 198.
Hughes, P. R. & Wood, H. A. 1981. A synchronous peroral technique for the
bioassay of insect viruses. Journal of Invertebrate Pathology, 37, 154-159.
Husband, B. C. & Barrett, S. C. H. 1996. A metapopulation perspective in plant
population biology. Journal of Animal Ecology, 84, 461-469.
Huston, M. 1979. A general hypothesis of species diversity. American Naturalist,
113, 81-101.
Hutchinson, G. E. 1961. The paradox of the plankton. American Naturalist, 95,
137-147.
Ims, R. A., Leinaas, H. P & Coulson, S. 2004. Spatial and temporal variation in
patch occupancy and population density in a model system of an arctic
Collembola species assemblage. Oikos, 105, 89-100.
Ives, A. R. 1988. Covariance, coexistence and the population dynamics of two
competitors using a patchy resource. Journal of Theoretical Biology, 133, 345-
361.
Jackson, P. R., Tucker, G. T. & Woods, H. F. 1989. Testing for bimodality in
frequency distributions of data suggesting polymorphisms of drug metabolism
- histograms and probit plots. British Journal of Clinical Pharmacology, 28,
647-653.
Janssen, V. A. A. & Sabelis, M. W. 1992. Prey dispersal and predator persistence.
Experimental and Applied Acarology, 14, 215-231.
Janssen, A., van Gool, E., Lingeman, R., Jacas, J. & van de Klashorst, G. 1997.

171
Metapopulation dynamics of a persisting predator-prey system in the
laboratory: time-series analysis. Experimental and Applied Acarology, 21, 415-
430.
John, D. T. & John, R. A. 1994. Enhancement of virulence of Naegleria fowleri by
growth in Vero-cell culture. Journal of Parasitology, 80, 149-151.
Johnson, J. A., Wofford, P. L. & Whitehand, L. C. 1992. Effect of diet and
temperature on development rates, survival and reproduction of the Indianmeal
moth (Lepidoptera: Pyralidae). Journal of Economic Entomology, 85, 561-566.
Jones, A. E., Gurney, W. S. C., Nisbet, R. M. & Gordon, D. M. 1990. Food
degradation as a mechanism of intraspecific competition among the larvae of
secondary stored-product pests. Functional Ecology, 4, 629-638.
Jones, T. H. & Hassell, M. P. 1988. Patterns of parasitism by Trybliographa rapae, a
cynipid parasitoid of the cabbage root fly, under laboratory and field
conditions. Ecological Entomology, 13, 309-317.
Kareiva, P. 1990. Population dynamics in spatially complex environments: theory and
data. Philosophical Transactions of the Royal Society of London B, 330, 175-
190.
Keddie, A. B., Aponte, G. W. & Volkman, L. E. 1989. The pathway of infection of
Autographa californica nuclear polyhedrosis virus in an insect host. Science,
243, 1728-1730.
Keeling, M. J. 1997. Modelling the persistence of measles. Trends in Microbiology,
5, 513-518.
Keeling, M. J. 1999a. Spatial models of interacting populations. Pages 64-99 in J.
McGlade ed. Advanced Ecological Theory. Blackwell Science, Oxford.
Keeling, M. J. 1999b. The effects of local spatial structure on epidemiological

172
invasions. Proceedings of the Royal Society of London B, 266, 859-867.
Keeling, M. J. 2000a. Metapopulation moments: coupling, stochasticity and
persistence. Journal of Animal Ecology, 69, 725-736.
Keeling, M. J. 2000b. Evolutionary trade-offs at two time-scales: competition versus
persistence. Proceedings of the Royal Society of London B, 267, 385-391.
Keeling, M. J. 2000c. Evolutionary dynamics in spatial host-parasite systems. Pages
271-291 in U. Dieckmann, R. law & J. A. J. Metz. eds., The Geometry of
Ecological Interactions. Cambridge University Press, Cambridge.
Keeling, M. J. & Rohani, P. 2002. Estimating spatial coupling in epidemiological
systems: a mechanistic approach. Ecology Letters, 5, 20-29.
Kelly, D. C., Brown, D. A., Ayres, M. D., Allen, C. J. & Walker, I. O. 1983.
Properties of a major nucleocapsid protein of Heliothis zea singly enveloped
nuclear polyhedrosis virus. Journal of General Virology, 64, 399.
Kermack, W. O. & McKendrick, A. G. 1927. A contribution to the mathematical
theory of epidemics. Proceedings of the Royal Society of London A, 115, 700-
721.
Knell, R. J. 1998. Generation cycles. Trends in Ecology and Evolution, 13, 186-190.
Knell, R. J., Begon, M. & Thompson, D. J. 1996. Transmission dynamics of Bacillus
thuringiensis infecting Plodia interpunctella: a test of the mass action
assumption with an insect pathogen. Proceedings of the Royal Society of
London B, 263, 75-81.
Knell, R. J., Begon, M. & Thompson, D. J. 1998a. Host-pathogen population
dynamics, basic reproductive rates and threshold densities. Oikos, 81, 299-308.
Knell, R. J., Begon, M. & Thompson, D. J. 1998b. Transmission of Plodia
interpunctella granulosis virus does not conform to the mass action model.

173
Journal of Animal Ecology, 67, 592-599.
Kraaijeveld, A. R. & Godfray, H. C. J. 1997. Trade-off between parasitoid resistance
and larval competitive ability in Drosophila melanogaster. Nature, 389, 278-
280.
Kukan, B. 1999. Vertical transmission of nucleopolyhedrosis virus in insects. Journal
of Invertebrate Pathology, 74, 103-111.
Kuussaari, M., Nieminen, M. & Hanski, I. 1996. An experimental study of migration
in the Glanville Fritillary butterfly. Journal of Animal Ecology, 65, 791-801.
Kuwahara, Y., Kitamura, C., Takahashi, S., Hara, H., Ishii, S. & Fukami, H. 1971.
Sex pheromone of the almond moth and the Indian meal moth: cis-9, Trans-12-
tetradecadienyl acetate. Science, 171, 801-802.
Lanciani, C. A. 1975. Parasite-induced alterations in host reproduction and survival.
Ecology, 56, 689-695.
Lehman, C. L. & Tilman, D. 1997. Competition in spatial environments. Pages 185-
203 in D. Tilman & P. Kareiva, eds. Spatial Ecology: The Role of Space in
Population Dynamics and Interspecific Interactions. Princeton University
Press, Princeton, NJ.
Lenski, R. E. 1988. Experimental studies of pleiotropy and epistasis in Escherichia
coli. I. Variation in competitive fitness among mutants resistant to virus T4.
Evolution, 42, 425-432.
Levin, B. R. 1996. The evolution and maintenance of virulence in microparasites.
Emerging Infectious Diseases, 2, 93-102.
Levin, S. & Pimental, D. 1981. Selection of intermediate rates of increase in parasite-
host systems. American Naturalist, 117, 308-315.
Levins, R. 1969. Some demographic and genetic consequences of environmental

174
heterogeneity for biological control. Bulletin of the Entomological Society of
America, 15, 237-240.
Levins, R. 1970. Extinction. Lecture Notes in Mathematics, 2, 75-107.
Levins, R. 1979. Coexistence in a variable environment. American Naturalist,
114, 765-783.
Longworth, J. F. & Cunningham, J. C. 1968. The activation of occult nuclear
polyhedrosis virus by foreign nuclear polyhedra. Journal of Invertebrate
Pathology, 10, 361-367.
Lum, P. T. M. & Flaherty, B. R. 1969. Effect of mating with males reared in
continuous light or in light-dark cycles on fecundity in Plodia interpunctella.
Journal of Stored Product Research, 5, 80-94.
Lum, P. T. M. & Flaherty, B. R. 1970. Effects of continuous light on the potency of
Plodia interpunctella males. Annual Entomological Society of America, 63,
1470-1471.
Lynch, L. D., Bowers, R. G., Begon, M. & Thompson, D. J. 1998. A dynamic refuge
model and population regulation by insect parasitoids. Journal of Animal
Ecology, 67, 270-279.
MacArthur, R. H. & Levins, R. 1964. Competition, habitat selection and character
displacements in a patchy environment. Proceedings of the National Academy
of Sciences USA, 51, 1207-1210.
MacArthur, R. H. & Wilson, E. O. 1967. The Theory of Island Biogeography.
Princeton University Press, Princeton.
Manthavan, S. Sudha, P. M. & Pechimuthu, S. M. 1989. Effect of Bacillus
thuringiensis on the midgut cells of Bombyx mori larvae: a histopathological
and histochemical study. Journal of Invertebrate Pathology, 53, 217-227.

175
Martin, D. W. & Weber, P. C. 1997. DNA replication promotes high frequency
homologous recombination during Autographa californica multiple nuclear
polyhedrosis virus infection. Virology, 232, 300-309.
May, R. M. & Anderson, R. M. 1979. Population biology of infectious diseases: Part
II. Nature, 280, 455-461.
May, R. M. & Anderson, R. M. 1983. Epidemiology and the genetics in the
coevolution of parasites and hosts. Proceedings of the Royal Society of London
B, 219, 281-313.
May, R. M. & Anderson, R. M. 1984. Spatial heterogeneity and the design of
immunization programmes. Mathematical Biosciences, 72, 83-111.
May, R. M. & Hassell, M. P. 1988. Population dynamics and biological control.
Philosophical Transactions of the Royal Society of London B, 318, 129-169.
Mbata, G. N. 1990. Studies on the intraspecific larval interaction in a laboratory
culture of Plodia interpunctella (Hübner) (Lepidoptera: Pyralidae) on two food
media. Insect Science Applications, 11, 245-251.
McCallum, H. & Dobson, A. 1995. Detecting disease and parasite threats to
endangered species and ecosystems. Trends in Ecology and Evolution, 10, 190-
194.
McCauley, E., Kendall, B. E., Janssen, A., Wood, S. N., Murdoch, W. W., Hosseini,
P. R., Briggs, C. J., Hosseini, P. R., Ellner, S. P., Nisbet, R. M., Sabelis, M. W.
& Turchin, P. 2000. Inferring colonization processes from population dynamics
in spatially structured predator-prey systems. Ecology, 81, 3350-3361.
McLaughlin, J. R. 1982. Behavioural effect of a sex pheromone extracted from
forewings of male Plodia interpunctella. Environmental Entomology, 11, 378-
380.

176
McNair, J. N. 1986. The effects of refuges on predator-prey interactions: a
reconsideration. Theoretical Population Biology, 29, 38-63.
McNair, J. N. 1987. Stabilizing effects of a prey refuge with entry-exit dynamics.
Journal of Theoretical Biology, 125, 449-464.
Menéndez, R. & Thomas, C. D. 2000. Metapopulation structure depends on spatial
scale in the host-specific moth Wheeleria spilodactylus (Lepidoptera:
Pterophoridae). Journal of Animal Ecology, 69, 935-951.
Messenger, S. L., Molineux, I. J. & Bull, J. J. 1998. Virulence evolution in a virus
obeys a trade-off. Proceedings of the Royal Society of London B, 266, 397-404.
Metz, J. A. J., Dieckmann, U. & Law, R. 2000. Epilogue. Pages 513-516 in U.
Dieckmann, R. Law & J. Metz eds. The Geometry of Ecological Interactions.
Cambridge University Press, Cambridge.
Milks, M. L. 1997a. Ingestion time does not influence the susceptibility of
Trichoplusia ni to a nuclear polyhedrosis virus. Journal of Invertebrate
Pathology, 70, 165-166.
Milks, M. L. 1997b. Comparative biology and susceptibility of cabbage looper
(Lepidoptera: Noctuidae) lines to a nuclear polyhedrosis virus. Environmental
Entomology, 26, 839-848.
Moldenke, A. F., Berry, R. E., Miller, J. C., Wernz, J. G. & Li, X.-H. 1994. Toxicity
of Bacillus thuringiensis subsp. Kurstaki to Gypsy moth Lymantria dispar, fed
with Alder or Douglas fir. Journal of Invertebrate Pathology, 64, 143-145.
Mollison, D. 1977. Spatial contact models for ecological and epidemic spread.
Journal of the Royal Statistical Society, B39, 283-326.
Molofsky, J., Durrett, R., Dushoff, J., Griffeath, D. & Levin, S. 1999. Local
frequency dependence and global coexistence. Theoretical Population Ecology,

177
55, 270-282.
Moscardi, F. 1999. Assessment of the application of baculoviruses for control of
Lepidoptera. Annual Review of Entomology, 44, 257-289.
Mouquet, N., Moore, J. L. & Loreau, M. 2002. Plant species richness and community
productivity: why the mechanism that promotes coexistence matters. Ecology
Letters, 5, 56-65.
Mundt, C. C., Leonard, K. J., Thal, W. M. & Fulton, J. H. 1986. Computerized
simulation of crown rust epidemics in mixtures of immune and susceptible oat
plants with different genotypes unit areas and spatial distributions of initial
disease. Phytopathology, 76, 590-598.
Murdoch, W. W., Luck, R. F., Walde, S. J., Reeve, J. D. & Yu, S. 1989. A refuge for
red scale under control by Aphytis: structural aspects. Ecology, 70, 1707-1714.
Murray, J. D. 1989. Mathematical Biology. Springer-Verlag, Heidelberg.
Murray, J. D., Stanley, E. A. & Brown, D. L. 1986. On the spatial spread of rabies
among foxes. Proceedings of the Royal Society of London B, 229, 111-150.
Murrell, D. J. & Law, R. 2003. Heteromyopia and the spatial coexistence of similar
competitors. Ecology Letters, 6, 48-59.
Murrell, D. J., Purves, D. W. & Law, R. 2001. Uniting pattern and process in plant
ecology. Trends in Ecology and Evolution, 16, 529-530.
Nachman, G. 2000. Effect of demographic parameters on metapopulation size and
persistence: an analytical stochastic model. Oikos, 91, 51-65.
Nagata, M. & Tanada, Y. 1983. Origin of an alkaline protease associated with the
capsule of a granulosis virus of the armyworm, Pseudaletia unipuncta
(Haworth). Archive of Virology, 76, 245.
Nakamura, K., Goto, F., Ray, W. A., Mcallister, C. B., Jacoz, E., Wilkinson G. R.,

178
Branch, R. A. 1985. Interethnic differences in genetic polymorphism of
debrisoquin and mephenytoin hydroxylation between Japanese and Caucasian
populations. Clinical Pharmacology & Therapeutics, 38, 402-408.
Nappi, A. J., Vass, E., Frey, F., Carton, Y. 1995. Superoxide anion generation in
Drosophila during melanotic of parasites. European Journal of Cell Biology,
68, 450-456.
Neuhauser, C. 2002. Effects of local interactions and local migration on stability.
Theoretical Population Ecology, 62, 297-308.
Neuhauser, C. & Pacala, S. W. 1999. An explicitly spatial version of the Lotka-
Volterra model with interspecific competition. Annual Applied Probability, 9,
1226-1259.
Nicholson, A. J. & Bailey, V. A. 1935.The balance of animal populations. I.
Proceedings of the Zoological Society of London, 3, 551-598.
Norris, R. F., Elmore, C. L., Rejmánek, M. & Akey, W. C. 2001. Spatial
arrangement, density and competition between barnyard grass and tomato: I.
Crop growth and yield. Weed Science, 4, 61-68.
Nowak, M. A. & May, R. M. 1994. Superinfection and the evolution of parasite
virulence. Proceedings of the Royal Society of London B, 255, 81-89.
O’Reilly, D. R. & Miller, L. K. 1989. A baculovirus blocks insect moulting by
producing ecdysteroid UDP-glucosyltransferase. Science, 245, 1110-1112.
Okubo, A. 1980. Diffusion Ecological Problems: Mathematical Models. Lecture
Notes in Biomathematics 10. Springer-Verlag, Heidelberg.
Okubo, A., Maini, P. K., Williamson, M. H. & Murray, J. D. 1989. On the spatial
spread of the grey squirrel in Britain. Proceedings of the Royal Society of
London B, 238, 113-125.

179
Onstad, D. W. & Maddox, J. V. 1989. Modelling the effects of the microsporidian,
Nosema pyrausta, on the population dynamics of the insect Ostrinia nubilalis.
Journal of Invertebrate Pathology, 53, 410-421.
Pacala, S. W. 1986. Neighbourhood models of plant population dynamics. 2. Multi-
species models of annuals. Theoretical Population Ecology, 29, 262-292.
Pacala, S. W. & Levin, S. A. 1997. Biologically generated spatial pattern and the
coexistence of competing species. Pages 204-232 in D. Tilman & P. Kareiva,
eds. Spatial Ecology: The Role of Space in Population Dynamics and
Interspecific Interactions. Princeton University Press, Princeton, NJ.
Pacala, S. W. & Roughgarden, J. 1982. Spatial heterogeneity and interspecific
competition. Theoretical Population Ecology, 21, 92-113.
Pels, B. & Sabelis, M. W. 1999. Local dynamics, overexploitation and predator
dispersal in an acarine predator-prey system. Oikos, 86, 573-583.
Penno, M. B. & Vesell, E. S. 1983. Monogenic control of variations in antipyrine
metabolite formation – new polymorphism of hepatic drug oxidation. Journal
of Clinical Investigations, 71, 1698-1709.
Plaistow, S. J., Lapsley, C. T., Beckerman, A. P. & Benton, T. G. Age and size at
maturity: sex, environmental variability and development thresholds.
Proceedings of the Royal Society of London B, 271, 919-924.
Podoler, H. 1974. Effects of intraspecific competition in the Indian meal moth
(Plodia interpunctella Hübner) (Lepidoptera: Phycitidae) on populations of the
moth and its parasite Nemeritis canescens (Gravenhorst) (Hymenoptera :
Ichneumonidae). Journal of Animal Ecology, 43, 641-651.
Polis, G. 1981. The evolution and dynamics of intraspecific predation. Annual
Review of Ecology and Systematics, 12, 225-251.
180
Pulliam, H. R. 1988. Sources, sinks and population regulation. American Naturalist,
132, 652-661.
Quinn, J. F. & Hastings, A. 1987. Extinction in subdivided habitats. Conservation
Biology, 1, 198-208.
Rand, D. A., Keeling, M. & Wilson, H. B. 1995. Invasion, stability and evolution to
criticality in spatially extended, artificial host-pathogen ecology. Proceedings
of the Royal Society of London B, 259, 55-63.
Ratcliffe, N. A., Leonard, C. & Rowley, A. F. 1984. Prophenoloxidase activation:
nonself recognition and cell cooperation in insect immunity. Science, 226, 557-
559.
Raynor, M. S. & Cliff, A. D. 1999. The spatial dynamics of epidemic diseases in war
and peace: Cuba and the insurrection against Spain, 1895-1898. Transactions of
the Royal Institute of British geography, 24, 331-352.
Reed, D. J., Begon, M. & Thompson, D. J. 1996. Differential cannibalism and
population dynamics in a host-parasitoid system. Oecologia, 105, 189-193.
Rejmánek, M. 2002. Intraspecific aggregation and species coexistence. Trends in
Ecology and Evolution, 17, 200-210.
Rejmánek, M., Bossard, C. C. & Robinson, G. 1992. The role of plant aggregation in
interspecific competition. Bulletin of the Ecological Society of America, 73,
319.
Renshaw, E. 1991. Modelling Biological Populations in Space and Time. Cambridge
University Press, Cambridge.
Reznick, D. 1985. Costs of reproduction - an evaluation of the empirical-evidence.
Oikos, 44, 257-267.
Richards, E. H. & Edwards, J. P. 2000. Parasitism of Lacanobia oleracea

181
(Lepidoptera) by the ectoparasitoid, Eulophus pennicornis, is associated with a
reduction in host haemolymph phenoloxidase activity. Comparative
Biochemistry and Physiology B-Biochemistry & Molecular Biology. 127, 289-
298.
Richter, A. J., Fuxa, J. R. & Abdel-Fattah, M. 1987. Effect of host plant on the
susceptibility of Spodoptera frugiperda (Lepidoptera : Noctuidae) to a nuclear
polyhedrosis virus. Environmental Entomology, 16, 1004-1006.
Rodcharoen, J. & Mulla, M. S. 1995. Comparative ingestion rates of Culex
quinquefasciatus (Diptera: Culicidae) susceptible and resistant to Bacillus
sphaericus. Journal of Invertebrate Pathology, 66, 242-248.
Roff, D. A. 2002. Life History Evolution. Sinauer Associates, Sunderland.
Roslin, T. 2000. Dung beetle movements at two spatial scales. Oikos, 91, 323-335.
Rothman, L. D. & Myers, J. H. 1996. Debilitating effects of viral disease on host
Lepidoptera. Journal of Invertebrate Pathology, 67, 1-10.
Russo, J., Dupas, S., Frey, F., Carton, Y. & Brehelin, M. 1996. Insect immunity:
early events in the encapsulation process of parasitoid (Leptopilina boulardi)
eggs in resistant and susceptible strains of Drosophila. Parasitology, 112, 135-
142.
Sait, S. M., Begon, M. & Thompson, D. J. 1994a. The effects of a sublethal
baculovirus infection in the Indian meal moth, Plodia interpunctella. Journal of
Animal Ecology, 63, 541-550.
Sait, S. M., Begon, M. & Thompson, D. J. 1994b. Long-term population dynamics of
the Indian meal moth Plodia interpunctella and its granulosis virus. Journal of
Animal Ecology, 63, 861-870.
Sait, S. M., Begon, M. & Thompson, D. J. 1994c. The influence of larval age on the

182
response of Plodia interpunctella to a granulosis virus. Journal of Invertebrate
Pathology, 63, 107-110.
Sait, S. M., Begon, M., Thompson, D. J. & Harvey, J. A. 1996. Parasitism of
baculovirus-infected Plodia interpunctella by Venturia canescens and
subsequent virus transmission. Functional Ecology, 10, 586-591.
Sasaki, A. 2000. Host-parasite coevolution in a multilocus gene-for-gene system.
Proceedings of the Royal Society of London B, 267, 2183-2188.
Sato, K., Matsuda, H. & Sasaki, A. 1994. Pathogen invasion and host extinction in
lattice structured populations. Journal of Mathematical Biology, 32, 251-268.
Schrag, S. J. & Mittler, J. E. 1996. Host-parasite coexistence: the role of spatial
refuges in stabilizing bacteria-phage interactions. American Naturalist, 148,
348-377.
Shapiro, D. I., Fuxa, J. R., Braymer, H. D., & Pashley, D. P. 1991. DNA restriction
polymorphism in wild isolates of Spodoptera frugiperda nuclearpolyhedrosis
virus. Journal of Invertebrate Pathology, 58, 96–105.
Shorrocks, B. 1991. Competition on a divided and ephemeral resource; a cage
experiment. Biological Journal of the Linnean Society, 43, 211-220.
Silhacek, D. L. & Oberlander, H. 1975. Time-dosage studies of juvenile hormone
action on the development of Plodia interpunctella (Hübner). Journal of Insect
Physiology, 21, 153-161.
Sjögren, P. 1991. Extinction and isolation gradients in metapopulations: the case of
the pool frog (Rana lessonae). Biological Journal of the Linnean Society, 42,
135-147.
Skellem, J. G. 1951. Random dispersal in theoretical populations. Biometrika, 38,
196-218.

183
Slepneva, I. A., Glupov V. V., Sergeeva, S. V. & Khramtsov, V. V. 1999. EPR
detection of reactive oxygen species in hemolymph of Galleria mellonella and
Dendrolimus superans sibiricus (Lepidoptera) larvae. Biochemical and
Biophysical Research Communications, 264, 212-215.
Smith, I. R. L. & Crook, N. E. 1988. In vivo isolation of baculovirus genotypes.
Virology, 166, 240-244.
Smith, G. E., Summers, M. 1978. Analysis of baculovirus genomes with restriction
endonucleases. Virology, 89, 517–527.
Soderstrom, E. L., Hinsch, R. T., Bongers, A. J., Brandl, D. G. & Hoogendorn, H.
1987. Detecting adult Phycitinae (Lepidoptera: Pyralidae) infestations in a
raison-marketing channel. Journal of Economic Entomology, 80, 1229-1232.
Solé, R. V., Bascompte, J. & Valls, J. 1992. Nonequilibrium dynamics in lattice
ecosystems: chaotic stability and dissipative structures. Chaos, 2, 387-395.
Somboon, P. & Takagi, M. 1999. A non-lethal, autosomal, recessive, melanotic
mutant of Anopheles minimus species A. Annals of Tropical Medicine and
Parasitology, 93, 767-771.
Sorci, G., Møller, A. P. & Boulinier, T. 1997. Genetics of host-parasite interactions.
Trends in Ecology and Evolution, 12, 196-200.
Stearns, S. C. 1989. Trade-offs in life history evolution. Functional Ecology, 3, 259-
268.
Stearns, S. C. 1992. The Evolution of Life-Histories. Oxford University Press, Oxford.
Steinberg, E. K. & Kareiva, P. 1997. Challenges and opportunities for empirical
evaluation of “spatial theory”. Pages 318-332 in D. Tilman & P. Kareiva, eds.
Spatial Ecology: The Role of Space in Population Dynamics and Interspecific
Interactions. Princeton University Press, Princeton, NJ.

184
Steinhaus, E. A. 1958. Stress as a factor in insect disease. Proceedings of the 10th
International Congress of Entomology, Montreal, 1956. 725-730.
Stevens, M. G., Olsen, S. C., Pugh, G. W. & Mayfield, J. E. 1997. Role of immune
responses to a groel heat shock protein in preventing brucellosis in mice
vaccinated with Brucella abortus strain RB51. Comparative Immunology
Microbiology and Infectious Diseases, 20, 147-153.
Stiles, B. & Paschke, J. D. 1980. Midgut pH in different instars of three Aedes
mosquito species and the relationship between pH and susceptibility of larvae
to a nuclear polyhedrosis virus. Journal of Invertebrate Pathology, 35, 58.
Stoll, P. & Prati, D. 2001. Intraspecific aggregation alters competitive interactions in
experimental plant communities. Ecology, 82, 319-327.
Summers, M. D. 1971. Electron microscopic observations on granulosis virus entry,
uncoating, and replication process during infection of the midgut cells of
Trichoplusia ni. Journal of Ultrastructure Research, 35, 606.
Summers, M. D. & Smith, G. E. 1975. Trichoplusia ni granulosis granulin: a phenol
soluble, phosphorylated protein. Journal of Virology, 16, 1108.
Thomas, C. D. & Harrison, S. 1992. Spatial dynamics of a patchily distributed
butterfly species. Journal of Animal Ecology, 61, 437-446.
Thomas, C. D. & Kunin, W. E. 1999. The spatial structure of populations. Journal of
Animal Ecology, 68, 647-657.
Thrall, P. H. & Antonovics, J. 1995. Theoretical and empirical studies of
metapopulations: population and genetic dynamics of the Silene-Ustilago host-
pathogen system. Canadian Journal of Botany, 73, 1249-1258.
Tilman, D. 1994. Competition and biodiversity in spatially structured habitats.
Ecology, 75, 2-16.

185
Tilman, D. 1996. Biodiversity: population versus ecosystem stability. Ecology, 77,
350-363.
Tilman, D., Lehman, C. L. & Kareiva, P. 1997. Population dynamics in spatial
habitats. Pages 3-20 in D. Tilman and P. Kareiva, eds. Spatial Ecology: The
Role of Space in Population Dynamics and Interspecific Interactions.
Tilman, D. & Kareiva, P. eds. 1997. Spatial Ecology: The Role of Space in
Population Dynamics and Interspecific Interactions. Princeton
University Press, Princeton.
Tinsley, R. C. & Jackson, H. C. 1986. Intestinal migration in the life-cycle of
Pseudodiplorchis americanus (Monogenea). Parasitology, 93, 451-469.
Toothaker, L. E. 1993. Multiple Comparison Procedures. Sage Publications, London.
Tsuji, H. 1959. Studies on the diapause of the Indian meal moth, Plodia
interpunctella (Hübner) II. The effect of population density on the induction of
diapause. Japanese Journal of Applied Entomology and Zoology, 3, 34-40.
Turchin, P. 1998. Quantitative analysis of movement: measuring and modelling
population redistribution in animals and plants. Sinauer Associates:
Sunderland, Massachusetts, USA.
Turchin, P. 2003. Phenomenological time-series analysis. Pages 173-196 in Complex
Population Dynamics. Princeton University Press, Woodstock, Oxfordshire.
Tweenten, K. A., Bulla, L. A. & Consigli, R. A. 1981. Applied and molecular aspects
of insect granulosis viruses. Microbiological Reviews, 45, 379-408.
Vail, P. V. & Tebbets, J. S. 1990. Comparative biology and susceptibility of Plodia
interpunctella (Lepidoptera: Pyralidae) populations to a granulosis virus.
Environmental Entomology, 19, 791-794.
van Baalen, M. & Sabelis, M. W. 1995. The dynamics of multiple infection and the

186
evolution of virulence. American Naturalist, 146, 881-910.
Van den Bosch, F. J., Metz, A. J. & Diekmann, O. 1990. The velocity of spatial
population expansion. Journal of Mathematical Biology, 28, 529-566.
van Rie, J., McGaughey, W. H., Johnson, D. E., Barnett, B. D. & van Mellaert, H.
1990. Mechanism of insect resistance to the microbial Bacillus thuringiensis.
Science, 247, 72-74.
Vessel, E. S. & Gaylor, D. W. 1995. Limitations of probit plots in
pharmacogenetics: requirement of genetic analyses to test hypotheses based on
graphical methods. Pharmacogenetics, 5, 18-23.
Vicks, K. W., Coffelt, J. A. & Weaver, W. A. 1987. Presence of four species of
stored-product moths in storage and field situations in north-central Florida as
determined with sex pheromone baited traps. Florida Entomologist, 70, 488-
492.
Volterra, V. 1928. Variations and fluctuations of the number of individuals in animal
species living together. Journal du Conseil, Conseil International pour
l’Exploration de la Mer, 3, 3-51.
Walker, S., Kawanishi, C. Y. & Hamm, J. J. 1982. Cellular pathology of a
granulosis virus. Journal of Ultrastructure Research, 80, 163.
Wallinga, J., Edmunds, W. J. & Kretzschmar, M. 1999. Perspective: human contact
patterns and the spread of airborne infectious disease. Trends in Microbiology,
7, 372-377.
Washburn, J. O., Kirkpatrick, B. A., Haas-Stapleton, E. & Volkman, L. E. 1998.
Evidence that the stilbene-derived optical brightener M2R enhances
Autographa californica M Nucleopolyhedrovirus infection of Trichoplusia ni
and Heliothis virescens by preventing sloughing of infected midgut epithelial

187
cells. Biological Control, 11, 58-69.
Washburn, J. O., Kirkpatrick, B. A. & Volkman, L. E. 1996. Insect protection against
viruses. Nature, 383, 767.
Webster, J. P. & Woolhouse, M. E. J. 1999. Cost of resistance: relationship between
reduced fertility and increased resistance in a snail-schistosome host-parasite
system. Proceedings of the Royal Society of London B, 266, 391-396.
Weiner, J. & Conte, P. T. 1981. Dispersal and neighbourhood effects in a annual plant
competition model. Ecological Modelling, 13, 131-147.
Whitlock, V. H. 1977. Effect of larval maturation on mortality induced by a nuclear
polyhedrosis and granulosis virus infections of Heliothis armigera. Journal of
Invertebrate Pathology, 30, 80.
Williamson, M. 1981. Island Populations. Oxford University Press, Oxford.
Woods, S. A. & Elkinton, J. S. 1987. Bimodal patterns of mortality from nuclear
polyhedrosis virus in gypsy moth (Lymantria dispar) populations. Journal of
Invertebrate Pathology, 50, 151-157.
Yan G., Severson D.W. & Christensen B.M. 1997. Costs and benefits of mosquito
refractoriness to malaria parasites: Implications for genetic variability of
mosquitoes and genetic control of malaria. Evolution, 51, 441-450.
Zemek, R. & Nachman, G. 1998. Interactions in tri-trophic acarine predator-prey
metapopulation system: effects of Tetranychus urticae on the dispersal rates of
Phytoseiulus persimilis. Experimental and Applied Acarology, 22, 259-278.

188