spatial interpolation of daily temperatures using an advection scheme kwang soo kim
TRANSCRIPT

Spatial interpolation of Daily temperatures using an advection scheme
Kwang Soo Kim

Outline
Introduction Weather data Spatial interpolation
Natural neighbor Pseudo Advection Scheme
Results Conclusions

Introduction
Disease warning systems depend on weather data
Site-specific weather estimates can be used as inputs to disease warning systems
Site-specific estimates have been obtained using spatial interpolation

Sites of Interest
Soil Climate Analysis Network (SCAN) of National Resources Conservation Service (NRCS) Distributed over the USA. Represent various climate conditions. 53 % of SCAN stations were established
after 2002. 64 sites were included as validation
sites
Neighbor stations
The US National Climate Data Center (NCDC) Global Surface Summary of the Day (GSOD) database Daily temperatures and precipitation Long term weather records are
available Free access to the public

Site distribution
• On average, about 1600 neighbor stations were used for spatial interpolation

Spatial interpolation products DAYMET
Daily estimates of weather variables Truncated Gaussian filter From 1980 to 2003
PRISM Monthly estimates of weather variables Various covariate variables are used
Both products are based on National Weather Service (NWS) Cooperative Observers Network stations

Voronoi tessellation

Delaunay triangulation

Natural Neighbors
Watson, 1999

Conventional VS Natural neighbor interpolation
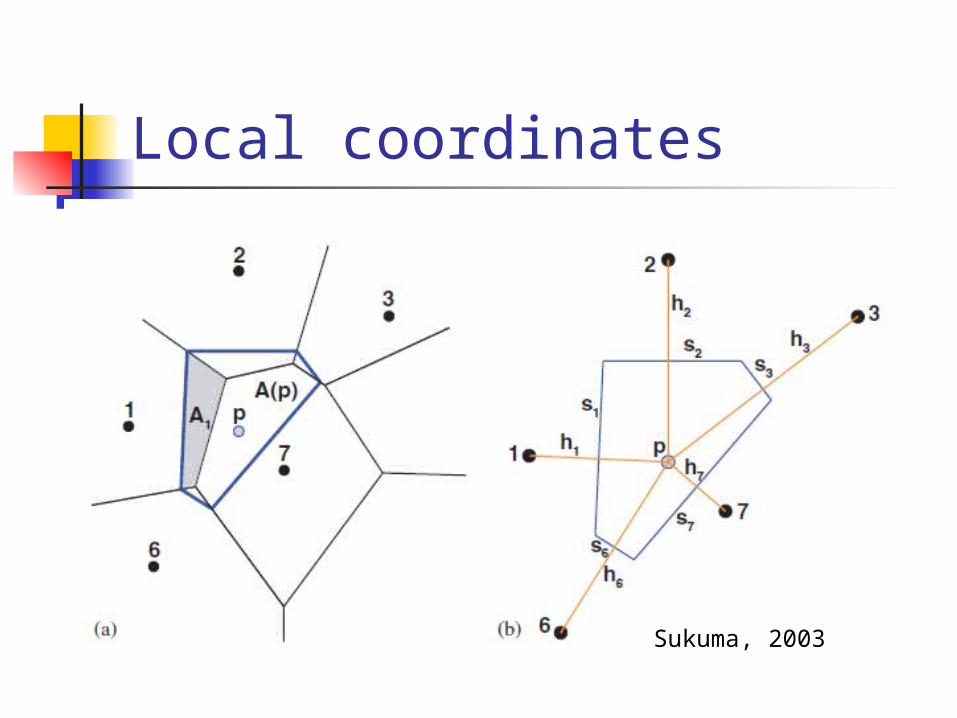
Local coordinates
Sukuma, 2003

Pseudo Advection Scheme
Natural neighbor interpolation can be used to solve the partial differential equation (Sukuma, 2003).
Advection scheme can be used for spatial interpolation ∂/∂t + u· = 0
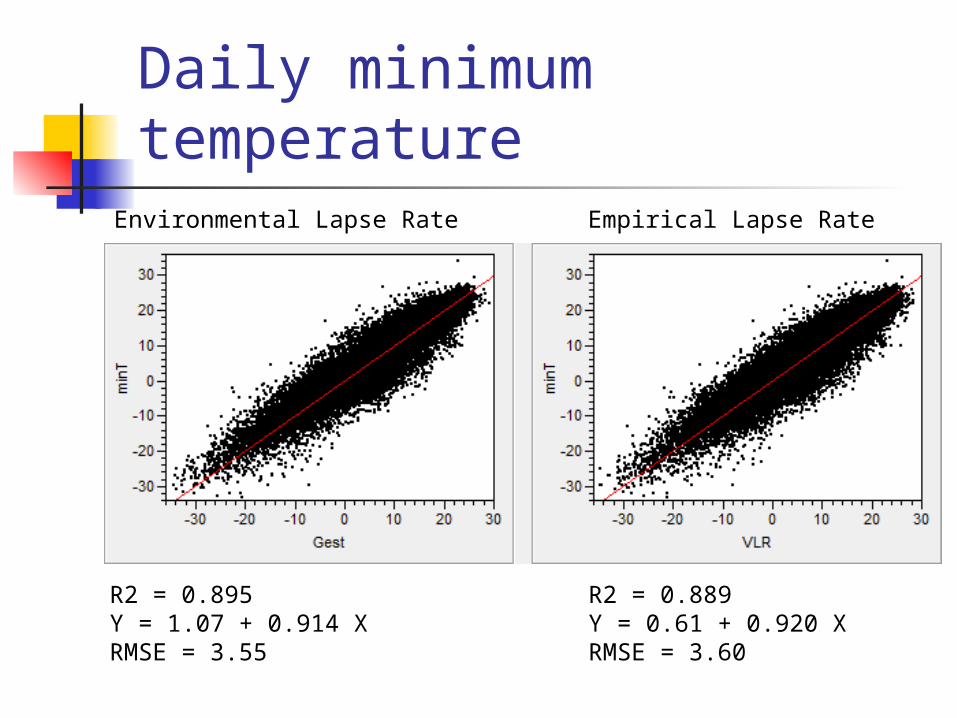
Daily minimum temperatureEnvironmental Lapse Rate Empirical Lapse Rate
R2 = 0.895Y = 1.07 + 0.914 XRMSE = 3.55
R2 = 0.889Y = 0.61 + 0.920 XRMSE = 3.60
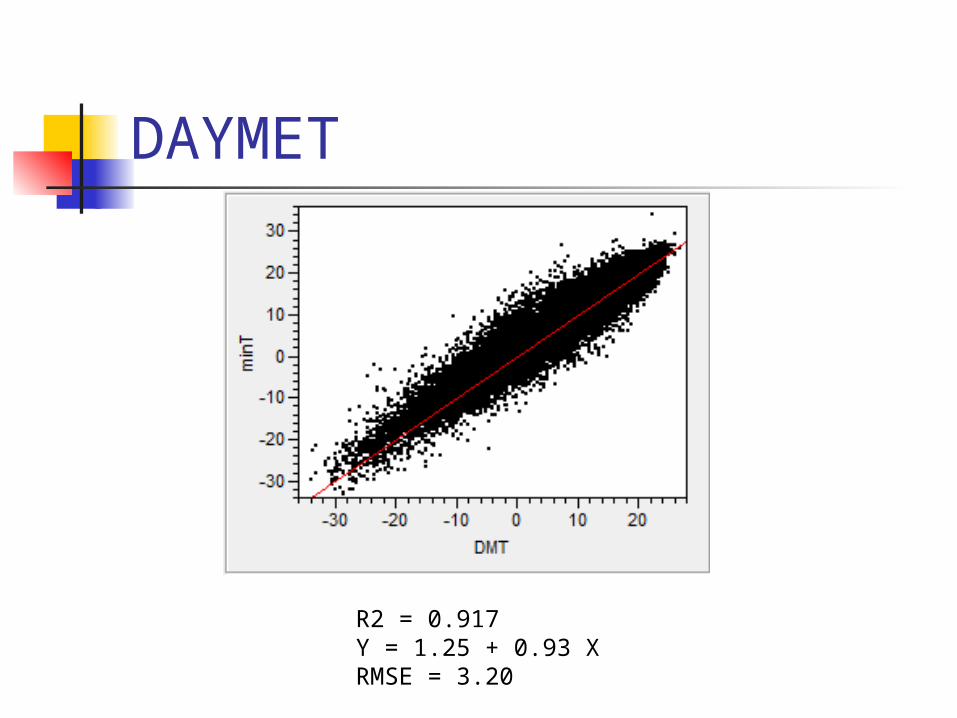
DAYMET
R2 = 0.917Y = 1.25 + 0.93 XRMSE = 3.20
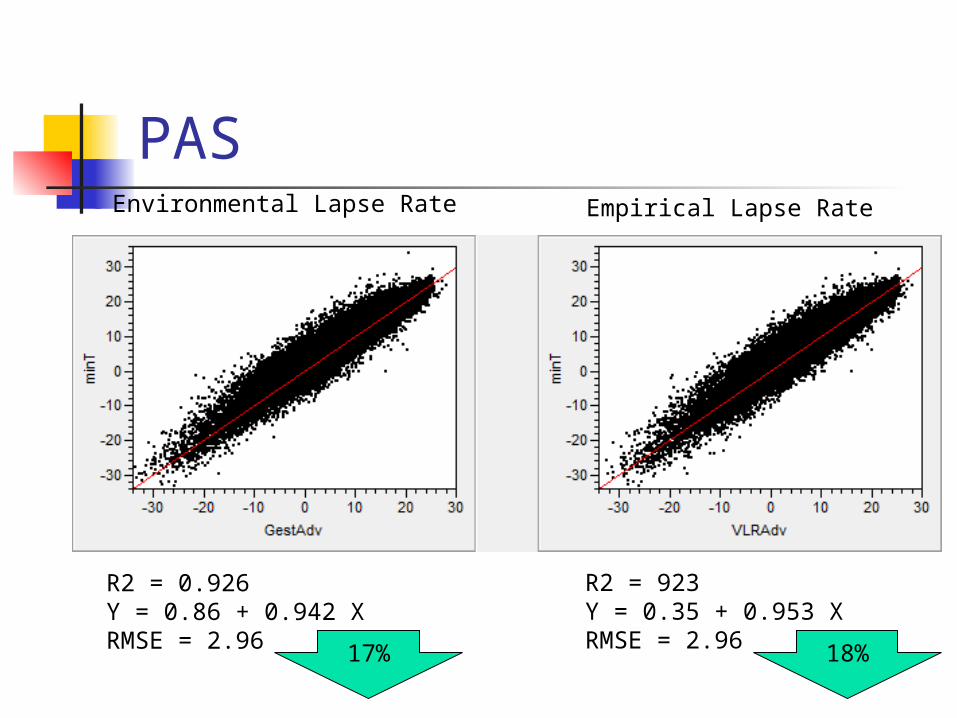
PASEnvironmental Lapse Rate Empirical Lapse Rate
R2 = 0.926Y = 0.86 + 0.942 XRMSE = 2.96
R2 = 923Y = 0.35 + 0.953 XRMSE = 2.9617% 18%
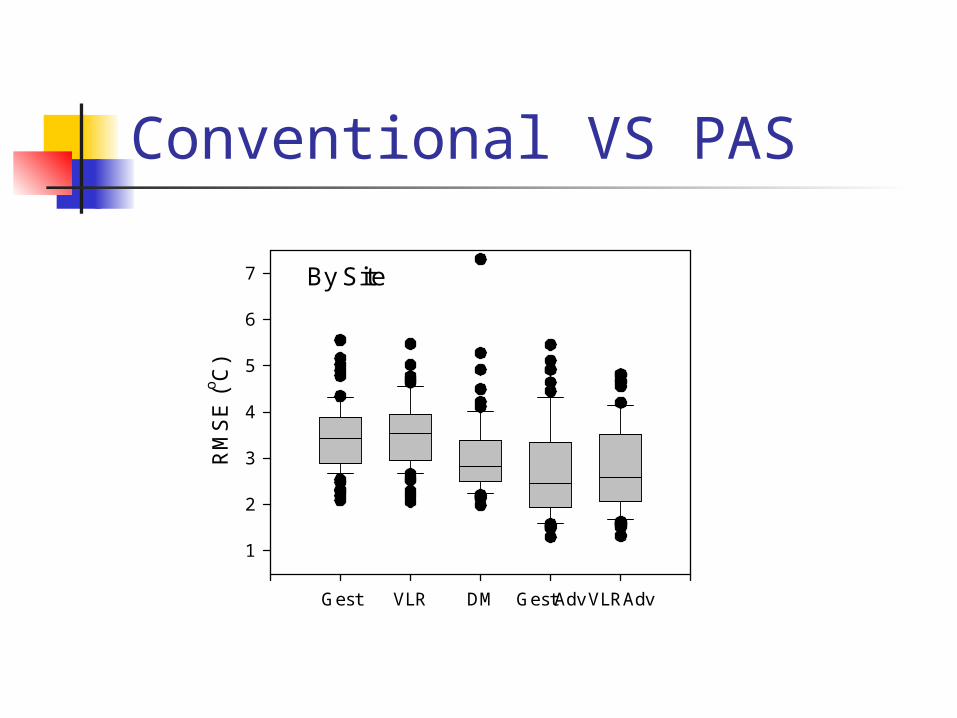
Conventional VS PAS
By Site
Gest VLR DM GestAdv VLRAdv
RM
SE
(oC
)
1
2
3
4
5
6
7

Monthly temperatureEnvironmental Lapse Rate Empirical Lapse Rate
R2 = 0.963Y = 0.96 + 0.927 XRMSE = 2.00
R2 = 0.963Y = 0.43 + 0.943 XRMSE = 1.90
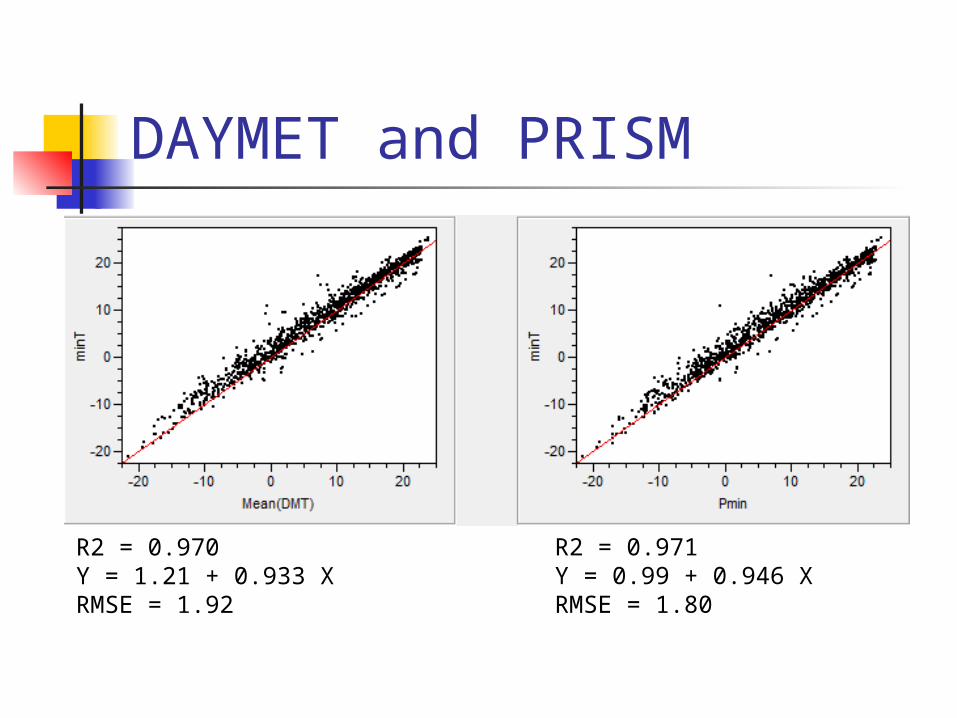
DAYMET and PRISM
R2 = 0.970Y = 1.21 + 0.933 XRMSE = 1.92
R2 = 0.971Y = 0.99 + 0.946 XRMSE = 1.80

PAS
R2 = 0.963Y = 0.43 + 0.943 XRMSE = 1.89
R2 = 0.964Y = 0.96 + 0.927 XRMSE = 1.99
Environmental Lapse Rate Empirical Lapse Rate

Conventional VS PAS
Gest VLR DM PM GestAdv VLRAdv
RM
SE
(o C
)
0
1
2
3
4
5
6
Conclusions
PAS can improve accuracy of site-specific estimates of daily minimum temperature
Natural neighbor interpolation can provide accurate estimates of monthly weather variables
Accuracy of PAS/Natural Neighbor method can be improved when COOP data are used
What’s next
Sub daily interpolation of weather data using PAS Advection scheme is better suited for
sub daily data