spatial statistics of gaze fixations during dynamic...
TRANSCRIPT
SPATIAL STATISTICS OF GAZE FIXATIONS DURING DYNAMIC FACE PROCESSING
Julie N. Buchan,1 Martin Paré,1,2,4 and Kevin G. Munhall1,3,4
Departments of 1Psychology, 2Physiology, and 3Otolaryngology, 4Centre for Neuroscience Studies
Queen's University, Kingston, Ontario, Canada
Short title: Gaze during Dynamic Face Processing Correspondence: J.N. Buchan Department of Psychology Queen's University Humphrey Hall 62 Arch Street Kingston, Ontario, Canada K7L 3N6 Tel: 613-533-6375 Fax: 613-633-2499 E-mail: [email protected] KEYWORDS: Audiovisual speech, Face processing, Eyetracking

1
Acknowledgments
The National Institute on Deafness and other Communication Disorders (grant DC-00594), the Natural Sciences and Engineering Research Council of Canada, the EJLB Foundation, and the Canadian Institutes of Health Research supported this work. We are grateful to June Lam, Mike Yurick, and Dave Hoffmann for help with this study. M.P. holds a New Investigator Award from the Canadian Institutes of Health Research. J.B. holds an Ontario Graduate Scholarship and the Brian R. Shelton Graduate Fellowship.

2
ABSTRACT—Social interaction involves the active visual perception of facial expressions
and communicative gestures. This study examines the distribution of gaze fixations while
watching videos of expressive talking faces. The knowledge-driven factors that influence the
selective visual processing of facial information were examined by using the same set of
stimuli, and assigning subjects to either a speech recognition task or an emotion judgment
task. For half of the subjects assigned to each of the tasks, the intelligibility of the speech was
manipulated by the addition of moderate masking noise. Both tasks and the intelligibility of
the speech signal influenced the spatial distribution of gaze. Gaze was concentrated more on
the eyes when emotion was being judged as compared to when words were being identified.
When noise was added to the acoustic signal, gaze in both tasks was more centralized on the
face. This shows that subject's gaze is sensitive to the distribution of information on the face,
but can also influenced by strategies aimed at maximizing the amount of visual information
processed.

3
SPATIAL STATISTICS OF GAZE FIXATIONS DURING DYNAMIC FACE
PROCESSING
Social interaction can take many different forms, but our most natural communication
occurs face to face. During such exchanges, the face conveys important social, emotional,
identity and linguistic information. A broad interdisciplinary effort has revealed much about
face processing, including insights into how we identify and recognize faces (Bruce &
Young, 1986; Oram & Perrett, 1992; Schyns, Bonnar, & Gosselin, 2002), how we read facial
expressions and emotions (Ekman, 1982), how people's gaze informs us about the direction
of their attention and their intention (Emery, 2000; Baron-Cohen, Wheelwright, Hill, Raste,
& Plumb, 2001), and how eye contact helps establish mutual attention (Kleinke, 1986).
However, much of this research has used static faces to address these questions. This is a
narrow choice of stimuli since the static face is a rarity in natural interactions. A live face that
is still (Terzis & Noah, 2002) or showing reduced motion (Mergl, Mavrogiorgou, Hegerl &
Juckel, 2005) is usually associated with neurological or psychiatric disorders.
The motion in dynamic faces provides independent information about identity and
emotional expression that is not available in posed, static faces (e.g., Ambadar, Schooler, &
Cohn, 2005; Hill & Johnston, 2001; Knappmeyer, Thornton & Bülthoff, 2003; O'Toole,
Roark & Abdi, 2002). Dynamic faces, however, also constrain perceptual processing by
providing an externally imposed time structure for the availability of information. In the rich
stimulus conditions that exist in natural conversations, subtle signals for linguistic, emotional
and pragmatic information rapidly appear and disappear. Humans must have perceptual
strategies that permit them to efficiently sample these visual social signals from the face.
One valuable approach to investigate perceptual strategies is to determine what facial
features are preferentially selected for more detailed processing by gaze fixations. The study
of fixation patterns has made contributions to our understanding of scene and object

4
perception (Findlay & Gilchrist, 2003; Henderson, Weeks & Hollingworth, 1999) and social
perception (Yarbus, 1967; Walker-Smith, Gale and Findlay, 1977)). In this latter area, the
measurement of gaze fixations has been extended to include clinical populations. Individuals
with deficits in social or communicative perception such as persons diagnosed with
schizophrenia (Williams, Loughland, Green, Harris & Gordon, 2003), social phobia (Horley,
Williams, Gonsalvez & Gordon, 2004), impaired fear recognition (Adolphs et al., 2005) and
autism (Klin et al., 2002) have been shown to differ in gaze patterns from normal comparison
groups. For example, individuals with social phobias show fewer gaze fixations on the eyes
of static emotional faces (Horley et al., 2004).
Although many of these studies have examined gaze behaviour while viewing static faces
without time constraints (e.g., Yarbus 1967; Adolphs et al., 2005), the active visual
exploration of dynamic faces has primarily been investigated during audiovisual and visual-
only speech perception (e.g., Paré, Richler, ten Hove & Munhall, 2003; Lansing &
McConkie, 1999, 2003; Vatikiotis-Bateson, Eigsti, Yano & Munhall, 1998). Here we extend
this approach to address two important questions about the active visual processing of
dynamic faces. Lansing & McConkie (1999) examined eye gaze behavior in silent
speechreading and showed task dependant effects on gaze behaviour when subjects were
asked to either judge intonation or to speechread repeated two-word utterances. However, it
remains unknown to what extent the spatial distribution of gaze behaviour in more
naturalistic audiovisual speech depends on the social tasks in which subjects are engaged. In
the present experiment we addressed this question by testing social perception using two
tasks, a speech perception task and emotional perception task using the same emotionally
expressive, talking faces. These two tasks were chosen as both facial expressions (Ekman,
1994) and speech are voluntarily used for, and naturally co-occur in, social communication.

5
Additionally, this study addresses the issue of whether varying the relative importance of
visual and auditory information modifies the spatial distribution of gaze behaviour. It has
long been known that seeing a talker's face enhances speech intelligibility in noisy acoustic
environments (Sumby & Pollack, 1954). The perceptual significance of visual speech
information is thus increased when auditory speech information is degraded by the presence
of noise (O’Neill, 1954; Erber, 1969). Research by Vatikiotis-Bateson et al. (1998) has
shown that the number of transitions between areas of the face is decreased in the presence of
noise during a speech task, suggesting that the importance of the visual speech information
may affect how the information is gathered. Our study will extend this finding by more
closely looking at the spatial distribution of gaze when the auditory speech signal is degraded
by varying the acoustic noise level in the speech and emotion tasks.
The visual stimulus in our study was kept constant across the two manipulations (task and
auditory noise level). Image properties that influence fixation locations (e.g., high spatial
frequency and edges; Parkhurst & Niebur, 2003) could therefore not account for any
observed differences in gaze behaviour. Thus, the study will examine the knowledge-driven
factors that influence selective visual processing of facial information in social contexts
(Henderson, 2003). By doing so, the present work lays an important foundation for studies of
social and clinical neuroscience (e.g., Adolphs et al., 2005; Klin, Jones, Schultz, Volkmar &
Cohen, 2002).
METHOD
Subjects
One Hundred individuals (76 females) with a mean age of 21.3 (17-30) years of age
participated in this experiment. Forty of these subjects (25 females) participated in control

6
studies, and sixty subjects participated in the actual experiment. The data from one of the
control subjects was lost due to equipment problems. All subjects were native speakers of
English and reported having normal or corrected to normal vision, as well as no speech or
hearing difficulties.
Stimuli
The stimuli were filmed in colour using digital audio and video recording equipment. An
experienced local theatre actor was filmed saying 27 Central Institute for the Deaf (CID)
Everyday Sentences (Davis & Silverman, 1970), selected from lists B, C, E and F. The actor
was instructed to say each sentence three times, once for each of the following emotions:
happy, neutral and angry. The actor was instructed to portray each emotion as realistically as
possible, and not to exaggerate the emotion. Each sentence was shown only once to each
subject and the emotion version of each sentence was counterbalanced across subjects within
each task. The video was edited into clips in Final Cut Pro, and then burned to DVD to allow
for random presentation of the stimuli.
The same stimuli were used for both the emotion and the speech tasks. The intelligibility
of the speech was manipulated by the presence (noise condition) or absence (no-noise
condition) of a commercial, multi-talker noise signal (Auditec, St. Louis, MO). To verify that
the addition of a multi-talker noise signal resulted in a decrease in the intelligibility of the
speech, an auditory-only control condition of the stimuli in the noise and no-noise conditions
was run. Participants in all of the auditory-only control conditions underwent the same
procedures as participants in the audiovisual conditions, with the exception that the monitor
was occluded to prevent the subjects from using the visual information, and the eye tracker
was not used to record gaze position. In the speech task, mean performance in the auditory-
only noise condition was 68.4% correct (SE 1.9) as compared with the mean performance in

7
the auditory-only no-noise condition at 99.9% correct (SE 0.1). The addition of the visual
information improved the intelligibility of the speech when noise was added, as mean
performance was better on the speech task in the audiovisual noise condition in the
experiment (85.5% correct, SE 1.4) as compared with mean performance in the auditory-only
noise control experiment (68.4% correct, SE 1.9).
Emotion is certainly conveyed in both the visual (Ekman, 1982), and auditory modalities
(de Gelder &Vroomen, 2000). To verify that the decrease in the intelligibility of the speech in
the presence of noise was also accompanied by a decrease in the accuracy of identifying the
emotion of the speech, auditory-only conditions for the emotion task were also run as a
control. In the emotion task, mean performance in the auditory-only noise condition was
43.0% correct (SE 4.2) as compared with the mean performance in the auditory-only no-noise
condition at 67.5% correct (SE 2.2). The auditory-only performance is significantly poorer
than the audiovisual results in the experiment (81.0% correct (SE 2.8) and 82.8% correct (SE
3.3) for noise and no-noise respectively.)
Apparatus
The experiment took place in a double-walled sound isolation booth (model 1204,
Industrial Acoustic Corporation, Bronx, NY). Subjects were seated with their head stabilized
with a chinrest and positioned so that their eyes were approximately 1 m away from the
centre of a 20-in television monitor (Sony PVM 20L5, 720X480 resolution). The audio was
played from speakers (Paradigm Reference Studio/20) on each side of the monitor. Eye
position was monitored using dark pupil tracking with a sampling rate of 500 Hz with an
EyeLink II eye-tracking system (SR Research, Osgoode, Canada). A nine-point calibration
and validation procedure was used. The maximum error allowed on a single point was 1.5
degrees, though the error on the central point was always less than 1 degree. The maximum
average error was less than 1 degree. A drift correction was performed before each trial.

8
Procedure
The experiment was carried out as a between-subjects design and 15 subjects were
assigned to each of the four conditions (2 Task X 2 Noise Levels). A between-subjects design
was used to avoid the subjects’ knowledge of the task requirement in the other conditions
biasing their gaze behaviour. Subjects were instructed to watch the talker on the monitor, and
either report all of the words that they heard him say (speech task), or to judge which emotion
he was trying to portray, and rate the portrayal over the entire sentence on a scale of 1-9
(emotion task). The rating scale was used in order to encourage subjects to pay attention to
the entire trial. All responses by the subjects were made verbally, and then recorded by the
experimenter.
Three CID sentences that were not stimuli in the actual experiment were presented to
subjects as practice trials in the noise condition. In the speech practice trials, subjects were
given feedback as to what the talker had said. In the emotion practice trials, they were shown
the same three sentences, but were given no feedback.
Data Analysis
Response Scoring – In the speech task, loose key word scoring, using the standard CID
key words (Davis & Silverman, 1970), was carried out on subject's responses. In the emotion
task, a response was scored as correct if the subject chose the same emotion as the one the
actor was asked to portray.
Coding of Features – Instantaneous positions of the eyes, nose and mouth were coded
frame-by-frame for each sentence of the stimuli. One reference point was coded for each eye,
approximately in the centre of the pupil. For the nose, a point was coded for the visible part

9
of each nostril, and a virtual point approximately 0.3 degrees of visual angle above the
halfway point was chosen to represent the nose feature. For the mouth, four points were
coded, one point in each of the corners of the mouth, one on midline of the upper lip on the
vermillion border, and one on the midline of the lower lip on the vermillion border. See
Figure 1.
(Figure 1 about here)
Regions of Interest – Ellipses centred on the eyes, nose, and mouth reference points were
used to delimit regions of interest (ROI). For each eye, a circle with a radius corresponding to
approximately 1.1 degrees of visual angle was used to demarcate the ROI boundary. A
fixation falling in either eye region was considered to be in the "eye" ROI. The ellipses
centred on the nose reference point had a vertical semi-minor axis of 0.8 degrees of visual
angle, and a horizontal semi-major axis of 1.1 degrees of visual angle. Because the mouth can
change shape quite considerably during speech, the mouth ROI was variable in size. A centre
point, determined by the position of the four points that had been coded on the mouth, was
used to centre an ellipse that was 0.5 degrees of visual angle larger from the centre point than
each of the four coded points. See Figure 1.
Fixation distance – The average distance of a fixation away from the centre of a feature
(measured in degrees of visual angle) was calculated, and then weighted by the duration of
the fixation. Feature centres were based on the reference points described above. Whichever
eye a fixation was closest to was used to determine the distance from the eyes.
Dependent Measures – We quantified gaze behaviour with four different measures: 1) the
percentage of trial time subjects spent with their gaze within each ROI; 2) the mean number

10
of gaze fixations within each ROI; 3) the median duration of gaze fixations within each ROI;
and 4) the mean distance of gaze fixations with respect to the centre of each ROI. The effects
of task (emotion and speech) and noise level on these measures were analyzed with two-way
ANOVAs. Each ROI was analyzed independently. The average distance from each feature
was also analyzed independently on a feature-by-feature basis.
RESULTS
Performance on the audiovisual speech and the emotion tasks were very accurate (see
Table 1). Subjects in the speech task with noise performed significantly worse than those in
the speech task without noise, thus the addition of acoustic noise was successful in decreasing
the intelligibility of the audiovisual speech. There was no difference in accuracy on the
emotion task in the noise condition versus the no-noise condition. There was also no
difference in accuracy for judging the different emotions in the emotion task.
(Table 1 about here)
Subjects tended to direct their gaze on or close to the salient features of the face: the eyes,
the nose and the mouth. Accordingly, 85% of the duration of the trial was spent fixated in the
chosen regions of interest (ROIs). The main effects of task and noise level on either gaze
fixation percentage in ROIs or distance from ROIs were significant (two-way ANOVA,
p<.01), but there were no significant interactions between these two factors (p>. 05). Because
of this, the effects of these two factors on our measures of gaze fixation distribution will be
treated separately.
Different emotions are conveyed by distinct configurations of the face with different
regions of the face containing the diagnostic information for different emotional categories
(Smith, Cottrell, Gosselin, & Schyns, 2005). Here we examined whether viewing the
11
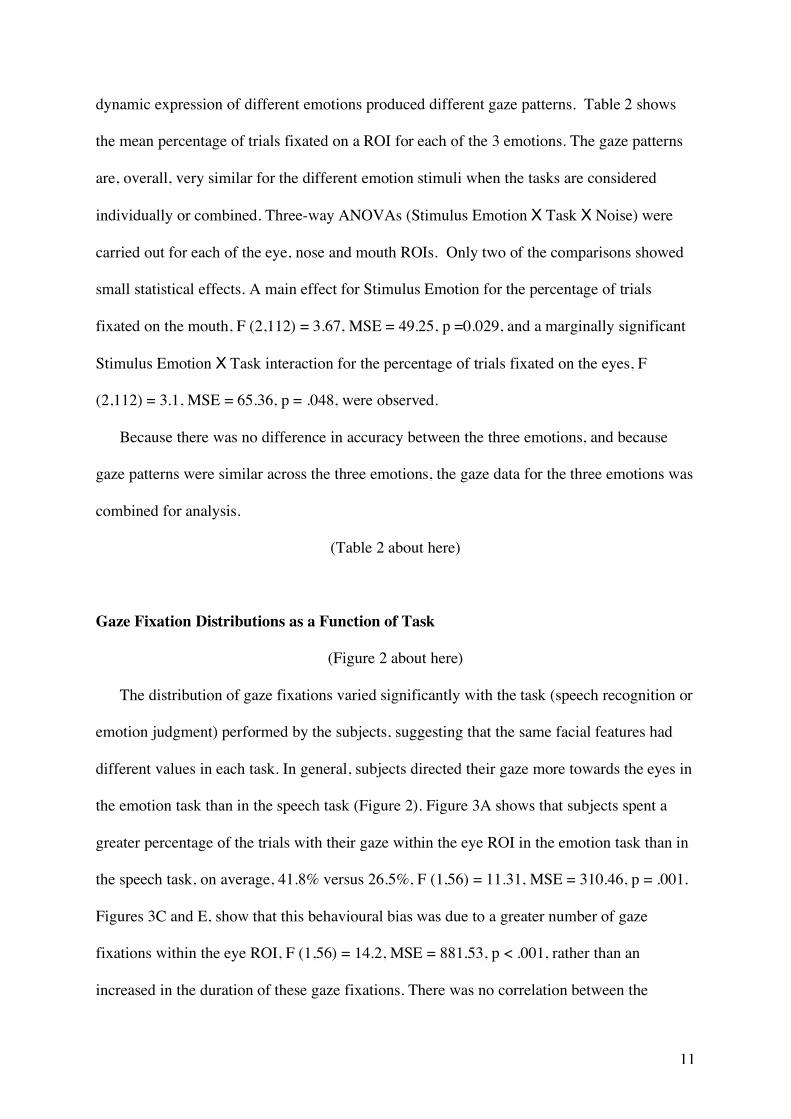
dynamic expression of different emotions produced different gaze patterns. Table 2 shows
the mean percentage of trials fixated on a ROI for each of the 3 emotions. The gaze patterns
are, overall, very similar for the different emotion stimuli when the tasks are considered
individually or combined. Three-way ANOVAs (Stimulus Emotion X Task X Noise) were
carried out for each of the eye, nose and mouth ROIs. Only two of the comparisons showed
small statistical effects. A main effect for Stimulus Emotion for the percentage of trials
fixated on the mouth, F (2,112) = 3.67, MSE = 49.25, p =0.029, and a marginally significant
Stimulus Emotion X Task interaction for the percentage of trials fixated on the eyes, F
(2,112) = 3.1, MSE = 65.36, p = .048, were observed.
Because there was no difference in accuracy between the three emotions, and because
gaze patterns were similar across the three emotions, the gaze data for the three emotions was
combined for analysis.
(Table 2 about here)
Gaze Fixation Distributions as a Function of Task
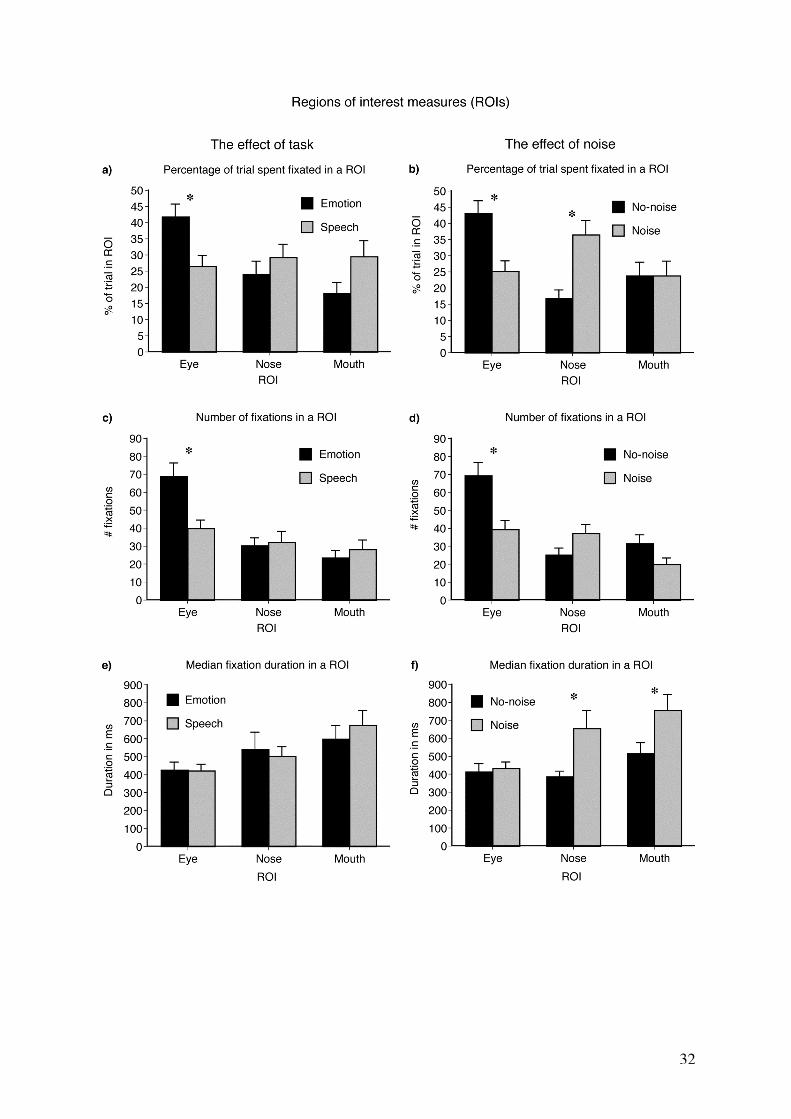
(Figure 2 about here)
The distribution of gaze fixations varied significantly with the task (speech recognition or
emotion judgment) performed by the subjects, suggesting that the same facial features had
different values in each task. In general, subjects directed their gaze more towards the eyes in
the emotion task than in the speech task (Figure 2). Figure 3A shows that subjects spent a
greater percentage of the trials with their gaze within the eye ROI in the emotion task than in
the speech task, on average, 41.8% versus 26.5%, F (1,56) = 11.31, MSE = 310.46, p = .001.
Figures 3C and E, show that this behavioural bias was due to a greater number of gaze
fixations within the eye ROI, F (1,56) = 14.2, MSE = 881.53, p < .001, rather than an
increased in the duration of these gaze fixations. There was no correlation between the
12
average percentage of the trial subjects spent fixated on the eyes and their accuracy in the
emotion task. There was no significant difference in the measures made with respect to the
nose or mouth ROIs. Although figure 3A shows a relatively large difference in the percentage
of the trial spent fixated on the mouth, this difference did not reach significance, F (1,56) =
3.70, MSE = 520.79, p = .060.
(Figure 3 about here)
(Figure 4 about here)
Figure 4A shows how the distance of gaze fixation positions relative to the salient facial
features also varied significantly between the tasks. Gaze fixations were significantly closer
to the eyes in the emotion task than in the speech task, on average, 1.3 versus 1.6 degrees of
visual angle away, F (1,56) = 6.99, MSE = 131.67, p = .011. Conversely, fixations were
significantly closer to the mouth in the speech task than in the emotion task, 2.8 versus 3.1
degrees of visual angle away, F (1,56) = 5.38, MSE = 366.94, p. = .024. This result contrasts
with the result that the difference in time spent in the mouth ROI between tasks failed to
reach statistical significance. This discrepancy, however, is likely due to the categorical
nature of the ROI analyses versus the continuous nature of the average distance analyses.
Subjects thus seemed to be more attracted to the mouth in the speech task without necessarily
fixating on the mouth. Nevertheless, there was no correlation between subjects' accuracy on
the speech task and the average percentage of the trials spent fixating on the mouth. The
average distance from the nose did not differ significantly between tasks.
Gaze Fixation Distributions as a Function of Noise Level
The distribution of gaze fixations also varied significantly with the decreased
intelligibility of speech caused by the addition of acoustic noise regardless of the task,

13
suggesting that the listening conditions induced subjects to adopt a different strategy to
extract information from the same facial stimulus.
In general, gaze fixations clustered near the centre of the face in the presence of acoustic
noise (Figure 2). Figure 3B shows that subjects spent a significantly greater percentage of the
trials with their gaze within the nose ROI in the noise condition than in the no-noise
condition, on average, 36.5% versus 16.7%, F (1,56) = 15.38, MSE = 379.67, p < .001.
Figure 3D and F, shows that this behavioural bias was due to an increase in the duration of
the gaze fixations within the nose ROI, F (1, 56) = 7.0, MSE = 153476.19, p = .010, rather
than a greater number of these gaze fixations. This effect appears to parallel the significant
decrease in the time that the subjects spent with their gaze within the eye ROI, 43.0% versus
25.2%, F (1,56) = 15.37, MSE = 310.46, p < .001, because of fewer fixations, F (1,56) =
15.35, MSE = 881.53, p < .001. There was no significant difference in the time spent within
the mouth ROI.
The gaze fixation positions were closer relative to the central features of the face in the
presence of acoustic noise, as is shown in Figure 4B. Gaze fixations were significantly closer
to the nose in the noise condition than in the no-noise condition, on average, 1.3 versus 1.8
degrees of visual angle away, F (1,56) = 19.36, MSE = 190.20, p < .001. These gaze fixation
positions were also closer to the mouth in the noise condition than in the no-noise condition,
2.8 versus 3.2 degrees of visual angle away, F (1,56) = 6.22, MSE = 366.94, p = .016. The
median duration of the gaze fixations within the mouth ROI (Figure 3F) was significantly
longer in the presence of noise, F (1, 56) = 5.99, MSE = 165677.71, p = .018. Since the time
spent in the mouth ROI did not differ between noise conditions (Figure 3B), the longer
duration of these fixations in the presence of noise is probably due to fewer fixations, even
though that number reduction failed to reach statistical significance (Figure 3D). The
reduction in time spent looking at the eyes observed in the presence of noise did not translate

14
into a significant increase in fixation distance away from the eyes, which remained less than
half of the distance to the mouth.
DISCUSSION
The spatial statistics describing how subjects viewed dynamic faces varied according to
both the task they performed and the accompanying auditory noise level. When judging
emotions rather than recognizing speech, subjects preferentially shifted their gaze to the eyes;
they looked at the eyes with more numerous, not longer, gaze fixations. When the
intelligibility of the speech was decreased by the addition of acoustic noise, subjects adopted
a vantage point centred on the face by reducing the frequency of gaze fixations on the eyes
and lengthening the duration of their gaze fixations on the nose and the mouth.
Subjects seem to be preferentially attending to certain facial locations over others. One
explanation for this task effect is that subjects directed their gaze towards features of the face
known to contain information important to these tasks. On the one hand, the eyes carry
important social information (Baron-Cohen et al., 2001), the eyes attract fixations when
subjects are performing emotion judgments in static photographs (Adolphs et al., 2005) and
movements of the eyebrows are known to correlate with linguistic prosody (e.g., Krahmer,
Ruttkay, Swerts, & Wesselink, 2002). On the other hand, the lower part of the face is the
major source of visual information about speech with lip movements providing the strongest
correlation with the acoustics (Yehia, Rubin, Vatikiotis-Bateson, 1998). In a visual-only
speech perception task, Lansing and McConkie (1999) found that subjects directed their gaze
more toward the upper part of a speaker’s face when judging intonation than when
identifying words.

15
There are, however, difficulties with using sensitivity to task-relevant information as the
sole explanation for our findings. The diagnostic information for the expression of different
emotions may be concentrated in different regions of the face. Smith et al. (2005) have shed
light on this problem by using a set of static, posed faces to examine where on the face
diagnostic information for each emotion is contained. They showed that the eyes convey
more information about anger and the mouth yields more information about happiness,
although it is unclear if these results can be extended directly to more naturalistic stimuli.
While our subjects did vary gaze by task, they did not systematically vary their patterns of
gaze for stimuli produced with different emotions. Perhaps our design of randomizing the
presentation order of sentences spoken with different emotions precluded a strategy focused
on different regions for the three emotions. However, some uncertainty about the
emotionality of a sentence spoken in natural conversation would also normally preclude such
focal information gathering. A further limitation of interpreting the differential responses in
our study as being driven solely by the location of diagnostic information is that the effects of
task orientation are modest. Gaze was directed to the eyes less than 50% of the trials during
the emotion task and to the mouth in less than 50% of the trials during the speech task.
One factor that could mitigate the influence of the location of diagnostic information is
that it may be unnecessary to foveate any particular facial feature to perceive emotion or
speech. Although certain areas of the face may be more diagnostic for a particular task,
speech information (Benoît, Guiard-Marigny, Le Groff & Ajoudani, 1996; Vatikiotis-
Bateson, Munhall, Hirayama, Kasahara & Yehia, 1996) and dynamic emotional information
(Bassali, 1978; Bassali, 1979) are fairly broadly distributed across the face. Research using
the McGurk effect indicates that direct fixation is not necessary to perceive visual speech
information (Paré et al., 2003). The McGurk effect is still quite strongly perceived even 20
degrees of visual eccentricity away from the mouth, which would be roughly equivalent to

16
staring just off screen while watching a talker on a monitor. Other studies have shown
directly by degrading the images that highly detailed visual features may not be necessary for
visual information to be useful for both audiovisual speech perception (Munhall, Kroos,
Jozan, Vatikiotis-Bateson, 2004; MacDonald, Andersen, & Bachmann, 2000) and emotion
perception (Vuilleumier, Armony, Driver & Dolan, 2001). In our study, the accuracy of the
emotion judgment made by the subjects did not correlate with the time they spent fixating on
the eyes nor did the accuracy in the speech task correlate with the time spent fixating on the
mouth. This suggests that the analysis of highly detailed information afforded by fixating on
the eyes or mouth was not necessary for the successful processing of emotional and speech
information.
The efficacy of peripheral vision may also help explain the centralized gaze fixations seen
in the noise condition in our experiment. The nose is neither an expressive feature, nor does it
provide much speech information by itself. Thus, this centralized gaze behaviour cannot be
explained as a function of the need to gather highly detailed information. Information beyond
the fovea, therefore, must play a major role in dynamic face perception in this condition. It
has long been known that visual information may be gathered covertly (Posner, 1980) using
peripheral vision, even though subjects do show a natural propensity to move their eyes to
foveate what is of interest (Findlay & Gilchrist, 2003).
In our data, the clustering of gaze fixations on the nose and mouth when noise was
present was also associated with a decrease in the number of saccades and an increase in
fixation duration. One explanation for both the centralization of gaze and the lengthening of
fixation durations when auditory conditions were degraded is that subjects are attempting to
maximize the amount of visual information processed. Since it seems unlikely that the nose
was the main feature of interest, the centralized gaze fixations more likely reflect a strategy
whereby subjects choose the centre of the face as a vantage point to keep both the eyes and

17
the mouth as close as possible to central vision. By keeping the eyes relatively stationary,
subjects may also be attempting to glean more information from the moving face. Saccadic
suppression does not impose much cost when viewing static stimuli since no new information
is introduced during a saccade. However, with dynamic stimuli, some visual information may
be lost each time a saccade is made.
It is interesting that an auditory manipulation changed the way in which visual
information is gathered and that a rather modest decrease in intelligibility brought about such
a dramatic shift in gaze fixation patterns across both tasks. The more centralized gaze
fixations seen across both tasks during noisy listening raises the question of the extent to
which the processing of visual speech and emotion information happens concurrently. Some
experimental evidence suggests that face recognition tasks (Kittler & Turkewitz, 1999) and
visuo-spatial attention tasks (Thompson, Malmberg, Goodell, & Boring, 2004) can be
performed in parallel with audiovisual speech perception tasks.
While visual information can be processed concurrently, the failure to adopt this central
fixation strategy under better listening conditions suggests the possibility that there is a trade-
off or cost to doing so that is not revealed by our design. Although diagnostic information for
speech and emotion is broadly distributed across the face, the quality of this information
likely varies both spatially and temporally. Faced with this dynamic communicative
environment, individuals may develop a flexible strategy whereby their scanning routines
attempt to gather the best information to be useful for a task while at the same time balancing
costs.
Such scanning routines may be mandated by the dynamic nature of social information on
the face and by the richness of the facial social stimuli. In natural conversation individuals
may be gathering many other kinds of social information from the face in addition to
extracting speech and emotion information. For example, monitoring the gaze of a talker in

18
natural face-to-face conversation may provide important and rather subtle visual cues to
signal both the attention and intentions of a talker (Emery, 2000; Baron-Cohen et al., 2001).
This general tendency to monitor the gaze of a talker extends to watching videos of talkers as
well, although this tendency may be mediated by cultural social norms (Vatikiotis-Bateson et
al., 1998). The high number of fixations on the eyes during the emotion and even the speech
task in our experiment and the audiovisual speech task of Vatikiotis-Bateson et al. (1998)
may reflect this general tendency to monitor gaze. However, this predominance of fixations
on the eyes is not seen in all audiovisual speech experiments (Paré et al., 2003, Lansing &
McConkie, 2003). One possibility could be that stimuli differ in the extent that they are
socially engaging. Vatikiotis-Bateson et al. (1998) used extended monologues in which
talkers generated their own speech. Our study used a subset of the sentences used by Lansing
& McConkie (2003), yet ours included an emotional component, possibly making them more
engaging. Paré et al. (2003) used nonsense consonant vowel consonant syllables.
The current study shows that task difficulty, in addition to the assigned task, has a
mediating effect on gaze fixations during face processing. The results of our study show that
even a modest increase in the difficulty of the task affects the spatial distribution of gaze.
This is an important finding and should be of note for clinical studies wishing to compare
gaze fixation distributions of normal and clinical populations. Performance in patient
populations is often poorer than controls, and many experimental tasks may be more taxing
for patients. In this context, gaze patterns could differ for patient groups as a result of task
difficulty rather than disorder-specific impairments to fixation control.
The role that this gaze centralizing strategy plays in some recent clinical studies is
unknown but warrants further investigation. Adolphs et al. (2005) demonstrated a connection
between gaze and the selectivity of facial processing. Patient SM, who has bilateral amygdala
damage, has repeatedly been shown to be impaired in recognizing fear in direct gaze, static
19
facial images. Eye tracking data revealed that SM did not spontaneously look at the eyes
when viewing faces but rather showed consistent central fixations. When instructed to look at
the eyes during an emotion judgement task, SM's impairment for fear judgements
disappeared. In the context of the present data, the nose fixations by SM may reflect a direct
response to task difficulty for this patient. What is surprising in the Adolphs et al. (2005)
data is not the gaze patterns but the inability of the patient to use information from peripheral
vision only when judging fear in images. SM's performance on the judgements of other
emotions is unimpaired in spite of centralized gaze patterns and this is consistent with the
current data. In contrast, SM showed marked decrements in accuracy for a single emotion,
fear. It is possible that the diagnostic information in the fear stimuli may be contained in
high spatial frequency cues confined to the eye region. Without foveation of this area of the
stimulus, the information would be unavailable to SM.
Other studies of clinical populations have also demonstrated a connection between gaze
and the social processing of faces. Klin et al. (2002) studied gaze fixations of high-
functioning adolescents and young adults with autism spectrum disorder, and age and verbal-
IQ matched controls while watching video clips taken from an emotionally charged movie.
Individuals with autism spectrum disorder showed different patterns of gaze compared with
their controls. The clinical subjects spent significantly less time looking at the eyes and
significantly more time looking at the mouths of faces on the screen. It had been suggested by
Klin et al. (2005) that the increased fixations away from the eyes by subjects with autism
spectrum disorder were made in an attempt to better understand speech. However, the data
may also be influenced by a general tendency to centralize fixations when the task becomes
more difficult.
Information important for social interactions is likely conveyed bimodally by both visual
and auditory cues. Identity is conveyed by the form and motion of the face (Knappmeyer et

20
al., 2003), as well as by the voice (Pisoni, 1997). Subtle timing information is needed to
coordinate turn taking in conversation (Cowey, 1998) and this timing information is likely
provided in both the voice and the face. In normal conversation, there is also additional
information beyond simply the emotional and the linguistic information that is needed to
arrive at the actual meaning of an utterance (Hawkins, 2003), and this information is likely
also conveyed by both the face and voice.
A possible neural substrate for the audiovisual convergence of socially relevant
information is the superior temporal sulcus (STS). Imaging studies have shown the STS
responding to socially relevant actions such as direction of gaze and mouth movement (Puce,
Allison, Bentin, Gore & McCarthy, 1998), and voice prosody (Grandjean et al., 2005).
Imaging studies have also shown STS activation during audiovisual speech perception
(Callan et al., 2003; Sekiyama, Kanno, Miura & Sugita, 2003; Wright, Pelphrey, Allison,
McKeown & McCarthy, 2003; Calvert, Campbell & Brammer, 2000). Whether the
integration of visual and auditory emotional information shares the same neural substrates as
audiovisual speech perception is at present unknown.
Vision actively contributes to social perception and the data reported here suggest that
gaze is tuned to the specific goals and conditions of social interaction. The spatial distribution
of gaze while viewing a talking face is driven both by visual information being sought out for
a particular task, and also by the intelligibility of the speech. However, the data also
underline the fact that face-to-face conversation provides us with rich, dynamic stimuli from
which a plethora of information can be extracted. This information is unlikely to be simply
spatially and temporally localized and the observer must be able to extract different streams
of communicative information from different motions of the same face. Unraveling the neural
substrates responsible for this complex perceptual activity will require controlled behavioral
studies. To carry out these studies the field must focus on the difficult problem of metrics for

21
dynamic stimuli. The spatial distribution of gaze patterns in this study are determined by a set
of competing forces including the distribution within these movies of 'diagnostic' information
for each task (Schyns et al., 2002), the spatio-temporal power spectrum of the movies (Dong
& Atick, 1995) and perhaps most importantly, the knowledge-driven strategies for acquiring
this information (Henderson, 2003).

22
REFERENCES Adolphs, R., Gosselin, F., Buchanan, T.W., Tranel, D., Schyns, P., & Damasio, A.R. (2005).
A mechanism for impaired fear recognition after amygdala damage. Nature, 433, 68-72. Ambadar, Z., Schooler, J.W., & Cohn, J.F. (2005). Deciphering the enigmatic face: the
importance of facial dynamics in interpreting subtle facial expressions. Psychological Science, 16, 403-410.
Benoît, C., Guiard-Marigny, T., Le Groff, B., & Adjoudani, A. (1996). Which components of
the face do humans and machines best speechread? In D.G. Stork & M. Hennecke (Eds.), Speechreading by Humans and Machines: Models, Systems & Applications. Kluwer Academic Publishers.
Baron-Cohen, S., Wheelwright, S., Hill, J., Raste, Y., & Plumb, I. (2001). The "Reading the
Mind in the Eyes" test revised version: a study with normal adults, and adults with Asperger syndrome or high-functioning autism. Journal of Child Psychology and Psychiatry, 42, 241-251.
Bassili, J.N. (1978). Facial motion in the perception of faces and of emotional expression.
Journal of Experimental Psychology, 4, 373-379. Bassili, J.N. (1979). Emotion recognition: The role of facial movement and the relative
importance of upper and lower areas of the face. Journal of Personality and Social Psychology, 37, 2049-2058.
Bruce, V., & Young, A. (1986). Understanding face recognition. British Journal of
Psychology, 77, 305-27. Callan, D.E., Jones, J.A., Munhall, K., Callan, A.M., Kroos, C., & Vatikiotis-Bateson, E.
(2003). Neural processes underlying perceptual enhancement by visual speech gestures. Cognitive Neuroscience and Neuroreport, 14, 2213-2218.
Calvert, G.A., Campbell, R., & Brammer, M.J. (2000). Evidence from functional magnetic
resonance imaging of crossmodal binding in the human heteromodal cortex. Current Biology, 10, 649-657.
Cowley, S.J. (1998). Of timing, turn-taking, and conversations. Journal of Psycholinguistic
Research, 27, 541-571. Davis, H., & Silverman, S.R. (1970). Hearing and deafness. New York: Holt, Reinhart and
Wilson. de Gelder, B., & Vroomen, J. (2000). The perception of emotions by ear and by eye.
Cognition and Emotion, 14, 289-311.

23
Dong, D.W., & Atick, J.J., (1995). Statistics of natural time-varying images. Network: Computation in Neural Systems, 6, 345–358.
Ekman, P., Ed. (1982). Emotion in the Human Face, 2nd edit. Cambridge University Press. New York. Ekman, P. (1994). Strong evidence for universals in facial expressions: a reply to Russell’s
mistaken critique. Psychological Bulletin, 115, 268-287. Emery, N.J. (2000). The eyes have it: the neuroethology, function and evolution of social
gaze. Neuroscience and Behavioural Reviews, 24, 581-604. Erber, N.P. (1969). Interaction of audition and vision in the recognition of oral speech
stimuli. Journal of Speech and Hearing Research, 12, 423-425. Findlay, J.M., & Gilchrist, I.D. (2003). Active vision: The psychology of looking and seeing.
Oxford University Press. London. Grandjean, D., Sander, D., Pourtois, G., Schwartz, S., Seghier, M.L., Scherer, K.L., &
Vuilleumier, P. (2005). The voices of wrath: brain responses to angry prosody in meaningless speech. Nature Neuroscience, 8, 145-146.
Hawkins, S. (2003). Roles and representations of systematic fine phonetic detail in speech
understanding. Journal of Phonetics, 31, 373-405. Henderson, J.M. (2003). Human gaze control during real-world scene perception. Trends in
Cognitive Sciences, 7 (11), 498-504. Henderson, J.M., Weeks, P.A., Jr., & Hollingworth, A. (1999). The effects of semantic
consistency on eye movements during scene viewing. Journal of Experimental Psychology: Human Perception & Performance, 25, 210-228.
Hill, H., & Johnston, A. (2001). Categorizing sex and identity from the biological motion of
faces. Current Biology, 11, 880–885. Horley, K., Williams, L.M., Gonsalvez, C., & Gordon, E. (2004). Face to face: visual
scanpath evidence for abnormal processing of facial expressions in social phobia. Psychiatry Research, 127, 43-53.
Kittler, P., & Turkewitz, G. (1999). The talking face: Effects of concurrent speech on
hemispheric lateralization of face recognition. Developmental Neuropsychology, 16, 253-271.
Kleinke, C.L. (1986). Gaze and eye contact: a research review. Psychological Bulletin. 100,
78-100. Klin, A., Jones, W., Schultz, R., Volkmar, F. R., & Cohen, D. (2002) Visual fixation patterns
during viewing of naturalistic social situations as predictors of social competence in individuals with autism. Archives of General Psychiatry, 59, 809–816.
24
Knappmeyer, B., Thornton, I.M., & Bülthoff, H.H., (2003). The use of facial motion and facial form during the processing of identity. Vision Research, 43, 1921-1936.
Krahmer, E., Ruttkay, Zs., Swerts, M., Wesselink, W. (2002). Pitch, eyebrows and the
perception of focus. Proceedings of Speech Prosody 2002, Aix en Province, France, 443–446.
Lansing, C.R., & McConkie, G.W. (1999). Attention to facial regions in segmental and
prosodic visual speech perception tasks. Journal of Speech, Language, and Hearing Research, 42, 526-539.
Lansing, C.R., & McConkie, G.W. (2003). Word identification and eye fixation locations in
visual and visual-plus-auditory presentations of spoken sentences. Perception & Psychophysics, 65, 536-552.
MacDonald, J., Andersen, S., & Bachmann, T. (2000). Hearing by eye: how much spatial
degradation can be tolerated?. Perception, 29, 1155-1168. Mergl, R., Mavrogiorgou, P., Hegerl, U., & Juckel, G. (2005). Kinematical analysis of
emotionally induced facial expressions: a novel tool to investigate hypomimia in patients suffering from depression. Journal of Neurology, Neurosurgery & Psychiatry, 76, 138-40.
Morris, J.S., Frith, C.D., Perrett, D.I., Rowland, D., Young, A.W., Calder, A.J., & Dolan, R.J.
(1996). A differential neural response in the human amygdala to fearful and happy facial expressions. Nature, 383, 812-815.
Munhall, K.G., Kroos, C., Jozan, G., & Vatikiotis-Bateson, E. (2004). Spatial frequency
requirements for audiovisual speech perception. Perception & Psychophysics, 66, 574-583.
Oram, M.W., & Perrett, D.I. (1992). Time course of neural responses discriminating different
views of the face and head. Journal of Neurophysiology, 68, 70-84. O'Neill, J.J. (1954). Contributions of the visual components of oral symbols to speech
comprehension. Journal of Speech and Hearing Disorders, 19, 429-439. O’Toole, A.J., Roark, D.A., & Abdi, H. (2002). Recognizing moving faces: a psychological
and neural synthesis. Trends in Cognitive Sciences, 6, 261-266. Paré, M, Richler, R, C., ten Hove, M., & Munhall, K.G. (2003). Gaze behaviour in
audiovisual speech perception: The influence of ocular fixations on the McGurk effect. Perception & Psychophysics, 65, 533-567.
Parkhurst, D.J., & Niebur, E. (2003). Scene content selected by active vision. Spatial Vision,
16, 125-154. Pisoni, D. B. (1997). Some thoughts on "Normalization" in speech perception. In K. Johnson
& J. W. Mullennix (Eds.), Talker Variability in Speech Processing. San Diego: Academic Press

25
Posner, M.I. (1980). Orienting of attention. Quarterly Journal of Experimental Psychology,
32, 3-25. Puce, A., Allison, T., Bentin, S., Gore, J.C., & McCarthy, G. (1998). Temporal cortex
activation in humans viewing eye and mouth movements. The Journal of Neuroscience, 18, 2188-2199.
Schyns, P.G., Bonnar, L., & Gosselin, F. (2002). Show me the features! Understanding
recognition from the use of visual information. Psychological Science, 13, 402-409. Sekiyama, K., Kanno, I., Miura, S., & Sugita, Y. (2003). Auditory-visual speech perception
examined by fMRI and PET. Neuroscience Research, 47, 277-287. Smith, M.L., Cottrell, G.W., Gosselin, F., & Schyns, P.G. (2005). Transmitting and decoding
facial expressions. Psychological Science, 16,184-9. Sumby, W.H., & Pollack, I. (1954). Visual contributions to speech intelligibility in noise.
Journal of the Acoustical Society of America, 26, 212-215. Thompson, L.A., Malmberg, J., Goodell, N.K., & Boring, R.L. (2004). The Distribution of
Attention Across a Talker's Face. Discourse Processes, 38, 145-168. Terzis J.K., & Noah E.M. (2002). Mobius and Mobius-like patients: etiology, diagnosis, and
treatment options. Clinical Plastic Surgery, 29, 497-514. Vatikiotis-Bateson, E., Eigsti, I.M., Yano, S., & Munhall, K.G. (1998). Eye movement of
perceivers during audiovisual speech perception. Perception & Psychophysics, 60, 926-940.
Vatikiotis-Bateson, E., Munhall, K.G., Hirayama, M., Kasahara, Y., & Yehia, H. (1996)
Physiology-based synthesis of audiovisual speech. In Proceedings of 4th Speech Production Seminar: Models and Data. Autrans, France.
Vuilleumier, P., Armony, J.L., Driver, J., & Dolan, R.J. (2001). Effects of attention and
emotion on face processing in the human brain: an event-related fMRI study. Neuron, 30, 829-841.
Walker-Smith, G.J., Alastair, G.G., & Findlay, J.M. (1977). Eye movement strategies
involved in face perception. Perception, 6, 313-326. Williams, L.M., Loughland. C.M., Green, M.J., Harris, A.W.F., & Gordon, E. (2003).
Emotion perception in schizophrenia: and eye movement study comparing the effectiveness of risperidone vs. haloperidol. Psychiatry Research, 120, 13-27.
Wright, T.M., Pelphrey, K.A., Allison, T., McKeown, M.J., & McCarthy, G. (2003).
Polysensory interactions along lateral temporal regions evoked by audiovisual speech. Cerebral Cortex, 13, 1034-1043.
Yarbus, A.L. (1967). Eye movements and vision. New York, Plenum Press.

26
Yehia, H.C., Rubin, P.E., & Vatikiotis-Bateson, E. (1998). Quantitative association of vocal-
tract and facial behaviour. Speech Communication, 26, 23-44.

27
FIGURE CAPTIONS Figure 1. The circles delimit the regions of interest (ROIs), and the asterisks show the points coded for each feature. Figure 2. This figure shows the spatial distribution of gaze across the task and noise manipulations, showing the total time spent by all of the subjects in all of the trials on a particular screen location. The duration of time is shown by the colored legend. Times are in seconds. Figure 3. Gaze behaviour as a function of task and noise for the three different region of interest (ROI) analyses. 2A and 2B show the percentage of the trial spent fixated in a ROI. 2C and 2D show the number of fixations in a ROI. 2E and 2F show the median durations of fixations in each ROI. Significant differences are denoted by an asterisk. The error bars indicate the standard errors of the mean. Figure 4. The average distance in visual degrees from the centre of a feature of interest as a function of task and noise. Significant differences are denoted by an asterisk. The error bars indicate the standard errors of the mean.

28
Table 1. Mean percentage correct on the emotion and speech tasks in the no-noise and noise conditions. The standard errors of the mean are shown. Emotion task Speech task
No-noise condition 82.8% (SE 3.3)
99.6% (SE 0.2)
Noise condition 81.0% (SE 2.8)
85.5% (SE 1.4)

29
Table 2. Percentage of trial fixated on a ROI as a function of stimulus emotion across both noise levels. The standard errors of the mean are shown in parentheses. Region of Interest Stimulus
Emotion Eyes Nose Mouth
Angry 33.8 (2.8) 26.8 (2.9) 23.6 (3.0) Both Tasks Happy 32.6 (2.5) 26.2 (2.9) 25.6 (3.1) Neutral 35.9 (3.1) 27.2 (3.1) 22.2 (3.0) Angry 41.7 (4.2) 25.7 (4.3) 18.0 (3.6) Emotion Task Happy 38.4 (3.4) 22.5 (3.9) 20.6 (3.7) Neutral 45.4 (4.4) 24.1 (4.3) 15.6 (2.8) Angry 25.9 (3.0) 27.8 (3.9) 29.1 (4.7) Speech Task Happy 26.8 (3.5) 29.8 (4.2) 30.7 (4.9) Neutral 26.5 (3.8) 30.4 (4.4) 28.7 (5.1)

30

31
32

33