spatial variation in surface runoff at catchment scale, the case study of adigela catchment, tigray,...
TRANSCRIPT
Journal of Biology, Agriculture and Healthcare www.iiste.org
ISSN 2224-3208 (Paper) ISSN 2225-093X (Online)
Vol.4, No.17, 2014
1
Spatial Variation in Surface Runoff at Catchment Scale, the Case
Study of Adigela Catchment, Tigray, Ethiopia
Gebreslassie Welu1*
Amanuel Zenebe2 Bas Van Wesemael
3
1.Department of Natural Resource Management, Wolaita Sodo University, Ethiopia
2.Department of Land Resource Management and Environmental Protection, Mekelle University, Ethiopia
3.Georges Lemaître Center for Earth and Climate Research, Earth and Life Institute,Université catholique de
Louvain, Belgium
E-mail of the corresponding author: [email protected]
Abstract
The study was conducted in Adigela catchment with specific objective to examine surface runoff variation in
relation to factors affecting runoff processes. Four representative units were selected where runoff data in terms
of depth is collected while runoff hydrograph analysis was made to determine runoff volume. The hydroraph at
all gauging station was indicated with a trend of rising before the runoff reached peak and started to faill quickly
on the recession limb. The discharge in terms of volume at the outlet was then determined using Hydrochan after
surveying (Total station) the channel cross section. The study indicated that on average a peak discharge of 0.73,
2.14, 0.47 and 1.53 m3/sec from Maykaebo, Mengediweste, Nushteyshintro and Abayshintro were measured
respectively. The statistical result has showed that spatial pattern of the origin of runoff is complex and varies
significantly between sub catchments. From the field experiments, it was found that the key controls on runoff
hydrograph and runoff generation at the catchment scale are shape of the catchment, vegetation cover, and slope
gradient, soil type, area coverage and amount of rainfall. It was also found that SCS CN method was efficient
and can be used to predict runoff in the catchment. Based on the result, it has been recommended to identify
similar hydrological response units in the catchment so as to compare runoff difference among homogenous
units.
Keywords: Catchment, Runoff, Infiltration and Hydrograph.
Introduction
Effective watershed management requires a detailed understanding of hydrologic processes within the watershed
so as to identify management options (Kansheng, 2003). Surface runoff is mainly generated by two mechanisms,
infiltration excess runoff and saturation excess runoff; and the spatial variability of soil properties, antecedent
soil moisture, topography, and rainfall will result in different surface runoff generation mechanisms. Runoff is
thought to be generated mainly by infiltration excess overland flow, and predominantly with in the short burst of
intense rainfall. During these storm bursts, runoff is generated almost everywhere but, when rainfall intensity
declines, overland flow re-infiltrates so that only flow generated close to channels contributes to their flow
(Zhenghui et al, 2003). Infiltration is the process flow of water into the soil profile vertically through the soil
surface and it remains crucial in modeling surface runoff (Suresh, 2008).
The amount of water which leaves a slope is controlled by the connectivity of the runoff generating
areas (Reaney, 2003). Response of the landscape to intense rainfall events is a complex and poorly understood
problem. An understanding of the spatial variability of runoff generated by such storms at the hill slope scale is a
necessary goal if patterns of runoff and soil erosion are to be understood at the field and catchment scale also
(Wainwright et al, 2001). The objective of this study was to evaluate surface runoff variation at catchment scale.
Methodology
The study area (Adigela catchment) is geographically located at 1307’ to 13
010’ N Latitudes and 39
030’ to 39
034’
E Longitudes with an Average annual rainfall and temperature about 477mm and 18.50c respectively and having
an area of around 8 km2.

Journal of Biology, Agriculture and Healthcare www.iiste.org
ISSN 2224-3208 (Paper) ISSN 2225-093X (Online)
Vol.4, No.17, 2014
2
Figure 1. Study area map
Data collection techniques and analysis
Selecting gauging station and Runoff measurement
The study area had four gauging stations. On the first (Maykaebo) and forth (Abayshintro) sub catchments
construction of masonary structures were made to conduct stage measurement while flood mark was used on
second (Mengediweste) and third sub catchments (Nueshteyshintro). Runoff events from June to September,
2010 were specifically monitored. Indeed, daily rainfall was collected from three meteorological stations which
are located nearby and within the study catchment and Runoff data were collected interms of stage from four
monitoring stations namely. Total station was used to measure stream cross-sectional area and then to compute
velocity by using hydrochan software. The hydrochan requires Manning coefficient (‘n’ value) for the channel as
an input. The runoff depth was converted in to discharge using runoff rating curve table produced using
hydrochan software.
T he infiltration measurements were made by means of double-ring infiltrometer (DRI). Because
infiltration excess overland flow is considered to be the dominant runoff process, infiltration test units have been
mapped within each sub catchment and classified according to relevant catchment characteristics at each
monitoring stations.
Figure 2. Infiltration test and runoff monitoring station/stream guage map
Flow path connectivity and Watershed boundary and Land Use
Connectivity was investigated through personal observation and field mapping of major flow paths using
Trimble GPS. Moreover, average slope of each sub catchment were measured using clinometers. The catchment
boundary and land use was mapped and site for the experiment was selected by land surveying using Navigation
GPS and topographic map. Adigudom topographic sheet was used and exported to ArcGIS interface for analysis.

Journal of Biology, Agriculture and Healthcare www.iiste.org
ISSN 2224-3208 (Paper) ISSN 2225-093X (Online)
Vol.4, No.17, 2014
3
The projection was set to Universal Transverse Mercator (UTM) projection system, zone 37 while the spheroid
and datum was referenced to WGS 1984.
Data analysis
Runoff data were analyzed with the help of hydrochan software. Hydrochan requires data on channel slope and
roughness coefficient while velocity, area and discharge was calculated. Area of flow section was measured for
each runoff gauging station. These measurements allowed calculating the runoff discharge for each specific
runoff gauging station. In simulating runoff, SCS CN was used where the CN for each land use and hydrologic
soil group were assigned. The model efficiency and relative root mean square error (RRME) was analyzed using
Nash and Sutcliffe (Van Rompaey et al., 2001). Area under the hydrograph was calculated and summed to obtain
total runoff volume at the outlet of the sub catchment and descriptive statistics were also used for comparison.
Infiltration capacity was analyzed using Horton model that says the infiltration capacity as a function of time, so
the infiltration rate is determined by the initial conditions of soil moisture at the time of soil infiltration is started
to happen while soil textural class was examined using hydrometer. Finally, ArcGIS 9.3 was used to create layer,
analyze the map and conduct spatial analysis.
Results and Discussion
Catchment Land Use
As indicated from the table below the catchment is mainly dominated by various land uses like cultivable, area
closure, grazing, and waste land having area coverage and nearly 2% of the catchment is covered by the dam as
presented below in the table.
Table 1. Classes of Land Use/Cover of the Study Area
S no. Land use type Area (m2) Percentage (%) Description
1 Cultivable land 4508855 57.18 Agricultural land with cereal crops
2 Area closure 1107325 14.04 An area covered with grasses and small
shrubs (Accacia species).
3 Waste land 1524822 19.34 Steep and rocky area (bare land).
4 Grazing land 588003 7.46 Land under grazing.
5 Water body 156446 1.98 Dam area
Figure 3. Adigela Land use map
Catchment characteristics and Hydrological connectivity
The major geological units in the study area are dolerite, shale, limestone and shale intercalation. Limestone is
found at the base overlying by shale. The shale is exposed in the lowlands along the river beds. It consist
intercalations of limestone, lime and marl. It has a multicolored color, and is highly weathered and fractured.
Most of the dolerites occur as sills and dykes occupying the hills and mountains of the area dominantly occurred
in Maykaebo sub catchment and not common on the other sub catchments.
The distribution of landscape elements in relation to each other in influencing transfer pathways and
flow patterns are due to physical connection of water flows through landscapes (Marc et al., 2003). The study
has indicated that the catchment is hydrologically connected to the flow paths. The connectivity of the runoff
generating areas has been mapped and it was observed that each tributary have transferred flow to the outlet.
The catchment is drained by intermittent rivers. It originates from the northern parts towards the southern

Journal of Biology, Agriculture and Healthcare
ISSN 2224-3208 (Paper) ISSN 2225-093X (Online)
Vol.4, No.17, 2014
flatlands and finally joins Adigela dam. The streams are dense at areas of higher slopes and sparse where the
slope is relatively flat. There are still newly formed flow path often originated from poorly maintained soil
water conservation measures (terraces) and such structures are one of the sources for runoff initiation. In general,
Abayshintro has the highest drainage density (4.7 km/km
Mengediweste (2 km/km2) with the least
drainage pattern (Figure 1).
According to (Table 2), Mengediweste covers the highest area coverage proportion with an average
slope of 32.5%. The sub catchment is covered with cultivable lan
land. Maykaebo sub catchment is ranked as second based on area coverage with its land use dominated by waste
land and it is topographically undulated. The upper hill of Maykaebo is geologically basaltic type and
soil texture. Nushteyshintro and Abayshintro have similar land use, geology, soil and vegetation type. The upper
flat land in both sub catchments is cultivable land while the sloppy part is area closure.
Field observation shows that in Mengediwest
terms of transferring water to the out let. The reason is underlined with the hydrological network; the undulated
topographic setup has put the ridges to disconnect the flowing water. Moreover, infilt
change were also somehow disconnecting the flow.
Table 2. Sub catchment characteristics
S.no Sub catchment Area (m
1 Maykaebo 638760
2 Mengediweste 5926241
3 Nushteyshintro 476515
4 Abayshintro 519818
Infiltration capacity
Hortonian overland flow is applicable for impervious surfaces in urban areas, and for natural surface with thin
soil layers and low infiltration capacity as in semiarid and arid lands. Horton suggested the following form of the
infiltration equation, where rainfall intensity
f = fc+ (fo-f
Where: f = infiltration capacity (in/hr), fc
(in/hr), and k = empirical constant (hr
Table 3. Infiltration capacity of soil from infiltration test
S.no Code Infiltration capacity (mm/hr)
1 A 30
2 B 24
3 C1* 9
A=Maykaebo, B = Mengediweste and C
Figure 4. Comparison of observed and predicted infiltration values
The field measurement of infiltration rate and estimation of infiltration rate (Horton Model) decreases
up to a maximum limit of the soil to absorb water; the soil infiltrability is high early in the process and then
gradually decreased to a constant. The cumulative infiltrat
infiltration are affected by initial soil water content, soil texture and uniformity of soil profile and roughness of
land surface
Journal of Biology, Agriculture and Healthcare
093X (Online)
4
flatlands and finally joins Adigela dam. The streams are dense at areas of higher slopes and sparse where the
slope is relatively flat. There are still newly formed flow path often originated from poorly maintained soil
water conservation measures (terraces) and such structures are one of the sources for runoff initiation. In general,
Abayshintro has the highest drainage density (4.7 km/km2) followed by Maykaebo (2.5 km/km
) with the least in Nushteyshintro (0.56 km/km2). The study area has a dendritic
According to (Table 2), Mengediweste covers the highest area coverage proportion with an average
slope of 32.5%. The sub catchment is covered with cultivable land and to some extent area closure and waste
land. Maykaebo sub catchment is ranked as second based on area coverage with its land use dominated by waste
land and it is topographically undulated. The upper hill of Maykaebo is geologically basaltic type and
soil texture. Nushteyshintro and Abayshintro have similar land use, geology, soil and vegetation type. The upper
flat land in both sub catchments is cultivable land while the sloppy part is area closure.
Field observation shows that in Mengediweste sub catchment the upper hill is not well connected in
terms of transferring water to the out let. The reason is underlined with the hydrological network; the undulated
topographic setup has put the ridges to disconnect the flowing water. Moreover, infilt
change were also somehow disconnecting the flow.
Table 2. Sub catchment characteristics
Area (m2) Average slope (%) Drainage density (km/km2)
638760 25.33
5926241 32.5
476515 17.25
519818 17.75
Hortonian overland flow is applicable for impervious surfaces in urban areas, and for natural surface with thin
soil layers and low infiltration capacity as in semiarid and arid lands. Horton suggested the following form of the
rainfall intensity I>f at all times:
fc)e-kt
infiltration capacity (in/hr), fc = initial infiltration capacity (in/hr) at t = 0,
= empirical constant (hr-1
) (Horton, 1933).
Table 3. Infiltration capacity of soil from infiltration test
Infiltration capacity (mm/hr) Sub catchment Textural class (USDA)
Maykaebo
Mengediweste
Nushtey and Abayshintro
A=Maykaebo, B = Mengediweste and C1*=Nushtey and Abayshintro
Figure 4. Comparison of observed and predicted infiltration values
of infiltration rate and estimation of infiltration rate (Horton Model) decreases
up to a maximum limit of the soil to absorb water; the soil infiltrability is high early in the process and then
gradually decreased to a constant. The cumulative infiltration and the time required to achieve constant
infiltration are affected by initial soil water content, soil texture and uniformity of soil profile and roughness of
www.iiste.org
flatlands and finally joins Adigela dam. The streams are dense at areas of higher slopes and sparse where the
slope is relatively flat. There are still newly formed flow path often originated from poorly maintained soil and
water conservation measures (terraces) and such structures are one of the sources for runoff initiation. In general,
) followed by Maykaebo (2.5 km/km2) and
). The study area has a dendritic
According to (Table 2), Mengediweste covers the highest area coverage proportion with an average
d and to some extent area closure and waste
land. Maykaebo sub catchment is ranked as second based on area coverage with its land use dominated by waste
land and it is topographically undulated. The upper hill of Maykaebo is geologically basaltic type and has loam
soil texture. Nushteyshintro and Abayshintro have similar land use, geology, soil and vegetation type. The upper
e sub catchment the upper hill is not well connected in
terms of transferring water to the out let. The reason is underlined with the hydrological network; the undulated
topographic setup has put the ridges to disconnect the flowing water. Moreover, infiltration areas and slope
Drainage density (km/km2)
2.5
2
0.56
4.7
Hortonian overland flow is applicable for impervious surfaces in urban areas, and for natural surface with thin
soil layers and low infiltration capacity as in semiarid and arid lands. Horton suggested the following form of the
= initial infiltration capacity (in/hr) at t = 0, fo = final capacity
Textural class (USDA)
Sandy Loam
Sandy clay loam
Clay loam
of infiltration rate and estimation of infiltration rate (Horton Model) decreases
up to a maximum limit of the soil to absorb water; the soil infiltrability is high early in the process and then
n and the time required to achieve constant
infiltration are affected by initial soil water content, soil texture and uniformity of soil profile and roughness of

Journal of Biology, Agriculture and Healthcare
ISSN 2224-3208 (Paper) ISSN 2225-093X (Online)
Vol.4, No.17, 2014
According to USDA textural classification the infiltration test sites in the catc
to sandy loam, sand clay loam and clay loam. The result has obtained variation in infiltration rate with the
highest infiltration capacity in Maykaebo sub catchment and lowest infiltration capacity in Nushteyshintro and
Abayshintro sub catchments. The soil type on Nushteyshintro and Abayshintro are similar and texturally
classified as clay loam.
Runoff Hydrograph
Hydrograph analysis is often combined with rainfall analysis to investigate how a catchment responds to a
particular rainfall event. Here the dominant factors are catchment characteristics which affect runoff flow to the
outlet and rainfall amount there by affecting the amount of discharge at the outlet.
The hydrograph describes flow as a function of time usually as a time series of flow. It was generated
based on the rainfall events and frequently occurs in the development of a rainfall runoff relationship for a
catchment. It increased in magnitude shortl
maximum rainfall intensity has occurred as shown in the figure below (Figure below). When the discharge
reached its peak, it again started to gradually decline at the falling limb. For t
having small area coverage reaches its peak quickly. This is due to the fact that time of concentration for such
sub catchment is small and with in short period of time streams start to contribute runoff discharge to the str
out let.
Journal of Biology, Agriculture and Healthcare
093X (Online)
5
According to USDA textural classification the infiltration test sites in the catchment are categorized in
to sandy loam, sand clay loam and clay loam. The result has obtained variation in infiltration rate with the
highest infiltration capacity in Maykaebo sub catchment and lowest infiltration capacity in Nushteyshintro and
sub catchments. The soil type on Nushteyshintro and Abayshintro are similar and texturally
Hydrograph analysis is often combined with rainfall analysis to investigate how a catchment responds to a
nfall event. Here the dominant factors are catchment characteristics which affect runoff flow to the
outlet and rainfall amount there by affecting the amount of discharge at the outlet.
The hydrograph describes flow as a function of time usually as a time series of flow. It was generated
based on the rainfall events and frequently occurs in the development of a rainfall runoff relationship for a
catchment. It increased in magnitude shortly after the start of the rainfall event and reached a peak after the
maximum rainfall intensity has occurred as shown in the figure below (Figure below). When the discharge
reached its peak, it again started to gradually decline at the falling limb. For the same rainfall, sub catchment
having small area coverage reaches its peak quickly. This is due to the fact that time of concentration for such
sub catchment is small and with in short period of time streams start to contribute runoff discharge to the str
www.iiste.org
hment are categorized in
to sandy loam, sand clay loam and clay loam. The result has obtained variation in infiltration rate with the
highest infiltration capacity in Maykaebo sub catchment and lowest infiltration capacity in Nushteyshintro and
sub catchments. The soil type on Nushteyshintro and Abayshintro are similar and texturally
Hydrograph analysis is often combined with rainfall analysis to investigate how a catchment responds to a
nfall event. Here the dominant factors are catchment characteristics which affect runoff flow to the
The hydrograph describes flow as a function of time usually as a time series of flow. It was generated
based on the rainfall events and frequently occurs in the development of a rainfall runoff relationship for a
y after the start of the rainfall event and reached a peak after the
maximum rainfall intensity has occurred as shown in the figure below (Figure below). When the discharge
he same rainfall, sub catchment
having small area coverage reaches its peak quickly. This is due to the fact that time of concentration for such
sub catchment is small and with in short period of time streams start to contribute runoff discharge to the stream

Journal of Biology, Agriculture and Healthcare
ISSN 2224-3208 (Paper) ISSN 2225-093X (Online)
Vol.4, No.17, 2014
Figure 5. Runoff hydrograph from gauging station
All runoff hydrographs were characterized with trend reaching peak after the rising limb and started decreasing
at the recession limb. Most of the hydrographs have one peak but rainfa
produce more than one peak because once rain has stopped on the point for the first falling limb, immediately the
rainfall has again started and produced another peak on the same hydrograph.
Runoff/ discharge monitoring Runoff was monitored at each gauging station in which runoff depth was recorded for each rainfall event. The
depth was converted to peak discharge from runoff rating curve and hence runoff volume was determined (Table
9). The continuous flow depth series could be converted to continuous runoff discharge series by means of rating
curves (Descheemaeker et al., 2008). The trends of rainfall and runoff depth were correspondingly observed.
Journal of Biology, Agriculture and Healthcare
093X (Online)
6
Figure 5. Runoff hydrograph from gauging station All runoff hydrographs were characterized with trend reaching peak after the rising limb and started decreasing
at the recession limb. Most of the hydrographs have one peak but rainfall variability during the storm also
produce more than one peak because once rain has stopped on the point for the first falling limb, immediately the
rainfall has again started and produced another peak on the same hydrograph.
Runoff was monitored at each gauging station in which runoff depth was recorded for each rainfall event. The
depth was converted to peak discharge from runoff rating curve and hence runoff volume was determined (Table
th series could be converted to continuous runoff discharge series by means of rating
curves (Descheemaeker et al., 2008). The trends of rainfall and runoff depth were correspondingly observed.
www.iiste.org
All runoff hydrographs were characterized with trend reaching peak after the rising limb and started decreasing
ll variability during the storm also
produce more than one peak because once rain has stopped on the point for the first falling limb, immediately the
Runoff was monitored at each gauging station in which runoff depth was recorded for each rainfall event. The
depth was converted to peak discharge from runoff rating curve and hence runoff volume was determined (Table
th series could be converted to continuous runoff discharge series by means of rating
curves (Descheemaeker et al., 2008). The trends of rainfall and runoff depth were correspondingly observed.

Journal of Biology, Agriculture and Healthcare
ISSN 2224-3208 (Paper) ISSN 2225-093X (Online)
Vol.4, No.17, 2014
Table 4. Average runoff discharge and runoff coefficient at Ma
Date Q m3/sec
11/8/2010 0.41
12/8/2010 0.35
17/08/2010 0.06
22/08/2010 1.61
25/08/2010 0.23
2/9/2010 0.74
Where, Q (m3/sec)= Discharge (m
3/sec), Q (mm) = runoff depth, RC% = Runoff coefficient and RF= Rainfall
(mm)
Figure 6. Rainfall-runoff trend at Maykaebo sub catchment
Table 5. Average runoff/ discharge and
Date Q (m3/sec)
9/08/2010 1.91
9/08/2010 3.06
11/08/2010 0.49
12/08/2010 0.30
13/08/2010 3.14
15/08/2010 4.65
22/08/2010 0.80
25/08/2010 0.11
27/08/2010 3.23
Where, Q m3/sec= Discharge (m
3/sec), Q (mm) =
(mm/hr)
Figure 7. Rainfall runoff trend in the study area
Journal of Biology, Agriculture and Healthcare
093X (Online)
7
Table 4. Average runoff discharge and runoff coefficient at Maykaebo
Volume(m3) Q (mm) RF (mm)
1454.5 2.28 10.21
714.02 1.12 14.88
125.5 0.2 6.21
3897.05 6.1 28.93
586.71 0.92 9.5
3091.32 4.84 18.86
/sec), Q (mm) = runoff depth, RC% = Runoff coefficient and RF= Rainfall
runoff trend at Maykaebo sub catchment
Table 5. Average runoff/ discharge and runoff coefficient at Abayshintro
Volume(m3) Q (mm) RF (mm)
2884.40 5.55 52.94
9496.80 18.27 52.94
2072.80 3.99 10.21
607.01 1.17 14.88
6504.50 12.51 19.77
6966.41 13.40 25.18
1210.40 2.33 28.93
177.12 0.34 9.50
8354.67 16.07 21.40
/sec), Q (mm) = runoff depth, RC= Runoff coefficient and RF= Rainfall
Figure 7. Rainfall runoff trend in the study area
www.iiste.org
RF (mm) RC %
22.3
7.51
3.17
21.09
9.67
25.65
/sec), Q (mm) = runoff depth, RC% = Runoff coefficient and RF= Rainfall
RC %
8.8
28.9
28.5
7.9
48.3
49.1
8.8
2.5
75.1
runoff depth, RC= Runoff coefficient and RF= Rainfall

Journal of Biology, Agriculture and Healthcare
ISSN 2224-3208 (Paper) ISSN 2225-093X (Online)
Vol.4, No.17, 2014
Figure 8. Rainfall runoff relationship in Maykaebo sub catchment
Figure 9. Rainfall runoff relationship in Abayshintro sub catchment
Sub catchment
Maykaebo
Abayshintro
Table 6: Rainfall runoff relationship and coefficient of determination
For the rainfall runoff trend, in all sub catchment runoff is produced at the
event but differing in magnitude due to the catchment characterstics.. From the rainfall runoff relationship
(Figure 8 and 9) the R2 is relatively good in the sub catchments.
A rating table or curve is used to interpolate ru
and discharge. Daily runoff depths and runoff coefficients (ratio of runoff depth to rainfall depth) were then
calculated (Descheemaeker et al., 2006) (Table 9).
Table 7. Peak runoff/ discharge at each
A Q
Date (m3/sec) (m3/sec)
9/8/2010 1.01
9/8/2010 0.39
11/8/2010 0.41
12/8/2010 0.35
12/8/2010 0.41
13/8/2010 1.14
15/8/2010 0.54
17/08/2010 0.06
20/8/2010 0.16
22/08/2010 1.61
22/8/2010 1.61
25/08/2010 0.23
25/08/2010 *
27/8/2010 0.37
28/08/2010 1.35
29/08/2010 1.28
2/9/2010 0.74
Average 0.73
stdev 0.53
CV % 72.06 68.84
Where A= Maykaebo, B= Mengediweste, C=
missing data
From the table above, it is indicated that there is variation in discharge among the sub catchment. The
Journal of Biology, Agriculture and Healthcare
093X (Online)
8
Figure 8. Rainfall runoff relationship in Maykaebo sub catchment
Figure 9. Rainfall runoff relationship in Abayshintro sub catchment
Equation
Y = 3.177 + 6.577
Y = 0.975 + 8.674
Table 6: Rainfall runoff relationship and coefficient of determination
For the rainfall runoff trend, in all sub catchment runoff is produced at the outlet in response to rainfall
event but differing in magnitude due to the catchment characterstics.. From the rainfall runoff relationship
is relatively good in the sub catchments.
A rating table or curve is used to interpolate runoff discharge and produce relationship between stage
and discharge. Daily runoff depths and runoff coefficients (ratio of runoff depth to rainfall depth) were then
calculated (Descheemaeker et al., 2006) (Table 9).
Table 7. Peak runoff/ discharge at each sub catchments
B Q C Q D Q
(m3/sec) (m3/sec) (m3/sec) Average St.dev
3.84 0.62 1.91 1.84
2.91 1.04 3.06 1.85
1.23 0.19 0.49 0.58
0.9 0.19 0.3 0.44
0.83 0.2 0.43 0.47
2.62 0.82 3.14 1.93
6.09 1.49 4.65 3.19
0.56 * * 0.31
* 0.17 * 0.17
0.83 0.3 1.11 0.96
2.02 0.42 0.8 1.21
* 0.05 0.32 0.2
* 0.15 0.11 0.13
4.28 0.9 3.23 2.19
1.8 0.17 0.98 1.07
2.18 0.65 * 1.37
1.87 0.15 0.92 0.92
2.28 0.47 1.53 1.11
1.57 0.41 1.42
68.84 87.84 92.96
Where A= Maykaebo, B= Mengediweste, C= Nushteyshintro, D= Abayshintro and Q= Discharge (m
From the table above, it is indicated that there is variation in discharge among the sub catchment. The
www.iiste.org
n R2
6 0.84
8 0.69
outlet in response to rainfall
event but differing in magnitude due to the catchment characterstics.. From the rainfall runoff relationship
noff discharge and produce relationship between stage
and discharge. Daily runoff depths and runoff coefficients (ratio of runoff depth to rainfall depth) were then
St.dev CV %
1.43 77.72
1.34 72.32
0.45 78.17
0.32 73.15
0.26 56.7
1.12 58.2
2.61 81.72
0.35 113.57
0.01 4.05
0.55 56.75
0.73 60.45
0.14 68.6
0.03 22.06
1.87 85
0.69 64.07
0.77 55.96
0.71 77.48
0.79 65.06
Nushteyshintro, D= Abayshintro and Q= Discharge (m3/sec), *=
From the table above, it is indicated that there is variation in discharge among the sub catchment. The

Journal of Biology, Agriculture and Healthcare www.iiste.org
ISSN 2224-3208 (Paper) ISSN 2225-093X (Online)
Vol.4, No.17, 2014
9
governing factors for the variation in surface runoff are surface area, infiltration, catchment shape, topography
and land management practices. It is also observed that more flow paths are appeared in Abayshintro sub
catchment due to poorly maintained land management intervention (Terraces) total runoff volume is higher in
the absence of conservation measures (Bruijnzeel, 2004), as compared to Maykaebo sub catchment. Maykaebo
and Nushteyshintro sub catchmentds are relatively treated with soil and water conservation measures and
comparatively reduced runoff generation (Nyssen J., 2010). The highest average runoff discharge is recorded
from Mengediweste sub catchment due to higher average slope and area coverage. In case of Makaebo and
Abayshintro sub catchment even though they have almost similar area coverage, the average discharge is
different because of geology, soil texture and infiltration rate. In the former sub catchment it is dominated by
basaltic type which is not active in producing flow path revealing that infiltration is relatively higher. While, the
later sub catchment is dominated by limestone. It is also observed that more flow paths are appeared in
Abayshintro sub catchment due to poorly maintained land management intervention (Terraces) total runoff
volume is higher in the absence conservation measures (Bruijnzeel, 2004), as compared to Maykaebo sub
catchment. Maykaebo and Nushteyshintro sub catchmentds are relatively treated with soil and water
conservation measures and reducing runoff generation (Nyssen J., 2010).
Runoff modeling
A result of the study on runoff depth was simulated using the SCS Curve Number method. In the CN method,
runoff is calculated based rainfall and a CN, which can be looked up in tables. Values differ according to land
use, soil type and hydrological conditions (Descheemaeker, et al., 2008). Infiltration rate were measured and
textural classification was made so as to identify the hydrologic soil group. A CN was assigned for each sub
catchment by considering soil condition as one of the factor governing runoff and runoff depth is predicted.
Table 8. Comparison of measured and predicted runoff depth using SCS CN method in Adigela sub catchment
Date Q (mm) SCS CN (Qm-Qp)^2 (Qm-Qave)^2
9/8/2011 5.55 8.22 7.14 2.34
9/8/2011 18.27 13.01 27.68 125.23
11/8/2010 3.99 0.37 13.06 9.56
12/8/2010 1.17 0.15 1.04 34.94
13/8/2011 12.51 9.75 7.66 29.53
15/8/2011 13.40 6.58 46.57 39.98
20/08/2010 4.71 1.94 7.69 5.61
22/8/2011 2.33 0.86 2.17 22.57
25/08/2010 0.34 0.26 0.01 45.40
29/08/2010 8.52 5.53 8.94 2.08
Where Qm= measured runoff depth in mm, Qp= predicted runoff depth in mm, Qave= average runoff depth in
mm and Q= runoff depth in mm
The efficiency of the model used to predict runoff discharge as a function of runoff depth is evaluated
using equations for Model efficiency (ME) and Relative Root Mean Square Error (Van Rompaey et al., 2001):
�� � 1 � ∑ ���� �������∑ ��������������
--------------------------------------------------------------1
Where, ME is Model Efficiency, N is number of observation, Qmi is the observed value, Qmean is the mean of
observed value and Qpi is the predicted value.
����� � ���∑ �����������
��∑ �����
---------------------------------------------------------------2
Where, RRMSE is Relative Root Mean Square Error, Qmi is observed value, Qpi is predicted value and
N is number of observation.
The perfect model has a Model Efficiency = 1 and a Relative Root Mean Square Error = 0. A good
model has a RRMSE close to zero and a ME close to 1. The Model efficiency is a criterion that determines the
efficiency of the model in comparison with average values. If the Model Efficiency is lower than 0, it is better
not to apply the model but just use average values (Asselman, 2000).
Journal of Biology, Agriculture and Healthcare
ISSN 2224-3208 (Paper) ISSN 2225-093X (Online)
Vol.4, No.17, 2014
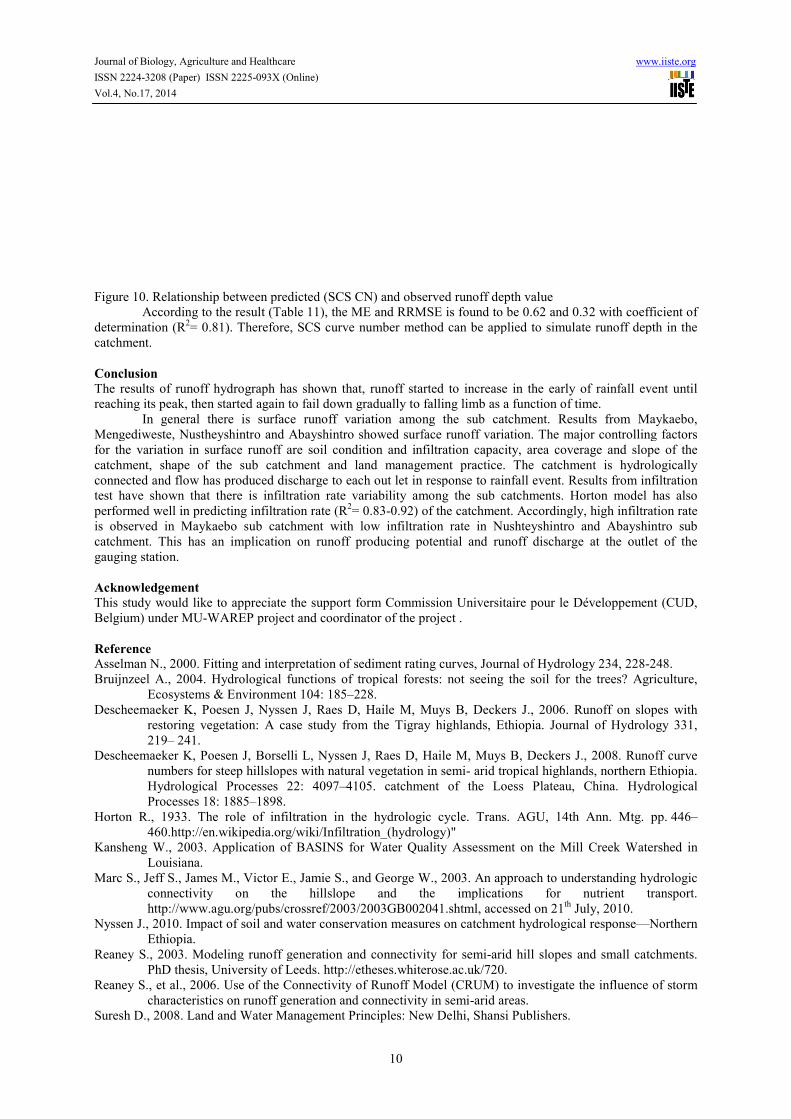
Figure 10. Relationship between predicted (SCS CN) and observed runoff depth value
According to the result (Table 11), the ME and RRMSE is found to be 0.62 and 0.32 with coefficient of
determination (R2= 0.81). Therefore, SCS curve number method can be applied to simulate runoff depth in the
catchment.
Conclusion
The results of runoff hydrograph has shown that, runoff started to increase in the early of rainfall event until
reaching its peak, then started again to fail down gradually to falling limb as a function of time.
In general there is surface runoff variati
Mengediweste, Nustheyshintro and Abayshintro showed surface runoff variation. The major controlling factors
for the variation in surface runoff are soil condition and infiltration capacity, area coverage a
catchment, shape of the sub catchment and land management practice. The catchment is hydrologically
connected and flow has produced discharge to each out let in response to rainfall event. Results from infiltration
test have shown that there is infiltration rate variability among the sub catchments. Horton model has also
performed well in predicting infiltration rate (R
is observed in Maykaebo sub catchment with low infiltrat
catchment. This has an implication on runoff producing potential and runoff discharge at the outlet of the
gauging station.
Acknowledgement
This study would like to appreciate the support form
Belgium) under MU-WAREP project and coordinator of the project .
Reference
Asselman N., 2000. Fitting and interpretation of sediment rating curves, Journal of
Bruijnzeel A., 2004. Hydrological
Ecosystems & Environment
Descheemaeker K, Poesen J, Nyssen J, Raes D, Haile M, Muys B, Deckers J., 2006.
restoring vegetation: A case study
219– 241.
Descheemaeker K, Poesen J, Borselli L, Nyssen J, Raes D, Haile M, Muys B, Deckers J.,
numbers for steep hillslopes with natural vegetation in semi
Hydrological Processes
Processes 18: 1885–1898.
Horton R., 1933. The role of infiltration in the hydrologic cycle. Trans. AGU, 14th Ann. Mtg. pp.
460.http://en.wikipedia.org/wiki/Infiltration_(hydrology)
Kansheng W., 2003. Application of BASINS for Water Quality Assessment on
Louisiana.
Marc S., Jeff S., James M., Victor E., Jamie S., and George W., 2003. An approach to
connectivity on the hillslope and the implications for
http://www.agu.org/pubs/c
Nyssen J., 2010. Impact of soil and water conservation measures on catchment
Ethiopia.
Reaney S., 2003. Modeling runoff generation and connectivity for semi
PhD thesis, University of Leeds.
Reaney S., et al., 2006. Use of the Connectivity of Runoff Model (CRUM) to
characteristics on runoff generation and connectivity in semi
Suresh D., 2008. Land and Water Management Principles: New Delhi, Shansi Publishers.
Journal of Biology, Agriculture and Healthcare
093X (Online)
10
Figure 10. Relationship between predicted (SCS CN) and observed runoff depth value
ing to the result (Table 11), the ME and RRMSE is found to be 0.62 and 0.32 with coefficient of
= 0.81). Therefore, SCS curve number method can be applied to simulate runoff depth in the
The results of runoff hydrograph has shown that, runoff started to increase in the early of rainfall event until
reaching its peak, then started again to fail down gradually to falling limb as a function of time.
In general there is surface runoff variation among the sub catchment. Results from Maykaebo,
Mengediweste, Nustheyshintro and Abayshintro showed surface runoff variation. The major controlling factors
for the variation in surface runoff are soil condition and infiltration capacity, area coverage a
catchment, shape of the sub catchment and land management practice. The catchment is hydrologically
connected and flow has produced discharge to each out let in response to rainfall event. Results from infiltration
e is infiltration rate variability among the sub catchments. Horton model has also
performed well in predicting infiltration rate (R2= 0.83-0.92) of the catchment. Accordingly, high infiltration rate
is observed in Maykaebo sub catchment with low infiltration rate in Nushteyshintro and Abayshintro sub
catchment. This has an implication on runoff producing potential and runoff discharge at the outlet of the
This study would like to appreciate the support form Commission Universitaire pour le Développement (CUD,
WAREP project and coordinator of the project .
Asselman N., 2000. Fitting and interpretation of sediment rating curves, Journal of Hydrology 234, 228
functions of tropical forests: not seeing the soil for the
Ecosystems & Environment 104: 185–228.
Descheemaeker K, Poesen J, Nyssen J, Raes D, Haile M, Muys B, Deckers J., 2006.
restoring vegetation: A case study from the Tigray highlands, Ethiopia. Journal of Hydrology 331,
Descheemaeker K, Poesen J, Borselli L, Nyssen J, Raes D, Haile M, Muys B, Deckers J.,
numbers for steep hillslopes with natural vegetation in semi- arid tropical highlands, northern Ethiopia.
Hydrological Processes 22: 4097–4105. catchment of the Loess Plateau, China.
Horton R., 1933. The role of infiltration in the hydrologic cycle. Trans. AGU, 14th Ann. Mtg. pp.
http://en.wikipedia.org/wiki/Infiltration_(hydrology)"
Application of BASINS for Water Quality Assessment on the Mill Creek Watershed in
., Victor E., Jamie S., and George W., 2003. An approach to understanding hydrologic
connectivity on the hillslope and the implications for
http://www.agu.org/pubs/crossref/2003/2003GB002041.shtml, accessed on 21th
Impact of soil and water conservation measures on catchment hydrological response
Modeling runoff generation and connectivity for semi-arid hill slopes
PhD thesis, University of Leeds. http://etheses.whiterose.ac.uk/720.
Use of the Connectivity of Runoff Model (CRUM) to investigate the influence of
characteristics on runoff generation and connectivity in semi-arid areas.
Suresh D., 2008. Land and Water Management Principles: New Delhi, Shansi Publishers.
www.iiste.org
ing to the result (Table 11), the ME and RRMSE is found to be 0.62 and 0.32 with coefficient of
= 0.81). Therefore, SCS curve number method can be applied to simulate runoff depth in the
The results of runoff hydrograph has shown that, runoff started to increase in the early of rainfall event until
reaching its peak, then started again to fail down gradually to falling limb as a function of time.
on among the sub catchment. Results from Maykaebo,
Mengediweste, Nustheyshintro and Abayshintro showed surface runoff variation. The major controlling factors
for the variation in surface runoff are soil condition and infiltration capacity, area coverage and slope of the
catchment, shape of the sub catchment and land management practice. The catchment is hydrologically
connected and flow has produced discharge to each out let in response to rainfall event. Results from infiltration
e is infiltration rate variability among the sub catchments. Horton model has also
0.92) of the catchment. Accordingly, high infiltration rate
ion rate in Nushteyshintro and Abayshintro sub
catchment. This has an implication on runoff producing potential and runoff discharge at the outlet of the
ersitaire pour le Développement (CUD,
Hydrology 234, 228-248.
functions of tropical forests: not seeing the soil for the trees? Agriculture,
Runoff on slopes with
Ethiopia. Journal of Hydrology 331,
Descheemaeker K, Poesen J, Borselli L, Nyssen J, Raes D, Haile M, Muys B, Deckers J., 2008. Runoff curve
ighlands, northern Ethiopia.
catchment of the Loess Plateau, China. Hydrological
Horton R., 1933. The role of infiltration in the hydrologic cycle. Trans. AGU, 14th Ann. Mtg. pp. 446–
the Mill Creek Watershed in
understanding hydrologic
nutrient transport.
July, 2010.
hydrological response—Northern
and small catchments.
investigate the influence of storm

Journal of Biology, Agriculture and Healthcare www.iiste.org
ISSN 2224-3208 (Paper) ISSN 2225-093X (Online)
Vol.4, No.17, 2014
11
Van Rompaey A., Verstraeten G., Poesen J., and Van Oost K., 2001. Modeling mean annual sediment yield
using a distributed approach. Earth Surface Processes and Land Forms 26 (11), 1221-1236.
Wainwright J., Parsons A., Powell M. and Brazier R., 2001. A new conceptual framework for understanding and
predicting erosion by water from hillslopes and catchments. pp. 607-610.

The IISTE is a pioneer in the Open-Access hosting service and academic event
management. The aim of the firm is Accelerating Global Knowledge Sharing.
More information about the firm can be found on the homepage:
http://www.iiste.org
CALL FOR JOURNAL PAPERS
There are more than 30 peer-reviewed academic journals hosted under the hosting
platform.
Prospective authors of journals can find the submission instruction on the
following page: http://www.iiste.org/journals/ All the journals articles are available
online to the readers all over the world without financial, legal, or technical barriers
other than those inseparable from gaining access to the internet itself. Paper version
of the journals is also available upon request of readers and authors.
MORE RESOURCES
Book publication information: http://www.iiste.org/book/
IISTE Knowledge Sharing Partners
EBSCO, Index Copernicus, Ulrich's Periodicals Directory, JournalTOCS, PKP Open
Archives Harvester, Bielefeld Academic Search Engine, Elektronische
Zeitschriftenbibliothek EZB, Open J-Gate, OCLC WorldCat, Universe Digtial
Library , NewJour, Google Scholar