spatial visualization, attitudes toward mathematics, and
TRANSCRIPT
University of the Pacific University of the Pacific
Scholarly Commons Scholarly Commons
University of the Pacific Theses and Dissertations Graduate School
1985
Spatial Visualization, Attitudes Toward Mathematics, And Spatial Visualization, Attitudes Toward Mathematics, And
Mathematics Achievement Among Chinese-American, Hispanic-Mathematics Achievement Among Chinese-American, Hispanic-
American, And Caucasian Seventh And Eighth Grade Students American, And Caucasian Seventh And Eighth Grade Students
Wenfu Shieh University of the Pacific
Follow this and additional works at: https://scholarlycommons.pacific.edu/uop_etds
Part of the Education Commons
Recommended Citation Recommended Citation Shieh, Wenfu. (1985). Spatial Visualization, Attitudes Toward Mathematics, And Mathematics Achievement Among Chinese-American, Hispanic-American, And Caucasian Seventh And Eighth Grade Students. University of the Pacific, Dissertation. https://scholarlycommons.pacific.edu/uop_etds/3424
This Dissertation is brought to you for free and open access by the Graduate School at Scholarly Commons. It has been accepted for inclusion in University of the Pacific Theses and Dissertations by an authorized administrator of Scholarly Commons. For more information, please contact [email protected].
Spatial Visualization, Attitudes Toward Mathematics, and
Mathematics Achievement Among Chinese-American,
Hispanic-American, and Caucasian Seventh
and Eighth Grade Students
---';
A Dissertation
Presented to
the Faculty of the Graduate School
University of the Pacific
• . -l In Partial Fulfillment
of the Requirement for the Degree
Doctor of Education
by
Wenfu Shieh
August, 1985
·--j
.... ---J ·- __ J 1 i
~ i
---1 '
Spatial Visualization, Attitudes Toward Mathematics, and Mathematics Achievement Among Chinese-American,
Hispanic-American, and Caucasian Seventh and Eighth Grade Students
Abstract of the Dissertation
Many studies have shown that spatial visualization and attitudes toward mathematics are positively and significantly correlated to achievement in mathematics. This study attempted to find out whether these relationships remain consistent across various ethnic groups. This study ____ _
------t-------.-arso attempted to ascertain if spatial visualization ability
l -~"-··---. -~
---i
and attitudes toward mathematics vary among ethnic groups, and if these possible variabilities correspond to the different degrees of mathematical achievement.
One hundred five 7th and 8th grade Caucasian, Chinese-American, and Hispanic-American students were selected from three of the five middle schools in the Stockton Unified School District to participate in this study. The DAT Space Relations Test, the Fennema-Sherman mathematics Attitude Scales, and the Comprehensive Tests of Basic Skills were administered to the students in the Spring of 1985 to assess spatial visualization ability, attitudes toward mathematics, and achievement in mathematics, respectively.
The results indicated that Chinese-American students achieved significantly higher than Caucasian and Hispanic students in mathematics. The results of this study suggested that when English proficiency and family-income levels are controlled, Hispanic students (males and females combined) did not achieve at a significantly lower level than did Caucasian students as suggested in previous studies. Also when all three ethnic groups were combined, males achieved significantly higher than did females in mathematics.
The data of the spatial visualization variable in this study indicated that Chinese-American males scored at a significantly higher level than did Chinese-American females, There was no significant sex difference in Caucasian and Hispanic groups.
Students of both gender and all ethnic groups showed strongly positive attitudes toward mathematics. There were very few significant sex differences or ethnic differences in attitudes toward mathematics.
There was a substantial correlation between spatial visualization and mathematics achievement, When all three ethnic groups were combined, females had a significantly higher correlation between mathematics achievement and spatial visualization than did males. Spatial visualization, ethnicity, and confidence of learning mathematics were significant predictors of mathematics achievement for the student population of this study.
iii
, ~ !
---=---- -- -------- --- ~ --~-- __ l'
~ ~ - l
1 - --4
-- --cl_ - l
; -~--~-~- -~-~~-J
J
ACKNOWLEDGMENTS
I would like to express my appreciation to Dr. Bobby R.
Hopkins for serving as the chairman of my dissertation
committee and his valuable suggestions. I would also like
to thank Dr. David Baral for his encouragement and helpful
advices in my review of literature. I am very grateful to
each member of the committee: Dr. David P. Baral, Dr.
Marjorie C. Bruce, Dr. Deann Christianson, and Dr. Stephen
E. Trotter for their time in reviewing each chapter and
their valuable comments which greatly enhanced the writing
of my dissertation.
I very much appreciate the support of Dr. Roger Reimer,
the Director of Research and Pupil-Service, Stockton Unified
School District, and the assistance of the principals, Mr.
Robert Cossey, Ms. Sarah Turner, Ms. Jean Wadley, and the
school counselors, Mr. Ronald Duncan and Mr. Sal Lopez.
I would also like to thank Mrs. Mary Arbury and Dr.
Paul Hillar for their kindness in consulting and supporting
my efforts in this research. Most importantly, I am truly
appreciative of my wife, Yehching, for her great patience
and indulgence during the time spent on my doctoral study.
ii
__ j i
-l
TABLE OF CONTENT
LIST OF TABLES.
LIST OF FIGURES
CHAPTER
2.
Brief Background Literature.
Statement of the Problem
Research Hypotheses.
Sampling and Testing Procedure
Limitation
Definition of Terms.
Significance of the Study.
Summary.
REVIEW OF THE LITERATURE.
Spatial Visualization.
The Relationship Between Spatial Visualization and Mathematics Achievement
Sex Differences in Spatial Visualization
Page
vii
ix
2
6
8
10
11
11
12
13
15
15
17
in Relation to Mathematics Achievement. 24
Cultural and Environment Influences on the Development of Spatial Visualization and Mathematics Achievement 27
Summary .
Attitudes Toward Mathematics And Mathematics Achievement .
Parental Influences on Attitudes Toward Mathematics •
iv
31
32
34
l
~ ~. J j
CHAPTER
TABLE OF CONTENTS (continued)
Teacher Influences on Attitudes Toward
Page
Mathematics . 35
Influences of Socioeconomic Status on Attitudes Toward Mathematics. 37
l Relationship of Gender to Attitudes Toward _____ ~_-jj-• ____________ _.M"'a.__,t,h"'e~m~ t_Lc_s_,_,_,_,_,_,_,-, 3-7~---
3.
4.
' '
J 5 •
Influences of Cultural and Social Factors on Attitudes Toward Mathematics . 38
Mathematics Achievement and Ethnicity 41
Summary of the Review of the Literature. 47
METHODS AND PROCEDURES.
Sampling
Instrumentation.
Spatial Visualization Ability
Attitudes Toward Mathematics.
Mathematics Achievement
Data Collection.
Statistical Analysis
Summary.
THE ANALYSES OF THE DATA.
Findings
Summary.
DICUSSIONS AND CONCLUSIONS.
Ethnic Differences and Sex Differences in Mathematics Achievement.
v
50
50
55
56
57
61
62
63
66
68
68
94
98
• 9 8
CHAPTER
j -!
TABLE OF CONTENTS (continued)
Ethnic and Sex Differences in Spatial Visualization Ability.
Ethnic and Sex Differences in Attitudes Toward Mathematics
Page
.100
.102
------i-------------T_h_e_Rl!_La_t_Lo_n_s_h-Lp-b-e-tw-e-e-n-M-a-~h-e-ma-t-i-G-8:------------Achievement and Spatial Visualization.
The Relationship between Mathematics Achievement and Mathematics Attitudes.
The Predictions of Mathematics Achievement
Conclusions
Recommendations for Further Studies
REFERENCES.
vi
. 104
• l 0 5
• l 0 6
• l 0 7
.109
. l l l
~~~~l
1
j --~
1
Table
1.
2.
3 .
4.
5 ··1.
5. 2.
5-3.
6.
7- 1.
7 .. 2 .
7 - 3 .
8.
LIST OF TABLES
Number and Ethnicity of the Subjects From Each Schoo 1.
Distribution of the Subjects by Ethnicity. Grade Level. and Sex .
Means and Standard Deviations of Eight Attitude Variables. Spatial Visualization. and Mathematics Achievement Classified by Ethnicity and Gender .
Summary Table for the Analysis of Variance of Mathematics Achievement Scores Analyzed by Ethnicity and Gender.
Summary Table for the Analysis of Variance of Spatial Visualization Scores Analyzed by Ethnicity and Gender.
Summary Table for the One-Way Analysis of Variance of Spatial Visualization Scores Analyzed by Each Gender in Each Ethnic Group
Significance of Differences in Spatial Visualization Scores Among Ethnic and Gender Groups.
Summary Table for the Analysis of Variance of Attitudes Toward Mathematics Usefulness Scores Analyzed by Ethnicity and Sex .
Summary Table for the Analysis of Variance of Attitudes toward Mathematics as A Male Domain Scores Analyzed by Ethnicity and Sex
Summary Table for the One-Way Analysis of Variance of Mathematics As A Male Domain Scores Analyzed by Each Gender in Each Ethnic Group
Significance of Differences in Mathematics As a Male Domain Scores Among Ethnic and Gender Groups.
Summary Table for the Analysis of Variance of Confidence of Learning Mathematics Scores Analyzed by Ethnicity and Sex.
vii
Page
54
54
69
73
73
74
74
77
77
78
78
80
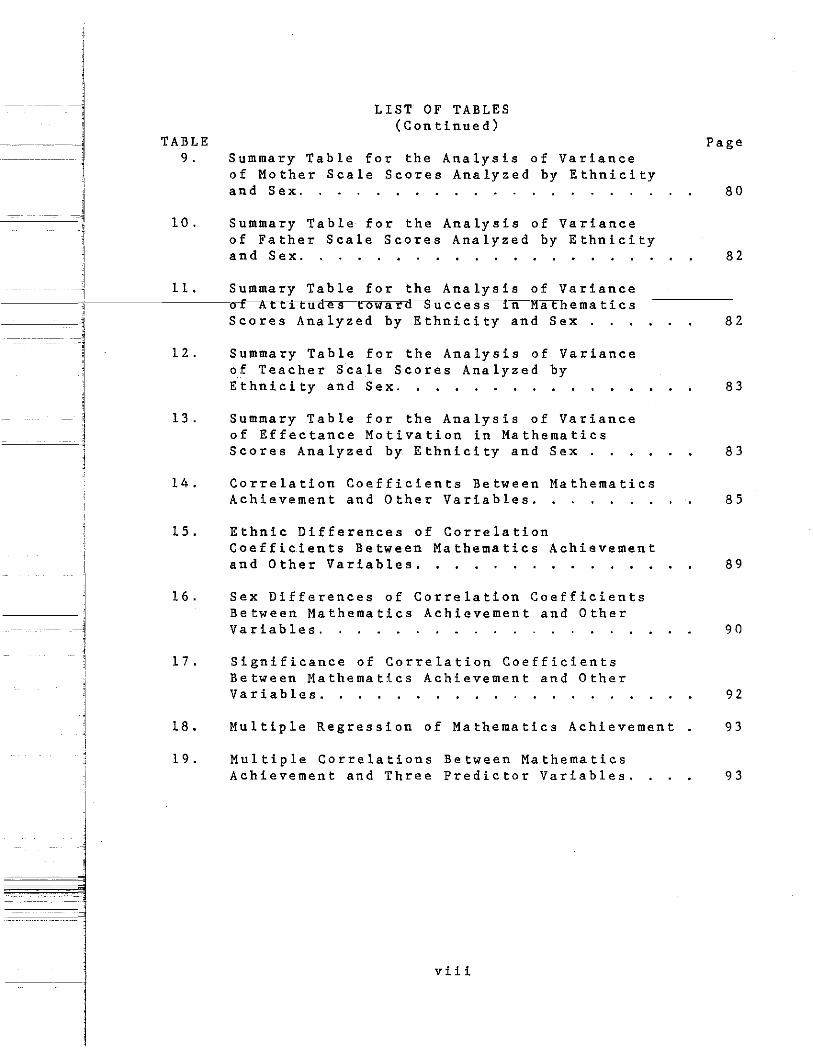
TABLE 9.
10.
LIST OF TABLES (Continued)
Summary Table for the Analysis of Variance of Mother Scale Scores Analyzed by Ethnicity and Sex.
Summary Table for the Analysis of Variance of Father Scale Scores Analyzed by Ethnicity and Sex.
Page
80
82
. -
lll
Summary Table for the Analysis of Variance ------i----------,o-f_A_t_t_i-ttrd...,.--e ow a r d Success fn-Matli e ma t i~c•s~-----------
ll.
.. . 1
~ 1
12.
13.
14.
Scores Analyzed by Ethnicity and Sex .
Summary Table for the Analysis of Variance of Teacher Scale Scores Analyzed by Ethnicity and Sex.
Summary Table for the Analysis of Variance of Effectance Motivation in Mathematics Scores Analyzed by Ethnicity and Sex .
Correlation Coefficients Between Mathematics Achievement and Other Variables.
15. Ethnic Differences of Correlation Coefficients Between Mathematics Achievement and Other Variables.
16. Sex Differences of Correlation Coefficients Between Mathematics Achievement and Other Variables.
17. Significance of Correlation Coefficients Between Mathematics Achievement and Other Variables.
18.
19.
Multiple Regression of Mathematics Achievement
Multiple Correlations Between Mathematics Achievement and Three Predictor Variables.
viii
82
83
83
. 85
89
90
92
93
93
.. _g ---
• ·•··. I•
--~ ~-J ~
~ '
--1
-:c_ ---:c_
--- -- -
---.. -----~-~
LIST OF FIGURES
FIGURE
1. Graph of Interaction of Ethnicity and Gender for Spatial Visualization.
2. Graph of Interaction of Ethnicity and Gender for Attitude Toward Mathematics As A Male Domain.
ix
Page
76
76
I I
---l
I ---- ----- - ___ _]
J 1
-~ ; j 1
~ -~
Chapter l
INTRODUCTION
The degree of achievement in mathematics can be a
function of many elements, which are classified in the
cognitive and affective domains. Spatial visualization
ability, a cognitive variable, may serve as a fundamental
aptitude for math achievement. Attitudes toward mathematics,
as affective variables, may affect one's willingness to learn
more about mathematics, to persist in mathematical study, and
to choose mathematics or mathematics-related areas as future
career goals.
Many studies have indicated that minority students in
the United States, with the exception of Asian-American
students (of whom Chinese-Americans are the majority), often
achieve well below average in mathematics (Anick, Carpenter,
and Smith, 1981; Backman, 1972; Matthews, Carpenter,
Lindquist, and Silver, 1984; Tsang, 1976). In contrast with
other minority students, Chinese-American students have
generally been considered high achievers in mathematics
despite the fact that children of these ethnic groups are
often enrolled in the same schools (Tsang, 1972, 1984).
Differences in spatial visualization ability and
attitudes toward mathematics may conceivably partially
account for the gap in mathematical achievement between these
groups and the divergence of their achievement scores. This
l
j -;
' 1 1_
~ - -- --A -- --
l
study examined the correlations among spatial visualization,
attitudes toward mathematics, and mathematical achievement.
The patterns of spatial visualization ability, attitudes
toward mathematics, and mathematical achievement among ethnic
groups were compared to investigate possible ethnic or gender
distinctions among these variables. Data such as these may
provide bases for improving both academic achievement in
mathematics and mathematics instruction.
Brief Literature Background
Spatial ability has been regarded as an element of
mathematical ability by many researchers. Fennema ( 1 9 7 4)
stated that the relationship between spatial visualization
ability and mathematics is logically evident. In a study of
9th-12th grade students, Fennema and Sherman (1977, p. 66)
concluded that ''spatial visualization was importantly related
to mathematical achievement as much as it related to verbal
ability."
Garrard (1981) found that spatial visualization ability,
as measured by the Differential Aptitude Test (DAT), was
highly related to mathematical problem-solving performances.
Students with high spatial visualization abilities often
learn more than students with low spatial visualization
abilities in mathematical instruction where spatial or visual
presentations are common.
Certain student characteristics are expected to interact
2
explored by studies involving aptitude-treatment
interactions. DuRapau and Carry (1981) found that different
instruction approaches (treatments) would produce better
transfer of geometrical concepts for students with different
visualization abilities.
There are areas in which females and males differ in
-------o------ma-t-h-e-ma-t-i-c-s----a-c·h-i-e-venrern-.--Tni r teen-year- o ra female s tude n t s
----i often perform better in computation and spatial visualization l
l than males but their problem-solving skills are comparable.
' ! In overall comparisons, both genders at this stage start
their middle school mathematics studies with approximately
equal mathematical abilities. However, by the end of high
school, males generally achieve higher in mathematics
(Armstrong, 1981; Fennema and Sherman, 1978).
Research results are inconsistent in terms of the
relationship of spatial ability to sex differences in
mathematical achievement. McGee (1979) found that among high
school seniors, sex differences in mathematics were related
to sex differences in spatial visualization abilities.
However, no relationships between gender and spatial
visualization abilities were found for high school seniors in
two national surveys on achievement in mathematics
(Armstrong, 1981).
Gibson (1953) demonstrated that practice, feedback, and
--=----=:a --_-=4_-----
reward can improve perceptual judgment. Reportedly spatial
visualization abilities tend to be modifiable and can be
shaped by the cultural and social environment. Studies
indicate that socio-cultural factors are highly related to
3
\ the development of spatial visualization abilities and
mathematical achievement (Vernon, 1965; Sherman, 1967;
Fennema, 1977). Lesser et al (1972) found that ethnicity,
socio-economic status, and sex showed substantial
relationships to spatial and mathematical abilities. For
reasons of socio-cultural involvement, Aiken (1973) suggested
that the effects of ethnic group membership needed to be
considered in studies of mathematical ability. However, very
few studies have compared mental abilitie·s, including spatial
ability, across ethnic groups other than for Blacks and
Caucasians.
Attitudes toward mathematics is reported to be another
important factor contributing to mathematical achievement.
Students may start to form their attLtudes toward mathematics
early in elementary school, but the junior high school years,
during which abstract mathematics is introduced, appear to be
the crucial period (Aiken, 1970). Studies show that
attitudes toward mathematics become increasingly less
favorable as students progress in school (Aiken, 1970; Neale,
1969).
It appears that attitudes toward mathematics can be
affected by many external factors. Poffenberge and Norton
! (1959) found that parents could affect their children's
attitudes toward mathematics in three ways: expectations of
! their children's success in mathematics, their own attitudes,
and encouragement to take advanced math courses. It seems
likely that not all parents, and particularly parents of
minority students, have the educational background and
4
knowledge to facilitate their children's decisions with
regard to future education plans (Matthews, 1984).
j ---l
Teachers' attitudes and effectiveness may also be
important in the development of students' attitudes and
performance in mathematics (Aiken 1970; Brassll, Petry, &
j Brooks, 1980). Certain teacher behaviors such as commenting ..... j
-----+1 ------,o-.n,----"r"e"t"u=r"n"e.-ca papers may a 1 s o a f f e c t s tude n t s ' a t t i tude s
(Aiken, 1970).
Socioeconomic status may also affect children'B
attitudes toward mathematics (Spickerman, 1965). Several
studies, however, found that social class has a limited
relationship to student attitudes toward mathematics (Aiken,
1970; Haladyna, Shaughnessy, & Shaughnessy, 1983).
The formation of mathematical attitudes may differ
according to gender. Males tend to outpace females in both
attitudes and performance in mathematics at the junior high
j
1 level and beyond (Aiken, 1970, 1976). Female high school
' students show more and deeper declines in attitudes toward
rna the rna tics (Sherman, 19 8 0) . The stereotyping of mathematics
as a male domain and parental and socio-cultural expectations
may contrubute to the less favorable attitudes toward
mathematics among fe· ale high school students.
Attitudes toward mathematics may be influenced by
cultural environment or racial stereotypes. Some minority
students may not be as likely to perceive the utility of
mathematics in their future schooling or careers as majority
students do. They may also perceive mathematics as a White
domain (Matthews, 1984). Very few studies have been
5
l -- ··! 1
-~1 -~
' ;
I
conducted to explore attitudes toward mathematics across
ethnic groups. It appears that comparative research on
mathematical attitudes is needed to determine whether
differences of attitudes exist among ethnic groups, or
whether these possible differences relate to the divergence
of actual achievement.
achieve at lower levels in mathematics than majority students
in many surveys and studies (Anick, Carpenter, and Smith,
1981; Carpenter, Lindquist, and Silver, 1984). One study
reports that Hispanic students start to lag behind White
students in mathematical performance at the age of nine and
the gap increases as students grow older (Matthews, 1984).
Many Mexican-American junior high students opt to take only
the minimum requirement in mathematics (MacCorquodale, 1980).
Few studies have been conducted with Chinese-American
students addressing their mathematics learning, patterns of
course participation, and performance. Chinese-American,
however, are perceived as high achievers in mathematics
(Stodolsky & Lesser, 1967; Tsang, 1976, 1984).
Statement of the Problem
Mathematics is a fundamental basis for many fields of
study. Students who choose business, science, or engineering
as careers must possess extensive mathematical backgrounds.
Some minority group students in the United States achieve
lower in mathematics than the majority students at every
6
-~
._ .. --- ··j ----
'
-l
- -~
-:cJ
I I
j
-1
academic level. Such a deficiency may demonstrate a possible
lag in cognitive development and/or less concern with
academic success among minority groups.
Many research studies have demonstrated that a positive
correlation exists between mathematics achievement and
spatial visualization (Fennema, 1974; Muscio, 1962; Fennema &
Sherman, 1977; Garrard, 1981). Attitudes toward mathematics
have also been shown to relate strongly to mathematics
achievement and performance. Although students of some
minority groups are generally reported to be poor achievers
in this subject, there is substantial variability among the
students of various ethnic groups in terms of mathematical
performance in school. Some research has been conducted to
discover the factors underlying mathematical learning and
performance, however, several questions in regard to
mathematics achievement among ethnic minority students remain
to be clarified:
1. Are there differences in mathematics achievement among
Caucasian, Chinese-American, and Hispanic seventh and
eighth-grade students when family income-level and English
proficiency are controlled?
2. Does spatial visualization ability differ among the
students of these three ethnic groups? Do the differences of
spatial visualization ability correspond to the differences
of mathematical achievement?
3. Do attitudes toward mathematics differ among these three
ethnic groups? Is attitude related to mathematics
achievement for these three ethnic groups?
7
- --j
-- -- 1 l '
~
~~--I
Research Hypotheses
Based on a review of the available e pirical findings,
the following research hypotheses were investigated:
1. Among seventh and eighth-grade students there are sex
differences and ethnic differences in mean scores among
the three ethnic groups, Caucasian, Chinese-American, and
Hispanic-American, with respect to:
a) math achievement as measured by Comprehensive Tests of
Basic Skills (CTBS) Form U Total Math. Chinese-American
students score the highest. Caucasian students score
higher than Hispanic-American students. There is no sex
difference within each ethnic group.
b) spatial visualization ability as measured by
Differential Aptitude Tests (DAT) Form S Space Relations.
There is no difference among ethnic groups. There are
sex differences within each ethnic group with males
outperforming females.
c) attitudes toward mathematics as measured by
Fennema-Sherman Mathematics Attitudes Scales (FSMAS).
There is no difference between Caucasian and
Chinese-American students. Both groups have more
positive attitudes than Hispanic-American students.
Males have more positive attitudes than females within
each ethnic group.
8

2. There are correlations between CTBS total mathematics
scores and
a) DAT spatial visualization scores of male.students
within each ethnic group. The Pearson correlation
coefficients (r) are positive and significant.
b) DAT spatial visualization scores of female students ~~~~--------
within each ethnic group. The Pearson correlation
coefficients are positive and significant.
c) scores of the FSMAS attitude scales of male students
within each ethnic group. The Pearson correlation
coefficients are positive and significant.
d) scores of the FSMAS attitude scales of female students
within each ethnic group. The Pearson correlation
coefficients are positive and significant for all of the
eight attitude scales.
3. The correlations between spatial visualization ability
and the total mathematics scores differ among these three
ethnic groups. The correlation coefficient of Caucasian
group is higher than those of Chinese-American and
Hispanic-American groups. There is no difference between
Chinese and Hispanic groups.
4. The correlations between the scores of each attitude
scale and the total mathematics scores do not differ
among these three ethnic groups.
5. The variables Spatial Visualization and Mathematics
Attitudes jointly correlate with Mathematics Achievement
to a significantly higher degree than when correlated
individually.
9
1 ' l !. -l
-~
Sampling and Testing Procedures
Three of the five middle schools in the Stockton Unified
School District (SUSD) participated in this study. In order
to be included in the sample, all subjects met four
requirements: l) fully proficient in English, 2) not
-----+----"r"e~c"eOCivlng free or partially free lunches, 3) not enrolled in
special education programs, and 4) have completed at least
four years of education in the United States. Thirty-five
qualified ethnic Chinese students were identified. The same
numbers of Caucasian an' Hispanic subjects were then randomly
selected from the lists of qualified students (see table 2,
chapter 3).
Eleven testing periods including three make-up testing
- i periods for absentees were conducted in the last two weeks of
March, 1985. The Space Relations test of DAT and the FSMAS
were administered to approximately equal numbers of subjects
from each ethnic group in each testing period. As a district
policy, all students in SUSD were required to take the CTBS,
which was administered in the last week of April and the
first week of May, 1985 The Total Math scores were
obtained from the Research Department of SUSD. The
statistical analyses were processed by the Statstical Package
for Social Science (SPSS) on the Burroughs 6700 computer at
the University of the Pacific.
10
-~
=====i I
~ I
--
- - .
.
-
j
\ Limitations
Factors which may limit the generalizability of this
study include:
1. The experimentally accessible population was limited
to Stockton Unified School District. The extent to
which students in this district are representative of
their respective population is unknown.
2 . The motivational level of the students to perform well
on achievement test and to give candid answers to the
affective measures is unknown. An inadequate level of
cooperation by students could obscure the actual
relationships under study.
Definitions of Terms
Chinese-American Student: A student whose parents are of
Chinese-origin.
Hispanic-American Student: A student whose parents are of
Mexican, Puerto Rican, Cuban, Central or South American,
or other Spanish culture of origin --- regardless of race.
Caucasian Student: The student whose parents are of
mainstream White Americans, excluding those of Hispanic
origin.
Spatial Visualization Ability: The ability to visualize a
constructed object from a picture of a pattern and the
ability to imagine how an object would appear if rotated
in various ways. This ability is measured by the Space
11
Relations test of the Differential Aptitude Tests
(Bennett, Seashore, & Wesman, 1974).
Attitudes toward Mathematics: Self-reported attitudes toward
mathematics as measured by the Fennema-Sherman Mathematics
Attitudes Scales (Fennema & Sherman, 1976), The eight
l scales adopted in this study are: attitude towards success
------ll ______ ~l.,_· n,.,__,m"'a"-Ct h_e_ma_t_i_c_s_,_ma-t.h.e.ma-t-i-C-s-a-s-a-ma-1-e-d-o-ma-i-n-, -e-o-n-f-i-d-e-n-c-e----j
in learning mathematics, effectance motivation in
mathematics, usefulness of mathematics, mother scale,
father scale, and teacher scale.
Mathematics Achievement: Achievement in mathematics
computation, concepts and applications as measured by the
Comprehensive Tests of Basic Skills Total Math score
(CTBS, 1982).
Significance of the Study
l ' 1 Differences in the cognitive and affective domains of
learning processes may contribute to differences in
mathematics achievement. Ethnic minority students, who are
reared in various socio-cultural environments, may have
developed these cognitive and affective dimensions in
different ways. High variability in mathematics achievement
has been found to exist among ethnic groups in the United
States.
Many studies have shown that spatial visualization and
attitudes toward mathematics are positively and significantly
correlated to achievement in mathematics. This study
12
l attempted to find out whether these relationships remain
-1 consistent across various ethnic groups. This study also
attempted to ascertain if spatial visualization ability and
attitudes toward mathematics vary among ethnic groups, and if
these possible variabilities correspond to the different
--~ degrees of mathematical achievement. The findings of this I
study were expected to make a significant contribution to the
understanding of mathematics achievement and attitudes in
relation to ethnicity.
Summary
Ethnic minority students, in general, achieve lower than
the Caucasian students in mathematics. However,
Chinese-American students have performed very well in this
subject. Since mathematics is a fundamental basis for many
fields of study, it appears that there is a need to study the
patterns of achievement in mathematics and the related
factors across ethnic groups to understand more completely
factors which affect mathematics learning.
Many studies have shown a positive correlation between
mathematics achievement and spatial visualization ability.
Also, students with higher positive attitudes toward
mathematics tend to achieve at higher levels in mathematics.
It was one of the purposes of this study to examine the
correlations among spatial visualization, attitudes toward
mathematics, and achievement in mathematics across three
ethnic groups.
13

1 ---- - --j
==l ' l
l i
- -- --l !
i j
l J
One-hundred-five 7th and 8th-grade Caucasian,
Chinese-American, and Hispanic American students were
randomly selected from three of the five middle schools in
the Stockton Unified School District to participate in this
study. The DAT Space Relations test, the Fennema-Sherman
Mathematics Attitude Scales, and the Comprehensive Tests of
Basic Skills were administered to the students to assess
spatial visualization ability, attitudes toward mathematics,
and achievement in mathematics, respectively. Stat is tical
analyses were processed by the Statistical Package for Social
Science (SPSS) on the Burroughs 6700 computer at the
University of the Pacific (Nie, et al., 1975; Hull & Nie,
1981).
14
- -~ Chapter 2
REVIEW OF THE LITERATURE
Mathematical achievement has historically been and
remains today a major concern in primary and secondary
_J --------t------'e'-'d='-"u-'c.,a..__.t~i'-o"-"n'-'.~---'R'-"e-'s'-'e"-a"'-'r'-'c-'h"-'e'-"r"-'s_h_a_v_e_e_xami_n_e_d_ma-ny__£_a_c-t-o-r-s-w-h-i-c-h-a-r-e'-----
-j
!
~
relevant to perfor ance in mathematics, among which are
spatial visualization ability, attitudes toward mathematics,
sex, and ethnicity. Those variables are the focus of this
investigation.
This chapter reviews the reported differences in spatial
visualization ability and attitudes toward mathematics which
may partially account for the divergence of mathematical
achievement scores among ethnic groups. Studies regarding
correlations between spatial visualization and attitudes
toward mathematics, and mathematical achievement are also
examined. Findings pertaining to the association of gender
and environmental factors, i.e., socio-economic status and
socio-cultural media, are compiled as they relate to the
development of spatial visualization ability, mathematics
attitudes, and mathematical performance.
Spatial Visualization
A factor analytic study conducted by Gilford and Laney
in the Aviation Psychology Program during World War II
revealed the first clear evidence for the existence of
15
spatial abilities (cited in McGee, 1979). Two spatial
factors were identified as spatial visualization and spatial
relations. Spatial visualization is a factor which involves
visual manipulative ability. People may possess this ability
to perceive the relative changes of objects and to recognize
the new position or appearance after they are moved, turned,
-----+-----'t~w_Ls_t~e_d_,_r_o_ta-te_d_,_f-o-Lde~d-o-r-u-n-f-o-l-d~e-d~--S-p~a-t-i-a-l-!.'e-1-a-t-i-o~n-i-s-~----
·~··~~ 1 J
I ~___c~'-l
described as an ability to discriminate the direction of
motion such as up and down, left and right, and in and out
(Fruchter, 1954; McGee, 1979).
McGee (1979) extensively reviewed the research reports
on human spatial abilities and concluded that there was
strong and consistent evidence to support the existence of
two distinct spatial abilities: visualization and
orientation. Spatial visualization represents the ability
"to mentally manipulate, rotate, twist, or invert a
'
l pictorially presented stimulus object'' (McGee, p.893). It is
1
the ability to comprehend movement in three-dimensional
space.
Spatial orientation, similar to spatial relation
proposed by Gilford and Laney, involves "the co prehension of
the arrangement of elements within a visual stimulus pattern
and the aptitude to remain unconfused by the changing
orientation in which a spatial configuration may be
presented'' (McGee, p.893). However, positive correlations
between tests of spatial visualization and orientation have
been found in many studies. Thus the distinction between
visualization and orientation factors is not clear.
16
i j
- _ _] _J 1
1 - --;
I l
i j
~~1
I l '
\
The Relationship Between Spatial Visualization and Mathematics Achievement
Spatial ability has been regarded, to some extent, as an
element of mathematical ability by many researchers. The
relationship between spatial ability and mathematics is
logically evident, particularly in the area of spatial
visualization (Fennema, 1974).
McGee (1979) described Hamley's definition of
mathematical ability which was suggested in 1935 as ''a
compound of general intelligence, visual imagery, and ability
to perceive number and space configurations and to retain
such configurations as mental pattern" (McGee, p.897).
Kabanova-Meller reported that Russian mathematicians regard
mathematics and spatial abilities as inseparable (Fennema,
1974). Krutetskii analyzed the responses of Russian school
children to mathematical problems. He isolated spatial
concepts as one of the seven basic co ponents of mathematical
ability (cited in Aiken, 1973).
In her review of studies on the relationship between
mathematics and spatial ability, Fennema (1974) found that
geometry is one area of mathematics closely related to
spatial visualization. Although geometry is only one faucet
in the vast mathematical field, many mathematicians believe
that geometrical ideas are involved in all of mathematical
thought. However, some researchers do not agree that the
spatial factor has any significant correlation with
mathematics performance (Fennema, 1974).
17
Researchers have been attemping to explore the issue of
the role that spatial ability plays in mathematical
performance mainly by using two methods: one is to examine
the direct evidence of correlations between spatial ability
and mathematical achievement; the other is an indirect
method, the aptitude-treatment interaction (ATI) study, which
-----+-----a=--t:ct,_eo=m.l' t s to R red i c t the o u t_~_QJ!U!_o_f_c_e_r_t_a_i_n_Ln.s_t_r_u_c_t_i_o.na.l-------
-~
1 "
- --------_1-
treatments in mathematics depending upon student's spatial
ability.
Coleman (1956) attempted to predict mathematical
achievement of college students from the test scores of
spatial relationships, which involve ability to visualize
objects in space. He concluded that ability to perceive
spatial relationships helped in a limited area in
mathematical learning. However, Martin (1966) pointed out
that mathematics could be used as a valid index of spatial
visualization abilities of prospective teachers.
Wrigley (1958) explored the factorial nature of ability
in elementary mathematics. He found that performance in
geometry was connected with spatial ability. Muscio (1962)
found a significant correlation (.52) between mathematical
ability of six-grade students and their scores on a test of
spatial relationships. Several other studies also indicated
that geometrical studies could improve spatial perception.
Gibson (1953) demonstrated that perception could be taught,
and that practice, feedback, and reward were keys for
improving perceptual judgment. Brinkmann (1966) pointed out
that the ordinary school curriculum was ineffective in
18
' l
!
j
' .. '
developing spatial visualization. He used two matched groups
of eighth grade pupils, one as a control group. The
experimental group, which had received three weeks of
programmed instructions in selected geometry concepts and
materials for tactual-kinesthetic visual feedback, showed a
significant increase of spatial ability. Moses (1978)
administered five spatial tests (Punched Holes Test, Card
Rotation Test, Form Board Test, Figure Rotations Test, and
Cube Comparisons Test) and a problem-solving test before and
after nine weeks of instruction on geometric perceptual
techniques. His findings, among others, were: 1) spatial
ability correlated significantly with problem-solving
performance (p < .01); 2) the instruction had a strong
positive effect on spatial ability (p < .01).
Fennema and Sherman (1977, p.66 ) studied 589 female and
644 male 9th-12th grade students, and concluded that "spatial
visualization was importantly related to mathematical
achievement as much as it related to verbal ability.''
Sherman(l979) had similar findings in a longitudinal study
which predicted the mathematical performance of high school . girls and boys. Four hundred thirteen ninth grade students
were tested in 1975, and tested again in 1978 when they were
12th graders. Sherman found that spatial visualization was
the only variable, other than mathematical achievement in
ninth-grade which significantly predicted mathematical
problem-solving scores for girls over a 3-year period (lOth,
llth, and 12th grades). For both sexes, the correlation
19
between spatial visualization and achievement in mathematics
(.48) was as high as the correlation of verbal skills with
mathematical achievement. Sherman also conducted a second
study in 1980, which supported the findings of her 1979
study.
The relationship of spatial visualization with
1980s. Garrard (1981) tested 120 eighth grade students with
Differential Aptitude Test (DAT), and found that spatial
visualization ability was highly related to mathematical
problem-solving performance. Bergeson (1982) also found the
same results. Battista (1981) concluded that students with
high spatial visualization abilities have an advantage over
students with low spatial visualization abilities, and
therefore will learn more during mathematical instruction
where both spatial or visual presentations are commonly used.
Fennema (1974, p.lO) believes that spatial abilities are
clearly linked to Piaget's cognitive developmental theory.
She stated that,
since the only way to add simple mathematical ideas to one's cognitive structure at early developmental levels is by interaction with concrete or pictorial materials which represent those ideas, and since those representations depend heavily on spatial attributes, if for some reason one is hampered in perception of those spatial attributes then one is hampered in learning those early mathematical ideas. Without knowledge of these ideas, it is impossible to learn advanced mathematics. Therefore, spatial ability or the abilities to learn spatially appears to be of utmost importance at early stages of learning.
20
' -- ~
I __j
1
1
1
- ~
j
-~·-~-j
I
Some researchers adopted the aptitude-treatment
interaction (ATI) approach to explore the relationship
between spatial visualization and mathematical achievement.
Cronbach (1957) was the first researcher who examined the
existence of aptitude-treatment interactions. He stressed
that psychologists should deal with treatments and persons
simultaneously. Persons who possess certain characteristics
are expected to have strong interactions with certain
treatment variables. For this reason, Cronbach argued that
we should measure the aptitude which predicts who will learn
better from one curriculum than from another. The ultimate
goal is to place students with particular aptitude patterns
in a group, and give the specially designed instructions
(treatments), which fit the needs of the group.
Also, Eastman and Salhab (1978, p.l52) stated that the
purpose of ATI studies was to answer two related questions:
''can we adapt instruction to patterns of individual
differences among students? If so, for which students is a
particular method of instruction most effective?'' In most
ATI studies, we expect to show that a correlation of spatial
visualization and mathematical achievement exists when
positive interactions are found.
Nelson (1969) designed three different approaches
(treatments) -- verbal, visual, and numerical and eclectic---
for units on function concepts to be taught to twelve eighth
grade math classes. The visual approach was found superior
to the other two approaches. The group taught by the visual
2 1
=-=1 l !
J - - ~
i 1
approach had the highest mean scores on all achievement
tests, significantly higher than the other groups.
Eastman and Carry (1975) randomly assigned eighty
tenth-grade geometry students to two groups: an analytic
treatment group and a graphical treatment group. The DAT
Battery (form A) and the Reference Test for Cognitive
A b i 1 i t i e s we r e us e d to me as ui_e_s_p_a_t_La_l_'LLs_ua_Li_z_a_t_Lo_n_a_n_d __ ~----
general reasoning ability, respectively. An achievement test
of quadratic inequalities was administered after two class
periods of instruction. The results showed that the measure
of spatial visualization significantly predicted the outcomes
of both the graphical and the analytical treatments.
A similar ATI study on absolute value equations was
conducted by Eastman and Salhab (1978) with college students.
Two treatments were adopted: an algebraic treatment via
verbal-symbolic-numeric instruction, and a geometric
treatment through verbal-figural-numeric instruction. The
data confirmed that an aptitude-treatment interaction did
exist.
In another ATI study, Sternberg and Well (1980)
hypothesized that the subjects' pattern of verbal and spatial
abilities would determine their efficiency in solving linear
syllogisms. They divided 144 college students into three
treatment groups: untrained, visualization, and algorithmic.
The dependent variable was solution latency, which was
measured in ''seconds'', for each of the two- and three-term
series problem types. The data indicated that the solution
latencies were significantly correlated with spatial ability
22
- J
-. -·--··---j --------- ------ - -----1
scores of the DAT Spatial Relation Test, but were not
correlated with verbal ability.
DuRapau and Carry (1981) claimed that ATI research
provides better understanding of the relationships between
aptitudes and achievement. They randomly assigned 132
secondary school students enrolled in geometry classes to two
-----~------".t..,r_.e,_,a._...t..,m"e'-'nu.t_g r o u_p_s_:___o_n_e__r_e_c_e.Lv_e_d_f_Lv_e_da_y_s_'_t.r_a.ns_f_o_r_ma-t.Lo_na_l _____ _
j
! j
instruction; the other received nontransformational
instruction during the same period. The Purdue Spatial
Visualization: Rotation Test (PSVR) and The Paper Folding
Test were administered to measure Gestalt visualization, and
analytic processing of spatial tasks respectively. A
significant ATI was found, that is, treatments would produce
better transfer of geometry concepts for students with
different PSVR scores. Analysis of the data also showed a
significant ATI with the Paper Folding test scores.
Battista (1981) found no significant ATI with spatial
visualization ability and different treatments in algebraic
structures. He attributed his results to the short duration
of the experimental treatment and a lack of prerequisite
knowledge of algebraic structure among his subjects. In the
next year, Battista, Wheatley, and Talsma (1982) conducted a
correlational study of spatial visualization and cognitive
development for geometry learning. Spatial ability and
cognitive development accounted for a third of the variance
in grade scores.
23
\ Sex Differences in Spatial Visualization in Relation
to Mathematics Achievement
Two national surveys on achievement in mathematics have
provided valuable information on the development of
mathematical abilities in male and female students. The
first survey, Women in Mathematics Project, was conducted in
-----j----~1._9,_,_7-"8'--'b".Y the Ed u_c_a_ti_o~_C_o_mutLs_sJ._o_n-<>-f-t-h-e-S-t-a-~e-s-(-ECS-)-.---------
National data were collected on achievement and participation
in mathematics for a sample of 1452 13-year-olds and 1788
high school seniors. The second survey was conducted by the
National Assessment of Educational Progress (NAEP) during the
1977-1978 school year. The mathematics abilities of 75,000
9-year-olds, 13-year-olds, and 17-year-olds were assessed
(Armstrong,l981).
Armstrong (1981) has analyzed the data from those two
surveys. His analysis revealed that 13-year-old females
performed better than males in computation and spatial
visualization, but the problem-solving skills of both genders
were nearly equal. In overall comparisons, females and males
at this stage started their high school mathematics with
equal mathematical abilities. However, by the end of high
school, males became superior in mathematics, even when
differences in participation in mathematics classes were
controlled. Females also lost their edge in spatial
visualization.
No sex differences in spatial visualization abilities
were found among high school seniors in those two surveys.
Thus no sex differences in spatial visualization existed, in
24
--J 1
- ... 1 ~~~-~l
I
1
-.···-·---l· -- - -
spite of the observed differences in mathematical
achievement. This finding contradicted McGee's (1979)
argument that sex differences in mathematics were a secondary
consequence of sex differences in spatial visualization and
orientation abilities. It also contradicted the findings of
a review by Maccoby and Jacklin (1974) which concluded that
ma_Le_s_w_e_r_e_s_Lg.nLf.Lca.n.t.Ly-s-u-p.e-r-i-0-1."--i-n-s-pa-t-i-a-L-v-i-s-u-a-l-i-z-a-t-i-o-n------
from puberty to adulthood. The research results were
inconsistent in terms of the influence of spatial ability on
sex differences in mathematical achievement.
Fennema and Sherman (1978) studied sex-related
differences in mathematical achievement and spatial
visualization among eighth-grade and eleventh-grade students.
The data indicated that there were no sex differences in
mathematical achievement in grade eight, whereas males in
grade eleven performed better than females. However, males
and females in both grades did not show a difference in
spatial visualization. Fennema & Behr (1980) reported in his
study of 1320 sixth to eighth grade students that there were
no universal sex-related differences in mathematical learning
and that there were no evidences of sex-related differences
in spatial visualization. Opposite findings were reported by
Garrard (1981) in his study of 120 eighth graders. Garrard
concluded that there were significant sex-related differences
in spatial visualization. Males also outperformed females on
the test of mathematical problem solving.
Sherman (1980) found that male students increased
slightly more than females from eighth grade to eleventh
25
grade in spatial skills, but the difference was not
statistically significant. Interestingly, spatial
visualization tended to be a better predictor of mathematical
achievement for females than for males. Shermann
hypothesized that since spatial visualization ability was
less likely to be problematic for males than females, it
------,j-----w_o_u_Ld_d_i_f_f_e_r_en_t_La_t_e_m_o_r_e_a-mo-tt-g-f-e-ma-l-e-s-t-ha-n-i-t-w-o-u-1-d-a-mo-n-gc_----
l 1
I
males in predicting mathematical performance.
Since the majority of studies have reported a greater
proportion of spatializing males than females, some
researchers have suggested a recessive, X-linked model to
explain these sex differences in spatial test performance.
The recessive, X-linked inheritance means that a trait
carried in a single gene on the X chromosome is X-linked, and
would appear more often in male offsprings than in females.
The common finding that only one fourth of all female scores
are above the median for males on the tests of spatial
ability is consistent with such a hypotheses.
Stafford (1961) studied spatial visualization ability of
104 fathers and mothers and their 58 teen-age sons and 70
daughters. Males were significantly superior to females, for
parents as well as children. He stated that the aptitude of
spatial visualization is a genetic trait which is transmitted
by a sex-linked recessive gene carried by the X-chromosome.
Moses (1978), however, disagreed that spatial ability is
innate. He insisted that spatial ability is modifiable by
instruction.
McGee (1979, p.901) reviewed research of the genetic
26
- -- -j
1
l
l -'l
•
influences on spatial abilities. He concluded that ''spatial
abilities are equally as, or more, heritable than verbal
ability and much less correlated with traditional measures
environmental quality such as level of education and SES.''
Cultural and Environmental Influences on the Development of Spatial Visualization and Mathematics Achievement
of
Spatial visualization, although it might be a hereditary
trait, tends to be modifiable. The cultural and social
environment can shape one's spatial ability. In societies
where females are dominant, for instance, a lack of masculine
models for children to identify with may favor verbal
development at the expense of spatial ability (Vernon, 1965).
Sherman (1967) pointed out that differential practice
may widen the sex gap in spatial visualization ability. Very
few girls are found in mechanical drawing, shop, or
analytical geometry classes in high school. Sources of
differential practice could also extend to out of school
activities, such as tinkering with the car, model building,
sports, driving, direction finding, and map reading, which
seem very likely to be involved in the development of spatial
skills.
The effects of inadequate practice on spatial ability
might also have an impact on girls' mathematical learning
(Sherman, 1967). Fennema (1977) confirmed Sherman's
viewpoint, and also provided evidence that socio-cultural
factors were highly related to the sex-differences in
27
mathematical achievement and spatial visualization.
Because of the obvious involvement of cultural and
social factors, Aiken (1973) recommended that the effects of
ethnic group membership needed to be considered in studies of
mathematical ability. However, relatively few studies have
compared mental abilities, including spatial ability, across
black and whites. Backman (1972) studied patterns of mental
abilities---spatial, verbal, English language, mathematics,
perceptual speed and accuracy, and memory--- among
twelfth-grade Jewish, non-Jewish white, Negro, and Oriental
Americans. He found that ethnicity as well as sex had a
substantial effect on these patterns. Socioeconomic status
was also found to have a statistically significant effect on
the patterns of mental abilities. The data indicated that
Jewish subjects were relatively superior in verbal and
mathematic skills. Non-Jewish white subjects did fairly well
in all measures. Oriental-American subjects performed
distinctively better in mathematics.
The influential study by Lesser, Fifer, and Clark (1965)
compared mental abilities among Chinese-American, Jewish,
black, and Puerto Rican first-grade children in New York
City. The main purpose of this study was to investigate the
differences between social classes and cultural groups in
patterns of intellectual expression. Four abilities---
verbal, reasoning, number, and space--- were asssessed by
means of a revised version of the Hunter College Aptitude
Scales for Gifted Children. The data indicated that there
28
were remarkable ethnic differences in overall levels of
mental ability. SES showed a significant influence on the
level of performance within each ethnic group.
Stodolsky and Lesser (1967) conducted a similar study in
Boston by administering the same tests to blacks and
Chinese-American children. The main findings were consistent
------t-_____ w,_i_t_h_th_e_r_e_s_u_l_t_s~f_o_un.d-i.n-N-e-W-Y-O-t'k-.--Da-t-a-a-n-a-1-y-z-e-d-i-n-bo-t-h------
j
----~--------_ . . ..
1
UH H i -- --
~~---~---l
studies suggested that Chinese-American subjects did best in
spatial, number, and reasoning tests, but did poorly in the
verbal test. Puerto Rican students performed poorly compared
to Chinese-American and Jewish subjects. Black subjects did
well in the verbal test but were poor in the other three
tests.
Another study by Leifer compared 4-year-old children in
New York city from Chinese, Italian, Black, and Puerto Rican
backgrounds on four tests: mosaics, body parts, copying of
geometric figures, and verbal fluency (cited in Loehlin,
Lindzxey, and Spuhler, 1975). Chinese-American children
outperformed the other three groups on the first two tests,
but did poorly on the verbal-fluency measure. Puerto Rican
children performed relatively well on the verbal test.
Werner, Simonian, and Smith (1968) compared 10-year-old
Japanese-American, Hawaiian, Filipino, Portuguese, and
Anglo-Saxon Caucasian children in Hawaii using the Primary
Mental Abilities Test, which measures verbal, reasoning,
spatial, perceptual, and numerical abilities. Caucasian
subjects performed best on most measures with one exception,
in the numerical test they scored second-highest. Oriental
29
\ subjects performed relatively high on spatial and reasoning
tests •
Many researchers agree that the cultural environment has
a significant impact on intellectual achievement. Some even
argue that there is a biological basis for the development of
mental abilities. Dasen (1972) suggested that four factors
could be considered as determinants of develo11ment: l)_a.._ ______ _
biological factor, 2) interaction with the physical
environment, 3) interaction with the social environment, and
4) socio-cultural .factors such as language and education.
Guttman and Guttman's (1963) study of 13000 eighth-grade
students in Israel for different ethnic backgrounds supported
the genetic viewpoint. Majoribanks (1972) assessed cultural
and family environmental influences on the level and patterns
of mental abilities among 11-year-old boys from five ethnic
groups in Canada. He found more cultural impact in the
higher-performing groups than in the lower-performin roups.
Greenfield and Bruner (1969, p.633) stated that ''there
is no psychological phenomenon without a biologically given
organism nor one that takes place outside an environment."
Value orientation, language, and schooling are some of the
factors which influence cognitive growth. Some cultural
environment ''push'' intellectual growth earlier than others
(Greenfield and Bruner, 1969). Vernon (1965) also concluded
that the possibility of genetic differences in aptitudes
H-- ~ among ethnic groups could not be ruled out, although it
tended to be small compared to environmentally produced
differences.
30
-----i ~ ~
--------!
Summary
Spatial visualization ability has been shown to be
positively correlated with mathematics learning and
mathematical achievement. Aptitude-treatment interaction
studies also suggest that specially designed instructional
programs may be effective with the students who have
particular aptitude patterns.
The majority of studies rep~rt superior spatial abilities
in the male population rather than the female population.
These difference between sexes may be caused by
socio-cultural factors, although some researchers attribute
them to genetic traits.
Differences in spatial abilities also were found among
ethnic groups. Spatial visualization abilities. a definite
component involved in mathematics achievement, exist to
transcend nationality, culture, or ethnic background
(Stafford, 1972). The research which was reviewed in this
paper has suggested that spatial abilities may distinguish
different ethnic groups in terms of their mathematical
performance.
3 l
Attitudes Toward Mathematics And Mathematics Achievement
Mathematics has been considered a difficult subject by
most students. Attitudes toward mathematics can be defined
as a general disposition toward the school subject of
mathematics. A student with a favorable attitude toward
mathematics maximizes the possibility that he will persevere
in his efforts in mathematical study, and will elect to take
more courses in mathematics (Neale, 1969; Aiken, 1972;
Echols, 1981; Haladyna, Shaughnessy, & Shaughnessy, 1983).
The relationship between attitudes toward mathematics and
mathematical achievement can be the consequence of a
reciprocal influence in that attitudes affect achievement,
and achievement in turn affects attitudes (Aiken, 1970).
Many researchers have found that there exists a low but
significant and positive correlation between attitudes and
achievement in mathematics in spite of early research
(Spickerman, 1970; Neale, 1969) which found no significant
relationship between these two variables. The reviews by
Aiken (1970, 1976) demonstrated that this positive
correlation is true at the elementary, secondary, college
undergraduate and post graduate levels. Although the
relationship between attitudes toward mathematics and
mathematical achievement are typically not high in elementary
school, achievement was greater at the high school level when
the students' attitudes had remained favorable or had become
favorable since elementary school.
32
-~
I -~
Students may start to form their attitudes toward
mathematics as early as third grade. However, since
' arithmetic is stressed more during the fourth through sixth i
i _, grades, these years are believed to be more influential in
the formation of attitudes toward mathematics (Aiken, 1970).
During these three grades, arithmetic was ranked in the
------t------.mlfi_d_d-te<Jf-a-ris t ortfie most to the least preferred subjects
--··---~ -=l
I -- - ~ -... -. ~~~ -~~-,
____ _j j
-1
~l _j _n
(Herman et al., 1969).
Aiken (1970) pointed out that the junior high school
years were the crucial period in the determination of
attitudes toward mathematics. Callaham (1971) also reported
that grades 6 and 7 were critical in the development of
mathematical attitudes. Approximately fifty percent of the
sixth and seventh-graders experienced a change in their
attitudes toward mathematics during these grades,
Anttonen (cited in Neale, 1969) conducted a longitudinal
study, and concluded that attitudes toward mathematics become
increasingly less favorable as children progress through the
school. Mean attitude scores declined one standard deviation
during six years (fifth or sixth grade to eleventh or twelth
grade).
Junior-high is the period during which abstract
mathematics are introduced. According to Piaget's cognitive
theory, the junior-high students who have not progressed from
the concrete operational sta•e to the formal operational
stage may encounter difficulty in dealing with abstract
mathematics, such as algebra. It is not surprising that more
negative attitudes toward mathematics develop as students
33
= -==-1 I 1
---- l
---- ~
"
ascend the academic ladder (Aiken, 1970).
Personality, anxiety, and intellectual factors may play
major roles in the formation of attitudes. Some social and
cultural factors are also crucial. Many researchers have
devoted themselves to the study of environmental influences
in the determination of attitudes toward mathematics.
status, sex, and cultural factors are reviewed below.
Parental Influences on Attitudes.Toward Mathematics
Parental attitudes toward mathematics are important in
setting the climate for the development of their children's
attitudes. Poffenberge and Norton (1959) conducted a study
of 390 college freshmen. They found that parents could
affect their children's attitudes toward mathematics in three
ways. First, the father's or mother's expectations are
imp or tan t. The child will make less effort in mathematics if
not expected to do well by his parents. Second, the parent's
own attitudes, particularly the father's attitudes, are also
important. Finally, parental encouragement to take
mathematics courses in high school play a role. Burbank's
(1970) research on 411 seventh-grade students supported the
suggestion that parents's attitudes toward mathematics were
significantly correlated with their children's attitudes
toward mathematics. However, no parental influence on their
children's attitudes toward mathematics was found in an
earlier study (see Aiken, 1961).
A review by Aiken (1972) concluded that mothers had more
34
influence on the attitudes of both sons and daughters toward
- --_J mathematics because children spend more time with their
1 mother. However, the father's expectation of success had
more influence than the mother's expectation on the son's
attitudes toward mathematics. Echols (1981) found that
attitudes of both fathers and mothers were significantly
------t-----co-r-t'e-1-a-~e-d-w-i-~h-~h-e-i-r-c-h-i-l-d~-en-'-s-a-t-t-i-tu-d-e-s-t-ow-a-r-d------------
j ---~
- ~
'
mathematics.
Research using parental interviews and questionnaires to
determine the extent of the influences of parental attitudes
and values on the attitudes of their seventh-grade children
toward mathematics has been conducted by several researchers.
The results suggests that: 1) for both sexes children's
attitudes are positively correlated with the amount of
mathematics education desired by their parents, 2) the
importance which parents place on grades and parents' demands
for higher grades is positively correlated with boys'
attitudes but negatively correlated with girl's attitudes, 3)
for both boys and girls, positive attitudes are associated
with the parental view that competition is good and necessary
in the modern world (cited in Aiken, 1970).
Teacher Influences on Attitudes Toward Mathematics
A teacher with positive attitudes toward mathematics may
be able to change the negative attitudes of the students who
come to his classroom (Poffenbergh and Norton, 1959). Some
particular teacher behaviors, such as failing to announce
examinations or writing comments on returned papers, may also
35
-1
l l
~~--------i 1
-~ 1
~--- _.---- --- -
--------
~-_= -_-;-~---'-~---------_: _--__ -_ j
affect students attitudes (Aiken, 1976).
A review by Aiken (1970) concluded that the teacher's
attitudes and effectiveness were important in the
determination of students' attitudes and performance in
mathematics. Brassell et al (1980) also stated that
teacher's attitudes toward mathematics determined pupils'
need a teacher's considerate attention and also need positive
experiences with mathematics, which may in turn improve their
attitudes toward this subject. Jackson (1974) found that the
culturally and educationally disadvantaged students
experienced a significantly positive change in attitudes
toward mathematics when they were taught by teachers who were
sensitive to their problems.
Aiken (1972) stated that improvement of teachers'
attitudes toward mathematics could promote the formation of
more positive attitudes by their students. In another review
Aiken (1976) found that prospective teachers' attitudes
toward mathematics could be improved by taking specific
courses in this subject.
Haladyria, Shaughnessy and Shaughnessy (1983) conducted a
study of over 2000 students in grades 4, 7, and 9. They
found strong associations between teacher quality measures
and the students' attitude toward mathematics. The general
findings at grade 4 were that attitudes toward mathematics
were not significantly affected by any variables. However,
fourth graders' attitude toward mathematics was more
influenced by teacher quality than other factors. Teacher
36

~
l --- --j
- ---- -~
' ---'!
I )
I
I ~ _···n .... l
...
\ quality significantly influenced the determination of
students' attitudes toward mathematics at grade 7 and 9
levels.
Influences of Socioeconomic Status on Attitudes Toward Mathematics
There is little research on the effects of SES on
attitudes toward mathematics. Spickerman (1965) found no
statistically significant relationship between these two
variables, but pupils from families of higher SES tended to
have more favorable attitudes than those from families of low
SES. Also, high mathematical achievers tended to come from
higher SES families. Haladyna, Shaughnessy, and Shaughnessy
(1983) also concluded that social class has a limited
relationship on children's attitudes toward mathematics.
Also, Aiken (1970) found that SES has more influence on
verbal subjects than on mathematics.
Relationship of Gender to Attitudes Toward Mathematics
At the elementary level, girls and boys do not differ in
their liking for arithmetic. Beginning at the
Secondary-school level, however, males are found to have a
significantly more positive attitudes toward mathematics than
females (Aiken, 1970). The fact that boys outpace girls in
both attitudes and achievement in mathematics at the junior
high level and beyond is frequently found in research (Aiken,
1976).
Sherman (1980) conducted a longitudinal study on the
37
change of attitudes toward mathematics in girls and boys in
grades 8-ll. Females showed less improvement and greater
declines in attitudes toward mathematics when they were
tested on measures of confidence in learning mathematics,
their teachers' attitudes toward them as learners of
mathematics, the usefulness of mathematics, and effective
of mathematics as a male domain was an important causal
variable influencing later mathematical performance. This
attitude negatively affected females' mathematical learning.
Besides, studies had shown that the female adolescents'
deeper interest in human relationships and their greater
social interests might interfere with an interest in
mathematics and with concentrated effort in this subject
(Nevin, 1973; Fox, 1974). Also, differing socio-cultural
expectations and the effect of same-sex role modeling might
contribute to sex differences in attitudes toward
mathematics.
Influences of Cultural and Social Factors on Attitudes Toward Mathematics
Attitudes· which reflect the individual's experience with
environment are learned. Some attitudes, therefore, can be
shaped within the cultural group. Values, child-rearing
beliefs and practices, sex roles, population density,
parental behaviors, and ethnic minority stereotypes may
partially influence individual attitudes (Davidson and
Thomson, 1980). Race-related differences in attitudes toward
38
mathematics have been found in some studies. Minority
students in the United States are less likely than majority
students to perceive the utility of mathematics in their
future schooling or careers. Furthermore. minority students
may hold a racial stereotype. in which mathematics is
perceived as a white domain (cited in Matthews. 1984.)
One study showed that although performing poorly in
mathematics. black students have been found to rate
mathematics as the most important subject, to like
mathematics. and to indicate a greater desire than their
peers to take more mathematics. But they. actually took fewer
advanced mathematical courses than white students (Anick,
Carpenter, and Smith. 1981). Matthews (1981) also found
race-related differences in the enrollment patterns of high
school students.
In general. parents of minority students had received
less education than the majority students' parents. One
study has shown that many minority parents did not have the
knowledge to help their children, either with homework or
with decisions about future education plans (cited in
Matthews. 1984.)
It is a common belief that a lack of concern about
academic work by Hispanic parents may in turn negatively
influence their children's attitudes toward schooling,
resulting in low achievement. However, a study. which was
conducted in San Francisco. showed that Hispanic high school
students believed that their parents considered it important
to learn mathematics and English (Fernandez, Espinosa, and
39
Dornbusch, 197 5). In addition, they did not see their
parents as being unconcerned about their school performance.
Nevertheless, their mathematics achievement was considerably
~··· lower than Whites and Asian-American students. Hispanic
students' performance in mathematics and other school
1 subjects did not fit the image of students who cared deeply
-----i-----a-bo-u-t-s-~h-oo-1-i-n-g-, -a-l-to-ho-u-g-h-to-h-e-p-o-o-r-1-y-d-e-s-i-gn-e-d-q-u-e-s-t-i-o-nn-a-i-r-e--;,c-----
--!
! ~~
i 1
---~
I
which was used in that study may have invalidated the
measurement of Hispanic students' and their parents'
attitudes toward mathematics.
Stereotypes of the mathematics ability of various ethnic
groups may have an impact on the formation of attitudes
toward mathematics among ethnic minority students. Davidson
and Thomson (1980, p.43) stated that ''the larger the
difference between the social type of groups A and B, on
characteristic X, the more likely it is that X will appear in
the stereotypes of the two groups''. However, very few
studies have been conducted to test this hypothesis. It
appears that comparative research 6n attitudes toward
schooling, or toward a specific subject such as mathematics,
is needed to determine whether differences of attitudes do in
fact exist, or whether these differences contribute to the
variance of actual achievement.
In summary, attitudes toward mathematics have a moderate
but positive relationship with mathematical achievement.
Males begin to have more positive attitudes than females at
the secondary-school level. Attitudes toward mathematics can
be learned, and also can be shaped by many environmental
40
1 I
-- --~
! ----j
1
j ~
factors. Attitudes toward mathematics can be improved by
higher family expectations, considerate and encouraging
teachers, and awareness of mathematics as an essential
elements in many prestigious careers. In order to improve
mathematical achievement, ethnic minority students may need
to facilitate positive attitudes toward this subject through
1 ----~1-----m~a~ny-c-h-a-nn-e-t~--------------------------------j
--!
1
I ~
" --i 1
Mathematics Achievement and Ethnicity
There is far more research on Hispanic students than on
Chinese-American students regarding their performance in
mathematics. In general, the mathematical performance of
Chinese-American students is superior to that of Hispanic
students at every school level. Chinese-American students
perform equally well or, in many instances, better than White
students.
The 1978 National Assessment of Educational Progress was
conducted with a national sample of over 70,000 9-, 13- and
17-year-olds. A wide range of basic mathematics exercises
were administered to these students during the 1977-1978
school year. Anick, Carpenter, and Smith (1981) analyzed the
assessment data of Blacks and Hispanics. They consisted of
14 percent and 5 percent of the total sample, respectively.
The results showed that both groups of students performed
significantly below the national average at each age
assessed.
Slight improvement in performance was found in the 1982
National Assessment of Educational Progress in Mathematics.
41
1 i
l --- -j
However, Hispanic and Black students continued to perform
! significantly below the national average (Matthews, -. ~-··. -·- --! -------- --- ------, Carpenter, Lindquist, and Silver, 1984).
A study comparing the mathematical achievement of 709
white, black, Asian-American and Spanish-surname students
found that Blacks and Chicanos were lower than Whites and
into high school, and that their relatively low achievement
continued through high school (Fernandez, Espinosa, and
Dornbusch, 1975). It was also found in the same study that
Chicanos performed better than Blacks, and therefore, these
two groups should not be treated together as a homogeneous
group.
Very little empirical evidence could be found to support
the hypothesis that achievement differences exist at a
younger age. It is also not clear at what age Hispanic
students start to lag behind white students in mathematical
achievement. A study by John et al. stated that significant
differences were often found between minority and majority
populations after age 9, and that the gap increased as
students grew older (cited in Matthews, 1984). Although it
was reported that nine-year-old Hispanic and black students
d-_l
--_:- -- - -
······· -==
made a modest improvement in the national assessments between
1972 and 1978, they still scored significantly below the
national average (Anick, Carpenter, and Smith, 1981).
An examination of patterns of course participation may
help to explain why minority students achieve increasingly
poorer as they grow older. Poor achievement might discourage
42
them from taking more mathematics courses than the minimum
requirement. Lack of advanced training in mathematics could
result in even poorer achievement in the future.
Although the data gathered from the 1977-78 National
Assessment of Educational Progress does not conclusively
demonstrate a causal relationship between mathematics courses
------c----~-~a-k-e-n-an-d-a-c-h-1 eve men e, tne--d iff e renee be tween the b 1 a cks and
J
j l
-~
~~c __ ,-
-=~-~ =-·
the national averages is considerably narrowed when course
background is held constant (Anick, Carpenter, and Smith,
1981). Hispanic enrollment_ in mathematics probably follows
the pattern for black students, although National Assessment
did not summarize course background data for this group of
students (Valverde, 1984). Another study showed that many
Mexican-American junior high students do not continue to take
more advanced mathematics after they have completed the
minimum requirement (MacCorquodale, 1980).
The factor of language problems may hamper Hispanic
students' acquisition of mathematical concepts. Valverde
(1984) stated that approximately half of the 4.2 million
Hispanic students in American schools are of limited
proficiency in English. However, there are few teachers abfe
to communicate with these students, let alone to teach them
the concepts of mathematics in their native language. It is
reasonable to assume that the lack of English proficiency
could hamper the learning of mathematical concepts and
skills.
Another potentential factor related to poor mathematical
achievement may be the cognitive style of Hispanics.
43
Research has revealed that children from certain cultural
groups may be more field dependent than those from other
groups (Ramirez and Castaneda, 1974). Mexican-American
students are reported to be more field dependent than are
White children (Ramirez & Castaneda, 1973; Ramirez &
Price-Williams, 1974; Knight, Kagan & Nelson, 1978; Roberge &
----~t-' ----F-1-exe-r-, -1-98_3_)-.--A rev iew-byW on g (1982) demon s t r a t e d t h a t
·~~~I field-dependent-independent measures are significantly
correlated with mathematical achievement. Roberge & Flexer
(1983) indicated that field~independent students score
significantly higher than field-dependent students in
mathematical concepts, problem-solving tests, and total
mathematics achievement tests.
Different pedagogical considerations may be required to
fit the pupil's cognitive style. In this country, however,
"mathematics education has been organized to favor the
-l field-independent rather than the field-dependent child; that
I is, open-ended discovery rather than definite outcomes,
individualization of instruction rather than group learning,
and competitive more than cooperative activities" (Valverde,
1984, p.l27). This pedagogy may have partially contributed
to the poor achievement of field-dependent pupils.
Few studies have investigated the mathematics learning
and performance of Chinese-American students. In some
studies, Chinese-American students were included in the
group of Oriental or Asian-American students. In an early
large scale study, a group consisting mainly of Chinese and
Japanese, labeled Oriental, which represented 1% of the
44
i ~ - 1
sample, scored slightly lower (0.1 s.d.) than the White
students in mathematics (Mayeske, Okada, Beaton, Cohen, &
Wisler, 1973).
Backman (1972) reanalyzed the mathematics achievement
data, which was collected on 400,000 students in grades 9
through 12 in 1960, and found that Orientals achieved at the
--l ------i'-----:s-a-me-1-e-v-e-1-a-s-J-ew·i-s·h-w-hi: t e s an a-nrgn e r t li an non-Jew i s h
j ---·-]
-l l
-- '!
' ~-~---l
j
-- ~ '
-~ j
j l
_-_-_j
=----
-'-_-_-__: ____ -._-__ -_ -_=-___ ,-,:,_-__ -~---_ ---~--- ._
'
Whites. A study, which was cited earlier in this review,
compared Chinese, Jewish, Black, and Puerto Rican first-grade
students' mental ability, and found that Chinese and Jewish
students performed at the same level, and that both performed
significantly better than the other two groups (Stodolsky &
Lesser, 1967).
Tsang (1977) tested 323 seventh- and eighth-grade
Chinese students in California, and compared the results with
scores obtained by the National Longitudinal Study of
Mathematical Ability (NASMA). He found that the mean score
for Chinese students in his study was 14.69, compared to the
national average of 11.28 in the NASMA.
Hsai reviewed data from Scholastic Aptitude Test (SAT)
and Graduate Record Examination (GRE). She found that
Oriental high school seniors scored an average of 517 on the
mathematics part of the SAT in 1971-1972, compared to the
mean score of 505 for White students. She also found that
Asian-American had a hi~her average quantitative score in the
GRE (566) than White Americans (525), who scored higher than
the total mean of all American candidates (512) (cited in
Tsang, 1984).
45
l -I
; The 1982 Census showed that over 70 percent of Asian
Americans live in metropolitan areas. A large number of
Asian-American students are enrolled in urban school
districts where the overall achievement level is low.
Asian-American students, however, achieved significantly
higher than Blacks and Hispanics in the same school districts _]
----i:_ ----(Ts-a-n-g-, -1-98-4-)--c.--------------_:_ __________ _
_ J Several factors may contribute to the high mathematical
achievement of Asian-American students. One major factor is
that Asian-Americans tend to invest heavily in education to
offset discrimination and obtain upward mobility. Asian
parents as well as the school counselors also tend to advise
Asian-American students to choose science and
mathematics-related careers that do not depend heavily on
English proficiency. Opportunities of securing higher
socioeconomic status in scientific and technical fields may
have encouraged them to pursue the study of mathematics. In
addition, many Asian immigrants are well-trained engineers
and scientists in their mother lands, many come as students
and decide to stay in this country. Their offspring are
likely to be influenced to pursue a mathematics-based career
by their parents. These extrinsic factors may contribute to
their relatively high mathematical achievement (Tsang, 1984).
In summary, Hispanic students perform below the national
average. This may partially be due to their preferred
cognitive style and to a language barrier. They have a
tendency not to take advanced mathematical courses, which may
hinder them from future learning and achievement.
46
-~ -------1 ----------------1
~
Chinese-American students generally achieve quite well in
mathematics. This remains true even when samples are drawn
from the same school districts. There is no research
evidence to prove that Chinese-American students have higher
innate mathematics aptitude. Some social, cultural and other
extrinsic factors have been found to be related to the
Students.
Summary of the Review of the Literature
Many studies have shown that spatial visualization and
attitudes toward mathematics are positively correlated with
mathematical achievement. Spatial visualization is
considered to be one of the components of mathematical
abilities, and therefore is inseparable from mathematics.
Positive attitudes toward mathematics will facilitate
perseverance in one's efforts at mathematical study and may
result in higher achievement.
Both spatial visualization and attitudes toward
mathematics are shaped by many extrinsic factors. Cultural
and social factors may exert influences on the formation of
spatial visualization ability as well as attitudes toward
mathematics. Ethnic differences have been found in these two
variables, but no empirical study has been conducted to
identify the factors which may contribute to the differences
among ethnic groups. Parents' educational background,
expectation of their children's academic success, and their
47
--j
!
= ~-~ ~ l
~j J
j
- - .. l ~ -··~. .. . I
own attitudes toward mathematics influence their children's
attitudes toward mathematics and their mathematical
performance. Teachers' quality and attitudes have similar
effects on students' attitudes toward mathematics and
mathematical achievement.
No study designed to find a relationship between spatial
visualization and socio-economic status (SES) has been
reported. No relationship between SES and attitudes toward
mathematics has been found, although pupils from high SES
families tend to have more favorable attitudes than those
from low SES families.
Sex is a major factor in the determination of spatial
visualization ability as well as attitudes toward
mathematics. Sex-role stereotypes decrease the female's
opportunity of engaging in activities, in which people use
and practice spatial visualization abilities. Females are
found performing better in spatial visualization in
elementary school, but males become superior in spatial
visualization from puberty to adulthood. The belief in
mathematics as male-domain may hamper conceivably the
formation of positive attitudes toward mathematics among
female students. There are no sex differences at the
elementary school level, but males begin to show
significantly more positive attitudes toward mathematics at
the secondary school level, as well as higher achievement in
mathematics.
Significant differences are found in mathematical
achievement between minority students and majority students.
48
However, performance is not homogeneous among various
minority groups, Hispanic students, while achieving
significantly lower than the majority White students, are
slightly better than Black students as far as mathematical
achievement is concerned. Chinese-American students achieve
higher than average in mathematics, which remains true even --- ~
-------j-----·w-h-e-n-~h-e-s-a-mp-1-e-s----a-r-e-d~..-rr-f rom tli e t r a a 1 t i on a 1 1 ow a chi e vi n g
urban school districts.
Cultural and environmental factors have been found
influential in the formation of spatial visualization ability
and attitudes toward mathematics, which in turn aff~ct
mathematical performance in schools. However, very few
studies have been conducted to assess these two variables
among students of various ethnic background in relation to
their mathematical achievement. Studies in this area will
___ j facilitate understanding of ethnic minority students'
-l cognitive and affective background, and hopefully might
1 j
1
suggest the implementation of specially designed curriculum
and pedagogy in order to fit their particular cognitive and
affective styles.
-~ -~'- __ - __ j
--
--
l
49
Chapter 3
METHODS AND PROCEDURES
This study was designed to investigate relationships
among the three variables of spatial visualization ability.
attitudes toward mathematics, and mathematics achievement for
Caucasian. Chinese-American, and Hispanic-American seventh
and eighth grade students. Three measurement instruments,
the Differential Aptitude Space Relations Test (DAT) FormS,
the Fennema-Sherman Mathema~ics Attitude Scales (FSMAS), and
the Comprehensive Test of Basic Skills (CTBS) Form U were
used to assess these three variables for the selected
students.
The main purposes of this study were to investigate
potential ethnic differences with respect to these three
variables, and to examine the relationships of achievement in
mathematics to spatial visualization ability and attitudes
toward mathematics within and among ethnic groups. This
study also assessed the multiple correlation between
achievement scores of CTBS Total Math and scores of the DAT
Space Relations' test and the eight scales of FSMAS.
Sampling
The accessible population consists of seventh and
eighth-grade Caucasian, Chinese-American, and
Hispanic-American students in the Stockton Unified School
50
- -=l ------- -~
1
~ 1 1 '
--- ~
-j ~
I -- -~ -:-_! .... · ·.··. .. . . .-- . -- ----- ---- -"
_· __ · _-__ ·· _, ------- --- - ---~
District who are not from low-income families. The subjects
have received formal education in the United States for four
or more years, thus ensuring some commonality of education
background. The sample consists of twenty female and fifteen
male students from each of the three ethnic groups.
Stockton Unified School District, which serves
approximately 26,000 students, is one of the largest
districts in the state of California. The district operates
five children centers, 27 elementary schools, four middle
schools, three regular high schools, five alternative high
schools, and several other ~ypes of schools and centers.
Seventh and eighth-grade students attend four middle
schools (school B, C, D, E) and a fifth school which serves
students from kindergarten to eighth grade (school A). Since
the school district is under a court ordered desegregation
plan, many students are bussed to schools outside their
neighborhood. Among the total of 3939 middle school
students, there are 28 percent Caucasian, 34.9 percent
Hispanic, 15.3 percent Black, 15.6 percent Asian, 5.5 percent
Filipino, and 0.7 percent American-Indian Students.
Since the parental occupation and familiy income are
confidential, it was not possible to determine the parents'
socio-economic status or to select the subjects from families
of specific income levels. Therefore, a decision was made to
use the ''eligibility for free lunch progra as a criterion
for selection. The students who are receiving or are
qualified to receive free or partially free lunch were
considered to come from low-income families. Those students
51

were excluded from this study.
To enhance the homogeneity of education background, the
subjects were required to be either native English-speaking
students or bilingual students who were classified as
fluent-English-proficient (FEP) students by the school
district. In addition, students who were enrolled in special
education classes were not included in the sample.
In summary, in order to be included in the sample, all
subjects met four requirements: 1) fully proficient in
English, 2) not receiving free or partially free lunches, 3)
not enrolled in special edu~ation programs, and 4) have
completed at least four years of education in the United
States.
The research proposal was submitted and approved by the
Research Department of the Stockton Unified School District
(SUSD) in the February of 1985. Administrative support was
sought from the principals of all five middle schools of the
__ J
~ district. However, the principal of school E was reluctant
1 ;
~ to participate in this study and there were no qualified
ethnic Chinese students in school D. Therefore, the sample
was drawn from the other three schools, labelled A, B, C.
Qualified ethnic Chinese students were first identified
with the assistance of the school-site administrators and the
school counselors. After selection of the Chinese sample,
equal numbers of qualified male and female students in
seventh and eithth-grades were then randomly selected for the
Hispanic and Caucasian groups. The computer printouts of the
ethnic census, the English proficiency report, and the lunch
52
I I
i ~
\ program report were used in the identification of the
qualified students. The special education teachers in each
school were also consulted for the identification of special
education students so that they could be eliminated from the
list of potential subjects for the study. Table 1 and Table
2 describe the distributions of the subjects by school site,
ethnicity, grade level, and sex.
The decision to select students at the middle school
level as the target population was made based on the
following considerations:" 1) Attitudes are less stable in
the elementary school than are in secondary school (Aiken,
1 9 7 2 ) ; 2) Grade six and seven are critical grades in the
development of mathematics attitudes (Callahan,l971); and 3)
Males start to outperform females in mathematical achievement
at the middle school level (Shermann, 1980).
53
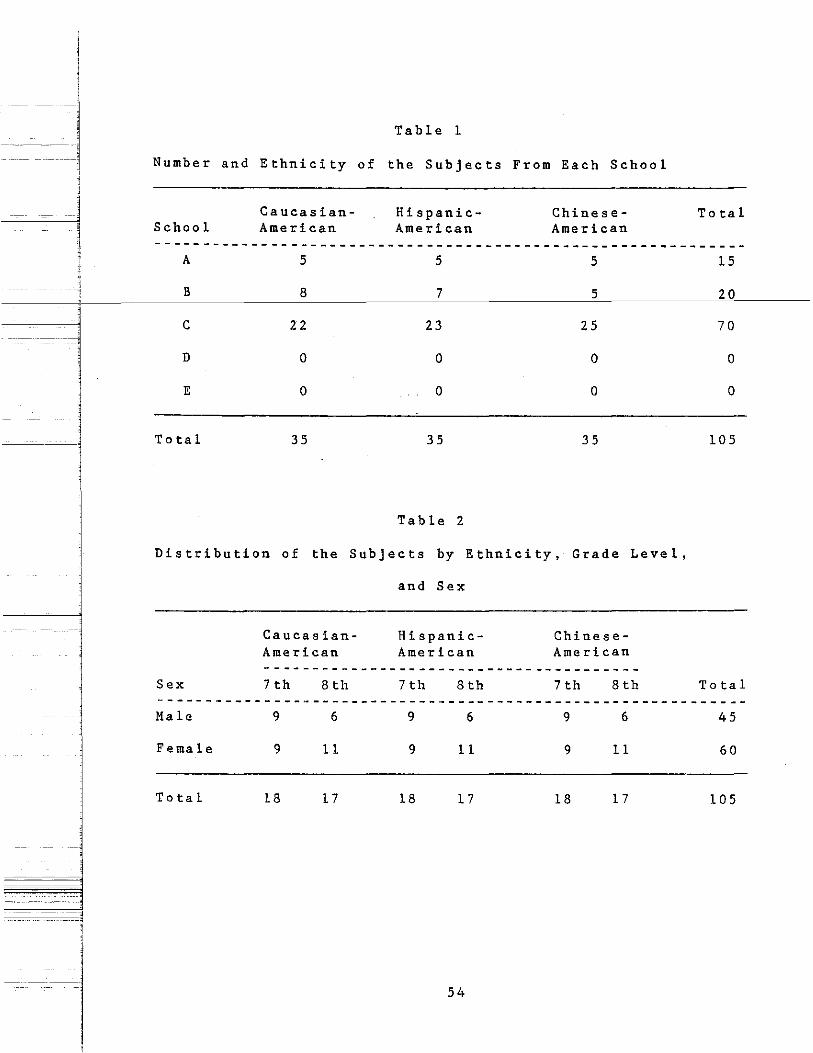
,, i
- -"1
Table 1
Number and Ethnicity of the Subjects From Each School
School CaucasianAmerican
HispanicAmerican
ChineseAmerican
To ta 1
-------------------------------------------------------------A 5 5 5
B 8 7 5
c 22 23 25
D 0 0 0
E 0 0 0
To ta 1 35 35 35
Table 2
Distribution of the Subjects by Ethnicity, Grade Level,
Sex
CaucasianAmerican
and Sex
HispanicAmerican
ChineseAmerican
---------------------------------------7th 8th 7th 8th 7th 8th
15
20
70
0
0
105
Total
---------------~---------------------------------------------Male 9 6 9 6 9 6 45
Female 9 11 9 11 9 11 60
Total 18 17 18 17 18 17 105
54
1 i ! 1 j
~l
I j
-~~1
j
Instrumentation
The variables under study were spatial visualization
ability, attitudes toward mathematics, and achievement in
mathematics. Spatial visualization ability is the ability to
manipulate relationships between objects or components of
objects in three-dimensional space. This a b i 1 i ty___!i_a_s, ________ _
expected to show a strong correlation with the CTBS
mathematics achievement scores. Differences in this ability
among ethnic groups were also expected. The Space Relations
(SR), a subtest of a widely used educational and occupational
aptitude test, the Differential Aptitude Test (DAT), was
selected to measure this ability.
A second variable under study, mathematics attitudes, is
a general disposition toward the subject of mathematics.
Attitudes toward mathematics can potentially be shaped by
many factors and some influential figures such as parents and
teachers. The Fennema-Sherman Mathematics Attitude Scales
(FSMAS), which is reported to be a reliable and valid test
instrument, was used to assess this variable.
A third variable, mathematics achievement, is a general
assessment of arithmetic skills, mathematics concepts, and
mathematics applications. A standardized test, Comprehensive
Tests of Basic Skills (CTBS) Form U, was adopted by the
Stockton Unified School Distrcit (SUSD) to test all the
students at the end of each school year. The "total math"
scores of CTBS were used as a measurement of achievement in
55
mathematics.
Spatial Visualization Ability
Spatial visualization ability involves visual and mental
l
1 manipulative abilities to perceive the relative changes of
l objects and recognize their new position or appearance after ~j
I they are moved, turned, twisted, rotated, folded or unfolded
(Fruchter, 1954; McGee, 1979). It is the ability to
comprehend movement in three-dimensional space.
Spatial visualization ability is ''an ability needed in
such fields as drafting, dress designing, architecture, art,
die-making, and decorating, or, whereever there is need to
visualize objects in three dimensions" (Bennett et al, 1974,
p 0 9) 0 Recent research findings have also shown that spatial
visualization ability is an element of mathematical ability,
and is closely related to mathematics achievement (Fennema,
1974; Battista, 1981; McGee, 1979).
Although males are generally perceived as better
performers in spatial ability, some researchers have found no
sex-related differences in this ability (Armstrong, 1981;
Fennema-Sherman, 1978). Some research findings demonstrated
that spatial visualization ability can be influenced by the
cultural and environmental factors (Aiken, 1973; Backman,
1972). However, very few studies have been conducted to
investigate the differences of spatial ability across ethnic
groups.
The variable of spatial visualization ability was
56
measured by DAT-SR. This test was designed to evaluate the
ability to manipulate things mentally and to create a
structure in one's mind from a plan (Bennett et al, 1974).
The exact time allowed for this test is twenty-five minutes.
This Space Relations test has been described as an
unspeeded test. Hence, the "split-half" procedure is used to
estimate the reliability of this test. The reliability
coefficient for eighth-grade females and males are .89 and
.90 respectively.
The validity of Space Relations Test is supported by its
predictability of mathematies grades or mathematics
achievement scores. The test manual as well as many research
studies indicate that the test results are significantly
related to students' mathematics achievement (Bennett, et
al., 1974; Fennema & Sherman, 1977; Sherman, 1979).
Attitudes Toward Mathematics
Mathematics attitudes are the mental disposition with
regard to the subject of mathematics. The decision to elect
more courses in mathematics or the efforts to persevere in
mathematical studies may be affected by attitudes toward
mathematics.
Many studies have demonstrated that attitudes toward
mathematics are highly correlated to achievement in
mathematics (Aiken, 1970, 1976; Haladyna, Shaughnessy, &
Shaughnessy, 1983). Therefore, the study of these attitudes
as well as the factors related to these attitudes may enhance
57
J
1 our understanding of mathematics achievement. ----~
--.. - _ _j --- -- i
Studies also show that ethnic minority students in
general achieve lower in mathematics as compared to the
' majority White students. The study of attitudes toward
mathematics across ethnic groups may enhance our
1
understanding of mathematics achievement for ethnic minority
students. i
FSMAS was designed to assess the students' attitudes
toward mathematics, and to measure some relevant factors with
regard to these attitudes. This instrument consists of nine
scales. The Anxiety Scale was not used in this study since
it correlates .89 with the Confidence Scale and thus seems
redundant. The remaining eight scales were adopted for this
study. The function of each scale follows (Fennema, &
Sherman, 1976, p. 2-5):
'
d 1
1. Attitudes toward Success in Mathematics Scale
This scale was developed "to assess the motive to
avoid success in mathematics'', and ''to measure the
I degree to which students anticipate positive or
negative consequences as a result of success in
mathematics."
2. Mathematics as a Male Domain Scale
1 This Scale is intended ''to measure the degree to
J
j which students see mathematics as a male, neutral, or
female domain." -
. 3. Mother Scale and
. l 4. Father Scale
These two scales were designed ''to measure students'
58
perception of their mother's/father's interest, --~
• encouragement, and confidence in the student's
ability" in mathematics.
5. Teacher Scale
This scale was designed ''to measure students'
perceptions of their teachers' attitudes toward them
as learners of mathematics."
6. Confidence in Learning Mathematics Scale
This scale is intended 11 to measure confidence in
one's ability to learn and to perform well on
mathematic a 1 tasks.-"
7. Effectance Motivation Scale in Mathematics
This scale is intended "to measure effectance as
applied to mathematics. The dimension ranges from
lack of involvement in mathematics to active
enjoyment and seeking of challenge."
8. Mathematics Usefulness Scale
This scale was designed "to measure students' beliefs
about the usefulness of mathematics currently and in
relationship to their future education, vocation, or
other activities.''
Each scale consists of six positively stated and six
negatively stated items. There are five response
alternatives: strongly agree, agree, undecided, disagree and
strongly disagree. Each response is given a score from 1 to
5. In each scale, except the Male Domain Scale, the weight
of 4 and 5 are given to the responses which are hypothesized
to represent positive attitudes toward mathematics. The
59
-~
!
i ~--~-.. -.. -i
J l
Mathematics as a Male Domain Scale is weighted differently so
that the student scores higher if he or she has less sex
stereotyping in mathmatics. The total score of each scale is
the cumulative score of 12 items in the scale. The higher
the score, the more positive the attitudes the student
possess.
To establish content validity, each of the two authors
independently wrote items representing the dimension of each
scale. The resulting 173 items, 18 to 22 per scale, which
were agreed by both authors were randomly distributed into
one instrument and were administered to 367 hgih school
students. Selection of items in the final versions of the
scales were based on the following criteria: 1) high
correlation of the item with the total score for each sex; 2)
higher standard deviations of item scores for each sex; 3)
consistency of the result scores of the item with the
theoretical construct of a scale; 4) the ability to
differentiate mathematics and non-mathematics students.
The FSMAS have been widely used in educational research
since it was developed in 1976. Many studies have
demonstrated that the test scores are positively correlated
to achievement in mathematics (Fennema & Sherman, 1977, 1978,
1980; Sherman, 1980).
Reliability of each sacle is determined by split-half
method. Reliability coefficients range from .86 to .93. The
content validity is adequately presented by the authors of
this instrument. The total testing time is about twenty-five
minutes.
60
-- ------~ Mathematics Achievement
Mathematics achievement is a mastery of the skills and
concepts comprising mathematics. In this study the
operational measurement of achievement was the Total Math
scores on a standardized test, CTBS Form U. The mathematics
portion of CTBS is consists of two tests: mathematics
computation, and mathematics concepts/applications. Each
test score and the composite score (total mathematics) are
given. Since CTBS is regularly administered to the students,
the results were obtained from the Research Department in
Stockton Unified School District.
To establish the content validity, state and district
curriculum guides, textbook series, instructional programs,
and norm-referenced and criterion-referenced assessment
instruments were reviewed. From the analyses of those
educational materials, the content for CTBS Form U was
defined. A staff of professional item writers developed two
to three times as many items as would be needed. Readability
for each item was determined by using widely-used formulas.
The teachers who administered the Tryout Edition were also
l asked to review the items and provide comments. All test
~ items were reviewed by educators to eliminate possible
__ ]
=---
--- --
--- --- --------- ------- -------- ---- --- - -
----=-- ---~----------
ethnic, racial, age, and gender bias. The final selection of
test items were based on the following considerations: 1) to
minimize standard error of measurement; 2) to maximize fit;
and 3) to minimize ethnic, racial, age, and gender bias (CTBS
61
Preliminary Technical Report, 1982).
Reliability is estimated by the internal consistency
coefficients (Kuder-Richardson formula 20). Reliability
coefficients of these two tests for seventh and eighth-grade
students range from .90 to .93. Reliability coefficients of
the composite range from .94 to .96 (CTBS, 1984), The
content validity is adequately presented in the technical
report.
Data Collection
Parents' permission was requested for each child in
schools A and C by means of letter written in English and/or
the parents' native languages. Follow-up contacts were made
by telephone to the parents who did not return the written
permissions. All the parents of the sample students gave
their permissions for their children to participate in this
study. Since the school administrators in school B believed
that participation in this study was relevant to education,
the letters of permission were viewed as unnecessary for the
subjects from this school.
The school libraries or multiple-purpose rooms were
reserved in advance for the administration of the tests. The
tests were scheduled in period 1,3, or 6. Students were
called in from other classes. There were about equal numbers
of students from each ethnic group in each testing period.
Eight regular testing periods and three make-up testing
periods for absentees were conducted in the last two weeks of
62
i
--- ~
~~~------1
J
---j
j
March, 1985.
The Space Relations test and the Fennema-Sherman
Mathematics Attitude Scales were administered in each testing
period by the investigator. The administrations of both
tests followed the directions as described in the booklets
for each instrument. At the beginning of each testing
period, the school counselor or the principal introduced the
author to the students, briefly described the purpose of this
study, assured anonymity, and asked for their coorporation.
The two tests took a total testing time of approximately
sixty minutes. Each answer- sheet for SR and FSMAS was
hand-scored by two people to assure the accuracy of the
scoring.
The CTBS Form U was administered to all the junior high
students in the Stockton Unified School District by district
personnel in the last week of April and the first week of
May, 1985. The investigator hand scored the mathematics
portion of the CTBS Form U for the students in the sample.
Statistical Analyses
Descriptive statistics were provided for all the
variables involved in this study. Other appropriate
statistical procedures also were used to analyze the data.
The significance level was set at 0.10. Statistical analyses
were accomplished by using the Statistical Package for the
Social Sciences (Nie, et al., 1975; Hull & Nie, 1981) on the
Burroughs 6700 computer at the University of the Pacific.
63
Based on the available empirical research findings, the ---- --- _ _____j
following research hypotheses were investigated:
Research Hypotheses I. Among seventh and eighth-grade
students there are ethnic differences in mean scores among
J the three ethnic groups, Caucasian, Chinese-American, and l
1
Hispanic-American, with respect to:
(a) mean scores of the total math of CTBS Form U. i
Chinese-American students are expected to score the highest
while Caucasian students score higher than Hispanic-American
studnents. There is no sex difference within each ethnic
group.
(b) mean scores of Space Relations (SR), DAT FormS. There
is no difference among ethnic groups. There are sex
differences within each ethnic group with males outperforming
females.
(c) mean scores of each scale of FSMAS. There is no
difference between Caucasian and Chinese-American students.
Both groups have more positive attitudes than
Hispanic-American students. Males show more positive
attitudes than females within each ethnic group.
Null hypotheses were stated for each research
hypothesis. Two-way ANOVA procedures were used to test the
null hypotheses with sex and ethnicity as factors and mean
scores of each scale as dependent variable.
Research Hypotheses II. There are significant correlations
between CTBS total math scores and
(a) SR scores of male students within each ethnic group. The
64
Pearson correlation coefficients (r) are positive and
significant.
(b) SR scores of female students within each ethnic group.
The Pearson correlation coefficients are positive and
significant.
(c) scores of each scale of FSMAS of male students within
each ethnic group. The Pearson correlation coefficients are
-----i------,p.,o>s<n:i ve a na---si gni-f1 cant for all of the eight attitude
scales.
(d) scores of each scale of FSMAS of female students within
each ethnic group. The Pearson correlation coefficients are
positive and significant for all of the eight attitude
scales.
The Pearson Correlation Coefficient (r) was used to
measure these relationships. T-tests were used to test the
significance of r.
-1 1
Research Hypotheses III. The correlations between SR scores
and the total mathematics scores of CTBS differ among
Caucasian, Chinese-American, and Hispanic-American groups.
The correlation coefficient of the Caucasian group is higher
than those of Chinese-American and Hispanic-American groups.
There is no difference between Chinese and Hispanic groups.
I Three null hypotheses were stated. Z-test for
independent samples was used to test the null hypotheses.
~~"-'-- _-- _'
-------- ---
~~--~-~~~----~- --
--~----l Research Hypotheses IV. The correlations between the total
mathematics scores and the scores of each attitude scale (r)
65
j l
---------~
l -------- ! '
~ ; j
J
I - ~
I
I '
I
\ do not differ among three ethnic groups.
A null hypothesis was stated for each hypothesis.
Z-tests for independent samples were used to test each null
hypothesis.
Research Hypothesis V. The variables Spatial Visualization
and Mathematics Attitudes jointly correlate with Mathematics
Achievement to a significant higher degree than when
correlated individually.
Summary·
Some research reports have shown ethnic differences in
mathematics achievement (Anick et al., 1981; Backman, 1972;
Matthews et al., 1984; Matthews, 1984). The purposes of this
study w•re to examine the patterns, the relationships, and
the possible ethnic distinctions of attitudes toward
mathematics, spatial visualization ability, and achievement
in mathematics among ethnic groups. It is assumed that such
data provide bases for improving math achievement as well as
instructional methodologies.
This study was conducted in coorporation with the
Stockton Unified School District which has high percentages
of ethnic minority students. Students who met the selection
criteria of 1) fully proficient in English, 2) not receiving
free or partially free lunches, 3) not enrolled in special
education programs, and 4) have completed at least 4 years of
education in the United States were selected to participate
in this study. A total of 105 7th and 8th-grade students
66
representing three ethnic groups were tested by using DAT-SR
test, CTBS Form U, and FSMAS.
Descriptive statistics were provided for all the
variables involved in this study. Appropriate statistical
procedures were used to test the five research hypotheses.
All statistical analyses were accomplished by using the SPSS
on the Burroughs 6700 computer at the University of the
Pacific.
--.-.. -... -~
j
-1
67
-I i _,
l j
Chapter 4
THE ANALYSES OF THE DATA
The data consisted of ten measurements from female and
male students in grades 7 and 8 from three ethnic groups.
l There was one sjlatial visualization va_r_i_a_b_Le_,_o_n_e ___________ _ ------~--~------~~~~
~-l l
mathematics achievement variable, and eight mathematics
attitude variables. Descriptive statistics were reported
for females, males and for each ethnic group. Means and
standard deviations are listed in Table 3.
The data were analyzed in relation to each hypothesis
of the study. The null hypothesis was stated first. The
results of the statistical analyses were then used to test
the null hypothesis. The level of significance was set at
.10 for all tests.
Findings
Statistical hypothesis I is concerned with ethnic and
sex differences of the mean scores of the ten variables in
this study. A two-factor analysis of variance (two-way
ANOVA) was used to explain how the data were related to
ethnicity and sex. The Least Significant Difference (LSD)
method of multiple comparisons was applied when the null
hypothesis of no difference in a two-way ANOVA had been
rejected for ethnic differences.
68
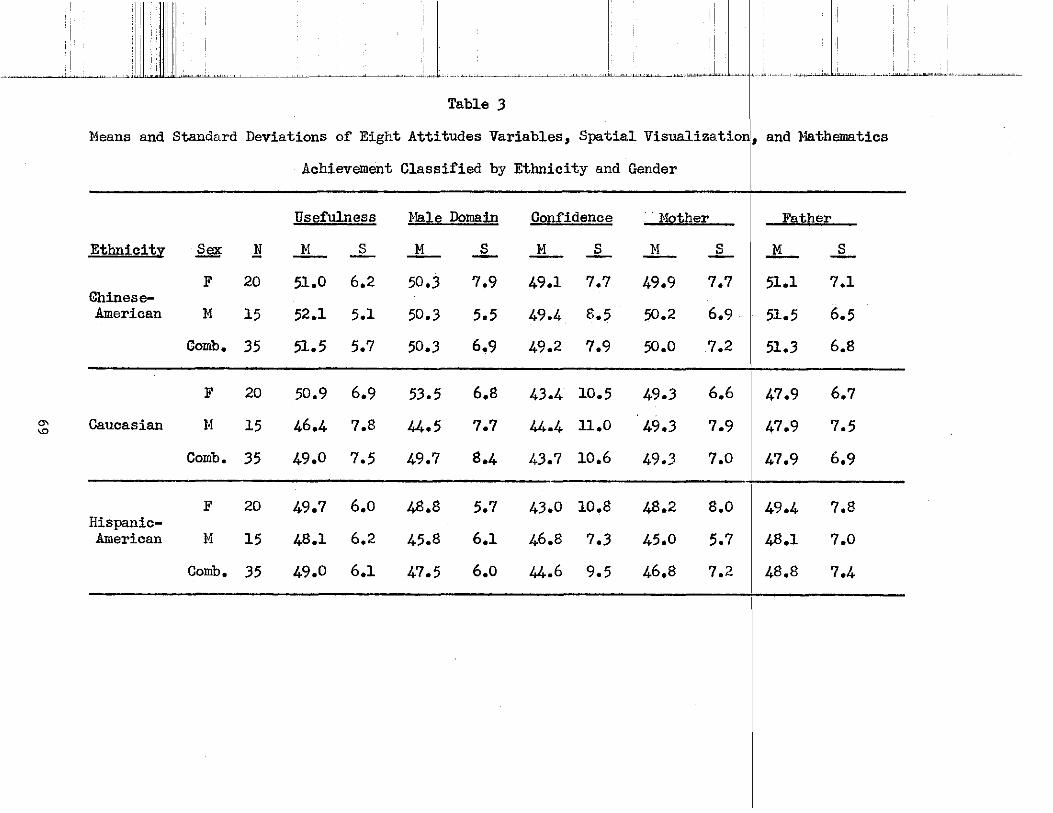
"' "'
I
'
, I IIUILC..~~~~ '~~~-"'"'''' '"''""'~'-~- .... ~~-L~_1L :_l_ .. lL~, '-,~ Table 3
Means and Standard Deviations of' Eight Attitudes Variables, Spatial Visualizatior1, and J.lathematics
Ethnicity Sex .N
20 GhineseAmerican
Caucasian
HispanicAmerican
F
M 15
Comb. 35
F 20
14 15
Comb. 35
F 20
M 15
Comb. 35
Achievement Classified by Ethnicity and Gender
Usefulness
_l:L ...§_
51.0 6.2
52.1 5.1
51.5 5.7
50.9 6.9
46.4 7.8
49.0 7.5
49.7 6.0
48.1 6.2
49.0 6.1
1-lale Domain
_l:L
50.3
50.3
50.3
53.5
44.5
49.7
48.8
45.8
47.5
...§_
7.9
5.5
6.9
6.8
7.7
8.4
5.7
6.1
6.0
Confidence
_l:L ...§_
49.1 7.7
49.4 8.5
49.2 7.9
43.4 10.5
44.4 n.o
43.7 10.6
43.0 10.8
46.8 7.3
44.6 9.5
, J.lother
_l:L
49.9
50.2
50.0
49.3
49.3
49.3
48.2
45.0
46.8
...§_
7.7
6.9
7.2
6.6
7.9
7.0
s.o 5.7
7.2
Father
.1L
51.1
51.5
51.3
47.9
47.9
47.9
49.4
48.1
48.8
...§_
7.1
6.5
6.8
6.7
7.5
6.9
7.8
7.0
7.4
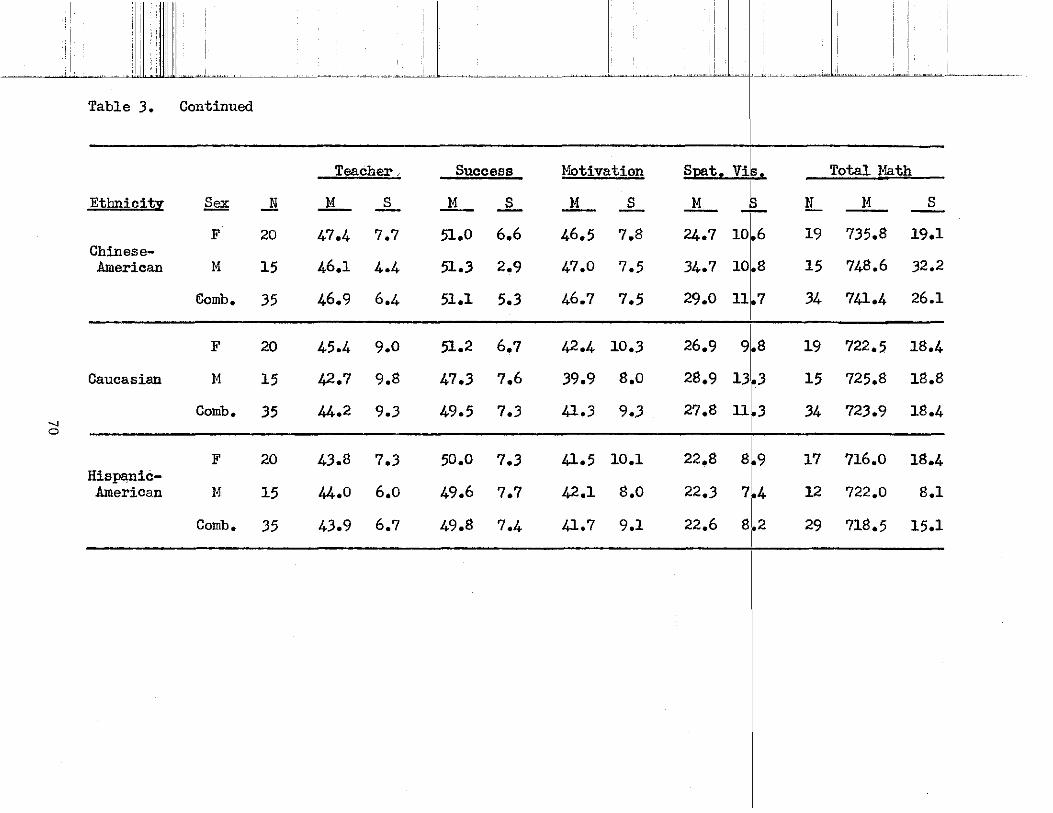
__, 0
I
, I
!
,,j
ill ,,
Table 3. Continued
Ethnicity
ChineseAmerican
Caucasian
HispanicAmerican
~ _li
F 20
M 15
Comb. 35
F
M
Comb.
F
14
Comb.
20
15
35
20
15
35
, I '
' i
·~··-~·~~···~,.~,,,,,,~ ·~., .. ,.,,_ -~~~~ JL- ~J__ , '-·--· Teacher.
.1:L s
47.4 7.7
46.1 4.4
46.9 6.4
45.4 9.0
42.7
44.2
43.8
44.0
43.9
9.8
9.3
7.3
6.0
6.7
Success
.1:L ...§_
51.0 6.6
51.3 2.9
51.1 5.3
51.2 6.7
47.3
49.5
50.0
49.6
49.8
7.6
7.3
7.3
7.7
7.4
Motivation
.1:L ...§_
46.5 7.8
47.0 7.5
46.7 7.5
42.4 10.3
39.9 8.0
41.3 9.J
41.5 10.1
42.1 8.0
41.7 9.1
Spat. Vi~. ...!Ll_ 24.7 10l6
34.7 101.8
29.0 11~7
26.9 91.8
28.9
27.8
22.8
22.3
22.6
13'[3
1113
8l9
71.4
8l2 I
Total Math
!L ___!i s
19 735.8 19.1
15 748.6 32.2
34 741.4 26.1
19 722.5 18.4
15
34
17
12
29
725.8
723.9
716.0
722.0
718.5
18.8
18.4
18.4
8.1
15.1
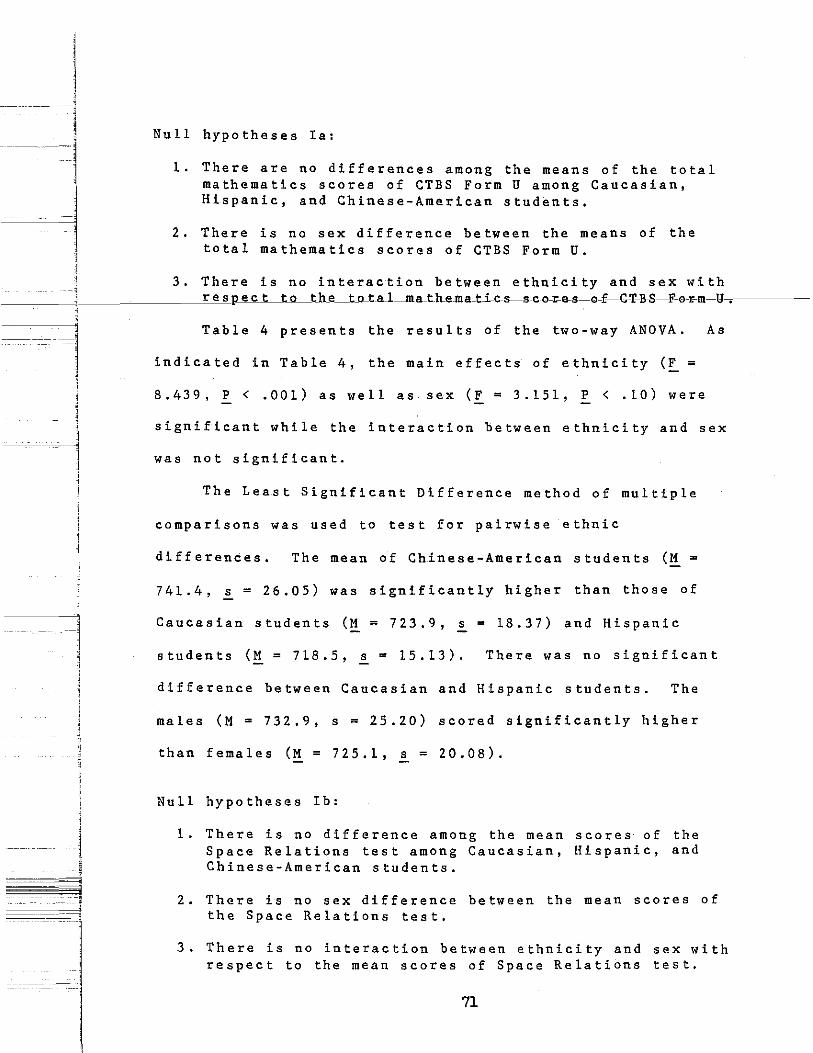
Null hypotheses Ia:
1. There are no differences among the means of the total mathematics scores of CTBS Form U among Caucasian, Hispanic, and Chinese-American students,
2. There is no sex difference between the means of the total mathematics scores of CTBS Form U.
3. There is no interaction between ethnicity and sex with -~
--------<---------'r'-'e,_s,._p e c t to ~h_e___t_o_t_a_l_ma_th.e.ma-t.Lc.s-s.co-r-e-s-o-f-C-T-B-S-F-o-!'m-u·, . .-------
--.-------. --~
l
l I
Table 4 presents the results of the two-way ANOVA. As
indicated in Table 4, the main effects of ethnicity (~ =
8.439,! < .001) as well as sex(!= 3.151,! < .10) were
significant while the interaction between ethnicity and sex
was not significant.
The Least Significant Difference method of multiple
comparisons was used to test for pairwise ethnic
differences. The mean of Chinese-American students (M =
741.4, s = 26.05) was significantly higher than those of
Caucasian students (~ = 723.9, s = 18.37) and Hispanic
students (~ = 718.5, s = 15.13). There was no significant
difference between Caucasian and Hispanic students. The
males (M = 732.9, s = 25.20) scored significantly higher
than females (M = 725.1, s = 20.08).
Null hypotheses Ib:
1. There is no difference among the mean scores of the Space Relations test among Caucasian, Hispanic, and Chinese-American students.
2. There is no sex difference between the mean scores of the Space Relations test.
3. There is no interaction between ethnicity and sex with respect to the mean scores of Space Relations test.
71
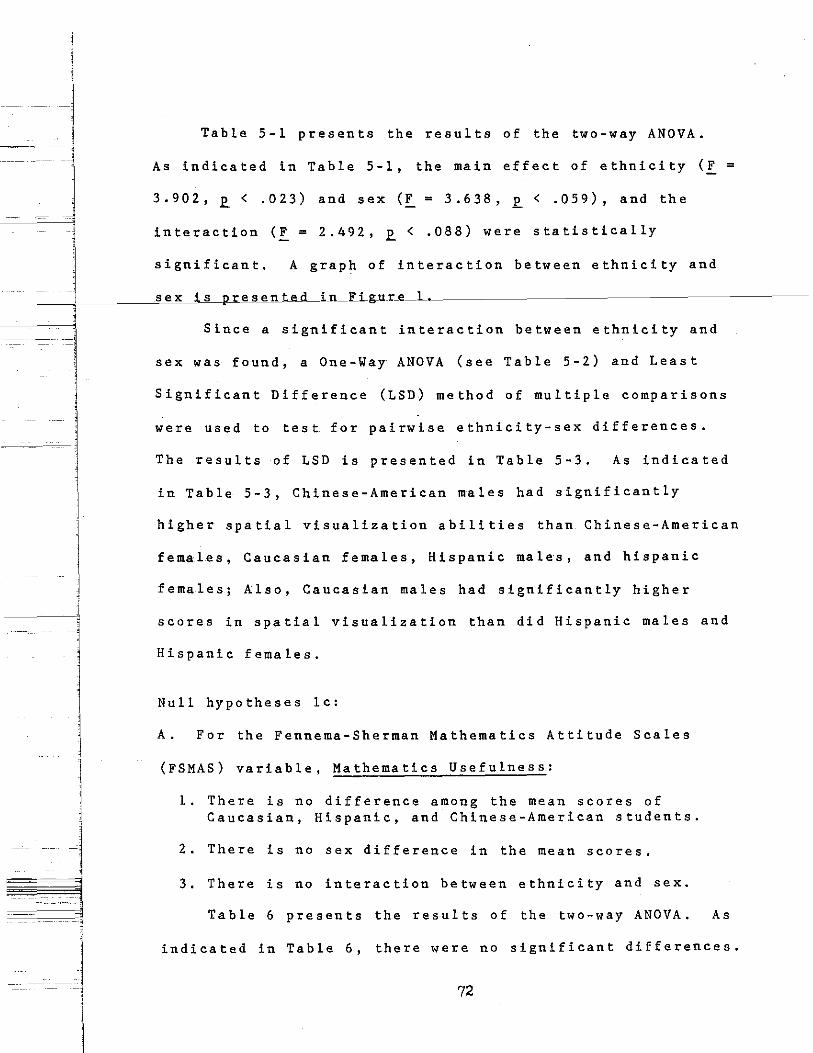
Table 5-1 presents the results of the two-way ANOVA.
As indicated in Table 5-l, the main effect of ethnicity (! =
3.902, £ < .023) and sex(~= 3.638, £ < .059), and the
interaction (! = 2.492, £ < .088) were statistically
significant. A graph of interaction between ethnicity and
-----f-----c's._.e._x.,__,.i~s.,_p res en t_ad_Ln_F_Lg_u_r_e_l_. _____________________ ~---
j
-1 1
I
Since a significant interaction between ethnicity and
sex was found, a One-Way ANOVA (see Table 5-2) and Least
Significant Difference (LSD) method of multiple comparisons
were used to test for pairwise ethnicity-sex differences.
The results of LSD is presented in Table 5-3. As indicated
in Table 5-3, Chinese-American males had significantly
higher spatial visualization abilities than Chinese-American
females, Caucasian females, Hispanic males, and hispanic
females; Also, Caucasian males had significantly higher
scores in spatial visualization than did Hispanic males and
Hispanic females.
Null hypotheses lc:
A. For the Fennema-Sherman Mathematics Attitude Scales
(FSMAS) variable, Mathematics Usefulness:
1. There is no difference among the mean scores of Caucasian, Hispanic, and Chinese-American students.
2. There is no sex difference in the mean scores.
3. There is no interaction between ethnicity and sex.
Table 6 presents the results of the two-way ANOVA. As
indicated in Table 6, there were no significant differences.
72
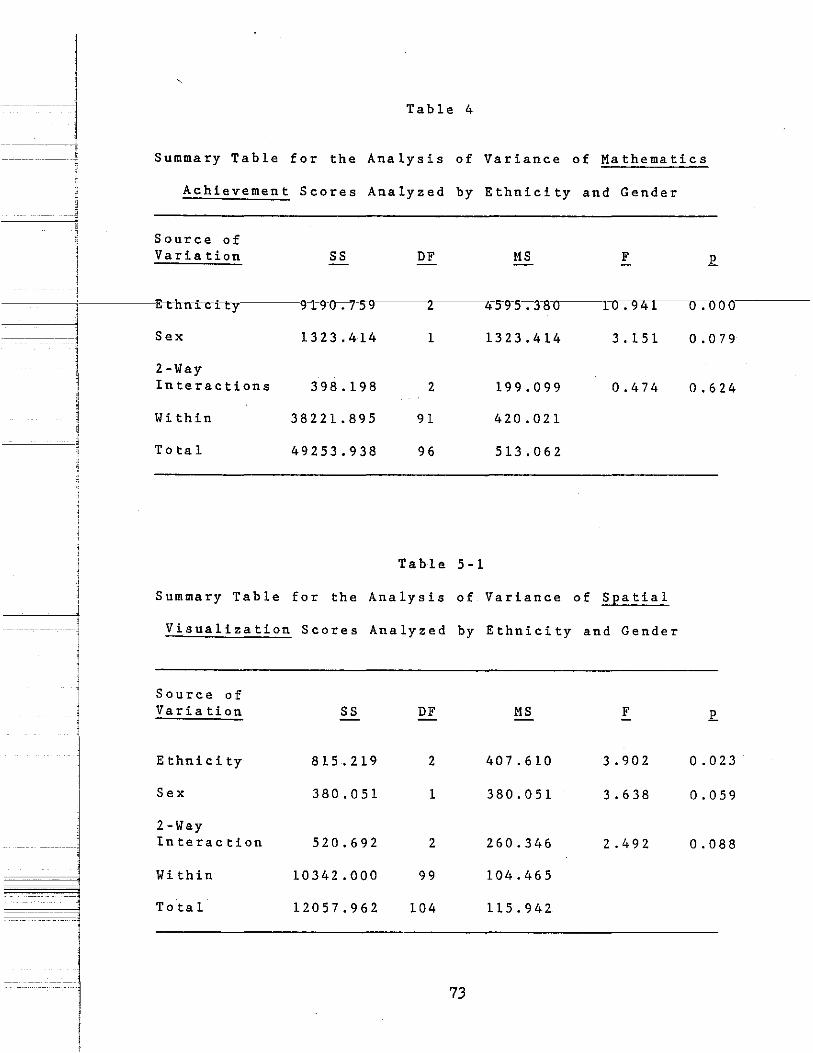
Table 4
Summary Table for the Analysis of Variance of Mathematics
Achievement Scores Analyzed by Ethnicity and Gender
Source of Variation ss DF MS F
E-t-hn-i--c-i-ty n-9o-;-n-9 2 4_5_9_5--:-3-8-o 1-o--:-9-t>r--o--:-o-o-o
------c:l Sex 1323.414 1 1323.414 3. 151 0.079
2-Way Interactions 398.198 2 199.099 0.474 0.624
Within 38221.895 91 420.021 I J
----~ To ta 1 49253.938 96 513.062
Table 5-l
Summary Table for the Analysis of Variance of Spatial
Visualization Scores Analyzed by Ethnicity and Gender
Source of Variation ss DF MS F E.
Ethnicity 815.219 2 407.610 3.902 0.023
Sex 380.051 1 380.051 3.638 0.059
2-Way ----- ------ Interaction 520.692 2 260.346 2.492 0.088
Within 10342.000 99 104.465
To ta 1 12057.962 104 115.942
73
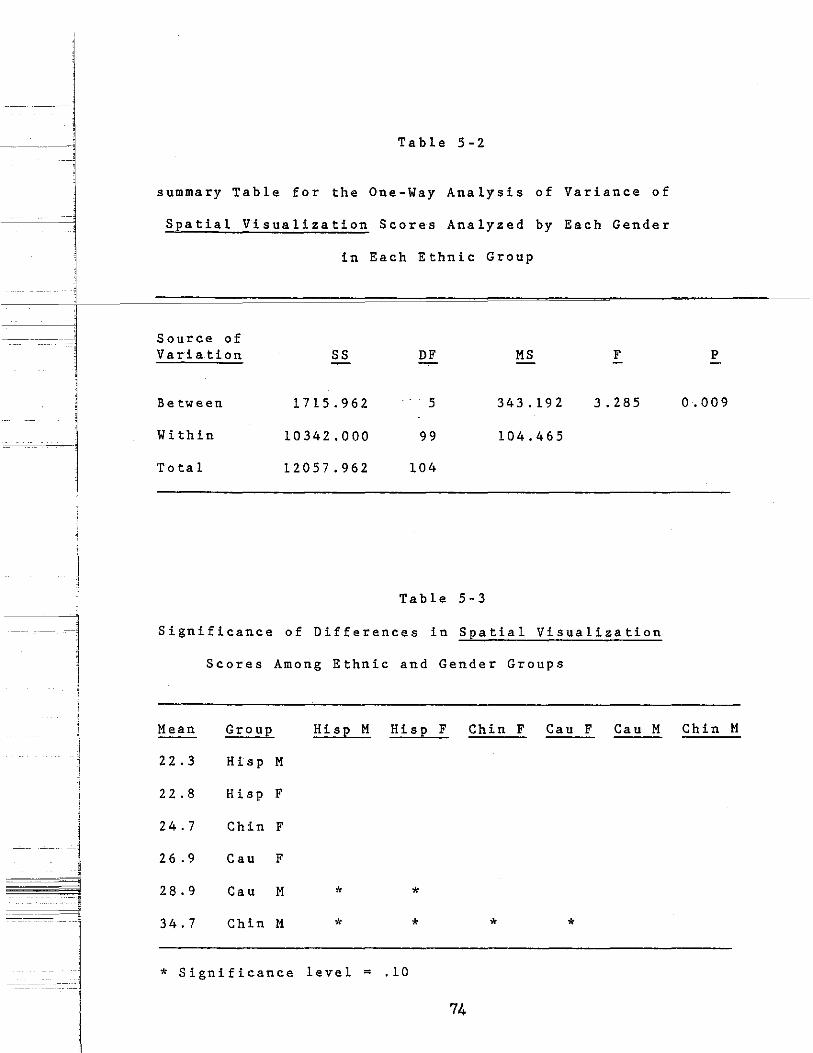
Table 5-2
summary Table for the One-Way Analysis of Variance of
Spatial Visualization Scores Analyzed by Each Gender
in Each Ethnic Group
I j j
---- Source of Variation ss DF MS F p
Between 1715.962 5 343.192 3.285 0.009
Within 10342.000 99 104.465
Total 12057.962 104
Table 5-3
---- ----- --! Significance of Differences in Spatial Visualization
l Scores Among Ethnic and Gender Groups I J ;
Mean Group Hisp M Hisp F Chin F Cau F Cau M Chin M
22.3 Hisp M
22.8 Hisp F
1 24.7 Chin F
-j 26.9 Cau F
--- l q 28.9 Cau M * * ---
34.7 Chin M * * * *
* Significance level = .10
74
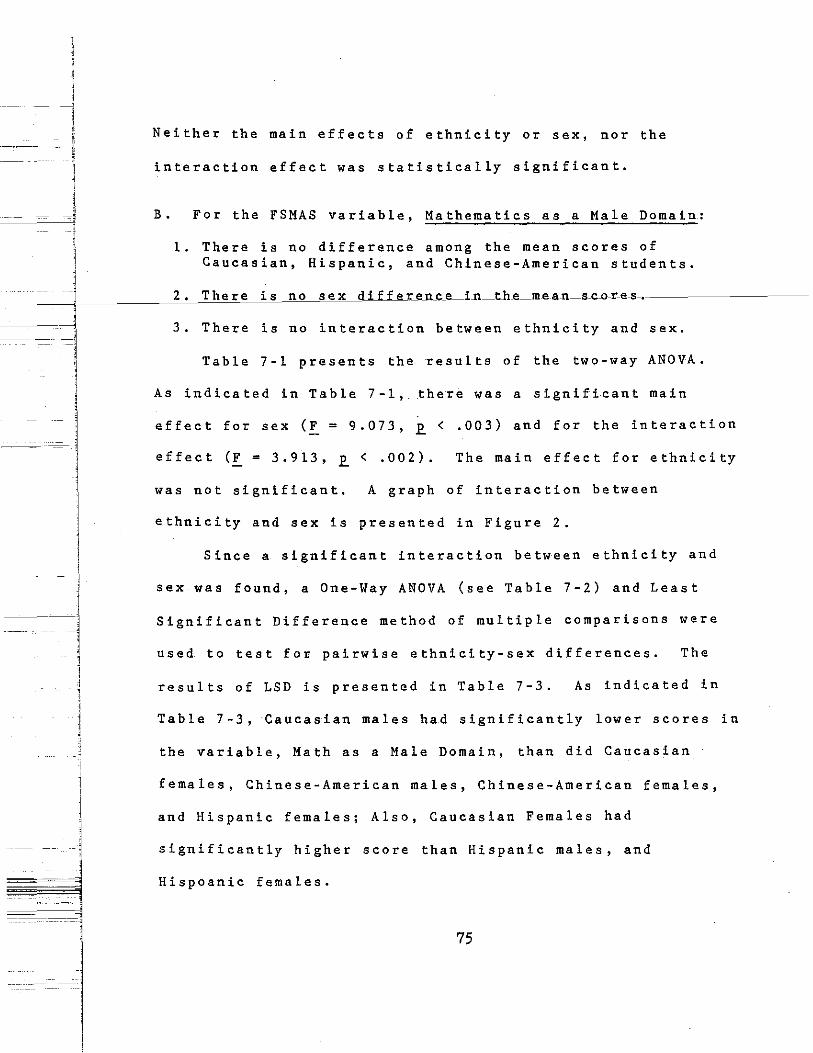
---------'"-~11 --- ------- --
1
-l 'I ' 1
I - j
~
Neither the main effects of ethnicity or sex, nor the
interaction effect was statistically significant.
B. For the FSMAS variable, Mathematics as a Male Domain:
1. There is no difference among the mean scores of Caucasian, Hispanic, and Chinese-American students.
2 , The r e i s no s ex d i f f e "IJ!_n_c_e_in_th_e_mea_n-S-C-O-r-e-s_, _______ _
3. There is no interaction between ethnicity and sex.
Table 7-l presents the results of the two-way ANOVA.
As indicated in Table 7-l,_ there was a significant main
effect for sex (! = 9.073, ~ < .003) and for the interaction
effect(!= 3.913, ~ < .002). The main effect for ethnicity
was not significant. A graph of interaction between
ethnicity and sex is presented in Figure 2.
Since a significant interaction between ethnicity and
sex was found, a One-Way ANOVA (see Table 7-2) and Least
Significant Difference method of multiple comparisons were
used to test for pairwise ethnicity-sex differences. The
results of LSD is presented in Table 7-3. As indicated in
Table 7-3, Caucasian males had significantly lower scores in
the variable, Math as a Male Domain, than did Caucasian
females, Chinese-American males, Chinese-American females,
and Hispanic females; Also, Caucasian Females had
significantly higher score than Hispanic males, and
Hispoanic females.
75
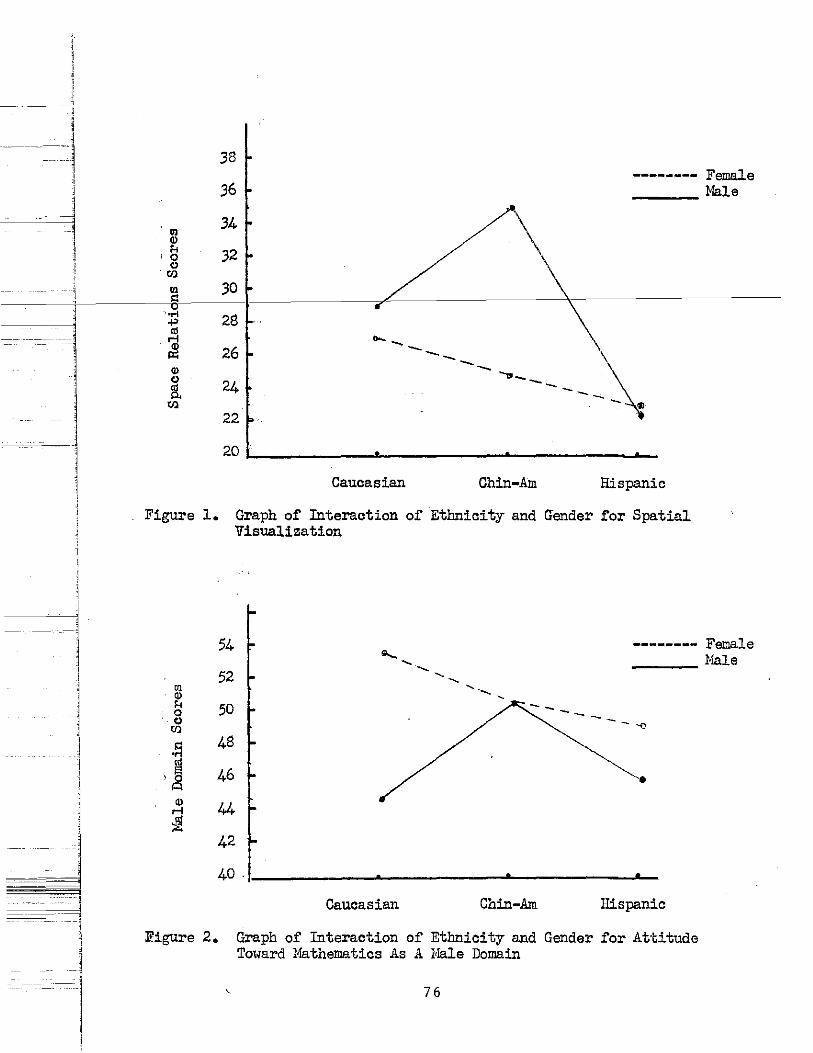
=I d . - 1
'
l
I I
1
1
j j
l
38
36
"' 34
<D 1-1 32 '0 0 .til
., 30 1::
'..-I 2$ +'
·~ 26 It;
<D 0 24 ~
til
22
20
.... _ ---
Caucasian
-- .., __ -
Chin-Am
-------- Female --- :VJB.le
-- .,
Hispanic
Figure 1. Graph of Interaction of Etbnicity and Gender for Spatial Visualization
54 -------- Female ___ }!ale
52 Ul Q) 1-1 50 0 0
-- --til
~ 48
,§ 46 ~ • Q)
44 .-I
~ 42
40.
Caucasian Chin-Am Hispanic
Figure 2. Graph of Interaction of Etbnicity and Gender for Attitude To1mrd Mathematics As A }!ale Domain
76
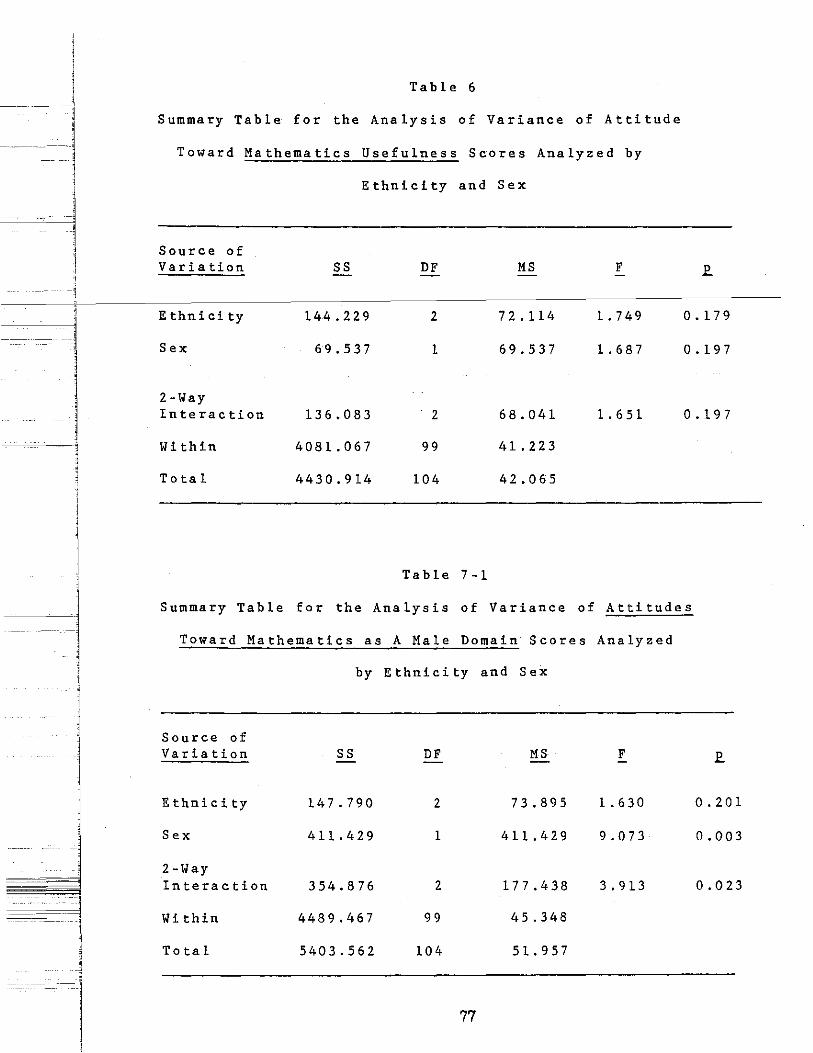
--~ : Table 6
Summary Table for the Analysis of Variance of Attitude
Toward Mathematics Usefulness Scores Analyzed by
- ~ 1
Ethnicity and Sex
Source of ' Variation ss DF MS F
Ethnici ty 144.229 2 72.114 1 . 7 4 9 0. 1 7 9
Sex 69.537 1 69.537 1. 68 7 0.197
2-Way Interaction 136.083 2 68.041 1. 6 51 0 . 19 7
Within 4081.067 99 41.223
Total 4430.914 104 42.065
Table 7-1
Summary Table for the Analysis of Variance of Attitudes
Toward Mathematics as A Male Domain Scores Analyzed
by Ethnicity and Sex
Source of Variation ss DF MS F E.
Ethnicity 147.790 2 73.895 1. 630 0. 2 01
Sex 411.429 1 411.429 9.073 0.003
2-Way Interaction 354.876 2 177.438 3.913 0.023
- - Within 4489.467 99 45.348
Total 5403.562 104 51.957
77
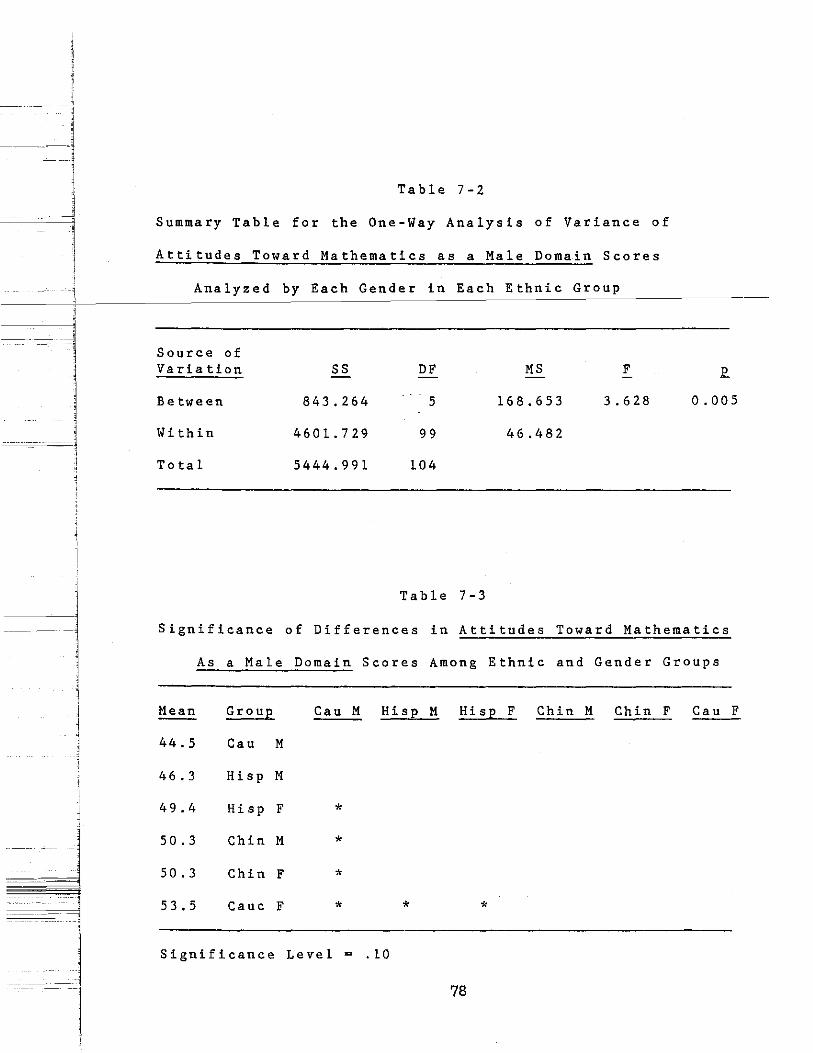
Table 7-2
Summary Table for the One-Way Analysis of Variance of
Attitudes Toward Mathematics as a Male Domain Scores
Analyzed by Each Gender in Each Ethnic Group
::J
l Source of Variation ss DF MS F 12.
l Between 843.264 5 168.653 3.628 0.005
- ' ~
--_--:= l Within 4601.729 99 46.482
Total 5444.991 104
Table 7-3
Significance of Differences in Attitudes Toward Mathematics
As a Male Domain Scores Among Ethnic and Gender Groups
Mean Group Cau M Hisp M Hisp F Chin M Chin F Cau F
44.5 Cau M
46.3 Hisp M
! 49.4 Hisp F * 1
-j 50.3 Chin M * 50.3 Chin F * ----~
53.5 Cauc F * * *
Significance Level = .10
78
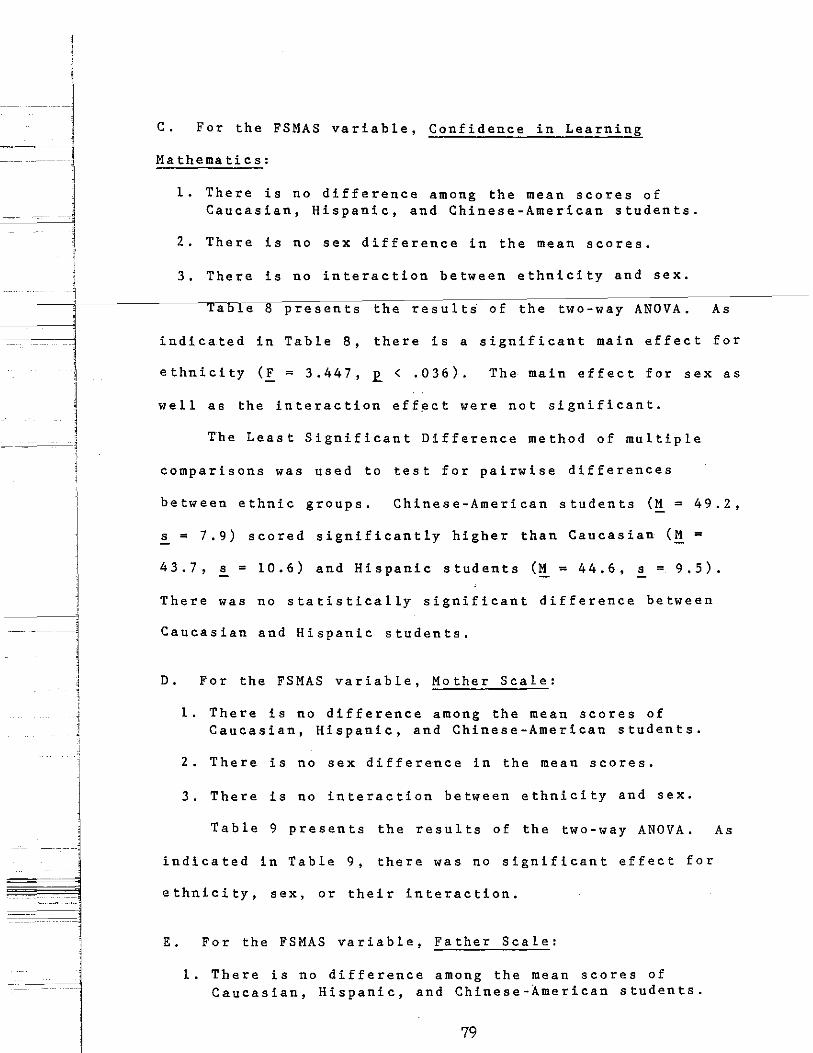
~ . !
I
C. For the FSMAS variable, Confidence in Learning
Mathematics:
1. There is no difference among the mean scores of Caucasian, Hispanic, and Chinese-American students.
2. There is no sex difference in the mean scores.
3. There is no interaction between ethnicity and sex.
Tabl.e 8 presents the results of the two-way ANOVA. As
indicated in Table 8, there is a significant main effect for
ethnicity (F = 3.447, £ < .036). The main effect for sex as
well as the interaction effect were not significant.
The Least Significant Difference method of multiple
comparisons was used to test for pairwise differences
between ethnic groups. Chinese-American students (M = 49.2,
~ = 7.9) scored significantly higher than Caucasian (~ =
43.7, s = 10.6) and Hispanic students (~ = 44.6, ~ = 9.5).
There was no statistically significant difference between
Caucasian and Hispanic students.
D. For the FSMAS variable, Mother Scale:
1. There is no difference among the mean scores of Caucasian, Hispanic, and Chinese-American students.
2. There is no sex difference in the mean scores.
3. There is no interaction between ethnicity and sex.
Table 9 presents the results of the two-way ANOVA. As
indicated in Table 9, there was no significant effect for
ethnicity, sex, or their interaction.
E. For the FSMAS variable, Father Scale:
1. There is no difference among the mean scores of Caucasian, Hispanic, and Chinese-American students.
79
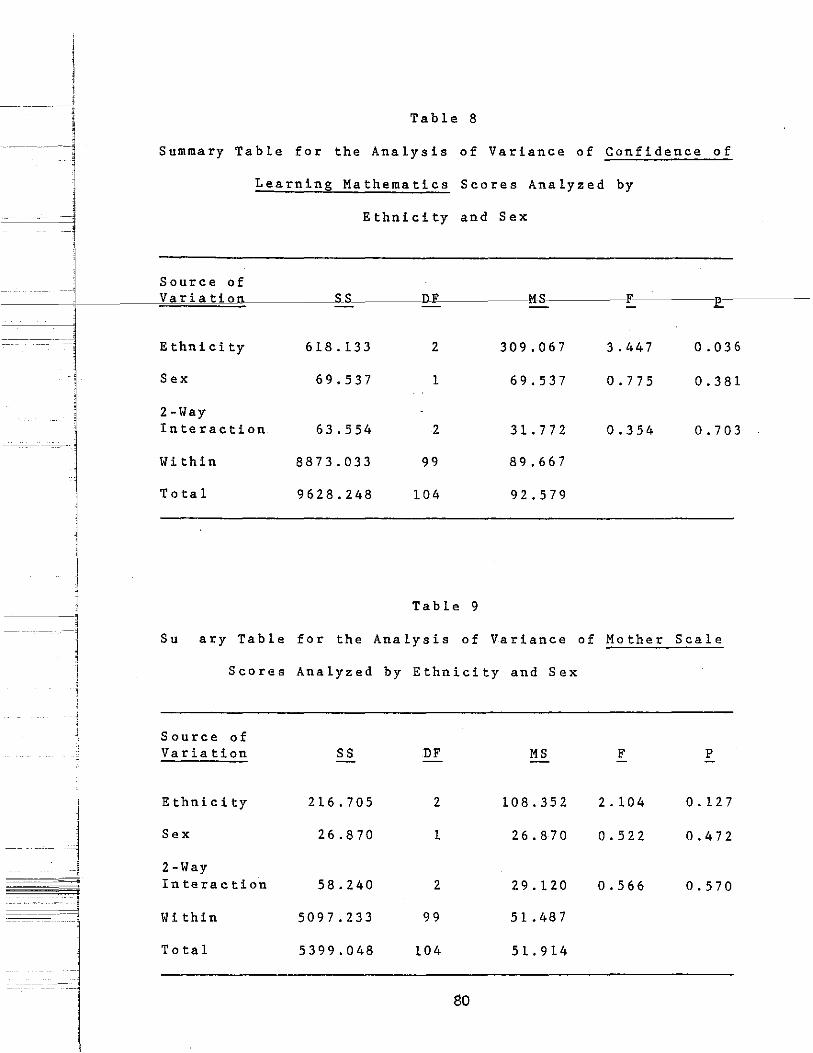
-l
j
i ----~
; -J
l _!
. " , ]
Table 8
Summary Table for the Analysis of Variance of Confidence of
Learning Mathematics Scores Analyzed by
Ethnicity and Sex
Source of Variation ss DF' MS F
Ethnicity 6l8ol33 2 309o067 3o447 Oo036
Sex 69o537 1 69o537 Oo775 Oo381
2-Way Interaction 63o554 2 31.772 Oo354 Oo703
Within 8873o033 99 89o667
Total 9628o248 104 92o579
Table 9
Su ary Table for the Analysis of Variance of Mother Scale
Scores Analyzed by Ethnicity and Sex
Source of Variation ss DF MS F p
Ethnicity 2l6o705 2 108o352 2ol04 0 0 12 7
Sex 26o870 1 26o870 Oo522 Oo472
2 -Way Interaction 58o240 2 29o120 Oo566 Oo570
Within 5097o233 99 51 0 48 7
To ta 1 5399o048 104 51.914
80
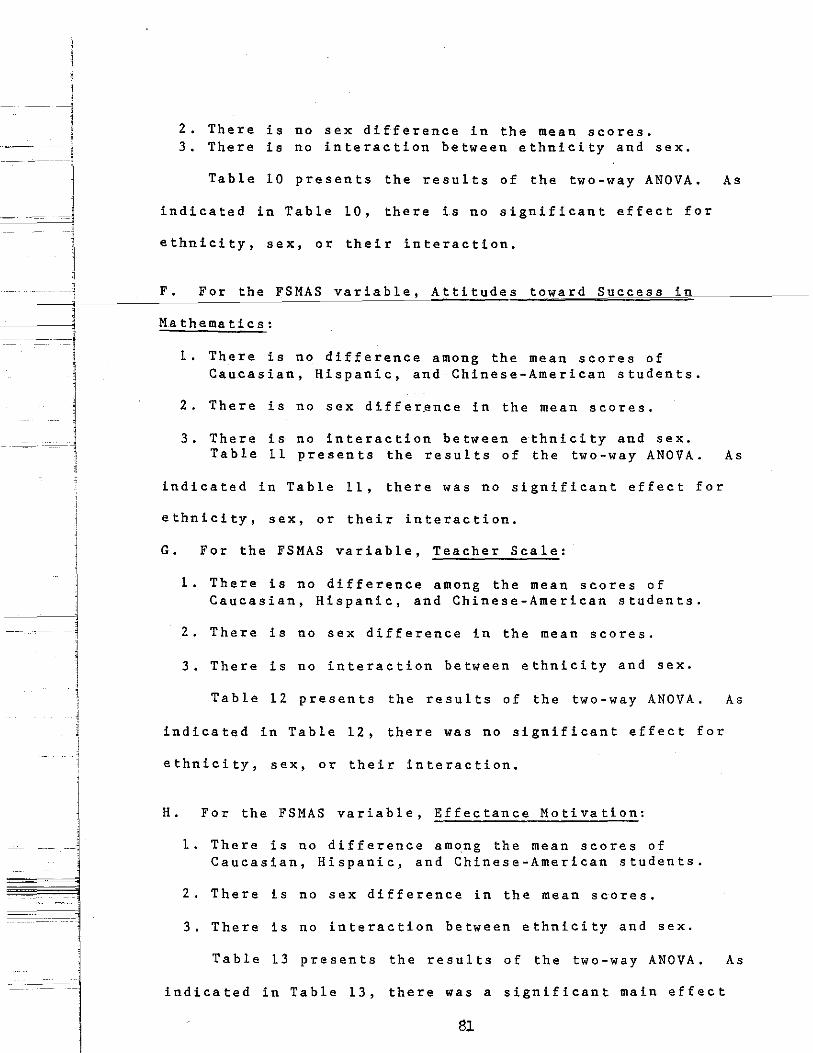
=~ 1
---1
--~ --- i
~! J '
2. There is no sex difference in the mean scores. 3. There is no interaction between ethnicity and sex.
Table 10 presents the results of the two-way ANOVA. As
indicated in Table 10, there is no significant effect for
ethnicity, sex, or their interaction.
F • For the FSMAS variable, Attitudes toward Success in
Mathematics:
l. There is no difference among the mean scores of Caucasian, Hispanic, and Chinese-American students.
2. There is no sex differ•nce in the mean scores.
3. There is no interaction between ethnicity and sex. Table ll presents the results of the two-way ANOVA.
indicated in Table 11, there was no significant effect for
ethnicity, sex, or their interaction.
G. For the FSMAS variable, Teacher Scale:
l. There is no difference among the mean scores of Caucasian, Hispanic, and Chinese-American students.
2. There is no sex difference in the mean scores.
3. There is no interaction between ethnicity and sex.
Table 12 presents the results of the two-way ANOVA.
indicated in Table 12, there was no significant effect for
ethnicity, sex, or their interaction.
H. For the FSMAS variable, Effectance Motivation:
l. There is no difference among the mean scores of Caucasian, Hispanic, and Chinese-American students.
2. There is no sex difference in the mean scores.
3. There is no interaction between ethnicity and sex.
As
As
Table 13 presents the results of the two-way ANOVA. As
indicated in Table 13, there was a significant main effect
81
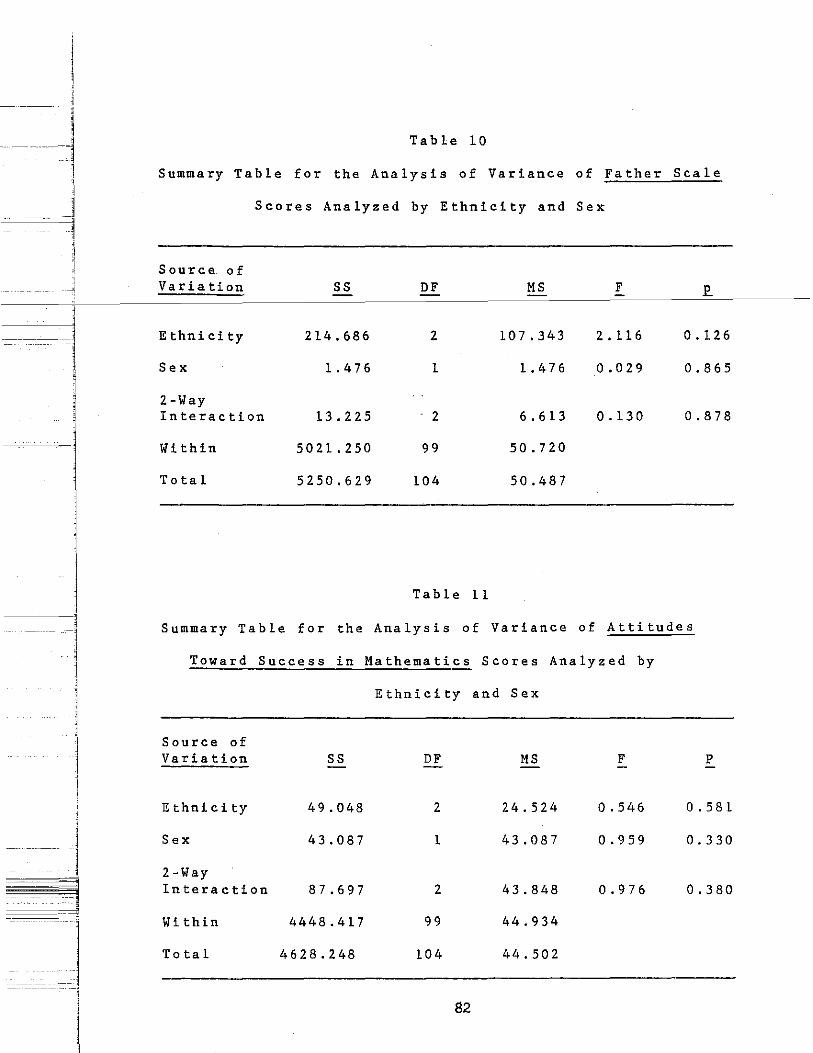
1 ' ---- 1
I =-=---=-=-~~~
1 j
-·-- J -~
' I l
-- ---------- --, ------~
j
I
~ -j
j j
1 l I j
) I !
J
-------------- I
Table 10
Summary Table for the Analysis of Variance of Father Scale
Scores Analyzed by Ethnicity and Sex
Source of Variation ss DF MS F
Ethnicity 214.686 2 107.343 2. 116 0. 12 6
Sex 1. 4 76 1 1. 4 7 6 0.029 0.865
2 -Way Interaction 13.225 2 6.613 0.130 0.878
Within 5021.250 99 50.720
Total 5250.629 104 50.487
Table 11
Summary Table for the Analysis of Variance of Attitudes
Toward Success in Mathematics Scores Analyzed by
Ethnicity and Sex
Source of Variation ss DF MS F p
E thnici ty 49.048 2 24.524 0.546 0. 5 81
Sex 43.087 1 43.087 0.959 0.330
2-Way Interaction 87.697 2 43.848 0.976 0.380
Within 4448.417 99 44.934
Total 4628.248 104 44.502
82
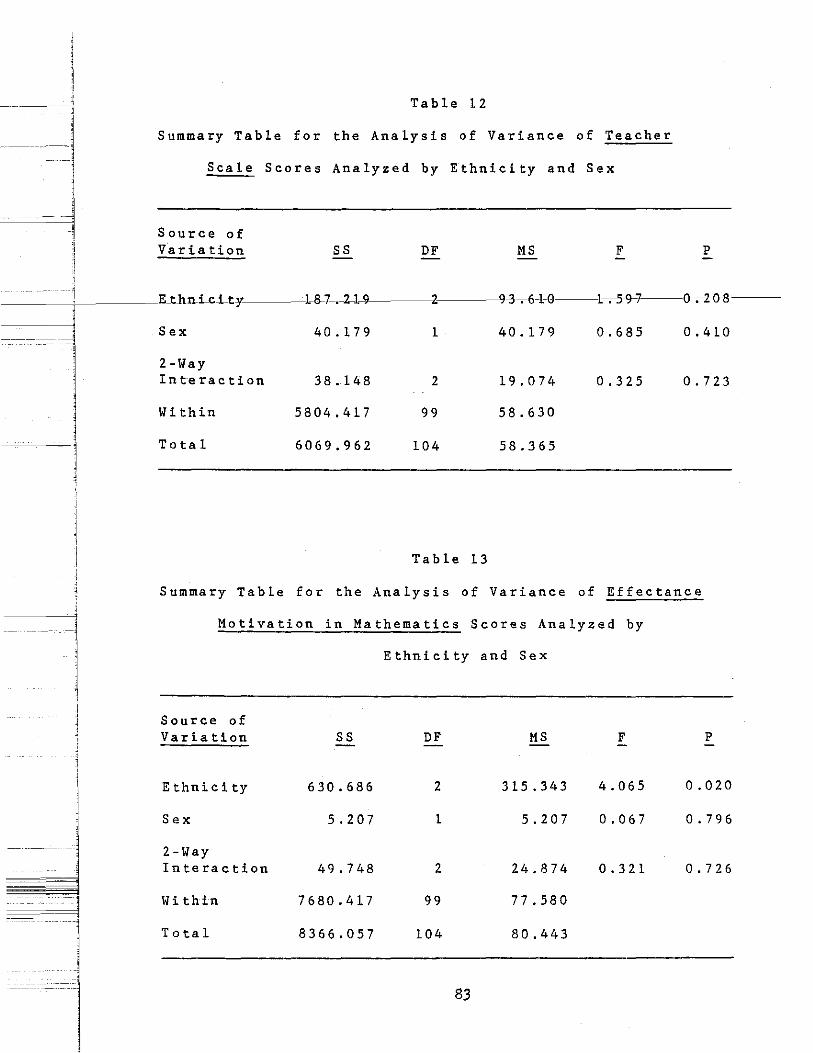
Table 12
Summary Table for the Analysis of Variance of Teacher
Scale Scores Analyzed by Ethnicity and Sex
Source of Variation ss DF MS F p
E_thnLci-t¥ l 8-7-.-2-1 !) 2 9~~6-1-() 1--.--59-7 0-.--2-0-8
Sex 40.179 1 40.179 0.685 0.410
2-Way Interaction 38.148 2 19.074 0.325 0 . 7 2 3
Within 5804.417 99 58.630
Total 6069.962 104 58.365
Table 13
Summary Table for the Analysis of Variance of Effectance
Motivation in Mathematics Scores Analyzed by
Ethnicity and Sex
Source of Variation ss DF MS F p
Ethnicity 630.686 2 315.343 4.065 0.020
I " Sex 5.207 l 5.207 0.067 0.796 "
~ 2 -Way Interaction 49.748 2 24.874 0.321 0.726
--
-
Within 7680.417 99 77.580 d ---' --- ----~
To ta 1 8366.057 104 80.443
83
'
----j
I
1 I
~ ... ~········· .. ·.j ---- --· -- --- ------------
----- --------- --- -- --
for ethnicity (~ = 4.065, R < .020). There was no
significant main effect for sex nor for the interaction
between ethnicity and sex.
The Least Significant Difference method of multiple
comparisons was used to test the pairwise differences
between ethnic groul' s. The re su 1 ts i nd iJ:_a_t_e_d_tha_t-th-e-mean------
score of the Chinese-American students (~ = 46.7, s = 7.5)
was significantly higher than those of the Caucasian (~ =
41.3, s = 9.3) and Hispanic (~ = 41.7, s = 9.1) students.
The difference between Caucasian and Hispanic students was
not significant.
Research hypothesis II is concerned with relationships
between the total mathematics scores of CTBS and the other
nine variables of this study. The Pearson Correlation
Coefficient (r) was used to quantify the degree of
relationship. The t-test was used to test the significance
of r. The results are presented in Table 14 and 17.
Null hypothesis IIa:
For each ethnic group, there is no correlation between the total mathematics scores of CTBS and the following variables: a) Space Relations (SR); b) Usefulness of Mathematics: c) Math as a Male Domain; d) Confidence in Learning Math; e) Mother; f) Father; g) Attitude toward Success in Math; h) Teacher; i) Effectance Motivation in Math.
As indicated in Table 14 and 17, there were several
positive and significant relationships between mathematics
84
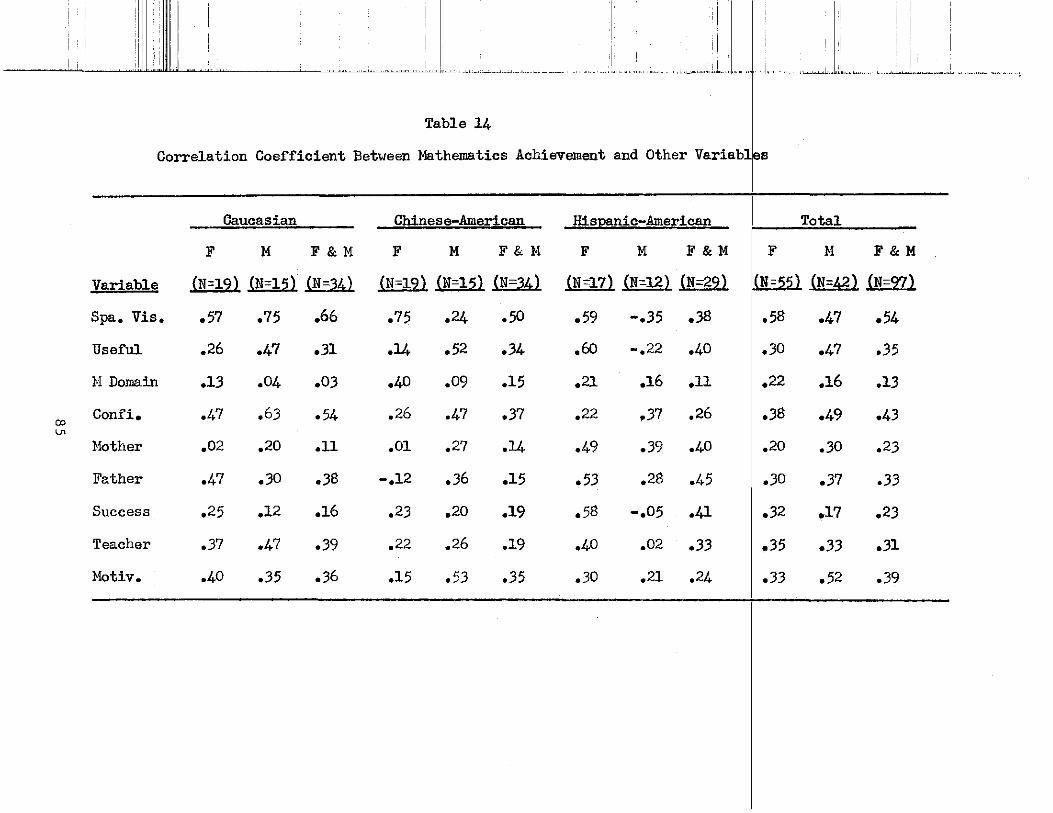
. :11 i I !
::,I • I I ~'·'····'······ __ --~~.,J,~~•w~~"-~'~· eel j,, · •~,,~,l~c ~L,~~· ---~
Table 14
Correlation Coefficient Between :t-lathematics-Achievemen~- ~n~ Other Variables
Caucasian Chinese-American Hispanic-American I Total
F M F&:t-1 F M F&U F u F&U c F&M
Variable (N=l9) (N=l5) (N=34) (N"=l't) (N=l5) {N"=34l (N=l7) UI=12J .lli=29) (LID ( 42) (N=97)
Spa. Vis. .57 .75 .66 .75 .24 .50 .59 -.35 .38 .58 .47 .54
Useful .26 .47 .31 .14 .52 .34 .60 -.22 .40 .30 .47 .35
H Domain .13 .04 .03 .40 .09 .15 .21 .16 .11 .22 .16 .13
00 Confi. .47 .63 .54 .26 .47 .37 .22 ,37 ,26 .38 .49 .43
Ln
Hother .02 ,20 .11 .01 ,27 .14 .49 .39 .40 ,20 .30 ,23
Father .47 .30 .38 -.12 .36 .15 .53 .28 .45 .30 .37 .33
Success ,25 .12 .16 .23 .20 .19 .58 -.05 .41 .32 .17 .23
Teacher .37 .47 .39 .22 .26 .19 .40 .02 .33 .35 .33 .31
Hotiv. .40 .35 .36 .15 .53 .35 .30 .21 .24 .33 .52 .39
scores and SR scores in the three ethnic groups. For
Hispanic male and Chinese-American male students, there was
no significant relationship. The Pearson Correlation
Coefficients for female students in each ethnic group were
all positive and significant,
-~ The correlation of mathematics achi_e_x_e_l!Le_n_t_aRd _________ _
attitudes toward usefulness of mathematics was positive and
significant for each ethnic group. The stereotyping of
mathematics as a male domain did not relate to mathematics
achievement for any of the three ethnic groups.
Interestingly, in contrast to Caucasian students and
Hispanic students, Chinese-American students' perceptions of
their mother's, father's, and teacher's interest,
encouragement,. and confidence in their ability in
mathematics did not correlate significantly to their
mathematics achievement.
Confidence in learning mathematics and Effectance
Motivation were related to mathematics achievement for both
Caucasian and Chinese-American students. The motive to
avoid success in mathematics, as measured by Attitude toward
Success Scale, did not relate to mathematics achievement for
" _j
Caucasian and Chinese-American students.
=i
-
- -
- = -1
Null hypothesis III is concerned with the ethnic
differences and sex differences in relationships between
mathematics achievement and spatial visualization. The
Z-test for independent samples was used to test null
hypothesis III.
86
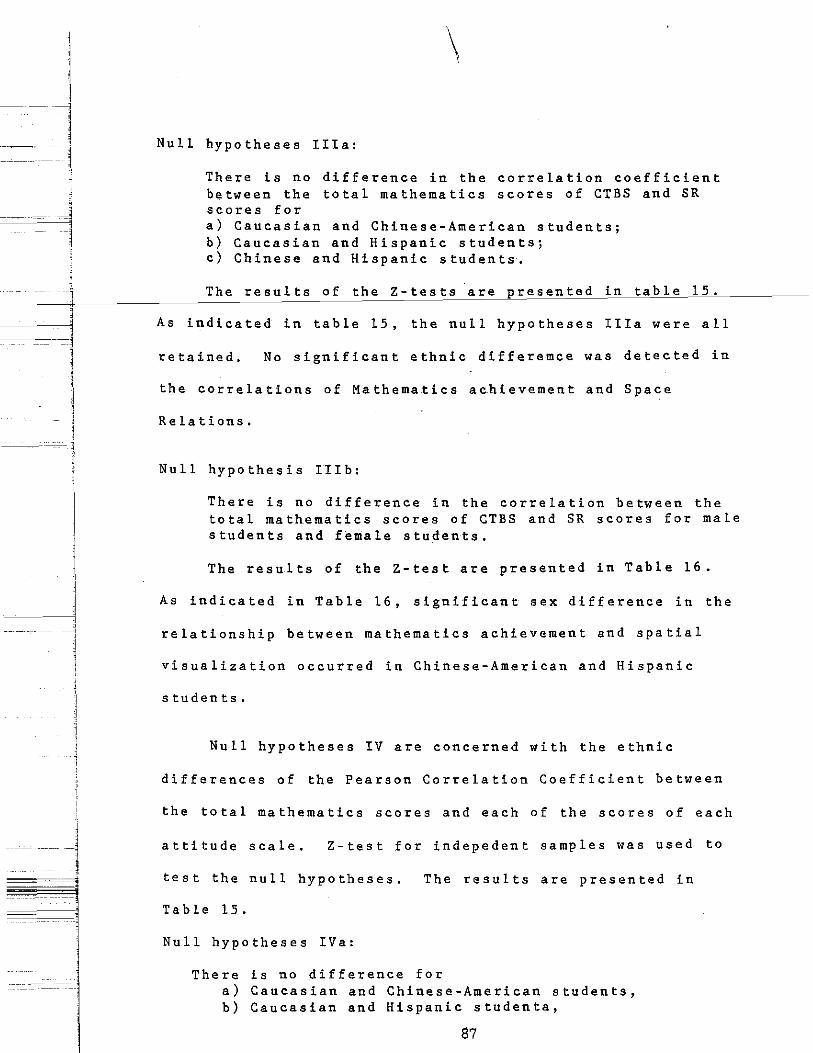
-- i J j
l ~l
---~
--c~-=--=1 ! J
--··-.-5
_ _j j _, j 1
1
-l
\
Null hypotheses IIIa:
There is no difference in the correlation coefficient between the total mathematics scores of CTBS and SR scores for a) Caucasian and Chinese-American students; b) Caucasian and Hispanic students; c) Chinese and Hispanic students,
The results of the Z-tests are presented in table 15.
As indicated in table 15, the null hypotheses IIIa were all
retained. No significant ethnic differemce was detected in
the correlations of Mathematics achievement and Space
Relations.
Null hypothesis IIIb:
There is no difference in the correlation between the total mathematics scores of CTBS and SR scores for male students and female students.
The results of the Z-test are presented in Table 16.
As indicated in Table 16, significant sex difference in the
relationship between mathematics achievement and spatial
visualization occurred in Chinese-American and Hispanic
students.
Null hypotheses IV are concerned with the ethnic
differences of the Pearson Correlation Coefficient between
the total mathematics scores and each of the scores of each
attitude scale, Z-test for indepedent samples was used to
test the null hypotheses. The results are presented in
Table 15.
Null hypotheses IVa:
There is no difference for a) Caucasian and Chinese-American students, b) Caucasian and Hispanic studenta,
87

I l 1
j
~ J
-~ '
---l -l
J _l l
='
.
. ---
c) Chinese-American and Hispanic students, in the correlation between the total mathematics and the following eight FSMAS variables:
1) Mathematics Usefulness; 2) Mathematics as a Male Domain; 3) Confidence in Learning Mathematics; 4) Mother Scale; 5) Father Scale; 6) Attitudes toward Success in Mathematics; 7) Teacher Scale; 8) Effectance Motivation.
of CTBS
The null hypotheses IVa were all retained as indicated
in table 15. There were no significant ethnic differeces of
the relationships between the total mathematics scores of
CTBS and the scores of each attitude scale of FSMAS.
The null hypotheses IVb:
There is no difference for male and female students in the correlation between the total mathematics of CTBS and the following eight FSMAS variables:
1) Mathematics Usefulness; 2) Mathematics as a Male Domain; 3) Confidence in Learnin g Mathematics; 4) Mother Scale; 5) Father Scale; 6) Attitudes toward Success in Mathematics; 7) Teacher Scale; 8) Effectance Motivation.
The results of the Z-test are presented in Table 16.
As indicated in Table 16, significant sex differences in the
relationship between mathematics achievement and mathematics
attitudes were found in the variables of Usefulness of
Mathematics and the Attitude toward Success in Math for
Hispanic students.
Research hypotheses V are concerned with the estimaton
of total mathematics scores of CTBS, from a linear
combination of 11 independent variables, which includes
88
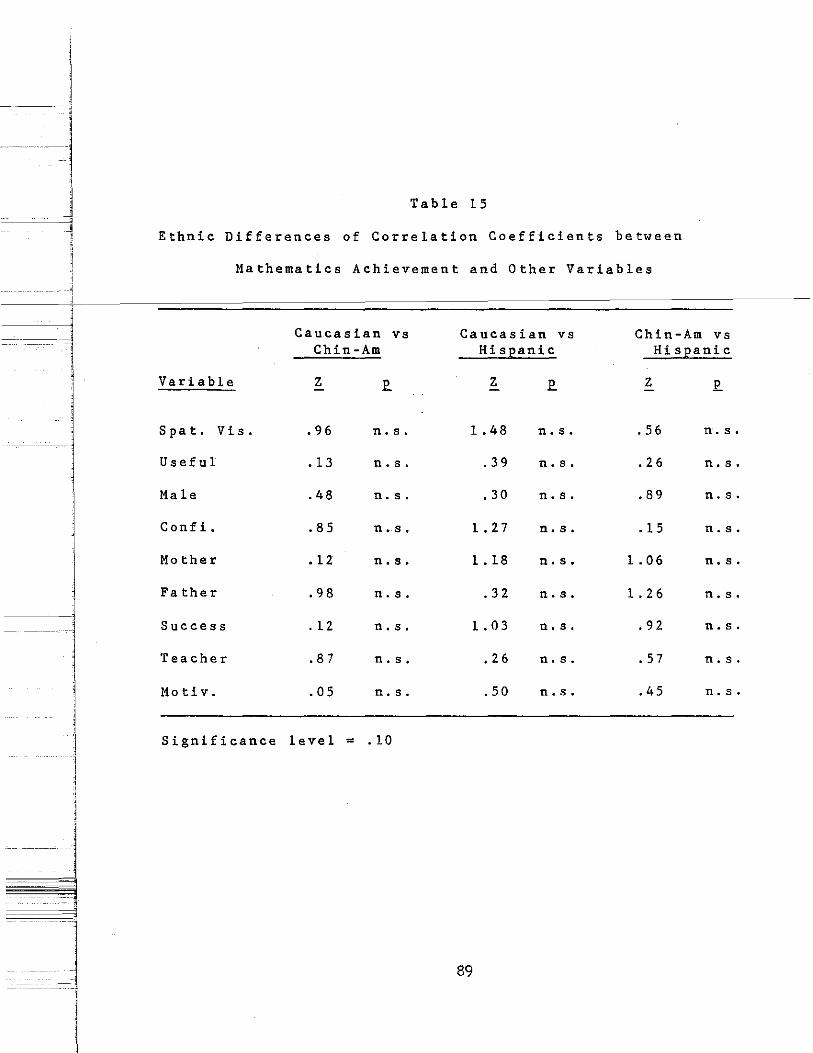
--- -l ~---~ ~---=::-:-l
J Table 15
Ethnic Differences of Correlation Coefficients between
--~ Mathematics Achievement and Other Variables
'
Caucasian vs Caucasian VS Chin-Am vs Chin-Am Hispanic Hispanic
Variable z £. z £. z £.
Spat. Vis. • 96 n. s. 1.48 n. s. . 56 n. s.
Useful . 13 n. s. . 39 n. s. . 26 n. s.
Male .48 n. s. .30 n. s. .89 n. s.
Confi. .85 n .. s. l. 2 7 n. s. . 15 n. s .
Mother . 12 n. s. l. 18 n. s. l. 06 n. s.
Father .98 n. s. . 3 2 n. s. 1. 2 6 n. s.
Success .12 n. s. 1. 03 n. s. .92 n. s.
Teacher . 8 7 n. s. . 2 6 n. s. . 57 n. s .
Motiv. .05 n. s. . 50 n. s. .45 n. s.
Significance leve 1 = . 10
j
-J 89
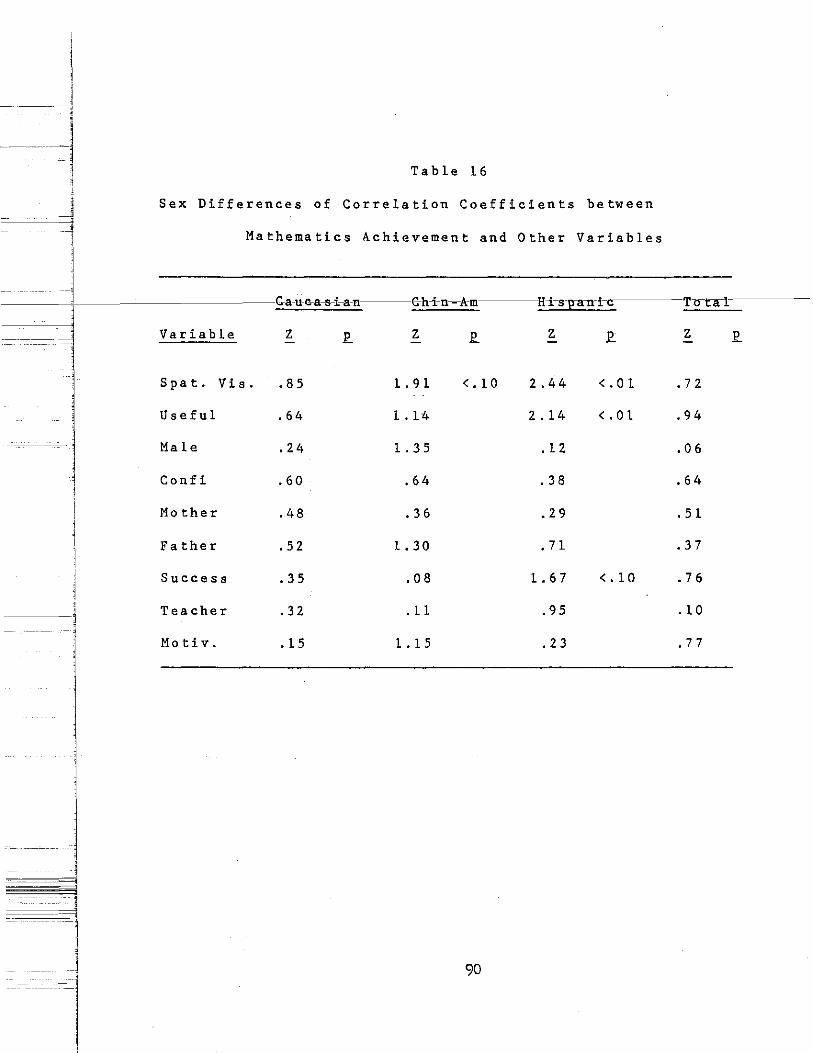
Table 16
Sex Difference~ of Correlation Coefficients between
l Mathematics Achievement and Other Variables
-1 j C-a-u-e.--a-s-i-a-n G-h-i-n--A-m H-i-s-p-an-i-c Tcn-al
Variable z E. z E. z £. z £.
Spat. Vis. . 8 5 1. 91 <. 10 2.44 <. 01 . 7 2
Useful . 64 1. 14 2.14 <. 01 . 94
Male . 24 1. 3 5 . 12 • 0 6
Confi .60 .64 . 3 8 . 64
Mother .48 . 3 6 .29 . 51
Father . 52 1. 30 • 7 1 .37
Success .35 .08 1. 6 7 <.10 .76
Teacher .32 . 11 .95 . l 0
Motiv. . 15 1. 15 . 2 3 . 77
90
spatial visualization, sex, ethnicity and eight mathematics
attitudes variables. The Stepwise procedure of SPSS using
ethnicity as a dummy variable was used to establish the
multiple regression equation.
The results are presented in Table 18 and 19. Spatial
vi sua 1 i z a t i on w a s the f i r s t v a r i a b 1 e t!)_e_n_t_e_r_th_e_mu_Lt_Lp_l_e _____ _
regression equation. Twenty-nine percent of the variation
in mathematics achievement could be explained by this
variable. The second variable to enter the equation was the
Chinese-American ethnicity (Dl). This variable accounted
for additional 12% of the variation in mathematics
achievement. The third predictor, Confidence of Learning
Mathematics, also had a significant regression coefficient,
B, and accounted for additional 5% of the variation in
mathematics achievement. These three predictors jointly
explained 46% of the variation in mathematics achievement
with standard error of 16.8 (see Table 19).
91
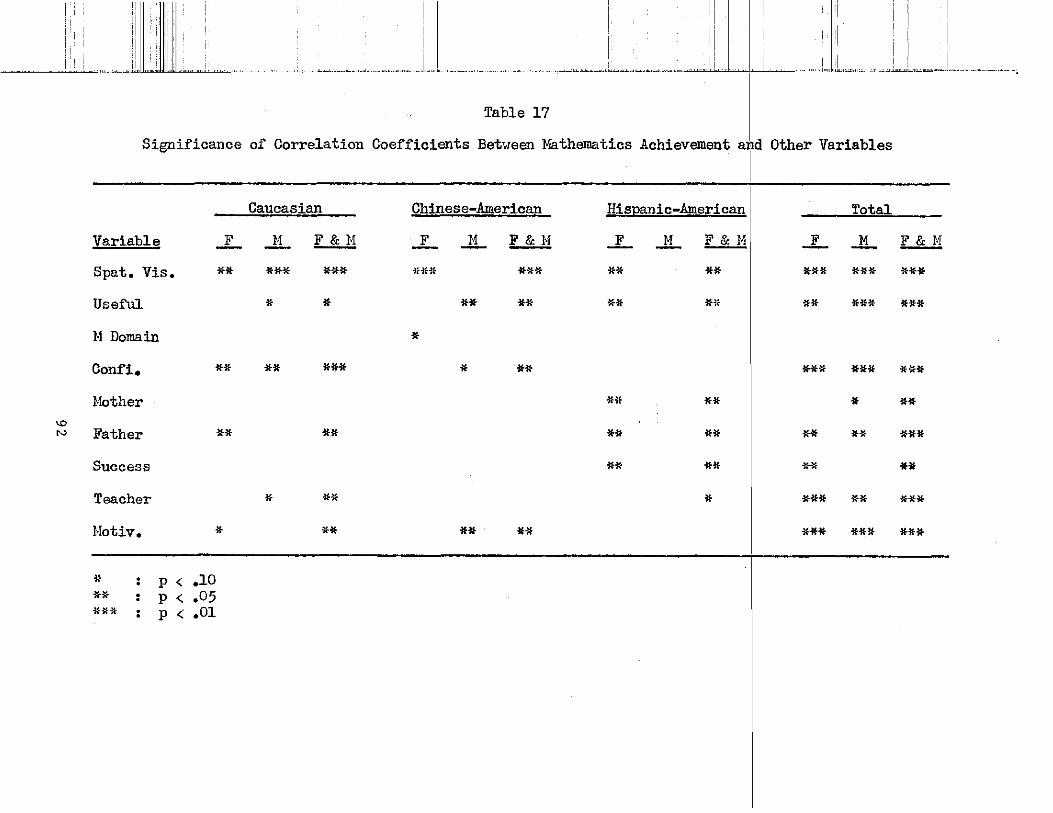
'I ~~~
-~' !~~ ._Jii 1111111 ""~--~-~c~--"·"··-"·---••-'"•···· I
I I
i j_' ! ! ·I
' , '1. : ! !
' I •I i ,
1
I I ' , I ~ - "' - .k ...... ~-~~-·-""""''~---~
Table 17
Significance of Correlation Coefficients Bet>reen :VJB.thematics Achievement amd Other Variables
"' N
Caucasian
Variable .L .1L F&H
Spat. Vis. **
Useful
H Domain
Confi.
Nother
Father
Success
Teacher
Hotiv.
* ** ***
. • . .
**
**
*
p < .10 p < .05 p < .01
*** ***
* *
** ***
**
* ** **
Chinese-American
.L J.L F&N
ii-*1~ ***
** **
* * **
** **
I
Hispanic-American Total
.L J.L F&H .L J.L F & l·!
** ** *** *** ***
** *,. ·' ** *** ***
*** *** ***
** ** * **
** ** ** ** ***
** ** ** **
* *** ** *** *** **lf ***
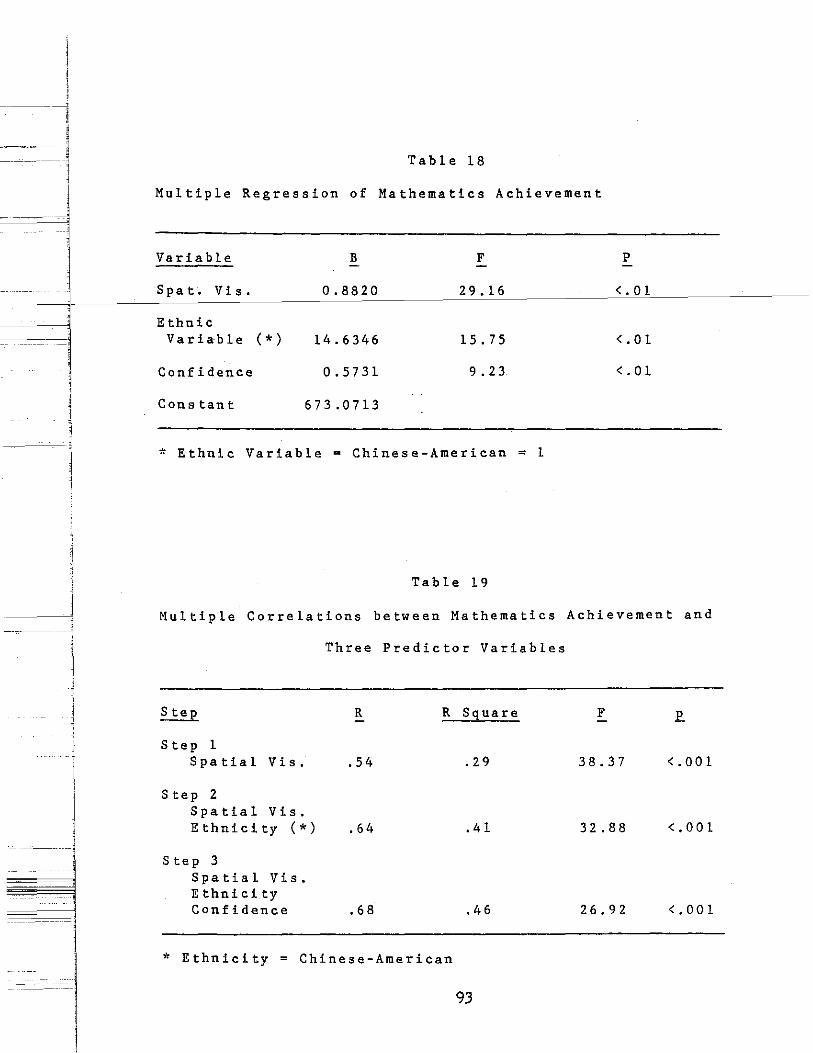
- --··
~ . . . l J
l l ---l
~===!
.. J
Table 18
Multiple Regression of Mathematics Achievement
Variable B F p
Spat. Vis. 0.8820 2 9 • 16 <. 01
Ethnic Variable ( *) 14.6346 15.75 <. 01
Confidence 0.5731 9 • 2 3 <. 01
Constant 673.0713
* Ethnic Variable = Chinese-American = 1
Table 19
Multiple Correlations between Mathematics Achievement and
Step 1 Spatial Vis.
Step 2 Spatial Vis. Ethnicity (*)
Step 3 Spatial Vis. Ethnicity Confidence
Three Predictor Variables
R R Square
. 54 .29
. 64 .41
.68 .46
* Ethnicity = Chinese-American
93
F
38.37 <. 001
32.88 <.001
2 6. 9 2 <. 0 0 1
-, i
Summary
The analyses of mathematics achievement data provided
the following findings: (1) Chinese-American students
achieved significantly higher than Caucasian and Hispanic
students; (2) there was a significant sex difference; (3)
there was no significant interaction between ethnicity and
sex, that is, the ethnic differences in mathematics were not
related to the gender of the students.
The findings from the statistical analyses of spatial
visualization ability, as measured by the Space Relations
subtest of Differential Aptitude Test battery, are
summarized as following: (1) there was a significant
interaction between ethnicity and sex; therefore, ethnic
groups could not be pooled on sex and compared; (2)
Chinese-American male students scored significantly higher
than Chinese-American female, Caucasian male, Hispanic male,
and Hispanic female students, but not significantly higher
than Caucasian male students; (3) Caucasian male students
had significantly higher scores than did Hispanic males and
Hispanic females.
For the affective domain, the findings for mathematics
attitudes are stated as follows:
(1) significant ethnicity-related differences were found
for only two variables: Confidence in Learning
Mathematics and Effectance Motivation (see Tables 8
and 13); The results indicate that Chinese-American
were significantly more confident of their ability to
94
learn mathematics than Caucasian and Hispanic
students; Chinese-American students showed
significantly more willingness than Caucasian and
-j Hispanic students to enjoy and to seek challenge in
mathematics; there were no significant differences
--1 be tween Caucasian and Hispanic s tuden t_s_Ln_th_e_s_e__t_w_n,___ ____ _
_____ J ----- ----- ---
attitudes.
(2) significant interaction between ethnicity and sex was
found for only one variable, Mathematics as a Male
! Domain; Caucasian males had significantly lower -----.-~
scores than did Caucasian females, Chinese-American
males and females, and Hispanic females; Caucasian
females had significantly higher scores than Hispanic
males and females (see figure 2).
(3) there was no significant effects of ethnicity, sex,
or interaction in the other affective variables.
The relationships between the total mathematics scores
and the other nine variables are summaarized as the
followings (see Table 14 and Table 17):
(l) for the female students in each ethnic group (~
ranged from .57 to .75), the relationships with
spatial visualization ability were all positive and
significant; such a relationship also existed in
Caucasian male students (~ = • 75); for Hispanic and
Chinese-American male students, the relationships
were not statistically significant;
(2) the relationships with attitudes toward the
usefulness of mathematics were found positive and
95
"---~-~-----j ---- -------]
___ j j j 1
~-I ' 1
significant for Caucasian and Chinese-American male
students, and also for Hispanic female students (~
ranged from .31 to .60);
(3) positive and significant relationship with sex
stereotyping in mathematics existed only in
Chinese-American female students (r = .40);
(4) the relationships with confidence in one's ability to
learn and to perform well in mathematics were found
positive and significant for Caucasian male students
and female students lr = .63 and .47 respectively),
and Chinese-American male students (r = .47).
(5) the relationship with the students' perception of
their mothers' interest, encouragement, and
confidence in the s tuden_ts' a_bi li ty in_mathemati_cs_
was found positive and significant only for Hispanic
female students (~ = .49);
(6) the relationships with the students' perception of
their fathers' interest, encouragement, and
confidence in the students' ability in mathematics
were found positive and significant for Caucasian and
Hispanic female students (~ = .47 & .53
respectively);
(7) positive and significant relationship with attitudes
toward success in mathematics was found only in
Hispanic female students (~ = .58);
(8) the relationship with the students' perception of
their teachers' attitudes toward them as learners of
96
----1 I
mathematics was found positive and significant for
Caucasian male students (~ = .47);
(9) the relationship with effectance motivation in
mathematics was found positive and significant for
Chinese-American male students (~ = .53) and
Caucasian female students (r = .40).
There was no significant ethnic-related difference
regarding the relationships between spatial visualization
ability and mathematics achievement (see table 15). There
was also no significant ethnic-related difference with
respect to the relationships between mathematics achievement
and each of the eight variables of attitudes toward
mathematics.
The results of multiple regression analysis indicated
that spatial visualization as well as ethnicity were the
significant predictors of mathematics achievement for the
student population in this study. The variable, Confidence
of Learning Mathematics, was the only attitude variables
which significantly predicted mathematics achievement.
97
c - ------ --1
---1 -- - -------- -----
l '
' ____ ,
------- -i !
Chapter 5
DISCUSSIONS AND CONCLUSIONS
The purposes of this study were to investigate possible
ethnic and gender distinctions among the variables of
mathematics achievement, spatial visualization ability, and
attitudes toward mathematics. This study also examined the
correlation between mathematics achievement and the other
variables in study. All subjects in this study met four
requirements: l) fully prof~cient in English, 2) not
receiving free or partially free lunches, 3) not enrolled in
special education programs, and 4) have completed at least
four years of education in the United States. An effort was
made to determine if the research hypotheses of this study
would be confirmed by the results of the data analyses. The
results and findings, which were presented and summarized in
chapter 4, are discussed below.
Ethnic Differences and Sex Differences in Mathematics Achievement
The results of this study suggested that there were
ethnic-related differences in mathematics achievement.
Significant sex differences also were found in this study.
Seventh and eighth grade Chinese-American students,
males and females, clearly outperformed their Caucasian and
Hispanic schoolmates in mathematics achievement. The
98
----j
i -------_- ~
1 ! ~ -- --J
_____ j
j
results of this study are consistent with the findings in
Backman's (1972) and Tsang's (1976, 1984) research.
In contrast to previous studies (Anick et al., 1981;
Fernandez et al., 1975; Matthews et al., 1984), Hispanic
students' performance was not shown to be inferior to that
of Caucasian students, particularly the Hispanic male
students who scored at the same level as the Caucasian males
and females.
The results of a two-way ANOVA revealed that female
students achieved significantly lower than male students in
mathematics. This finding agreed with the research
conducted by McGee (1979) and Garrard (1981) but conflicted
with the studies of Armstrong (1981), Fennema (1980), and
Fennema and Sherman (1977, 1978). By examining the raw
scores, Chinese-American and Hispanic male students attained
a wider lead over their female counterparts than did
Caucasian males.
Some socio-cultural factors may facilitate
Chinese-American students' performance in mathematics.
Chinese-American students may be encouraged and pressured by
their parents to excel in school. They tend more often to
choose mathematics-related fields as their focuses of future
studies and career goals. Research data are consistent in
reporting higher mathematics achievement of Chinese-American
students.
99
i _____ l
- --~ j
_________ , ~
-- -----! ~ I
~
\ Hispanic students were found consistently to achieve at
a lower level than Caucasian students in previous studies.
However, most studies reviewed in this report did not take
the students' English proficiency and family-income level
into consideration.
As indicated in the district documents, the majority of
Hispanic students in the Stockton Unified School District
come from low income families. Many of them are classified
as limited-English-proficient students. The present opinion
among educators and researchers seems to be that
limited-English-proficiency and low family-income negatively
affect the students' academic performance in school. When
English proficiency and family-income levels are controlled,
the results may show a different pattern. The data of this
study, which included only students who were fully English
proficient and not from low-income families, did not
indicate that Hispanic students perform at a significantly
lower level than Caucasian students.
Ethnic and Sex Differences in Spatial Visualization Ability
Ethnic-related differences in spatial visualization
were found in many studies (Backman, 1972; Lesser et al.,
1965; Loehlin et el., 1975; Stodolsky & Lesser, 1967; Werner
et al., 1968). Dason (1972) suggested that development of
mental abilities can be determined by biological factors,
interaction with the physical and social environments, and
100
! ·-.---l
l d
i i
social-cultural elements. In these studies,
Chinese-American and Caucasian students showed higher
spatial visualization ability as compared to some other
ethnic students.
The data of the spatial visualization variable in this
study indicated that there was a significant interaction
between ethnicity and gender. Chinese-American male
students scored significantly higher than Hispanic male
students and female students of each ethnic group. Also,
Caucasian males had significantly higher scores than did
Hispanic males and Hispanic females.
Spatial visualization, although it might be a hereditary
trait, seems to be shaped by cultural and social
environment. In Chinese tradition, women may be given fewer
opportunities than males to explore the activities which may
enhance the development of spatial skills. This factor may
have some effect o~ the Chinese females' relatively modest
spatial ability scores.
Interestingly, Hispanic males scored almost the same as
Hispanic females. Traditionally, Hispanic females are
placed in a subordinate role to males (Wong, 1982), and they
consequently may be denied the opportunities to develop
their spatial visualization abilities. However, a tenable
explanation as to why Hispanic males performed at the same
level as their female counterpart is not readily apparent.
101
l '1
- -4
-----1 .... ----- ---- ---~
l
___ _j !
Maccoby and Jacklin (1974) have hypothesized that
changes in the role of women in society has changed their
achievement patterns, and thus could narrow sex-related
differences in intellectual abilities. Some results of the
more recent studies of Fennema & Sherman (1977, 1978)
reported no sex-differences in spatial visualization, which
obviously are consistent with this hypothesis. Garrard
(1981), however, indicated that eighth grade male students
outperformed females in spatial visualization while in the
same year Armstrong found that 13-year old females performed
better than males in this mental ability. The results of
this study are in accord with Garrard's findings.
Ethnic and Sex Differences in Attitudes Toward Mathematics
The results of this study provided very few ethnic or
sex differences in attitudes toward mathematics.
Chinese-American students, who achieved at significantly
higher level in mathematics, also reported more confidence
in their ability to learn mathematics than Caucasian and
Hispanic students. Confidence in learning mathematics was
not significantly different between Caucasian and Hispanic
groups. However, Hispanic male students tended to have more
confidence than Caucasian students, or Hispanic female
students.
In contrast to Fennema & Sherman's finding (1978),
middle school male students in this study did not report
102
------~
------ ! ----- ---------1
"
--~ l j
j ---1 ~
more confidence in their abilities to learn mathematics than
did female students. However, Hispanic male students tended
to have more confidence than Hispanic female students.
The data of this study showed significant ethnic
differences in Effectance Motivation in Mathematics, but no
sex difference was found. This finding indicated that
female middle school students had similar intrinsic or
investigative interest in mathematics as their male
counterparts. Such a result conflicts with the common
belief that girls are not a~ interested as boys in
mathematics, but was consistent with previous studies
conducted by Fennema & Sherman (1977, 1978).
The data showed that neither males nor females of any
of the three ethnic group labeled mathematics as a male
domain. There was a significant sex by ethnicity
interactions, which indicated that the sex difference in
this variable for Chinese-American students tended to be
narrower than those of the other ethnic groups (see figure
2). Caucasian males perceived mathematics as a male domain
at a significantly higher level than did Caaucasian females,
Hispanic females, and both genders of Chinese-Americans.
Also, Hispanic females and Hispanic males perceived
mathematics as a male domain at a significantly higher level
than Caucasian females.
Students of each ethnic group and gender strongly
agreed on the usefulness of mathematics currently and in
103
1
relationship to their future education. The finding of a
non-significant sex difference in attitudes toward usefulnss
of mathematics in middle school was somewhat consistent with
a study of Fennema & Sherman (1977). However, Fennema &
Sherman's study showed that middle school males, compared to
females, perceived mathematics as more useful, and such
difference became significant in high schools.
The results of this study suggest that male students do
not perceive their parents and teacher as more positive
toward them as learners of mathematics than do females.
Moreover, no ethnic differences were found. The students of
both genders from all three ethnic groups perceived high and
positive attitudes about themselves as learners of
mathematics from their parents and teachers.
The Relationship between Mathematics Achievement and Spatial Visualization
Previous studies (Aiken, 1973; Fennema, 1974; Fennema &
Sherman, 1978; Garrard, 1981; Moses, 1978, Sherman, 1979)
consistently reported positive relationships between
mathematics achievement and spatial visualization. Fennema
& Sherman (1978) found that a significant correlation
between spatial visualization and mathematics achievement
was similar for males and females. The results of this
study (~ = .58 for all females, r = .47 for all males)
agreed with their findings.
104
- __ _]
------j
'
By examining each gender of the three ethnic groups,
the correlation between mathematics achievement and spatial
visualization were found significant and positive for
females in each ethnic group with correlation coefficients
ranging from .57 to .75. For males, the positive and
significant relationship between these two variables was
only found in Caucasian students (~ = .75). The
relationship was not significant for Chinese-American
students (r = .24). Surprisingly, the data for the Hispanic
male students showed a negative relationship (~ = -.35)
between mathematics achievement and spatial visualization
scores.
The Re la t i-o-n-s-h-ip---betw-e-en--M-a-th_e_m_l>_t_i c s Achievement and Mathematics Attitudes
The results of this study showed mixed relationships
between mathematics achievement and the eight variables of
mathematics attitudes across the ethnic groups. One
variable, Mathematics Usefulness, was significantly related
to mathematics achievement in Chinese-American ale (r =
.52), Caucasian males (~ = .47) and Hispanic female (~ =
.60) students. Mathematics as a Male Domain was expected
to have a close relationshiop with females' mathematics
achievement. In contrast to the Fennema & Sherman's (1978)
findings, the results of this study showed that this
attitude was not generally related to mathematics
achievement for both females and males with the exception of
105
--1
----1 l
Chinese-American females (~ = .40). The r ranged from r =
-.09 to r = .40.
The variable, Confidence in Learning Mathematics, was
significantly related to mathematics achievement for
Caucasian and Chinese-American male students, and Caucasian
females. Father scale and Teacher scale were closely
related to the mathematics achievement for Caucasian and
Hispanic students.
Attitudes toward Success in Mathematics highly related
to mathematics achievement for Hispanic females, but the
relationship was not significant for other groups of
student. Effectance Motivation Scale in Mathematics highly
related to mathematics achievement for Chinese-American
rna 1 e s.
There were no significant ethnic differences in the
relationships between mathematics achievement and attitudes
toward mathematics (see table 15). Significant sex
differences were found only in two variables, Usefulness of
Mathematics and Attitude toward Success in Math, in Hispanic
students (see Table 16).
The Predictions of Mathematics Achievement
Some studies have demonstrated that spatial
visualization is a significant predictor of mathematics
achievement in secondary school (Sherman, 1979; Cramond,
1983). It is not surprising that spatial visualization is a
106
\ heavily weighted predictor of mathematics achievement since
both measures of abilities are within the same domain as
stated in Cramond's study (1983). Spatial visualization
accounted for 29% of the variation of mathematics
achievement in this study. The result of this study was in
-l, accord with Cramond's finding.
Ethnicity had the second highest predictive ability of
mathematics achievement among all independent varialbes in
this study. As indicated in Table 18 and 19, being
Chinese-American contributed positively and significantly
toward mathematics achievement scores. Confidence of
Learning Mathe atics was the only attitude variable which
significantly predicted mathematics achievement.
___ j ---1
Conclusions
Based on the findings and discussions in this study,
l the following conclusions are made: 1
l. The subjects in this study were selected from the
students who were fully English proficient and were
not from low-income families in three middle schools
in the Stockton Unified School District. The results
indicated that Chinese-American students achieved
significantly higher than Caucasian and Hispanic
students in mathematics. As the results of this
study suggest, when English proficiency and
107
~~~ I 1
-~~ --- ~ ;
-~----1
family-income levels are controlled, Hispanic
students (males and females combined) did not achieve
at a significantly lower level than did Caucasian
students as suggested in previous studies. It
appears that if variables such as spatial
visualization ability, attitudes, parental
expectations, socioeconomic status, English
proficiency, child-rearing practice etc. are
considered, mathematics achievement may not differ
between ethnic groups or genders.
2. There was a significant sex difference in mathematics
achievement for middle school students. The males
scored significantly higher than females.
3. Chinese males scored at significantly higher level
than Chinese females in spatial visualization.
However, there was no significant sex difference in
Caucasian and Hispanic groups.
4. Students of both gender and all ethnic groups showed
strongly positive attitudes toward mathematics.
5. There were very few significant sex differences or
ethnic differences in attitudes toward mathematics.
Chinese-American male and female students showed more
confidence in their ability to learn mathematics.
Hispanic male students also tended to have good
confidence in mathematics.
6. When all three ethnic groups were combined, females
had a significant higher correlation between
108
__ j
~~~I =-=--==-!
' ;
-----1 ------ ---
j
~~~I ' --1
l j
mathematics achievement and spatial visualization
than did males.
7 . There was no significant ethnic difference in the
relationships of mathematics achievement and
mathematics attitudes.
8 . Spatial visualization, ethnicity and confidence of
learning mathematics were significant predictors of
mathematics achievement for the student population of
this study.
Recommendations for Further Studies
This study made some contributions to our understanding
of the patterns of mathematics achievement and their
relationships to spatial visualization and attitudes toward
mathematics of three ethnic groups. However, these
relationships as well as ethnic distinctions in mathematics
achievement require further study.
There is a need to investigate mathematics achievement
of Southeast Asian refugee students, who represent various
ethnic groups previously residing in Southeast Asia. It
would also be a valuable study to compare ethnic Chinese
students who came from different areas such as mainland
China, Taiwan, Hong Kong, and Southeast Asia.
More research is needed to examine the relationship
between mathematics achievement and family-incomes within
109
~~~~ ~
l
--1 1
1
and across ethnic groups. A study using longitudinal
samples of students from first grade to high school is also
desirable in order to determine the inception age of ethnic
divergences, if any, in mathematics achievement, and in
cognitive and affective domains in mathematics learning.
Increasingly, valid and reliable instruments for the
measurement of affective and cognitive domains of younger
students need to be developed.
Since ethnic and sex differences in spatial
visualization were found in this study, it would be
beneficial to conduct studies of aptitude-treatment
interaction (ATI) to various ethnic groups and both genders.
The most suitable mathematics pedagogy may be discovered in
these kinds of studies for each ethnic group and gender.
110
LIST OF REFERENCES
Aiken, L, R, & Dreger, R. M. The effect of attitudes on performance in mathematics. Journal of Education Psychology, 1961, ~. 19-24.
Aiken, L. R, Attitudes toward mathemtics. Review of Educational Research, 1970, 40, 551-596.
Aiken, L. R. Research on attitudes toward mathematics. 19-7-2-, -l-9-,----2-2-9~2-3-4-o.--------------
Aiken, L. R. Ability and Creativity in mathematics. of Educational Research, 1973, ~. 405-432.
Update on attitude and other affective
Review
Aiken, L. R. variables Research,
in learning m~~hematics. Review of Educational 1976, ~. 293-311.
Anick, C. M., Carpenter, T. M., & Smith, C. Minorities and mathematics: results from the National Assessment of Educational Progress. Mathematics Teach~, 1981, ?...!!_, 560-568.
Armstrong, J. M. Achievement and participation of women in mathematics: results of two national surveys. Journal for Research in Mathematics Education, 1981, l!• 356-372.
Backman, M. E. Pattrerns of mental abilities: ethnic, socioeconomic, and sex difference. American Educational Research Journal, 1972, 2_, l-12.
Battista, M. The interaction between two instructional treatments of algebraic structures and spatial visualization ability. Journal of Educational Research, 1981, ?...!!_, 337-341.
Battista, M. T., Wheatley, G. H., Talsma, G. The importance of spatial visualization and cognitive deve~~pment for geometry learning in preservice elementary teacher. Journal for Research in Mathematics Education, 1982, .!:2< 5)' 1982' 332-340.
Bennett, G. K., Seashore, H. G., & Ivesman, A. G. Differential Aptitude Tests, FormS and T (4th ed.). New York: Psychological Corp., 1973.
Bergeson, T. M. A comparison of two methods of improving mathematics attitudes in intermediate teachers and councelors (Doctoral dissertation, University of
111
' --,
Washington. 1982). Dissertation Abstracts International. 1982. 43. l809A-l810A. (University Microfilms No. 82-26. 52 1)
Brass e 11 . A . Petry. S . . Brooks . D. M. mathematics achievement, and pupil mathematics. Journal for Research Education. 1980. 11. 22-28.
Ability grouping. attitude toward in Mathematics
Brinkman. E. H. Programmed instruction as a technig_.u.,e~_.,f-'o'-'r.,_ ____ _ ----;---------~:tmprovlng spatial visualization. Journal of Applied
-·-l --------1 l
J _d
•
Psychology, 1966.50, 1.79-184.
Burbank. I. k. Relationships between parental attitude toward mathematics and student attitude toward mathematics, and between student attitude toward mathematics and student achievement in mathematics (Doctoral dissertation, Utah State University, 1968). Dissertation Abstract International, 1970, 30, 3359A-3360A. (University Microfilms No. 70-2427)
Callahan. W. J. Adolescent attitudes toward mathematics. Mathematics Teacher, 1971, 64, 751-755.
Coleman. R. H. An analysis of certain components of mathematical abilities and an attempt to predict mathematical achievement in a specific situation. Dissertation Abstract. 1956. 16, 2062.
Com~rehensive Tests of Basic Skills: Preliminary Technical Report, Form U and V. Monterey, California: California Test Bureau/McGraw-Hi 11. 1982.
Comprehensive Tests of Basic Skills: Technical Report. Forms U and v. Montery, California: California Test Bureau/McGraw-Hill. 1984.
Cramond. B. L. Predicting mathematics achievement of gifted adolescent females (Doctoral Dissertation, University of Georgia, 1982). Dissertation Abstract International, 1983, 43, 2136A-3139A. (University Microfilms No. 822··8677)
Cronbach ,L. J. psychology.
The two disciplines of scientific American Psychology, 1957, 12, 671-682.
Dasen, P. R. Cross-cultural Piagetian research: a summary. Journal of Cross-cultural Psychology, 1972, 3, 23-40.
Davidson. A. R., & Thomson, E. Cross-cultural studies of attitudes and beliefs. In H. C. Triandis & R. W. Brislin
112
_I I
--~~~-~
l ~··· ~- -
-~ ' '
\ (eds,), Handbook of Cross-cultural Psychology (vol. 5). Boston: Allyn and Bacon, Inc, 1980.
DuRapau, V. J., & Carry, L. R. Interaction of general reasoning ability and processing strategies in geometry instruction. Journal for Research in Mathematics Education, 1981, ~' 15-26.
j Eastman, P. M., & Carry, L. R. Interaction of spatial I visualization and general reasoning abilities with J instructfonal treatment in quadratic inequalities: a
___ -_--+1 ______ -~fc-tU:_,t.h.ar_LnY_e.s_tLg.a-t.i.o-n-. J o u "n a 1 for R e sea r c h in ~ Mathematics Education, 1975, ~. 142-149.
~:c.ccj
I l 1
1
__ ] ------ --~
l j l
Eastman, P. M., & Salhab, M. The interaction of spatial visualization and general reasoning abilities w~th instructional treatment on absolute value equations. Journal for Research in Mathematics Education, 1978, ~. 152-154.
Echols, P. S. A study of the relationships among students' attitudes toward mathematics and the variables of teacher attitude, parental attitude, achievement, ability, sex of the student and grade level of the student (Doctoral dissertation, University of Houston, 1981). Dissertation Abstract International, 1982, 42, 4752A. (University Microfilms No. 82-10-431) --
Fennema, E. Mathematics, spatial ability and the sexes. Madison, Wisconsin: University of Wisconsin, 1974. (ERIC Document Reproduction Service No. ED 089 998)
Fennema, E., Sherman, J. Fennema-Sherman mathematics attitude scales: instruments designed to measure attitudes toward the learning of mathematics by females and males. APA: JSAS Catalog of Selected Documents in Psychology, 1976, ~ (2)®, 31. (Ms. 1225)
Fennema, E. & Sherman, J. Sex-related differences in mathematics achievement, spatial visualization and affective factors. American Educational Research Journal, 1977, .!:_i, 51-71.
Fennema, E. H., & Sherman, J. A sex-related differences in mathematics achievement and related factors: a further study. Journal for Research in mathematics Education, 1978, ~. 189-203.
Fennema, E., & Behr, M. Individual differences and the learning of mathematics. In R. J. Shumway (Ed.), Research in mathematics education, Reston, Va: National Council of Teachers of Mathematics, 1980.
113
------l
d - - -~
j
I
l .
-- - -l l
Ferendez, C., Espinosa, R. W., & Dornbusch s. M. Factors perpetuating the low academic status of Chicano high school students. Palo Alto, Calif.: Stanford University, 1975. (ERIC Document Reproduction Service No. ED 110 241)
Fox, L. H. A mathematics Program for fostering precocious achievement. In J. Stanley, D. P. Keating, & L. H. Fox (Eds.), Mathematical Talent: Discovery Description and Development. Baltimore: John Hopkins University Press, 1974.
Fruchter, B. Measurement of spatial abilities: history and background. Educational and Psychological Measurement, 1954, 14 (2), 387-395.
Garrard, S. W. Sex differences, spatial visualization ability and the effects of induced and imposed imagery on problem solving performance (Doctoral dissertation, University of Southern California, 1980). Dissertation Abstracts International, 1981, ~. 115A.
Gibson, E. J. Improvement in perceptual judgment as a function of controlled practice or training. Psychological Bulletin, 1953, 1Q_, 401-431.
Greenfield, P.M., & Runer, J. S. growth. In D. A. Goslin (Ed.), Theory and Research. New York:
Culture and cognitive Handbook of Socialization Rand McNally, 1969.
Guttman, R., & Guttman, B. intercorrelation pattern for a biological basis.
Cross-cultural stability of abilities: a possible Human Biology, 1963, 1.2•
Haladyna, T., Shaughnessy, J., & Shaughnessy, J. M. causal analysis of attitude toward mathematics. for Research in Mathematics Education, 1983, l±•
of an test 53-60.
A Journal 19-29.
Herman, W. L., Potterfield, J. E., Dayton, C. M., & Amershek, K. G. The relationship of teacher-centered activities and pupil-centered activities to pupil achievement and interest in 18 fifth-grade social studies classes. American Educational Research Journal, 1969, 6 (2), 227-239.
Hull,- C. H., & Nie, N. H. Statistical package for the social sciences update 7-9. New York: McGraw-Hill, ~ln9~8~1~.~~~~~~~~~~~
Jackson, R. E. The attitudes of disadvantaged students toward mathematics (Doctoral dissertation, Indiana Univversity, 1973). Dissertation Abstract International, 1974, li• 3690A. (University Microfilms No. 74-380)
114
---~ ----~-~-1' -----------
'
~d_---•._j - -1
Knight, G. P., Kagan, S., & Nelson, W. J. Acculturation of second- and third-generation Mexican American children: field independence, locus of control, selfesteem, and school achievement. Journal of Cross-cultural Psychology, 1978, !• 87-97.
Lesser, G. S., Fifer, G., & Clock, D. H. Mental abilities of children from different social-class and cultural groups. Monograph of the Society for Research in Child Development, 1965, ~. l-115.
_-_-_--_--_-_1,__! -----~L_o_e_h_LLn_,_J .. -C .• -L-i-n-d-z-e-y-,-G--.-,--&-S-p-u-h-l-e-r-,--J-. -N-.--R-a-c-e·----------
differences in intelligence. San Francisco~eeman,
------~~-·___ -l
I 1
--l -------1 j
1975.
Maccoby, E. E. & Jacklin, C. N., The Psychology of Sex Differences, Stanford University Press, Stanford, CA. 1974.
MacCorquodale, P. Psycho-social influences on the accomplishments of Mexican-American students. Tucson, Arizona: Arizona University, 1980. (ERIC Document Reproduction Service No. ED 200 355)
Majoribank, K. Ethnic and environmental influences on mental abilities. American Journal of Sociology, 1972, 2.§_, 323-337.
Martin, B. L. Spatial visulization abilities of central Washington State College prospective elementary and secondary teachers of mathematics (Doctoral dissertation, Oregon State University, 1966). Dissertation Abstract, 1966, 27, 2427A. (University Microfilms No. 67-730)
Mattews, W. Race- and sex-related differences in high school mathematics enrollment (Doctoral dissertation, University of Chicago, 1980). Dissertation Abstract International, 1881, ~. 3934A.
Mathews, W. Influences on the learning and participation of minorities in mathematics. Journal for Research in Mathematics Education, 1984, ~. 84-95.
Matthews, W., Carpenter, T., Lindquist, M. M., Silver, E. A. The third national assessment: minorities and mathematics. Journal for Research in Mathematics Education, 1984, ~. 165-171.
Mayeske, G. W., Okada, T., Beaton, A. E.,Jr., Cohen, W., & Wisler, C. E. A study of the achievement of our nation's students. Washington, D. C.: Office of Education (DHEW), 1973. (ERIC Document Reproduction Service No. ED 085 626)
115
--~
~ -===J--· -.j -
-----
McGee, M. G. Human spatial abilities: psychometric studies and environmental, genetic, hormonal, and neurological influences. Psychological Bulletin, 1979, 86, 889-918.
Moses, B. E. The nature of spatial ability and its relationship to mathematical problem solving (Doctoral dissertation, Indiana University, 1977). Dissertation Abstract International, 1978, 38, 4640A. (University Microfilms No. 73-30,309) --
Muscio, R. D. Factors related to quantitative understanding ---~r--------1-:n-t-h-e---s-i-x-t-h-g-r-a-d-e-.--A-r-i-t-hme-t·i-c-T·e-a-c-h-e-r-,-t-%_2-,-9,
258-262. -- -=-=:=] =------=-~-:::-----:-.::~-===~;
j
l l
-·-l ------i
i I
- ~
Neale, D. C. The role of attitudes in learning mathematics. Arithmetic Teacher, 1969, li• 631-640.
Nelson, L. T., Jr. The relationship between verbal, visual-spatial, and nume~ical abilities, and the learning of the mathematical concept of function (Doctoral dissertation, University of Michigan, 1968). Dissertation Abstract Internationa, 1969, ~· 218A.
Nevin, M. Sex differences in participation rates in mathematics and science at Irish schools and universities. 1:..2_, 88-91.
International Review of Education, 1973,
Nie, N.H., Hull, C. H., Jenkins, J. G., Steinbrenner, K., & Bent, D. H. Statistical package for the social sciences. New York: McGraw-Hill, 1975.
Poffenberger, T. & Norton, D. Factors in the formation of attitudes toward mathematics. Journal of Educational Research, 1959, ~. 171-176.
Ramirez, M., & Castaneda, A. Cognitive styles and cultural democracy in education. Social Science Quarterly, 1973, 2]_, 895-904.
Ramirez, M., & Castaneda, A. Cultural democracy, bicognitive development, and education. New York: Academic Press, 1974.
Ramirez, M., & Price-Williams, D. R. Cognitive styles of children of three ethnic groups in the United States. Journl of Cross-cultural Psychology, 1974, ~. 212-219.
Roberge, J. J., & Flexer, B. K. Cognitive style, operativity, and mathematics achievement. Journal for Research in Mathematics Education, 1983, .!:.!:• 344-353.
116
' -------,
Sherman, J. Problem of sex differences in space perception and aspects of intellectual functioning. Psychological Review, 1967, z±, 290-299.
Sherman, J. Predicting mathematics performance in high school girls and boys, Journal of Educational Psychology, 1979, ~. 242-249.
Sherman, J. Mathematics, spatial visualization, and related factors: changes in girls and boys, grades 8-11. Journal of Educational Psychology, 1980, Il• 476-482.
Spickerman, w. R. A study of the relationships between attitudes toward mathematics and some selected pupil characteristics in a Kentucky high school (Doctoral dissertation, University of Kentucky, 1965). Dissertation Abstract International, 1970, 30, 2733A. (University Microfilms No. 70-731) --
Stafford, R. E. Sex differences in spatial visualization as evidence of sex-linked inheritance. Perceptual and Motor Skills, 1961, ll• 428.
Stafford, R. E. Hereditary quantitative reasoning. 1972, i!· 183-201.
and environmental components of Review of Education Research,
Sternberg, R. J., & Well, E. M. An aptitude x strategy interaction in linear syllogistic reasoning. Journal of Educational Psychology, 1980, 2!• 226-239.
Stodolsky, S. s., disadvantaged. 546-593.
& Lesser, G. Learning patterns in the Harvard Educational Review, 1967, l!•
Tsang, S. L. The effects of the language f~ctor and the cultural content factors of mathematics achievement tests on Chinese and Chicano students 'Doctoral dissertation, Stanford University, 1976). Dissertation Abstract International, 1977, l!• 714A. (University Microfilms No. 76-18, 808)
Tsang, S. L. The mathematics education of Asian Americans. Journal for Research in Mathematics Education, 1984, l2• 114-122.
Valverde, L. A. Underachievement and underrepresentation of Hispanics in mathematics & mathematics-related careers. Journal for Research in Mathematics Education, 1984, l2• 123-133.
117
-·~ ·------1 -- - -1
1
j -·. -. .. j -·===~
-~
1
--j
-·- ---~ - ---- ---- ~
~
-·--j - ---- ---j
1 i
j
l l
Vernon, P. E. Ability factors and environmental influences. American Psychologist, 1965, ~. 723-733.
Werner, E. E., Simonian, K., & Smith, R. S. Ethnic and socioeconomic status differences in abilities and achievement among preschool and school age children in Hawaii. Journal of Social Psychology, 1968, 21• 43-59.
Wrigley, J. Factorial nature of ability in elementary mathematics. British Journal of Educational Psychology, 1958, ~. 61-78.
Wong, P. C. Relationship of two field-dependent-independent measures to reading and mathematics achievement of Anglo-American, first-generation Chinese-and Mexican-American elementary school children (Doctoral dissertation, University of the Pacific, 1982). Dissertation Abstract International, 1982, ~. 1416A. (University Microfilms no. 82-83, 922)
118