spatiotemporal analysis in monitoring landscape …
TRANSCRIPT

Journal of Environmental Science and Sustainable Development Journal of Environmental Science and Sustainable Development
Volume 2 Issue 1 Article 7
7-31-2019
SPATIOTEMPORAL ANALYSIS IN MONITORING LANDSCAPE SPATIOTEMPORAL ANALYSIS IN MONITORING LANDSCAPE
DYNAMIC PATTERNS IN TROPICAL PEAT ECOSYSTEM (STUDY IN DYNAMIC PATTERNS IN TROPICAL PEAT ECOSYSTEM (STUDY IN
TEBING TINGGI ISLAND, RIAU, INDONESIA) TEBING TINGGI ISLAND, RIAU, INDONESIA)
Dheny Sampurno Badan Informasi Geospasial (BIG), Jl Raya Jakarta-Bogor Km 46, Cibinong-Bogor, 16911 | Graduate School of Asian African Areas Studies (ASAFAS), Kyoto University, 46 Yoshidashimoadachichu014d, Sakyu014d-ku, Kyoto, 606-8304, Japan, [email protected]
Follow this and additional works at: https://scholarhub.ui.ac.id/jessd
Part of the Environmental Studies Commons
Recommended Citation Recommended Citation Sampurno, Dheny (2019). SPATIOTEMPORAL ANALYSIS IN MONITORING LANDSCAPE DYNAMIC PATTERNS IN TROPICAL PEAT ECOSYSTEM (STUDY IN TEBING TINGGI ISLAND, RIAU, INDONESIA). Journal of Environmental Science and Sustainable Development, 2(1), 75-96. Available at: https://doi.org/10.7454/jessd.v2i1.33
This Review Article is brought to you for free and open access by the School of Environmental Science at UI Scholars Hub. It has been accepted for inclusion in Journal of Environmental Science and Sustainable Development by an authorized editor of UI Scholars Hub.
Journal of Environmental Science and Sustainable Development
Volume 2, Issue 1, Page 75–96
ISSN: 2655-6847
Homepage: http://jessd.ui.ac.id/
DOI: https://doi.org/10.7454/jessd.v2i1.33 75
SPATIOTEMPORAL ANALYSIS IN MONITORING LANDSCAPE DYNAMIC
PATTERNS IN TROPICAL PEAT ECOSYSTEM (STUDY IN TEBING TINGGI
ISLAND, RIAU, INDONESIA)
Dheny Sampurno1,2,* 1Badan Informasi Geospasial (BIG), Jl Raya Jakarta-Bogor Km 46, Cibinong, Bogor 16911,
Indonesia 2Graduate School of Asian African Areas Studies (ASAFAS), Kyoto University, 46 Yoshida-
honmachi, Sakyo-ku, Kyoto 606-8304, Japan
*Corresponding author: e-mail: [email protected]
(Received: 12 June 2019; Accepted: 29 July 2019; Published: 31 July 2019)
Abstract
The increasing deforestation rate in the tropical peat landscape is impacting the sustainability of the
peat ecosystem. Previous studies have monitored the deforestation on tropical forest using Landsat
imagery. The analysis of forest landscape dynamics is crucial in understanding the functions of the
sustainable ecosystem and to support sustainable development goals. The government controls the peat
ecosystem function (PEF) based on the Indonesian Government Regulation No. 71/2014. However, a
booming sago industry has resulted in smallholders establishing farms and expanding into the peatland.
In this study, we conducted a spatiotemporal analysis of land use/cover changes based on a series of
Landsat images from 1987–2016 along with a consideration of multidimensional factors, including the
PEF, state forest land, and hotspots, to identify the mechanism and driving factors of the peat landscape
dynamics. A qualitative approach was also used via interviews with 78 plantation smallholders to
supplement the information obtained regarding the agricultural expansion. The observed land use/cover
changes clearly indicate the conversion of forest into plantation land. The magnitude of the deforestation
rate indicates the ongoing massive deforestation and spatial distribution of the protected PEF.
Unproductive plantations within the state forest land totalled one-quarter of the Tebing Tinggi Island in
2016. The land use/cover change patterns indicate that timber extraction, peat fires, infrastructure
development, and agriculture expansion are the driving factors. The actual minimum of income of
plantation smallholders is leading to increases in unproductive land and poverty.
Keywords: community participation; conservation; diversity of vegetation; water resources
1. Introduction
As the world’s third-largest tropical forest, Indonesia has been suffering from at least 2.8
million hectares of deforestation per year (WWF, 2009). From 2000–2012, there were 15.79
Mha of deforested areas, with 2.60 Mha of primary forest loss within wetland landforms
(Margono, Potapov, Turubanova, Stolle, & Hansen, 2014). Using medium resolution remote
sensing data, the KLHK (Kementerian Lingkungan Hidup dan Kehutanan–Ministry of
Environment and Forestry) has annually monitored the national land coverage and has focused
on the deforestation in State Forest Land (Kawasan Hutan). Numerous researchers (Adnyana,

Journal of Environmental Science and Sustainable Development 2(1): 75–96
DOI: https://doi.org/10.7454/jessd.v2i1.33 76
Nishio, Sumantyo, & Hendrawan, 2006; Anggraini & Trisakti, 2011; Austin, Schwantes, Gu,
& Kasibhatla, 2019; Darmawan, 2012; Darmawan, Siregar, & Zahrah, 2016; Margono et al.,
2014; Margono, Usman, Budiharto, & Surgardiman, 2016; Vetrita & Hirano, 2012; Winarso
& Purwanto, 2018; Zubaidah, Vetrita, & Kohmaruddin, 2014) have monitored and analyzed
the vegetation in tropical forests using satellite imagery to generate spatial, statistical, and other
types of information. The ecological effect of deforestation has triggered global awareness of
greenhouse gas emissions (Chave et al., 2005; WWF, 2009). In 2011, in addition to monitoring
activities and the obligation to reduce CO2 emissions, to minimize forest degradation, the
KLHK and other institutions announced a moratorium on the issuing of new permits for any
concessions pertaining to the state forest and peatland based on Presidential Instruction No.
10/2011.
Figure 1. Map of research location–Tebing Tinggi Island
(Source: BRG, 2017)
Tropical rainforest, which is part of the tropical island peat ecosystem, plays an essential
role in the island’s ecological and hydrological systems (Miettinen & Liew, 2010). Tebing
Tinggi Island, a 138,000-hectare offshore island in the Sumatera Region of Riau Province, is
81% peatland, with the rest comprising fluvio-marine mineral deposits. The ecological
interrelation of the rainforest and tropical peat ecosystem affects both the below-ground peat
and the above-ground ecosystem and agriculture or plantations. Indeed, the tropical peat
ecosystem is an entire unit (comprising biotic, abiotic, and human inhabitants), the individual
components of which can be disturbed by its degradation (Turner, 2008). Of the 17 global
Sustainable Development Goals (SDGs), forest sustainability is key to the 15th goal (life on
land), as are the issues of deforestation and land management practices that affect the economy
(Nkonya, Mirzabaev, Baumgartner, & Cherlet, 2016). The forest landscape dynamics that

Journal of Environmental Science and Sustainable Development 2(1): 75–96
DOI: https://doi.org/10.7454/jessd.v2i1.33 77
impact the tropical peat ecosystem are also factors that relate to the 13th SDG goal regarding
climate action.
Geospatial information about the tropical peat ecosystem demonstrates the holistic nature
of the system’s components and interrelations. Shimada, Takada, & Takahashi (2016) reported
that Indonesia had previously produced a variety of peat maps pertaining to different peat soil
thickness layers. In 2015, the KLHK used these peat maps and peat ecosystem characteristics
to construct a KHG (Kesatuan Hidrologis Gambut–Peat Hydrology Unit). The KHG has
provided a thorough description of the tropical peat ecosystem based on its territorial functions
and ecology, including the forest landscape, which relates to the peat soil conditions (Farina,
2008; Schulze & Mooney, 1994). Spatial data analysis can be used to describe phenomena that
occur on the Earth’s surface, including peat ecosystems. Moreover, peat soil surveys can be
spatially analyzed to examine the tropical peat ecosystem’s characteristics within the KHG.
Recurring deforestation of the tropical peat ecosystem on Tebing Tinggi Island is a major
component in the mechanism and driving factors of forest changes. The emergence of the HPH
(Hak Pengusahaan Hutan–Forest Logging Concessionary) in the 1970s intensified the
economy of Riau Province by 50% along with its ecological consequences, especially to the
lowland tropical rainforest (Hidayat, 2016). Log exportation was banned in 1985, so HPHs
were converted into HTI (Hutan Tanaman Industri–Industrial Forest Plantation) concessions
(Hidayat, 2018). Nevertheless, former panglongs (Chinese coolies on timber extraction
company run by Taukeh (Chinese Bussinesman) in 1860s and 1870s) occupied the offshore
island of Sumatera, continued to extract timber, and established sago plantations (Erman,
2017). The spatial landscape disturbances caused by sporadic land clearing are related to the
expansion of the plantation industry. As the major plantation industry, the small-scale sago
plantations of smallholders make up the local households of Tebing Tinggi Island. The
increasing number of sago plantations has not only accelerated the sago starch mill production
but also extended the plantation area toward the peat forest (Biancalani & Avagyan, 2014; The
Society of Sago Palm Studies, 2015). Other agricultural and plantation products like rubber,
coconut, and areca palm, along with horticultural production, have become commodity
companions but have not been a substantial consideration with respect to dynamic land use
changes. Approximately 84% of the sago smallholders in Indonesia produced nearly 400,000
tons of sago in 2016 (Directorate General of Estate Crops, 2017) and the Kepulauan Meranti
District contributed more than 171,000 tons, with the majority from Tebing Tinggi Island.
Plantations have expanded into protected PEF zones mostly within the HP (Hutan Produksi–
Production Forest). In general, the Indonesian government serves as a proctor of private
companies and currently prohibits any new concessions in tropical-peat-ecosystem protected-
function zones. However, smallholders do not fall under these regulations. This means that the
private permit prohibition enables smallholders to expand their agricultural lands without the
need for any legal certification on state forest land. Furthermore, deforestation due to
agricultural land expansion in the protected zone (mostly as peat dome) is not the only
problematic issue in terms of peat degradation (Mizuno, Fujita, & Kawai, 2016). The massive
2014 peat fire also damaged both the agricultural land and peat forest. These plantation
expansion problems worsened both the deforestation of the tropical peat landscape as well as
the sustainability of the tropical peat ecosystem and the livelihoods of local smallholders.

Journal of Environmental Science and Sustainable Development 2(1): 75–96
DOI: https://doi.org/10.7454/jessd.v2i1.33 78
Spatiotemporal analysis of the dynamic landscape patterns and the deforestation of the
tropical peat landscapes can identify the mechanism and driving factors of the changes that are
occurring in multiple dimensions, including the PEFs, state forest land, and hotspots. The
primary data used in this study, i.e., Landsat imagery from the U.S. National Aeronautics and
Space Administration (NASA) provided spatial information on land use/cover changes. A
series of Landsat images, beginning with the Landsat 5 MSS to the latest Landsat 8 Operation
Land Imager (OLI), comprises a continuous data series for monitoring land use/cover (Austin
et al., 2019; Margono et al., 2016). Unlike previous research (Austin et al., 2019; Margono et
al., 2014), in this study, we conducted a multidimensional analysis that included qualitative
interviews with sago plantation smallholders in four villages: Tanjung Pranap, Kundur, Sungai
Tohor, and Kepau Baru to supplement our spatial analysis results and better reflect actual
conditions at the local level. The results of our spatial analysis and qualitative approach
highlight the strong connection between the livelihoods of the local plantation smallholders
and the dynamic land utilization.
2. Methods
2.1 Data Collection
The Landsat time-series images were used in our spatiotemporal analysis of the tropical peat
ecosystem (Table 1). The Earth Resources Technology Satellite (ERTS-1), later renamed
Landsat, was launched by NASA and the United State Geological Survey (USGS).
Table 1. Landsat data collections
Landsat Number of Images Acquisition Year
Landsat 5 MSS 55 1987–2011
Landsat 7 ETM+ 17 1999–2012
Landsat 8 OLI 19 2013–2016
(Source: USGS, 2018)
Landsat imagery of Tebing Tinggi Island was retrieved within path 126 and row 59. The
continuous acquisition of Landsat imagery along the same path and row enables determination
of the dynamic changes of the Earth’s surface. The different spatial resolutions provided by
Landsat 5 MSS (Multispectral Scanner), Landsat 7 ETM+ (Enhanced Thematic Mapper +),
and Landsat 8 OLI with multispectral bands enable the generation of medium-scale geospatial
information (mapping scale of 1:100.000 up to 1:50.000) (USGS, 1997, 2013). Landsat uses
the visible and infrared spectral bands. Four our time-series analysis, we used Landsat 5 MSS,
7 ETM+, and Landsat 8 OLI imagery from 1987 to 2016, with multiple data from each year to
obtain cloud-free images for object-oriented digital image classification.
The multidimensional layers in our spatiotemporal analysis included spatial data for the
PEF, state forest land, hotspots, and village administrations (indefinite–locally approved). The
tropical PEFs within the Tebing Tinggi KHG were acquired from the KLHK and the minister
of KLHK Decree 906/2016 regarding state-forest-land Riau Province geospatial data. The
Spatio-temporal analysis covers all area of the island, both State Forest Land (Kawasan Hutan
Negara) and land for non-forest use (area penggunaan lain). The purposes of the state-forest-

Journal of Environmental Science and Sustainable Development 2(1): 75–96
DOI: https://doi.org/10.7454/jessd.v2i1.33 79
land analysis was to identify the dynamic landscape patterns and distribution of the smallholder
community or non-legal private concessions and their relation to the issue of land ownership.
We classified the hotspot data derived from LAPAN (Lembaga Penerbangan dan Antariksa
Nasional–Indonesian National Institute of Aeronautics and Space) with 80%-confidence data,
which are lands designated as having high liability with respect to fire. Maps of the villages
Tanjung Pranap, Kundur, Sungai Tohor, and Kepau Baru were developed from a topographic
map and updated with a new administration boundary from the Kepulauan Meranti District and
approved by the village authorities. These villages were designated as the focus of our study
along with a qualitative investigation of the peatland management by local smallholders in the
village areas. To address the agricultural expansion issues, interviews were conducted in all
four villages, which were chosen based on the magnitude of their deforestation and land
use/cover changes. The interviews were conducted with 78 plantation smallholders whose
primary incomes are derived from sago. Land management, gross incomes, and historical land
use possession information comprised the main information obtained during the interviews.
We examined the previous land use conditions and validated the time-series data obtained from
the Landsat images against these data.
2.2 Spatiotemporal Digital Image Analysis
A preliminary step in our spatiotemporal analysis was the classification of Landsat images by
digital image processing (Figure 2) using a segmented decision tree for the land use/cover map.
Digital image interpretation cannot achieve the thematic and geometric accuracy that is
possible by a visual interpretation of satellite imagery. Digital image interpretation is also
resource and time intensive, as is rasterized digital processing (Badan Standardisasi Nasional,
2014; Ghorbani & Pakravan, 2013; Lillesand & Kiefer, 1993). The image classification pre-
processing involves image correction of radiometric and geometric disturbances. The
segmentation process reduces the rate of spectral failure detection while the decision-tree
image classification is more effective (Pooja, 2011; Darwish, Leukert, & Reinhardt, 2004).
Object-based image analysis (OBIA) is used to classify land use/cover from Landsat
images through the segmentation of their spectral characteristics and textures. Considering the
accuracy of OBIA, in this study, we used aerial photographs (BRG, 2017) with field
verification data for our key interpretation. We divided the digital classifications into four
classes: dense forest, secondary forest/plantation, shrubs, and non-dominant vegetation. The
cloud cover problem was minimized by overlaying a series of Landsat images obtained during
each year (Table 1) to reduce the atmospheric disturbances caused by cloud, haze, and the scan
line corrector (SLC)-off problems of Landsat 7 ETM+. The digital image classification of the
land use/cover map series did not substantially explain the results, which has been noted by
many researchers (Figure 2).

Journal of Environmental Science and Sustainable Development 2(1): 75–96
DOI: https://doi.org/10.7454/jessd.v2i1.33 80
Figure 2. Spatiotemporal analysis and qualitative approach workflow
2.3 Deforestation Rate
The peat forest is a crucial component of the tropical peat ecosystem. Deforestation is defined
as land conversion by clearing from forest use/cover to other land uses such as plantation or
agriculture (Hidayat, 2016; Humphreys, 1996). Forest loss, in general, is defined as the clearing
of tree trunk vegetation, including timber plantations (Margono et al., 2014). Deforestation of
a peat forest is the initial stage of the observed landscape dynamics of a tropical peat ecosystem.
The spatiotemporal analysis of forest coverage includes the annual deforestation rate and
deforestation patterns.
Evaluations of the deforestation of tropical forests are often flawed. Deforestation is
frequently related to socioeconomic conditions (Puyravaud, 2003). The annual rate of
deforestation can be used to obtain a spatial understanding of the dynamic landscape pattern in
the research area. Puyravaud (2003) used the following equations to measure the magnitude
and pattern of the annual rate of deforestation:
𝑞 = 𝑒𝑟 − 1 (1)
and

Journal of Environmental Science and Sustainable Development 2(1): 75–96
DOI: https://doi.org/10.7454/jessd.v2i1.33 81
𝑟 =1
𝑡2−𝑡1𝑙𝑛
𝐴2
𝐴1 . (2)
The q is typically preferred rather than r when expressing the annual rate of deforestation,
with q referring to the “annual” rate of change, which is derived from the economic term. In
this case, r is the calculation of the annual rate of forest changes, which depend on the time
interval (t) and the area of deforestation (A). In this study, we used Puyravaud (2003) equations
along with annual forest-cover maps and the same classification variables, while adjusting the
techniques relating to spectral values for each type of Landsat image.
2.4 Qualitative Approach
The time-series land use/cover data enables the detection of spatial differences for the analysis
of the mechanism and driving factors of land use/cover changes (Fortin & Dale, 2005; Liu,
Wang, & Long, 2008). The mechanism of land use/cover changes is related to smallholders’
activities related to plantation expansion, and we analyzed forest change patterns in multiple
dimensions to determine the magnitude of the changes and their dispersion. For this study, we
defined a plantation smallholder as a small-scale farmer of self-owned land who uses traditional
techniques for intensive permanent plantation management (Altieri & Koohafkan, 2008;
Angelsen et al., 2014; Biancalani & Avagyan, 2014; Rist & Feintrenie, 2010;). We used
temporal land use/cover data to analyze the driving factors behind land use/cover changes. The
spatiotemporal analysis variables for the tropical peat ecosystem include the land use/cover
data series and multidimensional factors (state forest land, PEF zonation, and hotspots) (Table
2).
Table 2. Variables in spatiotemporal analysis on tropical peat ecosystem
Variable Types Variables
Dependent State forest land, PEF zones, hotspots
Independent Land use/cover data series
(Source: Liu et al., 2008)
The aim of our qualitative surveys was to include the driving factor of
agricultural/plantation expansion in our analysis, i.e., land cultivation by smallholder plantation
industries in the peat ecosystems. We conducted interviews with the heads of households who
own land and cultivate it for plantations in the villages of Tanjung Pranap, Kundur, Sungai
Tohor, and Kepau Baru to ask about their land management and income derived from their
plantations (Angelsen et al., 2014). The observed time-series land use/cover data were verified
against the information obtained in these interviews and with the observed dynamic landscape
patterns.
3. Results and Discussion
Tebing Tinggi Island is characterized by a vast peatland that comprises part of the overall
tropical peat ecosystem. Organic matter piled up on this island has formed domes with depths
up to 12.32 meters, which can be found in the village of Tanjung Pranap on the western part of
the island. The thick peat soil of the island comprises approximately 67% of the total land

Journal of Environmental Science and Sustainable Development 2(1): 75–96
DOI: https://doi.org/10.7454/jessd.v2i1.33 82
(91,302 hectares), whereas the mineral soil scattered throughout the island comprises just 19%
of the total land (24,978 hectares). Settlements are located in the vicinity of peat domes, mineral
soils, or shallow peat soil < 50 cm in depth, which locals refer to as “Tanah kelat manis.” The
island has three sub-districts: Tebing Tinggi Barat, Tebing Tinggi, and Tebing Tinggi Timur,
and its population of 83,734 people live in 33 villages (BPS, 2017), the majority of whom
reside in Selat Panjang (capital of the Kepulauan Meranti District) and neighboring villages in
the sub-district of Tebing Tinggi.
3.1 Spatiotemporal Analysis
From 1987 to 2016, extensive deforestation and forest changes occurred in the peat ecosystem,
both in its PEF protected and cultivated zones. From our analysis of the mechanism of land
use/cover changes based on Landsat images, the annual rate of deforestation is substantial in
peatland, in which the forest plays a crucial role in the sustainability of the peat ecosystem
(Miettinen & Liew, 2010; Miettinen, Shi, & Liew, 2016). The highest annual rate of forest
change occurred between 1996 and 1997, with roughly 13.7 thousand hectares of natural forest
lost (Figure 3, Table 3). To understand the spatiotemporal aspects of this annual rate of
deforestation at these locations, it is necessary to focus on the high rates agricultural land
expansion, but land and peat fires also contribute to this high annual rate of deforestation.
Figure 3. Annual rates of deforestation
Next, we focused on the annual rate of changes in the forest classifications, with the value
of r derived from the calculation of the total area (A) for each year recorded. High annual rates
of deforestation (r) occurred in several years, as indicated in Table 3 (1989: 9.6%, 1991: 9.6%,
1997: 17.2%, 2000: 7.9%, 2015: 8%, and 2016: 14.8%). The high deforestation percentages
for these years are indicated by the gap values of r and q. The higher the gap, the greater is the
degree of deforestation that occurred.
-20%
-18%
-16%
-14%
-12%
-10%
-8%
-6%
-4%
-2%
0%
1 2 3 6 7 11 14 16 17 18 19 20 21 22 23 24 25 26 27 28 29
RA
TE O
F D
EFO
RES
TATI
ON
(%
)
DT (YEAR)
r q

Journal of Environmental Science and Sustainable Development 2(1): 75–96
DOI: https://doi.org/10.7454/jessd.v2i1.33 83
Table 3. Annual deforestation rates according to r and q values
A1 A2 t1 t2 Dt r (%) q (%) (r-q)/r
(%)
118,328.30 113,481.18 1987 1988 1 −4.2 −4.1 2.1
113,481.18 103,144.91 1988 1989 1 −9.6 −9.11 4.6
103,144.91 101,493.50 1989 1990 1 −1.6 −1.60 0.8
101,493.50 92,184.05 1990 1991 1 −9.6 −9.17 4.7
92,184.05 89,262.53 1991 1992 1 −3.2 −3.17 1.6
89,262.53 88,861.51 1992 1993 1 −0.5 −0.45 0.2
88,861.51 88,373.34 1993 1994 1 −0.6 −0.55 0.3
88,373.34 87,747.02 1994 1995 1 −0.7 −0.71 0.4
87,747.02 86,452.51 1995 1996 1 −1.5 −1.48 0.7
86,452.51 72,793.25 1996 1997 1 −17.2 −15.80 8.1
72,793.25 70,789.98 1997 1998 1 −2.8 −2.75 1.4
70,789.98 66,798.29 1998 1999 1 −5.8 −5.64 2.8
66,798.29 61,703.60 1999 2000 1 −7.9 −7.63 3.9
61,703.60 57,145.48 2000 2002 2 −3.8 −3.76 1.9
57,145.48 51,386.23 2002 2005 3 −3.5 −3.48 1.7
51,386.23 48,098.19 2005 2009 4 −1.7 −1.64 0.8
48,098.19 46,967.33 2009 2010 1 −2.4 −2.35 1.2
46,967.33 43,724.57 2010 2013 3 −2.4 −2.36 1.2
43,724.57 42,083.74 2013 2014 1 −3.8 −3.75 1.9
42,083.74 38,847.17 2014 2015 1 −8.0 −7.69 3.9
38,847.17 33,492.45 2015 2016 1 −14.8 −13.78 7.1
The high annual deforestation rates indicate the mechanism of the recurrent forest changes
on Tebing Tinggi Island. Currently named as PT. NSP, PT Sampoerna concession converted
massive areas of forest land into sago plantations in 1997, as well as causing sporadic forest
changes (Figure 4). With respect to recent deforestation, forest loss has increased since 2013,
irrespective of the high deforestation levels that had occurred in 1989, 1991, and 1997 (Figure
4). This deforestation was due to the establishment of plantations, mostly by smallholders and
their landlords who were formerly taukeh or panglong.

Journal of Environmental Science and Sustainable Development 2(1): 75–96
DOI: https://doi.org/10.7454/jessd.v2i1.33 84
Figure 4. Deforestation rate 1987–2016
In addition to the conversion of forest to agricultural land, the land use/cover changes also
included shrubs and bare land, which have also expanded over vast areas. The area of these
unproductive lands has increased and expanded to the peat dome, which has led to high fire
vulnerability (Page & Hooijer, 2016). According to hotspot data, fires during the 2000–2015
period impacted land/use cover changes and vice versa. Two massive fire hazard events
occurred in 2005 and 2014 on Tebing Tinggi Island.
Figure 5. Hotspot fire indication on 2005 land use/cover map (IUPHHBK–Ijin Usaha
Pemungutan Hasil Hutan Bukan Kayu–non-timber forest product utilization permit)
In 2005 there were 218 hotspots (Figure 5) and in 2014 there were 636 hotspots (Figure 6).
In both 2005 and 2014, fire hazard events were more massive in the protected PEF zone, with
195 massive hotspots in 2005 and 577 in 2014. The NSP company suffered massive fire events
-
10
20
30
40
50
60
70
80
90
100
-
2
4
6
8
10
12
14
16
'88 '89 '90 '91 '92 '93 '94 '95 '96 '97 '98 '99 '00 '01 '02 '03 '04 '05 '06 '07 '08 '09 '10 '11 '12 '13 '14 '15 '16
Tota
l Fo
rest
Lo
ss (
in T
ho
usa
nd
sH
ect
are
s)
An
nu
al D
efo
rest
atio
n (
in T
ho
usa
nd
sH
ect
are
s)
Deforestation Forest Loss
Journal of Environmental Science and Sustainable Development 2(1): 75–96
DOI: https://doi.org/10.7454/jessd.v2i1.33 85
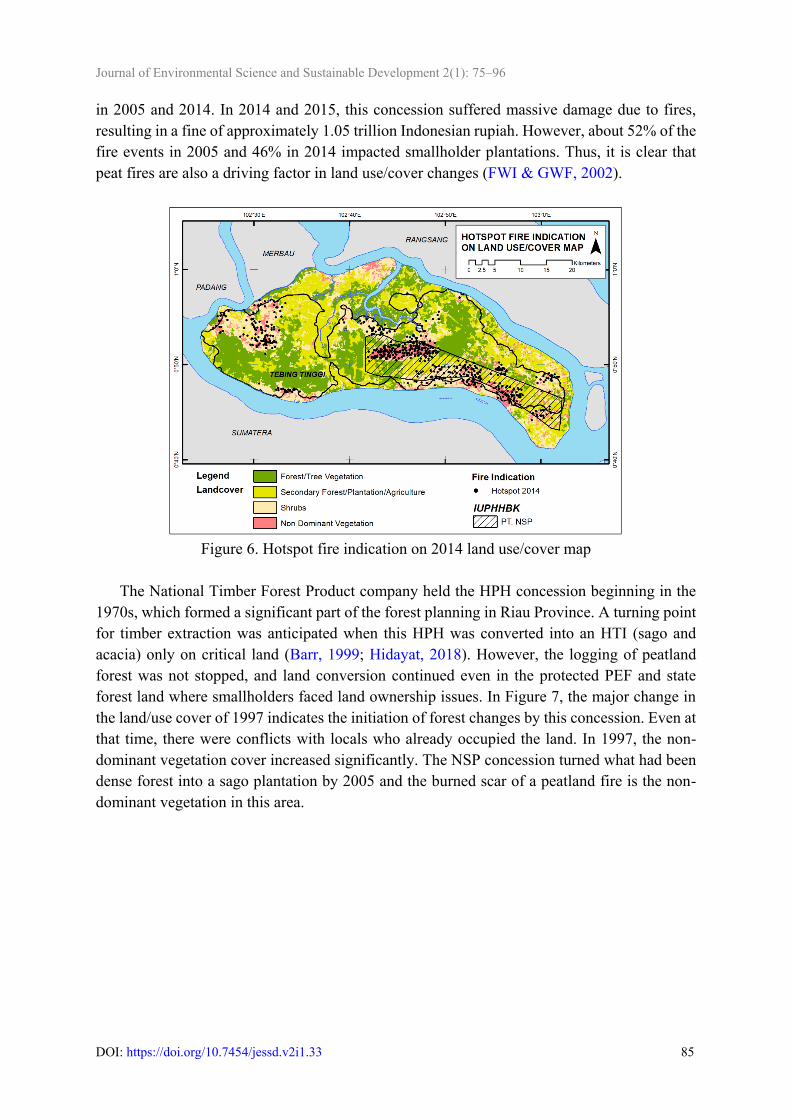
in 2005 and 2014. In 2014 and 2015, this concession suffered massive damage due to fires,
resulting in a fine of approximately 1.05 trillion Indonesian rupiah. However, about 52% of the
fire events in 2005 and 46% in 2014 impacted smallholder plantations. Thus, it is clear that
peat fires are also a driving factor in land use/cover changes (FWI & GWF, 2002).
Figure 6. Hotspot fire indication on 2014 land use/cover map
The National Timber Forest Product company held the HPH concession beginning in the
1970s, which formed a significant part of the forest planning in Riau Province. A turning point
for timber extraction was anticipated when this HPH was converted into an HTI (sago and
acacia) only on critical land (Barr, 1999; Hidayat, 2018). However, the logging of peatland
forest was not stopped, and land conversion continued even in the protected PEF and state
forest land where smallholders faced land ownership issues. In Figure 7, the major change in
the land/use cover of 1997 indicates the initiation of forest changes by this concession. Even at
that time, there were conflicts with locals who already occupied the land. In 1997, the non-
dominant vegetation cover increased significantly. The NSP concession turned what had been
dense forest into a sago plantation by 2005 and the burned scar of a peatland fire is the non-
dominant vegetation in this area.

Journal of Environmental Science and Sustainable Development 2(1): 75–96
DOI: https://doi.org/10.7454/jessd.v2i1.33 86
(a) (b)
(c) (d)
(e) (f)
(g) (h)
Figure 7. Land use/cover changes from 1987–2016: (a) 1987, (b) 1989, (c) 1991, (d) 1997, (e)
2000, (f) 2005, (g) 2015, (h) 2016

Journal of Environmental Science and Sustainable Development 2(1): 75–96
DOI: https://doi.org/10.7454/jessd.v2i1.33 87
Infrastructure construction improved accessibility but was also a driving factor of
deforestation along roadway (FWI & GWF, 2002). Between 2000 and 2005, the rate of
deforestation was high due to peatland fires that spread throughout the western part of the
island, in which the main road extends from the port in the village of Tanjung Peranap to the
capital of the Tebing Tinggi District, Selat Panjang. This road, built in 2002, passes through
thick peat soil. The road was built to reduce the cost of transporting water from the main island
of Sumatera. Along this road (red line in Figure 7: land use/cover 2005, 2015, 2016), the forest
was cleared for its construction in 2000 and this clearing continued until the port had been
connected with the city of Selat Panjang. The land use/cover classification also changed to
bare land following the peat fires that occurred on this part of the island. According to 38 local
interviewees who live on this western part of the island, the increased accessibility to their
agriculture land/plantations triggered new smallholders to clear nearby forest. The
infrastructure development on the peat dome area (inside the protected PEF) impacted not only
the deforestation and peatland degradation (shallow water table), but the road also remains
unstable due to thick underlying peat material.
Figure 8. Land use/cover changes from 1987–2016
In Figure 8, the graph shows the expansion of plantation areas, which can be compared
with the areas of remaining natural forest. This driving factor has occurred in not only the
cultivated PEF zone but also in the protected PEF zone. Deforestation has increased inside the
protected zone, much of which has become agricultural land. In 2009, the total forest area was
less than that of agricultural land in the protected zone. Despite the implementation of the PEF
regulation in 2015, the peat ecosystem had already become endangered. The peat fires shown
in Figures 4 and 5 on Tebing Tinggi Island indicate that the amount of peat degradation
increased due to the imbalances in the peat landscape. Agricultural expansion into the protected
zone has resulted in massive forest changes.

Journal of Environmental Science and Sustainable Development 2(1): 75–96
DOI: https://doi.org/10.7454/jessd.v2i1.33 88
Figure 9. Land use/cover changes from 1987–2016 within the PEF and four villages: Tanjung
Peranap, Kundur, Kepau Baru, and Sungai Tohor
The spatiotemporal analysis results show the forest conversion into agricultural/plantation
areas or the clearing for other land uses and the impact of the peat landscape dynamics.
Agricultural land expansion, which involved deforestation on Tebing Tinggi Island due to
sporadic land clearing, was followed by the establishment of plantations to support the local
economy. About 22,400 hectares of land use/cover conversion into plantations have affected
the protected PEF zone and 10,600 hectares of the cultivated PEF zone, which can be observed
by the pattern outlined in Figure 9 (marked as Forest-Plantation). Unless the peatlands have
been drained by canals or the land has been long exposed, sago is well adapted to its moist
conditions or logged natural tropical peatland (Coursey, 2003; Small, 2011; The Society of
Sago Palm Studies, 2015). Another significant phenomenon in the study period occurred when
agriculture/plantation lands have failed and were abandoned (leaving shrubs or bare land), with
the total abandoned area reaching 33,500 hectares or 24.6% of the island. In the protected PEF
zone, abandoned agricultural/plantation land has reached 19,500 hectares (about 58% of total
abandoned agriculture/plantation land). These abandoned plantations seldom leave even shrubs
remaining, and damaged plantations are mostly found either in either the western or southern
parts of the island.
Journal of Environmental Science and Sustainable Development 2(1): 75–96
DOI: https://doi.org/10.7454/jessd.v2i1.33 89
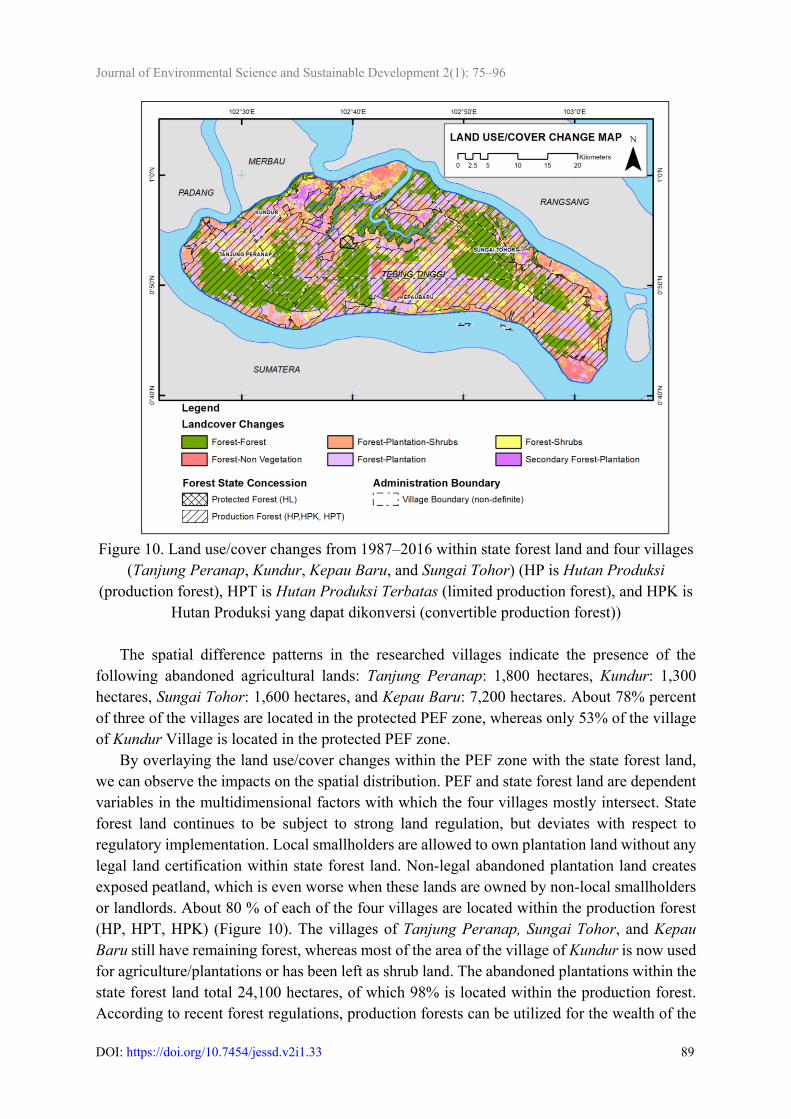
Figure 10. Land use/cover changes from 1987–2016 within state forest land and four villages
(Tanjung Peranap, Kundur, Kepau Baru, and Sungai Tohor) (HP is Hutan Produksi
(production forest), HPT is Hutan Produksi Terbatas (limited production forest), and HPK is
Hutan Produksi yang dapat dikonversi (convertible production forest))
The spatial difference patterns in the researched villages indicate the presence of the
following abandoned agricultural lands: Tanjung Peranap: 1,800 hectares, Kundur: 1,300
hectares, Sungai Tohor: 1,600 hectares, and Kepau Baru: 7,200 hectares. About 78% percent
of three of the villages are located in the protected PEF zone, whereas only 53% of the village
of Kundur Village is located in the protected PEF zone.
By overlaying the land use/cover changes within the PEF zone with the state forest land,
we can observe the impacts on the spatial distribution. PEF and state forest land are dependent
variables in the multidimensional factors with which the four villages mostly intersect. State
forest land continues to be subject to strong land regulation, but deviates with respect to
regulatory implementation. Local smallholders are allowed to own plantation land without any
legal land certification within state forest land. Non-legal abandoned plantation land creates
exposed peatland, which is even worse when these lands are owned by non-local smallholders
or landlords. About 80 % of each of the four villages are located within the production forest
(HP, HPT, HPK) (Figure 10). The villages of Tanjung Peranap, Sungai Tohor, and Kepau
Baru still have remaining forest, whereas most of the area of the village of Kundur is now used
for agriculture/plantations or has been left as shrub land. The abandoned plantations within the
state forest land total 24,100 hectares, of which 98% is located within the production forest.
According to recent forest regulations, production forests can be utilized for the wealth of the

Journal of Environmental Science and Sustainable Development 2(1): 75–96
DOI: https://doi.org/10.7454/jessd.v2i1.33 90
local community, but depending on the PEF zonation, the peatland forest landscape is protected
as crucial for the peat dome (protected PEF).
3.2 Qualitative Investigation of Agricultural Expansion
Further analysis of the driving factors behind agriculture/plantation expansion, with a focus on
sago plantations, indicates that local smallholders have significant roles in land management
(Biancalani & Avagyan, 2014). We conducted a qualitative investigation of the incomes of
smallholders in four villages. The results indicate that the village of Tanjung Peranap is home
to 1,481 locals and comprises 339 households (see Table 4). This village has the least number
of farmers and active farmers, most of whom are plantation laborers. The respondents were
chosen and filtered to obtain those who were active smallholders who grow sago as their
primary incomes. The village of Sungai Tohor has the most significant number of active sago
smallholders with 12 local sago starch mills, which boosts the sago production from this
village.
Table 4. Composition of local farmers in the four villages of Tebing Tinggi Island
Village Population Household Smallholders Active
Smallholders Respondents
Tanjung
Peranap 1,481 339 70 28 18
Kundur 1,095 281 210 64 20
Kepau Baru 1,409 288 176 74 22
Sungai Tohor 1,220 255 314 96 18
The number of farmers was determined based on those who make their income from their
plantation. Active farmers typically own land and regularly manage their land from seeding to
harvest. Non-active farmers are usually paid laborers for plantation owners or horticulture, or
they have unproductive agricultural lands. The respondents were active farmers who manage
land located on peat soil. Some of the respondents were originally from their present villages,
whereas others were transmigrants from Java, North Sumatera, and eastern parts of Indonesia.
The majority of sago plantation owners are middle-aged and own about 1–2 hectares. Older
owners (mostly over the age of 50 years) and those who have inherited plantations from
wealthy parents have more than 2 hectares. The comparison of land ownership was based on
the minimum agricultural land given to an official transmigrant to whom at least 2 hectares was
given for cultivation (Means & Hardjono, 2006). Incomes were calculated based only on
plantation activities.

Journal of Environmental Science and Sustainable Development 2(1): 75–96
DOI: https://doi.org/10.7454/jessd.v2i1.33 91
Table 5. Plantation incomes for smallholder sago farmers
Village Household
Respondent
Land Ownership Monthly Plantation Production
Income (Rupiah)
> 2 Ha < 2 Ha Lowest Highest Average
Sungai Tohor 18 10 8 350,000 7,400,000 2,470,000
Kepau Baru 22 8 14 300,000 4,000,000 1,740,000
Kundur 20 10 10 300,000 8,500,000 2,324,000
Tanjung Peranap 18 14 4 500,000 3,750,000 2,112,000
In the village of Sungai Tohor, most people own more than 2 hectares of a sago plantation,
which generates a maximum of 7.4 million rupiahs per month (USD 6,830 annually). These
incomes depend on the surrounding natural peat ecosystem. In 2009, the LUM (Lestari Unggul
Makmur) company held about ten thousand hectares of HTI concessions located along the
village of Sungai Tohor, which were in conflict with the community land and thus was unable
to operate. Therefore, the land available for local use expanded, along with that in other
villages. Surprisingly, most of the owners were not local, but landlords or those who held semi-
formal rights to the land. These landlords had either bought the land from locals who were in
debt or the land had already been acquired through transactions with village authorities. In the
western part of Tebing Tinggi Island, the villages of Tanjung Peranap and Kundur have tended
to establish rubber plantations due to the lower water table of the peat soil. The village of
Tanjung Peranap still has dense forest, with sago being the major plantation type mostly owned
by landlords. Meanwhile, areas in the western part of the island (villages of Tanjung Peranap
and Kundur) have been acquired by locals by self-funded land clearing and land titles. When
fires spread across the plantation fields, some of the locals have discontinued cultivation
activities.
The majority of people living in the village of Kepau Baru grow sago as their primary
agricultural revenue. Unfortunately, the tragedy of the massive fires in 2005 and 2014 led to
massive destruction of their sago plantations, including the NSP company plantations which
were deemed responsible for triggering the fires. The NSP company is mainly located within
the protected PEF (peat dome) zone and actually in areas above the smallholders’ plantations.
The massive canal blockages in the vicinity of the NSP plantation has resulted in minimal water
flow to smallholders’ plantations. Furthermore, the plantations are located within the protected
PEF zone as well as within the production forest concessions (HP, HPT, HPK) where the
smallholders cannot obtain legal certification. Thus, plantations within state forest land involve
not just an issue of land ownership, but also of the illegal practice of agricultural land
transformation that continues either by the community or individuals. Abandoned agricultural
land has also become evident when these practices have not always successful, due to a lack of
peat ecosystem knowledge paired with a drive to obtain more income.
4. Conclusion

Journal of Environmental Science and Sustainable Development 2(1): 75–96
DOI: https://doi.org/10.7454/jessd.v2i1.33 92
In this study, we performed a spatiotemporal analysis of the deforestation in the protected PEF
zones of state forest land during the 1987 to 2016 period, the results of which indicate the
mechanism of the land use/cover changes. To understand the mechanism of land use/cover
changes including forest changes, the annual rate of deforestation highlights the magnitude of
the deforestation and the distribution of spatial differences illustrates the patterns of impact on
the peat dome (protected PEF) and on production forest land. In the coastal KHG, Tebing
Tinggi Island, these changes threaten ecological and hydrological sustainability as agricultural
land has expanded into the protected zone. Paludiculture systems within tropical peat
ecosystem have enabled the establishment of sago plantations on peatland. The appropriate
composition of sago plantation and forest landscape in the protected PEF zone is the key factor
enabling sustainable peatland management based on the peat ecosystem characteristics.
Unproductive lands have increased in the PEF zone in production forest with private
ownership. The recurring mechanism of abandoned agricultural land is degrading the peatland
and leading to poverty in the local community.
We adopted a qualitative approach of interviewing smallholders to provide more detailed
information. On Tebing Tinggi Island, the driving factors are timber extraction, peatland fire,
infrastructure development, and agricultural expansion. Our spatiotemporal analysis of
multidimensional factors indicated the spatial distribution of these driving factors and our
interviews with the local community enabled a better understanding of the plantation
smallholder’s livelihoods and concerns. These include their inability to gain legal certification
within state forest land, their knowledge of peatland management, and their agricultural
practices. Furthermore, new smallholders have emerged and converted forest into plantations
in hopes of generating a high income from sago production. However, illegal plantation
expansion has led to the abandonment of damaged agricultural lands due to the resulting small
incomes and lack of knowledge about proper peatland management. Massive fires are also a
constant threat, and sporadic agricultural expansion will continue unless community and
government solutions are developed based on the PEF and smallholders presences within state
forest lands are legally acknowledged. Community-based forest management is the solution to
effective peatland management and governance within the community to sustainably balance
the forest landscape and plantations and achieve legal ownership certification. Spatial
education for the local peatland community with respect to peatland management of the tropical
peat ecosystem can raise both ecological and spatial awareness and support responsible
behavior.
The Spatio-temporal analysis in this study uses Landsat Imageries with multidimensional
layers and applies to Tebing Tinggi Island as a KHG. The analysis of spatial patterns of land
use/cover changes limited from 1987 – 2016, focusing on the agriculture expansion, based on
the concern of forest concession changeover from HPH to HTI. The continuing of forest
change and the restoration on the exposed tropical peatland are the substantial spatial
information using active sensor remote sensing data to eliminate the cloud cover problem as
well as the monitoring on the peat degradation and restoration.
Acknowledgements
This study is supported by the Kyoto University Explorer Program, Tropical Peatland Society
Project (Research Institute for Humanity and Nature - RIHN), and the RISET-PRO (Research

Journal of Environmental Science and Sustainable Development 2(1): 75–96
DOI: https://doi.org/10.7454/jessd.v2i1.33 93
and Innovation in Science and Technology Project) scholarship–Ministry of Research,
Technology, and Higher Education, Indonesia. I would also like to express my sincere gratitude
to the Ministry of Environment and Forestry (KLHK), Peat Restoration Agency (BRG), and
the Geospatial Information Agency (BIG) for the supporting data.
References
Adnyana, I W. S., Nishio, F., Sumantyo, J. T. S., & Hendrawan, G. (2006). Monitoring of Land
Use Changes Using Aerial Photograph and Ikonos Image in Bedugul, Bali. International
Journal of Remote Sensing and Earth Sciences, 3, 51–58.
http://dx.doi.org/10.30536/j.ijreses.2006.v3.a1206
Altieri, M., & Koohafkan, P. (2008). Enduring Farms: Climate Change, Smallholders, and
Traditional Farming Communities. In Third World Network Penang, Malaysia. Retrieved
from http://www.fao.org/nr/water/docs/enduring_farms.pdf
Angelsen, A., Jagger, P., Babigumira, R., Belcher, B., Hogarth, N. J., Bauch, S., … Wunder, S.
(2014). Environmental Income and Rural Livelihoods: A Global-Comparative Analysis.
World Development, 64(S1), S12–S28. https://doi.org/10.1016/j.worlddev.2014.03.006
Anggraini, N., & Trisakti, B. (2011). Study of the Impacts of Climate Change on Forest Fires
and Deforestation in West Kalimantan Province (Kajian Dampak Perubahan Iklim
Terhadap Di Provinsi Kalimantan Barat). Journal Pengideraan Jauh dan Pengolahan Data
Citra, 8, 11–20. Retrieved from
http://jurnal.lapan.go.id/index.php/jurnal_inderaja/article/view/1609
Austin, K. G., Schwantes, A., Gu, Y., & Kasibhatla, P. S. (2019). What causes deforestation in
Indonesia? Environmental Research Letters, 14(2), 024007. https://doi.org/10.1088/1748-
9326/aaf6db
Badan Standardisasi Nasional. (2014). SNI 8033:2014: Metode penghitungan perubahan
tutupan hutan berdasarkan hasil penafsiran citra penginderaan jauh optik secara visual
(in Bahasa). Badan Standardisasi Nasional (BSN) - Indonesian National Standarization
Agency.
Barr, C. (1999). Will HPH reform lead to sustainable forest management?: Questioning the
assumptions of the ’sustainable logging’ paradigm in Indonesia. Center for International
Forestry Research (CIFOR).
Biancalani, R., & Avagyan, A. (2014). Towards climate-responsible peatlands management.
Rome: FAO. Retrived from http://www.fao.org/3/a-i4029e.pdf
BPS. (2017). Kepulauan Meranti District in Number (Kabupaten Kepulauan Meranti dalam
Angka). BPS (Badan Pusat Statistik - Statistical Biro) Kepulauan Meranti District.
BRG. (2017). Data Acquisition and Thematic Mapping Project. Jakarta: BRG (Badan Restorasi
Gambut - Peat Restoration Agency).
Chave, J., Andalo, C., Brown, S., Cairns, M. A., Chambers, J. Q., Eamus, D., … Yamakura, T.
(2005). Tree allometry and improved estimation of carbon stocks and balance in tropical
forests. Oecologia, 145(1), 87–99. https://doi.org/10.1007/s00442-005-0100-x
Coursey, D. G. (2003). SAGO: The equatorial swamp as a natural resource. In Agro-Ecosystems
(Vol. 8). https://doi.org/10.1016/0304-3746(82)90004-x
Darmawan, B., Siregar, Y. I., & Zahrah, S. (2016). Sustainable management of peat swamp
forest ecosystems toward forest and land fires in Kampar Peninsula, Sumatera (Pengelolaan

Journal of Environmental Science and Sustainable Development 2(1): 75–96
DOI: https://doi.org/10.7454/jessd.v2i1.33 94
Keberlanjutan Ekosistem Hutan Rawa Gambut Terhadap Kebakaran Hutan dan Lahan di
Semenanjung Kampar, Sumatera). Jurnal Manusia dan Lingkungan, 23(2), 195–205.
https://doi.org/10.22146/jml.18791
Darmawan, Y. (2012). Comparison of the vegetation indices to detect the tropical rain forest
changes using BFAST model. International Journal of Remote Sensing and Earth Sciences,
9(1), 21–34. https://doi.org/10.30536/j.ijreses.2012.v9.a1823
Darwish, A., Leukert, K., & Reinhardt, W. (2004). Image Segmentation for trhe Purpose of
Object-based Classification. 2003 IEEE International Geoscience and Remote Sensing
Symposium. Proceedings (IEEE Cat. No.03CH37477), 2039–2041.
https://doi.org/10.1109/igarss.2003.1294332
Directorate General of Estate Crops. (2017). Tree Crop Estate Statistics of Indonesia 2016-
2018. Directorate General of Estate Crops.
Erman, E. (2017). Chinese taukeh, labourer, and state control Case study of panglong in eastern
region of Sumatra (1890-1930). Wacana, 18(2), 514.
https://doi.org/10.17510/wacana.v18i2.594
Farina, A. (2008). Principles and methods in landscape ecology: Towards a science of
landscape. In Austral Ecology. https://doi.org/10.1111/j.1442-9993.2007.01854.x
Fortin, M. J., & Dale, M. R. T. (2005). Spatial analysis: A guide for ecologists. Cambridge:
Cambridge University Press. https://doi.org/10.1017/CBO9780511542039
FWI, & GWF. (2002). The State of the Forest: Indonesia. World Research Institute.
Ghorbani, A., & Pakravan, M. (2013). Land use mapping using visual vs. digital image
interpretation of TM and Google earth derived imagery in Shrivan-Darasi watershed
(Northwest of Iran). European Journal of Experimental Biology, 3(1), 576–582.
Hidayat, H. (2016). Forest Resources Management in Indonesia (1968-2004). Springer.
https://doi.org/10.1007/978-981-287-745-1
Hidayat, T. (2018). Gerakan Masyarakat Kecamatan Tebing Tinggi Timur Kabupaten
Kepulauan Meranti dalam Mendapatkan Perizinan Pengelolaan Hutan Desa Tahun 2009-
2016. JOM FISIP, 5, 1–9. Retrieved from
https://jom.unri.ac.id/index.php/JOMFSIP/article/view/20710/20035
Humphreys, D. (1996). Forest Politics: Evolution, The Cooperation, International. Routledge.
https://doi.org/10.4324/9781315870120
Lillesand, T. M., & Kiefer, R. W. (1993). Remote Sensing Image Interpretation. New York:
John Wiley.
Liu, Y., Wang, L., & Long, H. (2008). Spatio-temporal analysis of land-use conversion in the
eastern coastal China during 1996–2005. Journal of Geographical Sciences, 18(3), 274–
282. https://doi.org/10.1007/s11442-008-0274-3
Margono, B. A., Potapov, P. V., Turubanova, S., Stolle, F., & Hansen, M. C. (2014). Primary
forest cover loss in Indonesia over 2000-2012. Nature Climate Change, 4(8), 730–735.
https://doi.org/10.1038/nclimate2277
Margono, B. A., Usman, A. B., Budiharto, & Sugardiman, R. A. (2016). Indonesia’s Forest
Resource Monitoring. Indonesian Journal of Geography, 48(1), 7–20.
https://doi.org/10.22146/ijg.12496
Means, G. P., & Hardjono, J. M. (2006). Transmigration in Indonesia. Pacific Affairs, 51(3),
532–533. https://doi.org/10.2307/2757989

Journal of Environmental Science and Sustainable Development 2(1): 75–96
DOI: https://doi.org/10.7454/jessd.v2i1.33 95
Miettinen, J., & Liew, S. C. (2010). Degradation and development of peatlands in Peninsular
Malaysia and in the islands of Sumatra and Borneo since 1990. Land Degradation and
Development, 21(3), 285–296. https://doi.org/10.1002/ldr.976
Miettinen, J., Shi, C., & Liew, S. C. (2016). Land cover distribution in the peatlands of
Peninsular Malaysia, Sumatra and Borneo in 2015 with changes since 1990. Global
Ecology and Conservation, 6, 67–78. https://doi.org/10.1016/j.gecco.2016.02.004
Mizuno, K., Fujita, M. S., & Kawai, S. (2016). Catastrophe and regeneration in Indonesia’s
peatlands: ecology, economy, and society. Kyoto: Kyoto University Press.
Nkonya, E., Mirzabaev, A., Baumgartner, P., & Cherlet, J. (2016). Economics of Land
Degradation and Improvement–A Global Assessment for Sustainable Development.
Switzerland: SpringerOpen. https://doi.org/10.1007/978-3-319-19168-3
Page, S. E., & Hooijer, A. (2016). In the line of fire: The peatlands of Southeast Asia.
Philosophical Transactions of the Royal Society B: Biological Sciences, 371(1696),
20150176. https://doi.org/10.1098/rstb.2015.0176
Pooja, A. P., Jayanth, J., & Koliwad, S. (2011). Classification of RS data using Decision Tree
Approach. International Journal of Computer Applications, 23(3), 7–11.
https://doi.org/10.5120/2872-3729
Puyravaud, J. P. (2003). Standardizing the calculation of the annual rate of deforestation. Forest
Ecology and Management, 177(1–3), 593–596. https://doi.org/10.1016/S0378-
1127(02)00335-3
Rist, L., Feintrenie, L., & Levang, P. (2010). The livelihood impacts of oil palm: Smallholders
in Indonesia. Biodiversity and Conservation, 19(4), 1009–1024.
https://doi.org/10.1007/s10531-010-9815-z
Schulze, E.-D., & Mooney, H. A. (1994). Ecosystem Function of Biodiversity: A Summary. In
E.-D. Schulze, & H. A. Mooney (Eds.), Biodiversity and Ecosystem Function (pp 497–510).
Springer. https://doi.org/10.1007/978-3-642-58001-7_24
Shimada, S., Takada, M., & Takahashi, H. (2016). Peat Mapping. In M. Osaki, & Tsuji, N
(Eds.), Tropical Peatland Ecosystems (pp. 455–467). Springer.
https://doi.org/10.1007/978-4-431-55681-7_31
Small, E. (2011). Top 100 Exotic Food Plants. CRC Press. https://doi.org/doi:10.1201/b11391-
85
The Society of Sago Palm Studies. (2015). The Sago palm : the food and environmental
challenges of the 21st century. Kyoto: Kyoto University Press.
Turner, R. K., Georgiou, S., & Fisher, B. (2008). Valuing Ecosystem Services: The Case of
Multi-functional Wetlands. Earthscan.
USGS. (1997). Landsat Data-A Brief History of the Landsat Program: USGS Fact Sheet 084-
97. Retrieved from https://pubs.usgs.gov/fs/1997/0084/report.pdf
USGS. (2013). Landsat 8 Fact Sheet: USGS Fact Sheet 2013-3060. Retrieved from
https://pubs.usgs.gov/fs/2013/3060/
USGS. (2018). Earth Explorer. Retrieved from https://earthexplorer.usgs.gov/
Vetrita, Y., & Hirano, T. (2012). Modis Gross Primary Production Evaluation in Tropical Peat
Swamp Forest of Indonesia (Evaluasi Produk Modis Gross Primary Production pada Hutan

Journal of Environmental Science and Sustainable Development 2(1): 75–96
DOI: https://doi.org/10.7454/jessd.v2i1.33 96
Rawa Gambut Tropis Indonesia). Jurnal Penginderaan Jauh dan Pengolahan Data Citra
Digital, 9(2), 114–125. Retrieved from
http://jurnal.lapan.go.id/index.php/jurnal_inderaja/article/view/1786
Winarso, G., & Purwanto, A. D. (2018). Evaluation of mangrove damage level based on landsat
8 image. International Journal of Remote Sensing and Earth Sciences, 11(2), 105.
https://doi.org/10.30536/j.ijreses.2014.v11.a2608
WWF. (2009). Hutan Indonesia: Penyerap atau Pelepas Emisi Gas Rumah Kaca? Retrieved
from https://www.wwf.or.id/?10741/Deforestasi
Zubaidah, A., Vetrita, Y., & Khomarudin, M. R. (2014). Modis Hotspot Validation Over
Sumatera and Kalimantan Based on Remote Sensing Data Spot-4 in 2012 (Validasi Hotspot
Modis di Wilayah Sumatera dan Kalimantan Berdasarkan Data Penginderaan Jauh Spot-4
Tahun 2012). Jurnal Penginderaan Jauh dan Pengolahan Data Citra Digital, 11(1 Juni,
2014), 1–15. Retrieved from
http://jurnal.lapan.go.id/index.php/jurnal_inderaja/article/view/2085