spe-174044-ms predicting compressor valve … predicting compressor valve failures from multi-sensor...
TRANSCRIPT

SPE-174044-MS
Predicting Compressor Valve Failures from Multi-Sensor Data Om Prasad Patri, University of Southern California; Nabor Reyna, Chevron Information Technology Company; Anand Panangadan, Viktor Prasanna, University of Southern California
Copyright 2015, Society of Petroleum Engineers This paper was prepared for presentation at the SPE Western Regional Meeting held in Garden Grove, California, USA, 27–30 April 2015. This paper was selected for presentation by an SPE program committee following review of information contained in an abstract submitted by the author(s). Contents of the paper have not been reviewed by the Society of Petroleum Engineers and are subject to correction by the author(s). The material does not necessarily reflect any position of the Society of Petroleum Engineers, its officers, or members. Electronic reproduction, distribution, or storage of any part of this paper without the written consent of the Society of Petroleum Engineers is prohibited. Permission to reproduce in print is restricted to an abstract of not more than 300 words; illustrations may not be copied. The abstract must contain conspicuous acknowledgment of SPE copyright.
Abstract As the number of sensors deployed in the oilfield increases, there is a corresponding need to develop methods for fast, automated processing of large-scale sensor data streams. This problem is aggravated when the streams of sensor data are from multiple sensors with different characteristics and applicability to specific tasks of interest to the oilfield operator. Predictive analytics and data mining approaches have been proven to improve production efficiency, reduce downtime and identify safety hazards in real-world scenarios. One of the most common failures in rotating equipment such as compressors is the breakdown of valves. This issue is of great value because a large proportion of production is dependent on rotating equipment. The aim of our undertaking is to find signature(s) in sensor data collected from compressors, which are predictive of valve failures. The first step towards achieving this is to rank the sensors themselves and use data from only those sensors that provide useful information. The resulting information can be used to prioritize and monitor maintenance schedules for compressors, which are often on remote platforms. The data used in our evaluation is from a large number of sensors that measure various physical properties of compressors, ranging from compressor vibrations and motor winding temperatures to pressure and temperature for both suction and discharge at the various compression stages. We frame this failure prediction problem as a feature selection and time-series classification task. We use several evaluation methods for feature selection to identify the highly ranked sensors, and obtain insights about them. Once feature selection is complete, we propose to build a classifier based on time series shapelets. In particular, we adopt feature selection methods to automatically rank sensor streams in order of usefulness for the specific prediction tasks. Our results demonstrate that feature selection and time series approaches can be extended to handle multi-sensor Big Data streams from the oil and gas industry provided that accurate labeling of these datasets is possible. 1. Introduction Modern oil and gas fields are highly instrumented due to a rise in the number of sensors. With this rise in the number of sensors, we face new challenges in analysis and prediction on sensor data [1, 3]. These challenges stem from several real-world issues in the nature of the data – sensors may be noisy, data may be missing or not recorded at regular intervals. One of the primary challenges in processing sensor data is dealing with its multivariate nature – since data from multiple sensors needs to be used to make failure predictions. Moreover, real-world sensor datasets are not labeled as periods of failed or normal operation as in machine learning-based classification algorithms. Instead, we will obtain such labels from records maintained for other purposes such as maintenance work orders. In this paper, we address these issues in the context of valve failures in gas compressor sensor data. A regular failure in rotating equipment such as compressors is the breakdown of valves. This issue is of great value to the oil and gas industry because a large portion of production is dependent on rotating equipment. The aim of this work is to rank sensor dimensions and find signatures in compressor sensor data, which may aid in the prediction of valve failure, and as a result create a path to prioritize and monitor maintenance schedules for compressors, which are often on remote platforms. The data used in our evaluation is from a large number of sensors that measure various physical properties of compressors,

2 SPE-174044-MS
ranging from compressor vibrations and motor winding temperatures to pressure and temperature for both suction and discharge at the various compression stages. However, this sensor data is not labeled explicitly to indicate periods of failure. We frame this failure prediction problem as a feature selection and time-series classification task. We use several evaluation methods for feature selection to identify the highly ranked sensors. This feature selection step is the focus of this work and the first step towards a more effective multivariate classifier. For time series classification, we propose to use time series ‘shapelets’. The shapelet-based approach does not impose any assumptions about the underlying nature of the data and does not require the entire historical data for classification, thus enabling real-time compressor monitoring. We used a similar approach earlier in [4] for predicting electric submersible pump (ESP) failures in the context of single sensor (univariate) data. In this work, we extend this approach to multi-sensor gas compressor data by focusing on ranking sensor dimensions. In particular, we adopt feature selection methods to automatically rank sensor streams in order of usefulness for the specific prediction tasks and obtain key insights into the sensors themselves. The difficulty of obtaining appropriate labels from work orders and real data in the field is also highlighted. In particular, we use dates entered as part of maintenance records as labels for the sensor streams in order to apply supervised machine learning algorithms. Our dataset consists of sensor data from four-cylinder gas compressors in an oilfield. Each compressor has approximately fifty sensors. The sensor functions range from measuring compressor vibrations and motor winding temperatures to sensors measuring the pressure and temperature for both suction and discharge at the various compression stages. Data from some of the sensors is shown in Figure 1. Along with this operation data for the compressors, we utilized a subset of work orders with compressor failures that focused on everything related to valves. The work orders listed dates of reported failure and completion along with comments for each repair. We used information from the work orders to build our labels, thus framing our failure prediction problem as a time series classification problem.
Figure 1: Data from some of the sensors in the gas compressor – discharge temperature of a cylinder (top left), motor winding temperature (top right), motor vibration (bottom left) and cooler vibration (bottom right). 2. Background on Time Series Shapelets A shapelet is a subsequence or local temporal pattern in a time series that is a representative feature of the class to which this time series belongs [2]. Shapelets have been shown to be effective for a variety of time series data mining tasks including classification, clustering, summarization, and visualization [2,4,5,6]. Though several other approaches exist for time series classification, we use shapelets due to these factors: (1) shapelet methods impose no assumptions or restrictions on nature of data unlike autoregressive or ARIMA time series models, (2) they are easy to interpret for domain experts, (3) they have been shown to be more accurate than other methods for some problems, and (4) once shapelets have been extracted from training data, we can classify a new time series quickly.

SPE-174044-MS 3
Related work on extracting shapelets from multivariate time series: Hu et al. [9] present an approach for classifying multivariate streaming time series data. They use Nearest Neighbor algorithm to classify univariate time series and combine their predictions. In [7], Ghalwash et al. propose the MSD (Multivariate Shapelets Detection) approach. According to MSD, a multivariate shapelet is a collection of subsequences, one from each of the n time series in an instance, where each subsequence has the same start time and length. There are two major weaknesses of this approach. First, the restriction of same start time and same length is arbitrary. Second, MSD may not work well when a subset of the n time series are a better predictor for a class than all of them. The authors of MSD provide an example of such a scenario from the biomedical domain. In [8], Ghalwash et al. proposed IPED (Interpretable Patterns for Early Diagnosis), which improves upon MSD. IPED solves a convex-concave optimization problem to select exactly one representative subsequence from each of the n dimensions. While IPED addresses some shortcomings of MSD, it still suffers from two drawbacks: (1) the exhaustive search over all possible subsequences in the first step is computationally expensive, and (2) the restriction of extracting only one subsequence per dimension in the second step is somewhat arbitrary. Patri et al. [10] proposed the Shapelet Forests (SF) algorithm, which combines shapelet extraction with feature selection for multivariate time series classification. However, the SF algorithm does not account for pre-processing, and performs feature selection after shapelet extraction. In our approach, we perform feature selection first, which provides the advantage of using a smaller data subset for shapelet extraction. Since shapelet extraction is the most computationally expensive step in our workflow, this serves to reduce the overall computational complexity. Overview of the univariate shapelet extraction method: We provide a brief overview of the shapelet extraction algorithm [2] for univariate time series and a computationally efficient version of it, called Fast Shapelets [6]. The shapelet extraction algorithm for univariate time series data proceeds as follows. After reading the input time series and labels, candidate subsequences of all possible lengths are generated. The distance between the candidate subsequence (tentative shapelet) and all the time series are calculated and this distance value is used to place the time series on an orderline, denoting the proximity of the candidate to the time series. A discriminative subsequence separates the time series instances from different classes by projecting them on the orderline in such a way that instances for the same class are close to each other and far away from instances belonging to other classes. Hence, given an orderline, a threshold or separation gap is defined that captures how far apart instances from different classes are based on their distance from the candidate subsequence, and used to compute the information gain for the candidate subsequence. The user is required to specify the minL and maxL parameters that denote the minimum and maximum length of shapelets. The candidate subsequence with the highest information gain overall is claimed as the shapelet. A decision tree classifier is built during the shapelet extraction phase with shapelets as nodes. When a new time series instance is encountered, this decision tree is used to classify the instance and predict a label. At each node of the tree, the distance to the corresponding shapelet is compared with the threshold for that shapelet, and either the left or right subtree is chosen for traversal, until a leaf node is reached. Each leaf node contains the class label to which it belongs, and this is the predicted class label for this instance. The brute-force shapelet discovery algorithm is slow because it computes all possible subsequence-information gain combinations. Several optimizations and pruning techniques to improve upon the brute-force method have been suggested [2,6]. The state-of-the-art supervised shapelet-based classification algorithm is Fast Shapelets [6], which uses random projections to get approximate, nearly optimal solutions. We use the Fast Shapelets algorithm in this work. 3. Approach First, we describe our data labeling approach for converting the streams of data from multiple sensors into a usable time series classification format for our approach. Data labeling: To convert the sensor data streams into our required time series training and testing datasets, we partitioned the full sensor stream around the occurences of failures. A failure report date is available as part of the maintenance records for the gas compressor. However, this report date does not necessarily correspond to the time when the compressor actually failed but rather when a technician created a work order to address a deficiency or respond to a prior open work order. In this work, we label segments as failures if they appear a short while before this failure report date. We expect the actual failure to have occurred before it is noticed by a human operator. Failure windows are set just before these calculated failure times. The size of this window can be set as a parameter in our experiments, but we focused on one-week windows. Since the data in this window is just prior to the failure occurrence, it is likely to be indicative of failure signals before the failure happens. For each labeled failure occurrence, we obtain the data in this failure window, as shown in Figure 2 and extract shapelets from this window. Each such data segments will have a failure label associated with it. Next, we select normal instances only from those periods that are not close to any failures. Thus, we pick data segments of the same window size from the rest of the data (normal operation) ensuring that there is no intersection between the clean

4 SPE-174044-MS
data segments and the failure periods or the pre-failure periods i.e. the failure window. These clean data segments, taken from normal operation are assigned a normal class label for classification.
Figure 2: Pre-processing sensor data – a failure window is set just prior to the occurrence of each failure and we use these blocks of data to extract signals indicative of failure Figure 3 shows the complete duration of the training dataset for one of the sensors. Green indicates those sections that are labeled as periods of normal operation. Red indicated periods of failed operation. Blue indicates the remaining periods. The vertical lines indicate the reported date of failure in the maintenance record. We mark 1-week windows corresponding to the failure periods.
Figure 3: Displaying the complete training data for one sensor Our proposed approach is presented in the following training and testing algorithms. Training algorithm: Input: A multivariate time series, time instances known to represent failures Output: Set of selected sensors; shapelets and decision trees for every selected sensor
1. Pre-processing: Extract equal length (multivariate) segments and assign failure/normal labels to each from the time series based on the distribution of failure instances.
2. Feature selection: Compute a variety of features for each sensor stream in each segment. Specifically, we use the maximum cross-correlation with an exponential decay curve with a pre-defined magnitude and exponent. Correlate the maximum cross-correlation feature for each sensor stream with the failure/normal labels using a linear classifier. Retain only sensor streams which have > 50% classification accuracy.
3. Apply univariate shapelet mining algorithm (specifically, Fast Shapelets [1]) to only the sensor streams selected in Step 2. This step produces a set of shapelets and a decision tree for each selected sensor stream (much fewer than the total number of sensors).

SPE-174044-MS 5
Testing algorithm: Input: A single multivariate time series Output: Class A (Normal) or Class B (Failure)
1. Discard variables from the multivariate time series that correspond to sensors not in the set of selected sensors 2. For every selected sensor stream, compute the Euclidean distance to shapelets in the corresponding decision tree
(from Step 3 of the training algorithm). 3. Use the distances to compute a failure/normal label using the decision tree for each selected sensor. 4. Apply majority voting to select a single failure/normal label from the set of labels from seleced sensors (from Step 3).
In this paper, we focus on the feature selection part of our proposed algorithm. 4. Evaluation In order to identify the most relevant sensors for failure prediction, we first computed single sensor classification accuracy for a variety of features extracted from the stream of measurements from each sensor. The features were determined by researchers based on an understanding of gas compressor operations and visual inspection of the measurement plots. These features are described below. Each feature was calculated for a 1 week window. The plot of classification accuracy for each sensor (first 45 sensors shown) on each feature is shown just after the feature description. Mean value: the mean sensor measurement, excluding any missing data points, was included as a feature since it is possible that failures are correlated with a decrease or increase in the parameter from its normal value.
Figure 4: Classification accuracy for each feature based on the mean value feature selection heuristic. The horizontal line represents the accuracy of a random classifier. Missing data points: The number of missing data measurements was included as a feature since we wanted to consider the possibility that the underlying failure either directly or indirectly affects the factors causing sensor measurements not to be recorded, including sensor malfunction and communication failures.

6 SPE-174044-MS
Figure 5: Classification accuracy for each feature based on the missing data points feature selection heuristic Mean slope: We best fit a straight line (minimizing the sum of least square distances) to the sensor measurements over the window period as a means of quantifying any down or up-trending in the measurements in the period before the failure. The slope of the best fit line is used as the feature.
Figure 6: Classification accuracy for each feature based on the mean slope feature selection heuristic Ratio of measurements: Multivariate classifiers typically consider only linear combinations of individual features. However, gas compressors are designed to actively affect the ratio of pressures in incoming and outgoing lines. In order to determine if the ratio of two parameters (a nonlinear computation) over the window period is an indicator of failure, we computed the mean ratio between every pair of temperature and pressure sensor measurements.
SPE-174044-MS 7
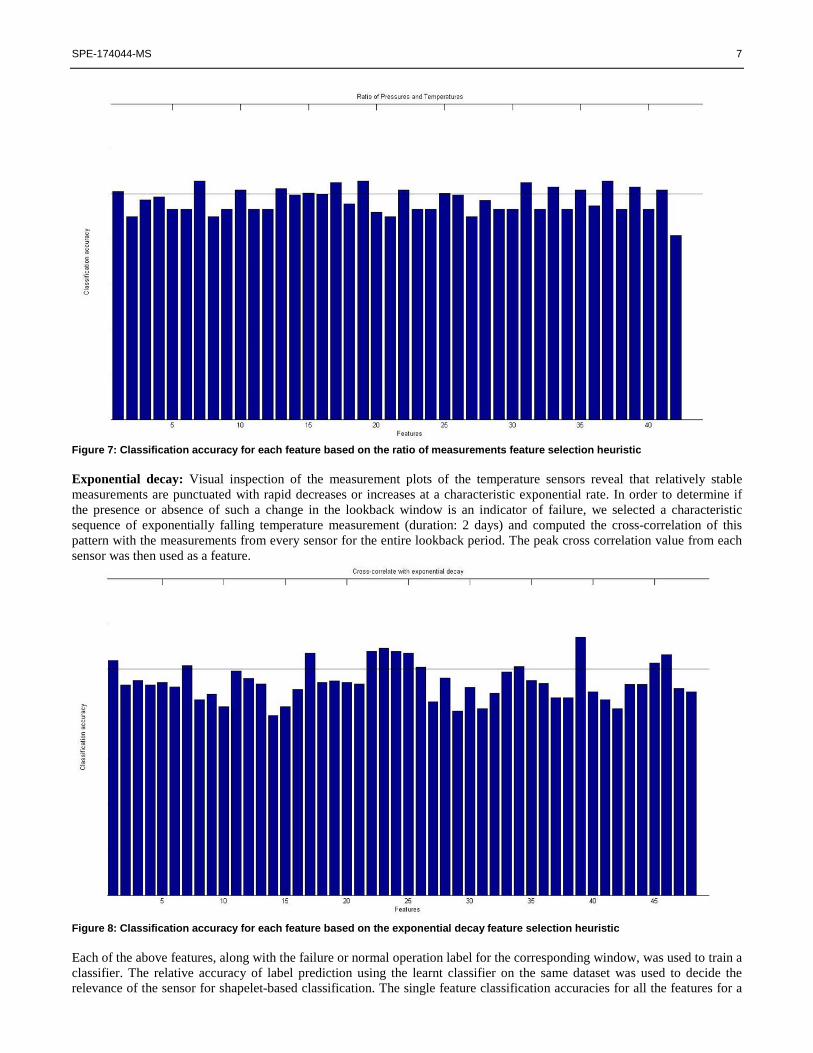
Figure 7: Classification accuracy for each feature based on the ratio of measurements feature selection heuristic Exponential decay: Visual inspection of the measurement plots of the temperature sensors reveal that relatively stable measurements are punctuated with rapid decreases or increases at a characteristic exponential rate. In order to determine if the presence or absence of such a change in the lookback window is an indicator of failure, we selected a characteristic sequence of exponentially falling temperature measurement (duration: 2 days) and computed the cross-correlation of this pattern with the measurements from every sensor for the entire lookback period. The peak cross correlation value from each sensor was then used as a feature.
Figure 8: Classification accuracy for each feature based on the exponential decay feature selection heuristic Each of the above features, along with the failure or normal operation label for the corresponding window, was used to train a classifier. The relative accuracy of label prediction using the learnt classifier on the same dataset was used to decide the relevance of the sensor for shapelet-based classification. The single feature classification accuracies for all the features for a

8 SPE-174044-MS
lookback period of 1 week are shown in Figures 4-8. In these figures, the horizontal line represents the accuracy of a random classifier. Similar accuracies were obtained when these features were computed for a shorter lookback period. The most relevant sensors based on these accuracies are those related to temperature, specifically, the motor winding temperatures (four such sensors) and bearing temperature. In this example, only the data from these 5 sensors are used for shapelet-based classification. After the feature selection step, we decide upon a set of 5 sensors (which are determined to be the most important) and use data from only these sensors as input to the univariate shapelet extraction algorithm. A majority voting method is used to predict the final class label and combine the individual predictions of the 5 sensors. In addition to the pre-processing approaches discussed earlier, more sophisticated pre-processing methods, such as those from [4] can be directly used here. However, the univariate shapelets algoritghm does not identify any discriminative shapelet from the input time series set for the selected sensors. In such cases, the shapelet extraction algorithm generally assigns the label of the majority class in the training dataset to each test instance. In this case, the prediction accuracy corresponds to that of a classifier assigning the majority class label to each test instance would also achieve the same performance. This indicates the need to ensure that labels used for the training the classifier truly correspond to periods of failure and normal operation. 5. Conclusions We presented our initial efforts towards prediction of valve failures from multivariate sensor data recorded in gas compressors. We presented several feature selection approaches and evaluated them on real data from an oilfield. Only data from the highly ranked features is used for shapelet extraction. Shapelet extraction was performed using an univariate shapelet extraction method, and predictions from multiple sensor dimensions were combined through majority voting. This method has a limitation that the shapelets may not be found in some of the sensors if the data labels do not accurately demarcate between normal and failure operation periods. In future work, we will develop methods to extract more accurate labels of failed and normal operation of equipment from text analysis of the notes entered in maintenance records. Most existing shapelet-based approaches (including the current work) compute shapelets on univariate time series and then combine them through some form of voting or ensemble classifier. We plan to develop an algorithm to identify shapelets in multiple dimensions from multivariate time series data. 6. Acknowledgments This work is supported by Chevron U.S.A. Inc. under the joint project, Center for Interactive Smart Oilfield Technologies (CiSoft), at the University of Southern California. 7. References [1] A. Abou-Sayed, "Data mining applications in the oil and gas industry," Journal of Petroleum Technology, vol. 64, pp. 88-95, 2012. [2] L. Ye and E. Keogh, "Time series shapelets: a new primitive for data mining," in Proceedings of the 15th ACM SIGKDD international
conference on Knowledge discovery and data mining, 2009, pp. 947-956. [3] O. P. Patri, V. Sorathia, and V. K. Prasanna, "Event-driven information integration for the digital oilfield," SPE 159835-PP presented
at the SPE Annual Technical Conference and Exhibition, San Antonio, Texas, USA, 2012. [4] O. P. Patri, A. Panangadan, C. Chelmis, R. G. McKee and V. K. Prasanna, "Predicting Failures from Oilfield Sensor Data using Time
Series Shapelets," SPE 170680-MS presented at the SPE Annual Technical Conference and Exhibition, Amsterdam, 2014. [5] O. P. Patri, A. Panangadan, C. Chelmis, and V. K. Prasanna, "Extracting discriminative features for event-based electricity
disaggregation," presented at the IEEE Conference on Technologies for Sustainability, Portland, Oregon, USA, 2014. [6] T. Rakthanmanon and E. Keogh, "Fast shapelets: A scalable algorithm for discovering time series shapelets," in Proceedings of the
thirteenth SIAM conference on data mining (SDM), 2013. [7] M. Ghalwash and Z. Obradovic, "Early classification of multivariate temporal observations by extraction of interpretable shapelets",
BMC Bioinformatics, 13(1):195, 2012. [8] M. Ghalwash, V. Radosavljevic, and Z. Obradovic, "Extraction of interpretable multivariate patterns for early diagnostics", in
Proceedings of the IEEE 13th International Conference on Data Mining (ICDM), pp. 201–210, 2013. [9] B. Hu, Y. Chen, J. Zakaria, L. Ulanova, and E. Keogh, "Classification of multi-dimensional streaming time series by weighting each
classifier’s track record", in Proceedings of the IEEE 13th International Conference on Data Mining (ICDM), pp. 281–290, 2013. [10] O. P. Patri, A. Sharma, H. Chen, G. Jiang, A. Panangadan, and V. K. Prasanna, "Extracting Discriminative Shapelets from
Heterogeneous Sensor Data", in Proceedings of the 2014 IEEE International Conference on Big Data (IEEE BigData), 2014.