spe-184311-ms production optimization in the duke field using...
TRANSCRIPT

SPE-184311-MS
Production Optimization in the Duke Field Using the IPM Suite
David Alaigba, Covenant University Ota, IFP School France; Oyinkepreye D. Orodu, Covenant University Ota;
Maria Aguilera, IFP School France
Copyright 2016, Society of Petroleum Engineers
This paper was prepared for presentation at the SPE Nigeria Annual International Conference and Exhibition held in Lagos, Nigeria, 2–4 August 2016.
This paper was selected for presentation by an SPE program committee following review of information contained in an abstract submitted by the author(s). Contentsof the paper have not been reviewed by the Society of Petroleum Engineers and are subject to correction by the author(s). The material does not necessarily reflectany position of the Society of Petroleum Engineers, its officers, or members. Electronic reproduction, distribution, or storage of any part of this paper without the writtenconsent of the Society of Petroleum Engineers is prohibited. Permission to reproduce in print is restricted to an abstract of not more than 300 words; illustrations maynot be copied. The abstract must contain conspicuous acknowledgment of SPE copyright.
Abstract
This project focuses on building a reservoir sub-sea network model for a condensate field in the gulf ofGuinea, the Duke Field. It integrates the five developed Duke reservoirs, development wells and subseanetwork using the Petroleum Experts’ Integrated Production Model suite of software, (IPM) which iswidely used in the E&P industry especially for integrated forecasting, surveillance and production systemoptimization that require integration of surface and subsurface models.
Following the acquisition and quality control of data from other teams working on the Duke Field, anetwork model which integrates the five Duke reservoirs, their associated wells and subsea network upto the production separator was built. The model was initialized and used to predict full field performanceunder different scenarios.
Finally, a water injection allocation sensitivity study was performed and the results were analyzed bothtechnically and economically. From the technical point of view, the option to reallocate 10 kbwpd fromreservoir U to reservoir P-upper North and another 10 kbwpd from Reservoir ST to reservoir Q-Lowerbrought about the optimum recovery. This was also supported by a simple economic analysis. It was thenrecommended that additional water injectors be drilled in P-Upper North and Q-Lower to unlock anadditional 8.4 MMSTB of reserves resulting from higher sweep efficiencies and better pressure mainte-nance.
Introduction
Duke ReservoirsThe Duke Field is located offshore the Niger Delta in Nigeria. The reservoirs in DUKE are deepwater fansof distal turbidite origin, deposited in submarine channels and lobes. Trapping in DUKE Central comesfrom a combined structural / stratigraphical mechanism (four way dip anticline) whilst in DUKE Easttrapping is partly stratigraphic to the West.
There are five major accumulations or reservoirs in the Duke Field which have been identified byinitial free water levels, (FWL), pressure trends and fluid properties. They are Reservoirs; P, Q, R, ST andU as shown in figure 2 below.

HypothesisThe general material balance equation for a hydrocarbon reservoir is shown below;
1
The terms on the right hand side account for the cumulative production (oil, gas and water), while thoseon the left provide the energy required for production in form of liquid expansion, gas cap expansion, porevolume contraction and connate water expansion and aquifer influx.
The material balance suite, MBAL uses the above principle to match the historical pressures byrunning production simulations using the actual production history and then it generates average tankpressures and saturations based on the results of the simulation. Parameters which are uncertain, such asthe initial oil in place, rock compressibility and aquifer parameters can be regressed upon to improve thematch. To be acceptable, the result of the regression must be realistic considering other information suchas geology and geophysics. Following attainment of a suitable match, the model can now be used forproduction prediction and as an input in the network model, GAP.
The performance of any water flooding scheme is governed by several factors which are lumped intoequation 2 below.
2
3
Figure 1—Location of the Duke Field offshore Nigeria
Figure 2—Initial Pseudo-Potential Plot showing the five Duke Reservoirs
2 SPE-184311-MS
From equation 2, it can be seen that the overall recovery factor, RF is a function three key parameters: thedisplacement efficiency, ED, the areal sweep efficiency, EA, and the vertical sweep efficiency, EV. Thedisplacement efficiency (equation 3) is the fraction of movable oil recovered from the swept zone. In the Dukefield, ED obtained from core flooding ranged from 50-65% of the initial oil in place. This coupled with otherfactors made the development team of the Duke field to select waterflooding as the preferred option. The arealsweep efficiency, EA, is the fraction of the area enclosed by a pattern which is contacted by the advancingfloodfront. It is affected by the mobility ratio, M, the flood pattern and the cumulative water injected, Winj.Equation 4 shows the mobility ratio as a function of the relative permeabilities and viscosity ratios. Themobility ratio for the flooding in the Duke reservoirs ranged from 0.2 to 0.4 which is rather preferred.
4
In the Duke Field, the injection pattern selected is the pheripheral system with the injectors completedsome few feets below the oil water contact (OWC). It is anticipated that the as production preceeds, theOWC would rise more or less uniformly, displacing oil in the process.
5
It is common practice in the petroleum industry to speak of the performance of a waterflooding schemein terms of the cumulative voidage replacement ratio, VRR. The VRR refers to the extent of replacementof the produced reservoir oil, gas and water with comesurate injected fluids (oil and gas) as presented inequation 5. For the Duke field, the target is to keep the VRR as close as possible to 1.0, that is to replaceall produced reservoir fluids. This is achieved by water injection.
Methodology
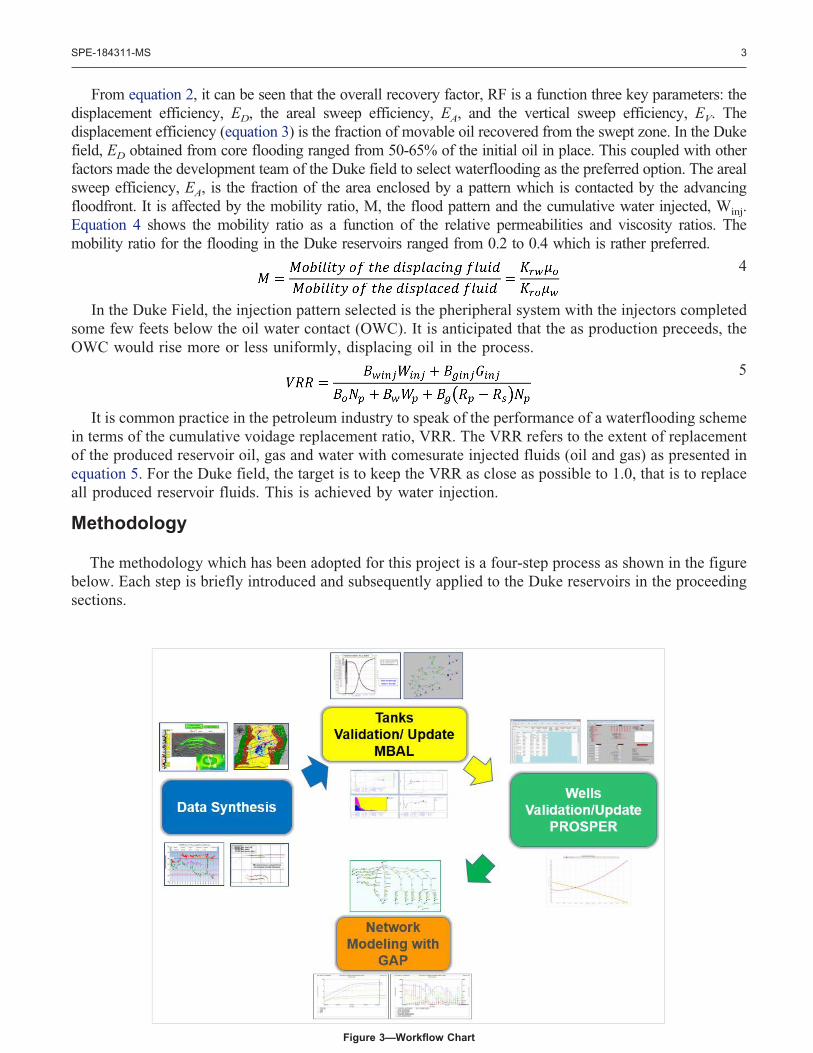
The methodology which has been adopted for this project is a four-step process as shown in the figurebelow. Each step is briefly introduced and subsequently applied to the Duke reservoirs in the proceedingsections.
Figure 3—Workflow Chart
SPE-184311-MS 3

Data SynthesisThis dealt with analysis of both static (geology, geophysics) and dynamic data (static pressure history,
production/injection history, well tests, 4D seismic..) for each Duke reservoir with a view to properlyidentify flow units and understand compartmentalization/ connectivity issues in each reservoir as this isvital for representative MBAL modeling.
Review and Update of Existing MBAL and PROSPER ModelsHere, quality check was performed on the existing MBAL models by integration of the information
derived from the data synthesis in order to ensure model representativity. Quality check was alsoperformed on the Prosper models and they were then updated to match current well test data.
Modeling with GAPAt this stage, integration of the entire production system using GAP’s platform was done and it linked
the Duke reservoirs (MBAL Models) with their wells (PROSPER) and the sub-surface network up to theseparator on the FPSO. This was done by coupling the MBAL models of reservoirs P-Upper, Q-lower, R,ST and U and their corresponding producers and the subsea network up to the Duke FPSO as shown inFigure 4 below. In the network solving mode, the chokes are calibrated to ensure that the wells produceat the current rates. Following attainment of representative rates, the production prediction is carried outfirst by assuming 100% Voidage replacement by water for all the tanks except reservoir R where theVoidage replacement is by gas injection. Next, sensitivity on water injection allocation is performed andthen the results are analyzed in terms of increased recovery and also economics.
Production and Injection OptimizationThe main energy for production in the Duke Field is from water injection in four of the Duke reservoirs
and miscible gas injection in the remaining one. The essence of this secondary recovery is to:
y Maintain the reservoir pressure above the saturation pressure thus ensuring that the gas remains insolution in the reservoir, thus preserving the energy for production and also maintaining theproductivity of the wells by minimizing two phase flow around the wells as much as possible
y Ensuring better sweep efficiency, thus resulting in increased recovery,y Gas management strategy to minimize flaring.
Figure 4—Network Model Layout for the Duke Field
4 SPE-184311-MS

Production Optimization by Water Injection Allocation SensitivityThe maximum injection capacity of the Duke FPSO is 301,700bwpd. There are currently no plans to
upgrade this in the near future. The interest of this study is to optimally allocate the available 301,700bwpd of injection water to the reservoirs so as to improve the recovery while maintaining the reservoirpressures above their respective saturation pressures and delaying water breakthrough and water cutevolution. Tables 1 and 2 below show the water injection allocation for each case.
Results and DiscussionThe result of the sensitivity on injection water allocation shows that Case II which allocates more waterinjection to reservoir ST gives the highest expected ultimate recovery, EUR. However, comparing CaseII with Case III which allocates water injection from Reservoir U and ST to Reservoir P-upper North andQ-Lower, it can be seen from the simple economic analysis that the present value at 2013, PV from caseIII is the highest as the recovery from Case III is obtained faster than for Case II. Hence Case III is theoptimal case. This is in line with what is currently being observed, as the injector on P-Upper North iscurrently limited by the fracture pressure of the rock. It would be interesting to drill an additional waterinjector in P-Upper North or re-enter Duke-15 with a side track to improve the injectivity index of thiswell to ensure better sweep efficiency of the northern and central region. Also, the Q-Lower reservoirneeds an additional water injector to ensure better pressure maintenance and reservoir sweep.
Table 1—Water Injection Allocation , and compared to base case)
Table 2—P-Upper Water Injection Allocation Breakdown
P-Upper Water Injection Allocation Breakdown, kbwpd
Tanks Base Case Case I Case II Case III Case IV Case V Case VI
P-North 70.2 80.0 80.2 80.2 90.2 90.2 90.2
P-South 70.0 70.0 70.0 70.0 70.0 50.0 70.0
P-Upper Total 140.2 150.2 140.2 150.2 160.2 140.2 160.2
SPE-184311-MS 5
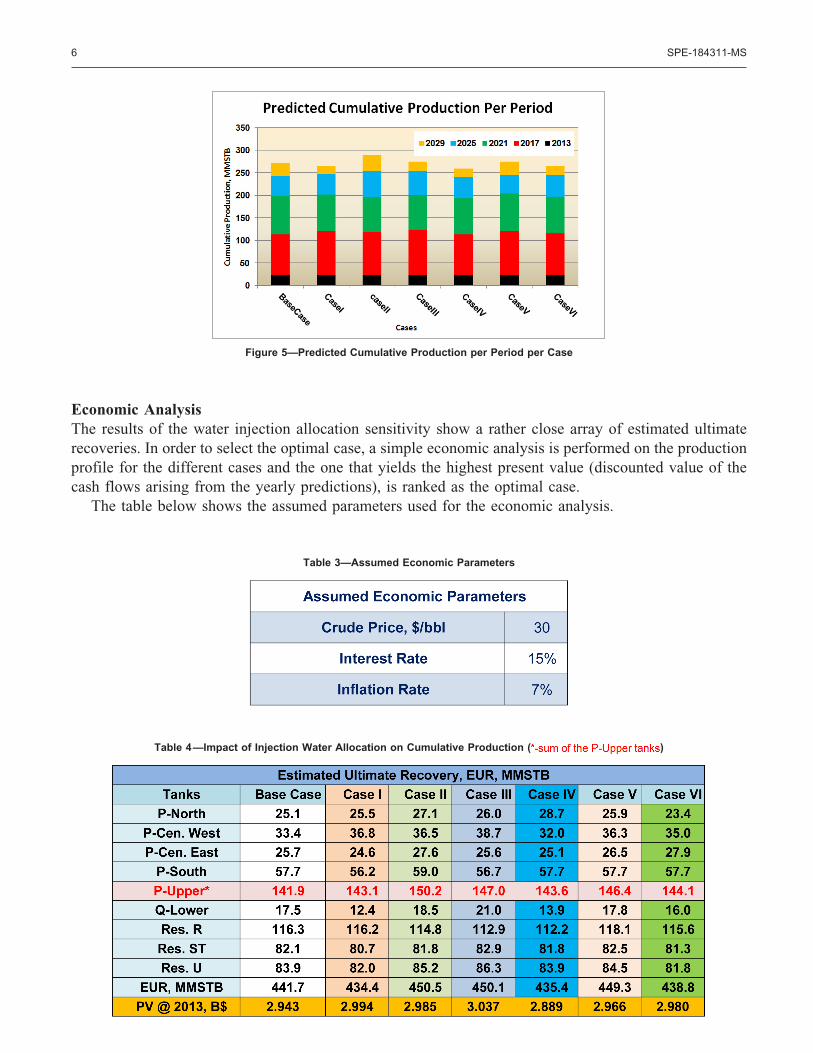
Economic AnalysisThe results of the water injection allocation sensitivity show a rather close array of estimated ultimaterecoveries. In order to select the optimal case, a simple economic analysis is performed on the productionprofile for the different cases and the one that yields the highest present value (discounted value of thecash flows arising from the yearly predictions), is ranked as the optimal case.
The table below shows the assumed parameters used for the economic analysis.
Table 3—Assumed Economic Parameters
Table 4—Impact of Injection Water Allocation on Cumulative Production ( )
Figure 5—Predicted Cumulative Production per Period per Case
6 SPE-184311-MS

Conclusion and RecommendationsThe MBAL models for the Duke reservoirs have been updated following dynamic data synthesis,production predictions have also been carried out and the results which have been obtained are comparableto those obtained using the 3D simulator, Eclipse. Also, well models have been updated. The networkmodel has been built by integrating the updated MBAL models for the Duke reservoirs, their correspond-ing producers and the subsea network up to the FPSO.
Production/ Injection optimization has been performed and an optimal case has been obtained whichreallocates injection water from Reservoir U and ST to reservoir P-Upper North and Reservoir Q-Lowerin order to unlock 8.4MMSTB of additional reserves by better pressure maintenance and sweep.
Following the results of the optimization studies, it is recommended that an additional water injectoreach be drilled in P-Upper north and Q-Lower in order to effectively maintain pressures and to obtain abetter sweep.
Due to the assumptions and limitations of MBAL, the results are more qualitative than quantitative.Hence, it is recommended that a 3D simulator which accounts for the heterogeneities in turbiditereservoirs is used in place of MBAL to carry out this study in order to compare the results quantitatively.
In conclusion, network modeling with Integrated Production Modeling suite, GAP is a rather simpleapproach that yields results which are useful for the prediction and optimization of full field performance.
Nomenclature3D � Three Dimensions4D � Four Dimensions (Time Lapse)Bgi, Bg � Initial and current formation volume factor, rbbls/scfBging � FVF for gas injected, bbl/SCFBo � Single phase oil formation volume factor, rbbls/stbBti, Bt � Initial and current Phase oil formation Volume factor, rbbls/stbBw � Water formation volume factor, rbbls/stbwBwinj � FVF water injected, bbl/STBCf � Pore volume compressibility, Psi-1Cw � Compressibility of formation water, psi-1DeltaP � Current pressure drop, PsiEA � Areal Displacement EfficiencyED � Microscopic Displacement EfficiencyEUR � Estimated Ultimate RecoveryEV � Vertical Displacement EfficiencyFPSO � Floating, Producing, Storage and OffloadingFW � Reservoir Water CutGAP � Network Modeling Suite of Software by Petroleum ExpertsGing � Cumulative gas injected, MMSCFGOR � Gas Oil RatioGp � Cumulative gas produced, MMSCF,GSR � Geosciences and ReservoirH � Net thickness contributing to production, ftIPM � Integrated Production ModelingK � Effective permeability to oil at the sand face, mdkro � End-point relative permeability to oilkrw � End-point water relative permeabilitym � Ratio of initial reservoir gas cap to reservoir oil in place, dimensionless
SPE-184311-MS 7
MBAL � Material Balance Suite of Software by Petroleum ExpertsMMSTB � Million Stock Tank Barrels of OilN � Original oil in Place, STOIIP, STBNp � Cumulative Oil Production, MMSTBPI � Productivity Index, stb/day/psiPROSPER � Well modeling Suite by Petroleum Experts, PETEXPV � Present Value, $PVT � Pressure Volume Temperature (Fluid Properties)Qginj. � Gas Injection Rate, MMSCF/DQwinj. � Water Injection Rate, KbwpdRbbls � Reservoir BarrelsRe � Reservoir radius, ftRF � Recovery FactorRp � Producing Gas oil ratio, scf/stbRs � Solution gas oil ratio, scf/stbRsoi � Initial solution gas oil ratio, scf/stbRw � Wellbore radius, ftS � Skin, dimensionlessSTB � Stock Tank BarrelsSTOOIP � Stock tank original oil in place, MMSTBSwi � Connate water saturation, %U � Oil Viscosity, cpVRR � Voidage Replacement RatioWe � Cumulative Water influx, rbblsWinj � Cumulative water injected, MMSTBWp � Cumulative water Production, Stb
References1. Saleh Ali Al Sayari, Saber Mubarak Nuimi and Sanjay Misra.: �Production Network Modeling Challenges in a Giant
Carbonate Reservoir� SPE 164170, March 2013 Manama, Bahrain.2. Maria AGUILERA and Isabelle REY-FABRET.: �TD GAP Programme DEG,� IFP School, March 2013.3. M.S. Nadar, R. Kulkarni and Z.R. Lemenczyk.: �Development of an Integrated Production network Model for the
Heera Field� SPE 101089, September 2012, Adelaide, Australia.4. A.E. Stevenson, E.P. Wanorue, E.C. Okoro and Ozgur Ozen.: �Lessons Learned from Building a Large Integrated
Production model for Offshore Assets in Nigeria� SPE 159918, October 2012, SPE ATC, Texas, USA.5. C. Amador, M.S. Walters, D.I. O’Reilly, M.D. Clough, J.P. Beinke and R.S.T. Sawiris.: �Best Practices and Lessons
Learned in the Construction and Maintenance of a Complex Gas Asset Integrated Production Model (IPM)� SPE146968 presented at the SPE asia pacific oil and gas conference and exhibition, September 2011, Jakarta, Indonesia.
6. E. A. Ageh, A. Adegoke, O. J. Uzoh.: �Using Integrated Production Modeling, (IPM) as an Optimization Tool forField Development Planning and Management� SPE 140625, August 2010, Calabar, Nigeria.
7. Wood Mackenzie: OML 130 Key Facts, Nigeria and Central African upstream Service, October 2009.8. Umut Ozdogan, James F. Keating, Mark Knobles, Adwait Chawathe and Doruk Seren,: �Recent Advances and
Practical Applications of Integrated Production Modeling at Jack Asset In Deepwater Gulf of Mexico,� SPE 113904presented at the 2008 SPE Europec/EAGE Annual Conference and Exhibition, Rome, Italy.
9. Tarek Ahmed.: Reservoir Engineering Handbook, Third Edition.
8 SPE-184311-MS