spe-185077-ms - · pdf filespe-185077-ms multivariate analysis using advanced probabilistic...
TRANSCRIPT

SPE-185077-MS
Multivariate Analysis Using Advanced Probabilistic
Techniques for Completion Optimization
Bertrand Groulx, Verdazo Analytics; Jim Gouveia, Rose & Associates,
LLP; Don Chenery, Verdazo Analytics
Agenda
1) Introduction (Multivariate Analysis)
2) Objective & Purpose of this Study
3) Hybrid Visual Approach
4) Parallel Coordinates Distribution Patterns
5) Input Optimization Distributions
6) Workflow
7) Studies
8) Conclusions
Slide 2
SPE-185077-MS • Multivariate Analysis Using Advanced Probabilistic Techniques for Completion Optimization • B. Groulx
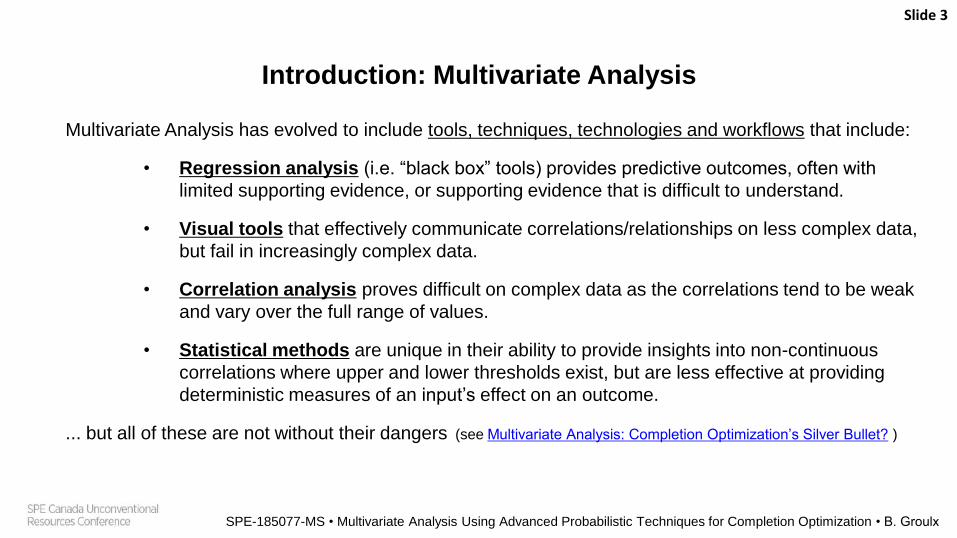
Introduction: Multivariate Analysis
Multivariate Analysis has evolved to include tools, techniques, technologies and workflows that include:
• Regression analysis (i.e. “black box” tools) provides predictive outcomes, often with
limited supporting evidence, or supporting evidence that is difficult to understand.
• Visual tools that effectively communicate correlations/relationships on less complex data,
but fail in increasingly complex data.
• Correlation analysis proves difficult on complex data as the correlations tend to be weak
and vary over the full range of values.
• Statistical methods are unique in their ability to provide insights into non-continuous
correlations where upper and lower thresholds exist, but are less effective at providing
deterministic measures of an input’s effect on an outcome.
... but all of these are not without their dangers (see Multivariate Analysis: Completion Optimization’s Silver Bullet? )
Slide 3
SPE-185077-MS • Multivariate Analysis Using Advanced Probabilistic Techniques for Completion Optimization • B. Groulx
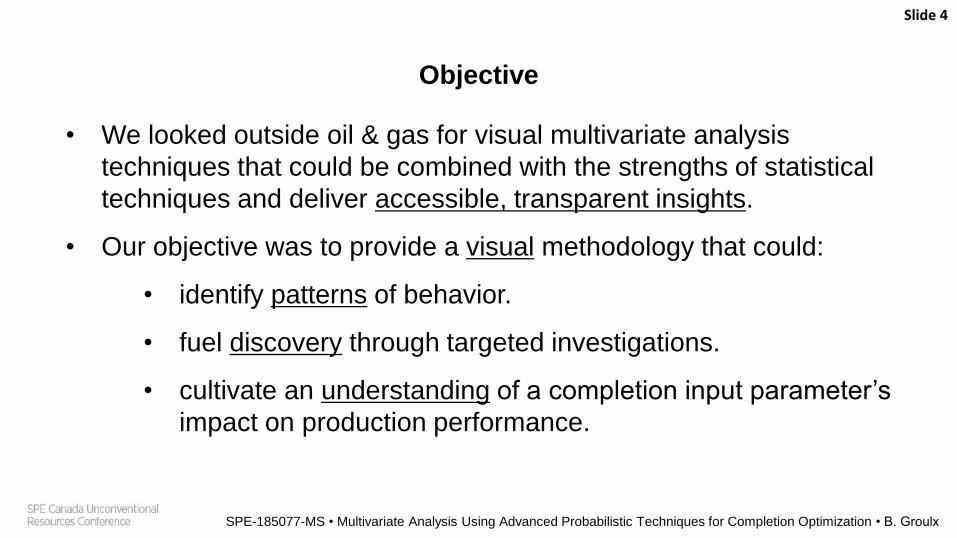
Objective
• We looked outside oil & gas for visual multivariate analysis
techniques that could be combined with the strengths of statistical
techniques and deliver accessible, transparent insights.
• Our objective was to provide a visual methodology that could:
• identify patterns of behavior.
• fuel discovery through targeted investigations.
• cultivate an understanding of a completion input parameter’s
impact on production performance.
Slide 4
SPE-185077-MS • Multivariate Analysis Using Advanced Probabilistic Techniques for Completion Optimization • B. Groulx
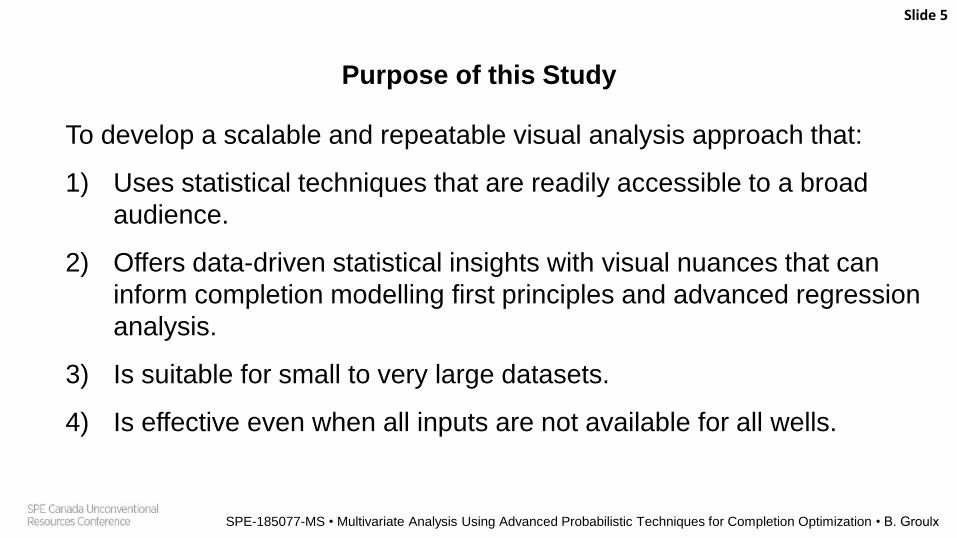
Purpose of this Study
To develop a scalable and repeatable visual analysis approach that:
1) Uses statistical techniques that are readily accessible to a broad
audience.
2) Offers data-driven statistical insights with visual nuances that can
inform completion modelling first principles and advanced regression
analysis.
3) Is suitable for small to very large datasets.
4) Is effective even when all inputs are not available for all wells.
Slide 5
SPE-185077-MS • Multivariate Analysis Using Advanced Probabilistic Techniques for Completion Optimization • B. Groulx
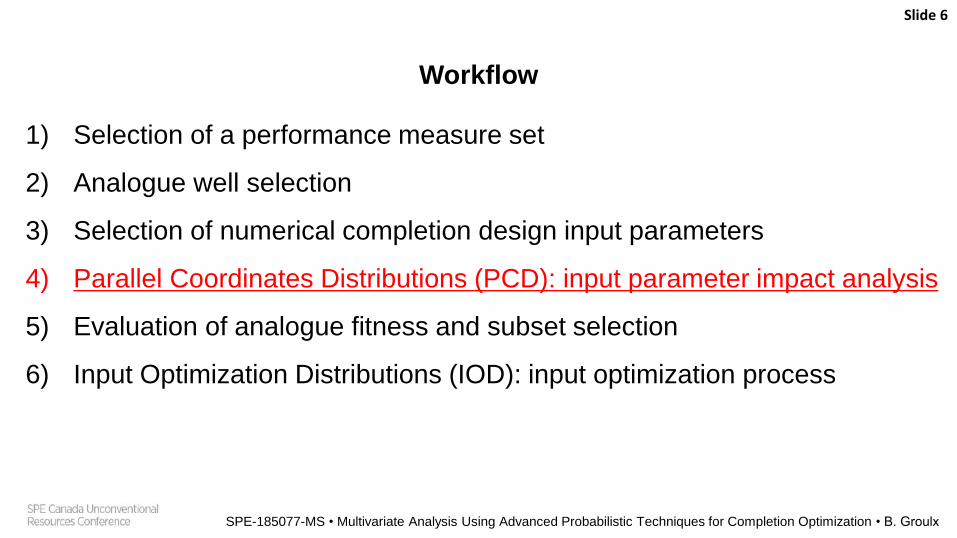
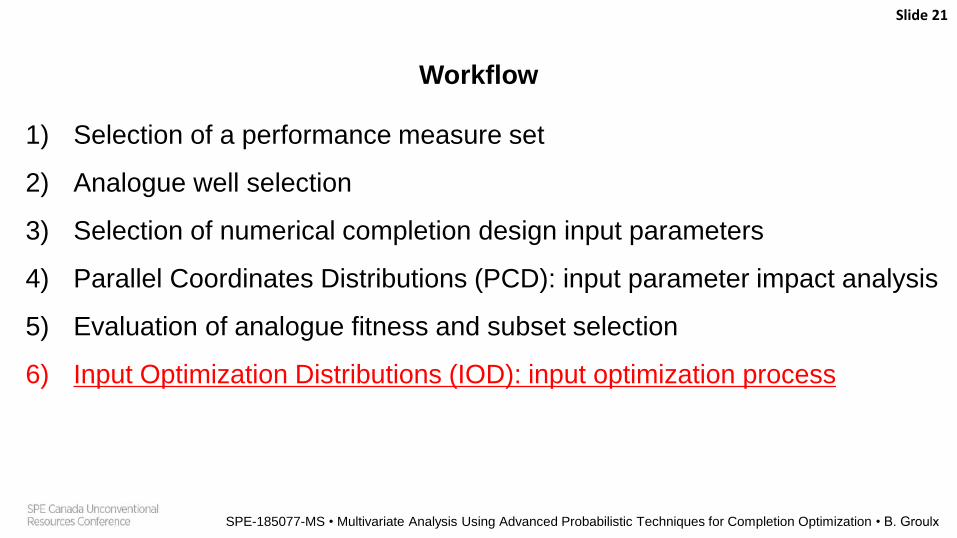
Workflow
1) Selection of a performance measure set
2) Analogue well selection
3) Selection of numerical completion design input parameters
4) Parallel Coordinates Distributions (PCD): input parameter impact analysis
5) Evaluation of analogue fitness and subset selection
6) Input Optimization Distributions (IOD): input optimization process
Slide 6
SPE-185077-MS • Multivariate Analysis Using Advanced Probabilistic Techniques for Completion Optimization • B. Groulx
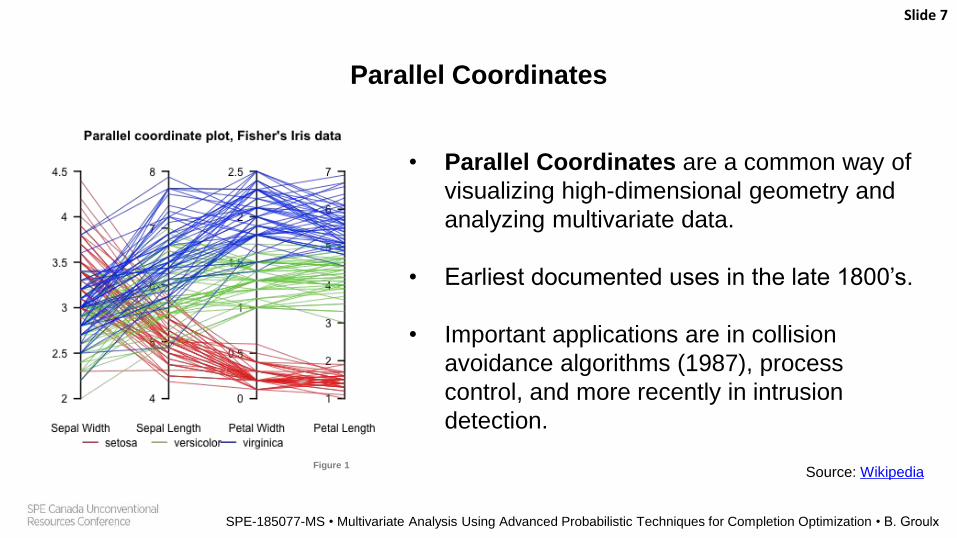
Parallel Coordinates
• Parallel Coordinates are a common way of
visualizing high-dimensional geometry and
analyzing multivariate data.
• Earliest documented uses in the late 1800’s.
• Important applications are in collision
avoidance algorithms (1987), process
control, and more recently in intrusion
detection.
Source: Wikipedia
Slide 7
SPE-185077-MS • Multivariate Analysis Using Advanced Probabilistic Techniques for Completion Optimization • B. Groulx
Figure 1
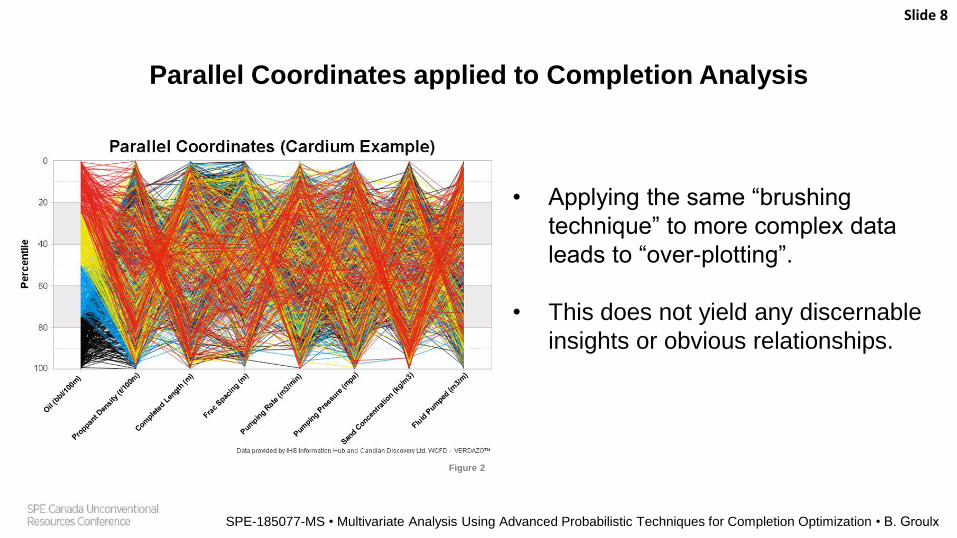
Parallel Coordinates applied to Completion Analysis
• Applying the same “brushing
technique” to more complex data
leads to “over-plotting”.
• This does not yield any discernable
insights or obvious relationships.
Slide 8
SPE-185077-MS • Multivariate Analysis Using Advanced Probabilistic Techniques for Completion Optimization • B. Groulx
Figure 2
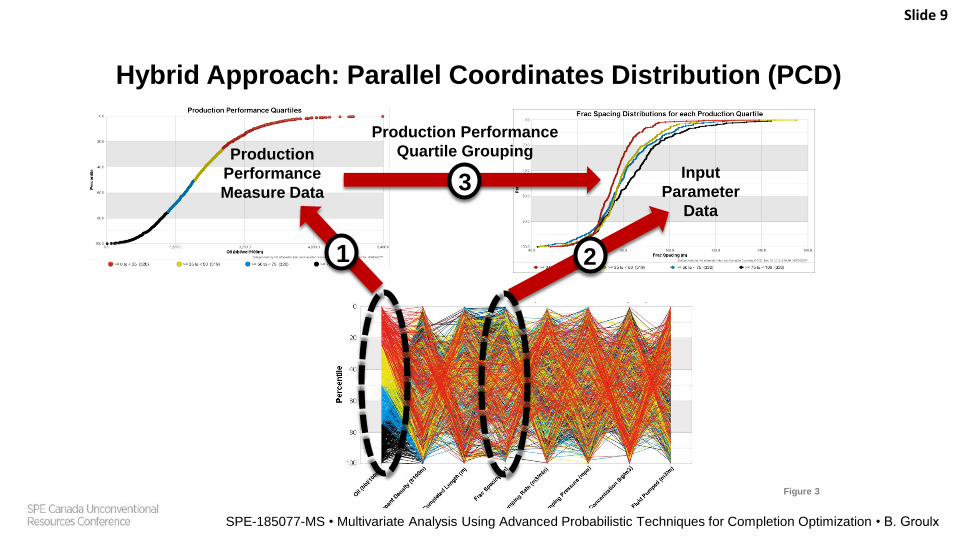
Hybrid Approach: Parallel Coordinates Distribution (PCD)
Slide 9
Production
Performance
Measure Data
Input
Parameter
Data
Production Performance
Quartile Grouping
1 2
3
SPE-185077-MS • Multivariate Analysis Using Advanced Probabilistic Techniques for Completion Optimization • B. Groulx
Figure 3
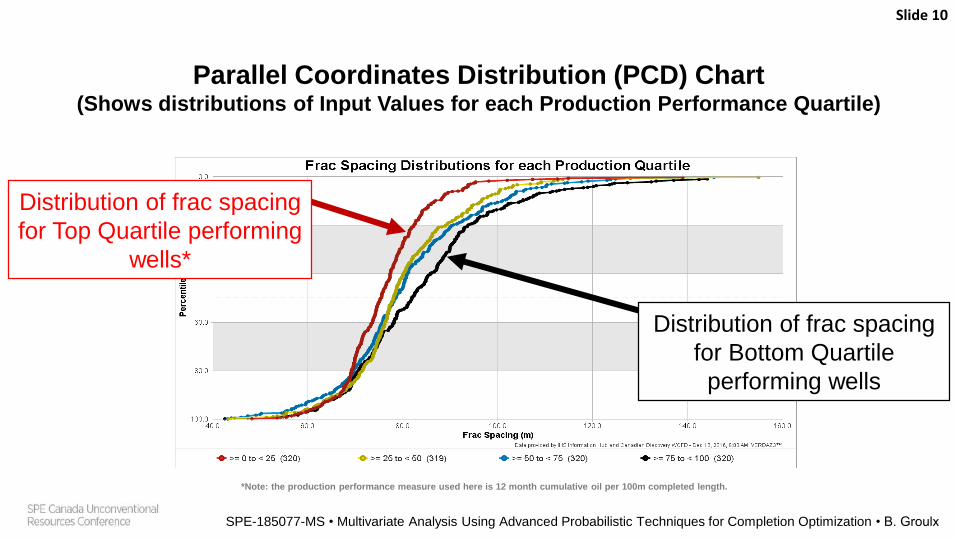
Parallel Coordinates Distribution (PCD) Chart(Shows distributions of Input Values for each Production Performance Quartile)
Slide 10
SPE-185077-MS • Multivariate Analysis Using Advanced Probabilistic Techniques for Completion Optimization • B. Groulx
Distribution of frac spacing
for Top Quartile performing
wells*
Distribution of frac spacing
for Bottom Quartile
performing wells
*Note: the production performance measure used here is 12 month cumulative oil per 100m completed length.

Purpose of Parallel Coordinates Distribution (PCD) Chart
• Identify the inputs that warrant optimization investigation (i.e. to focus your
efforts where it counts the most)
• Identify patterns that illustrate the concepts of thresholds and correlation
windows.
• Use patterns to determine target values used in the binning of Input
Optimization Distribution charts (discussed later in this presentation).
• Identify peculiarities in the patterns that may suggest the analogue is not well
defined and subsets should be investigated.
Slide 11
SPE-185077-MS • Multivariate Analysis Using Advanced Probabilistic Techniques for Completion Optimization • B. Groulx

PCD Chart Patterns: Clear Performance Pattern
Slide 12
SPE-185077-MS • Multivariate Analysis Using Advanced Probabilistic Techniques for Completion Optimization • B. Groulx
Shows a clear progression from
Bottom Quartile to Top Quartile
a
Figure 4
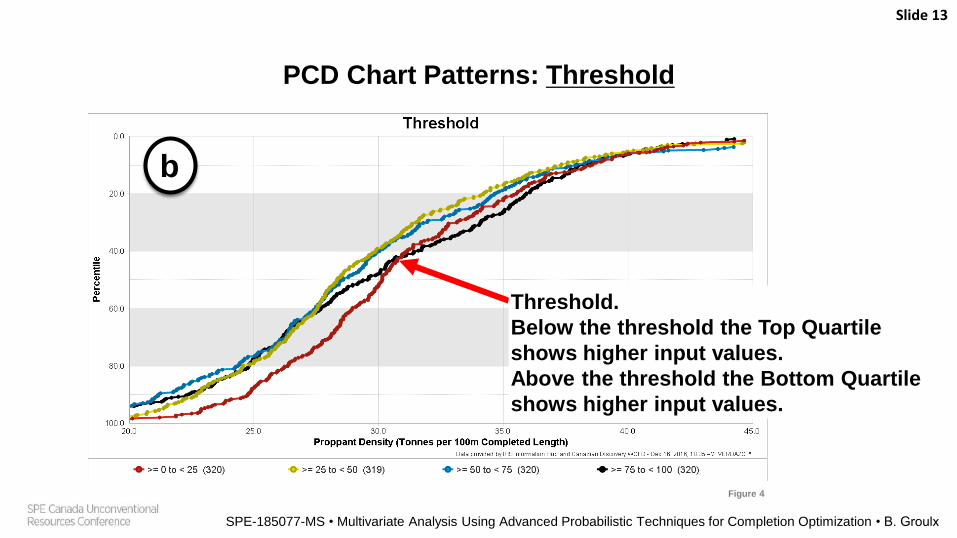
PCD Chart Patterns: Threshold
text
Slide 13
SPE-185077-MS • Multivariate Analysis Using Advanced Probabilistic Techniques for Completion Optimization • B. Groulx
Threshold.
Below the threshold the Top Quartile
shows higher input values.
Above the threshold the Bottom Quartile
shows higher input values.
b
Figure 4
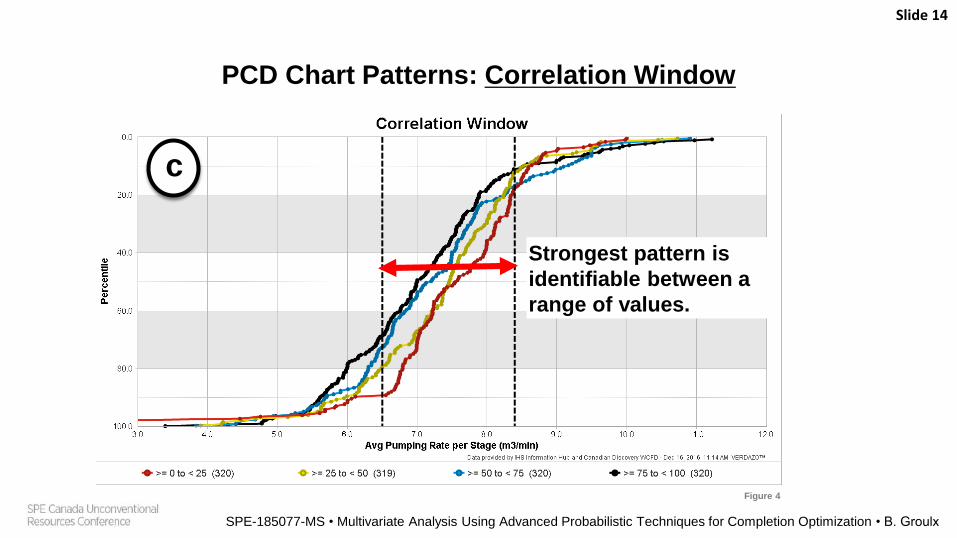
PCD Chart Patterns: Correlation Window
Slide 14
SPE-185077-MS • Multivariate Analysis Using Advanced Probabilistic Techniques for Completion Optimization • B. Groulx
Strongest pattern is
identifiable between a
range of values.
c
Figure 4
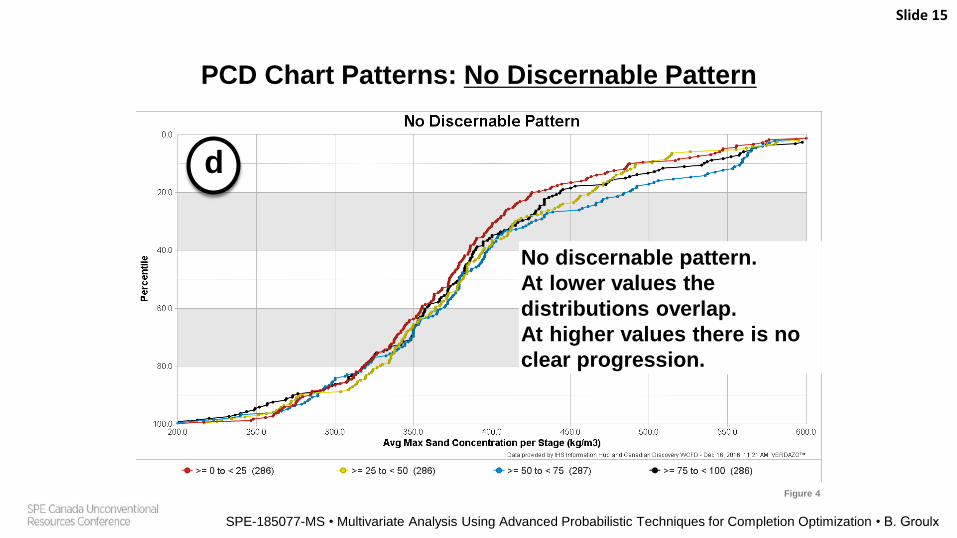
PCD Chart Patterns: No Discernable Pattern
text
Slide 15
SPE-185077-MS • Multivariate Analysis Using Advanced Probabilistic Techniques for Completion Optimization • B. Groulx
No discernable pattern.
At lower values the
distributions overlap.
At higher values there is no
clear progression.
d
Figure 4
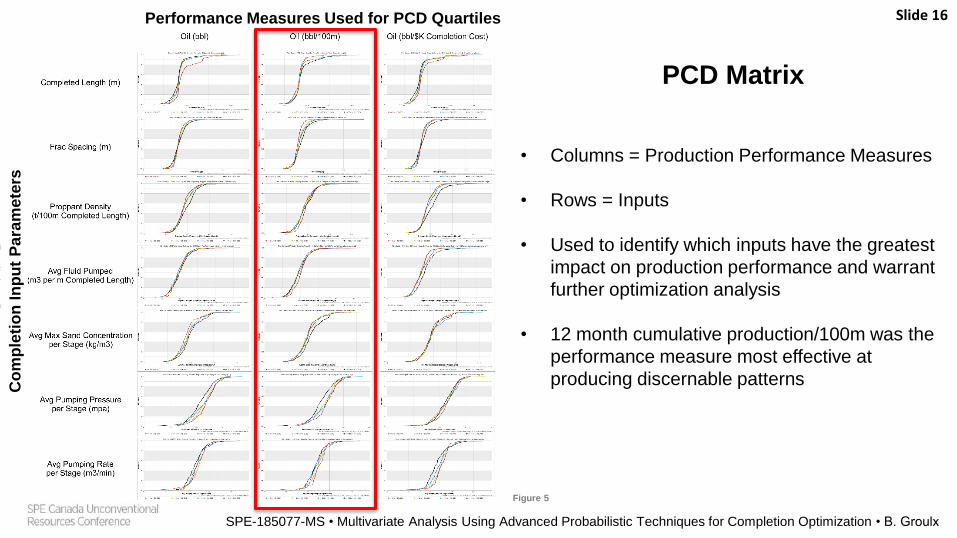
PCD Matrix
• Columns = Production Performance Measures
• Rows = Inputs
• Used to identify which inputs have the greatest
impact on production performance and warrant
further optimization analysis
• 12 month cumulative production/100m was the
performance measure most effective at
producing discernable patterns
SPE-185077-MS • Multivariate Analysis Using Advanced Probabilistic Techniques for Completion Optimization • B. Groulx
Slide 16Performance Measures Used for PCD QuartilesC
om
ple
tio
n I
np
ut
Pa
ram
ete
rs
Figure 5
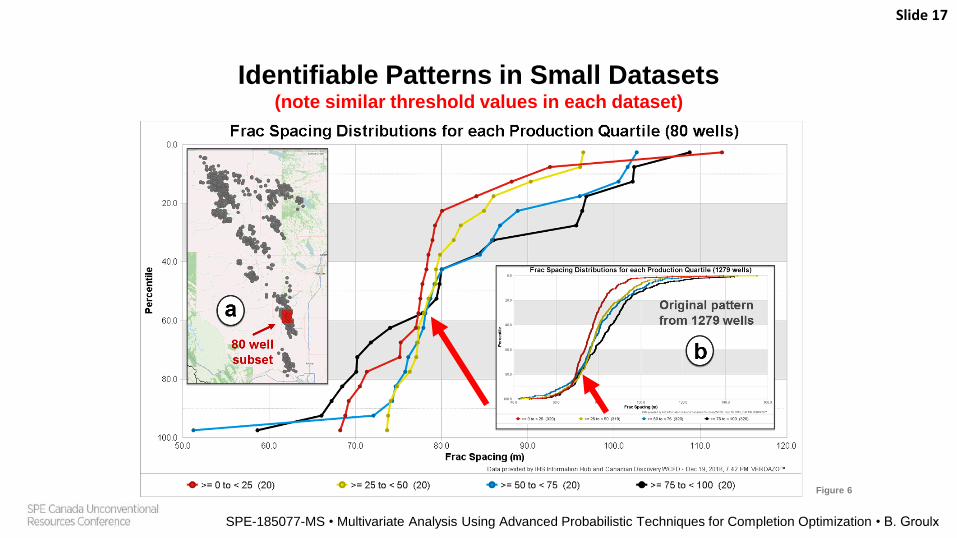
Identifiable Patterns in Small Datasets(note similar threshold values in each dataset)
Slide 17
SPE-185077-MS • Multivariate Analysis Using Advanced Probabilistic Techniques for Completion Optimization • B. Groulx
Figure 6

Important PCD Considerations
1) Dimensionally normalized performance measures show patterns
more clearly
2) Length is the easiest parameter to correct for (e.g. production/100m)
3) Patterns can still be seen in sample sets as small as 80 wells
4) Consider that uncertainty of the mean (and of how representative the
distribution is) increases as the sample size get smaller
Slide 18
SPE-185077-MS • Multivariate Analysis Using Advanced Probabilistic Techniques for Completion Optimization • B. Groulx
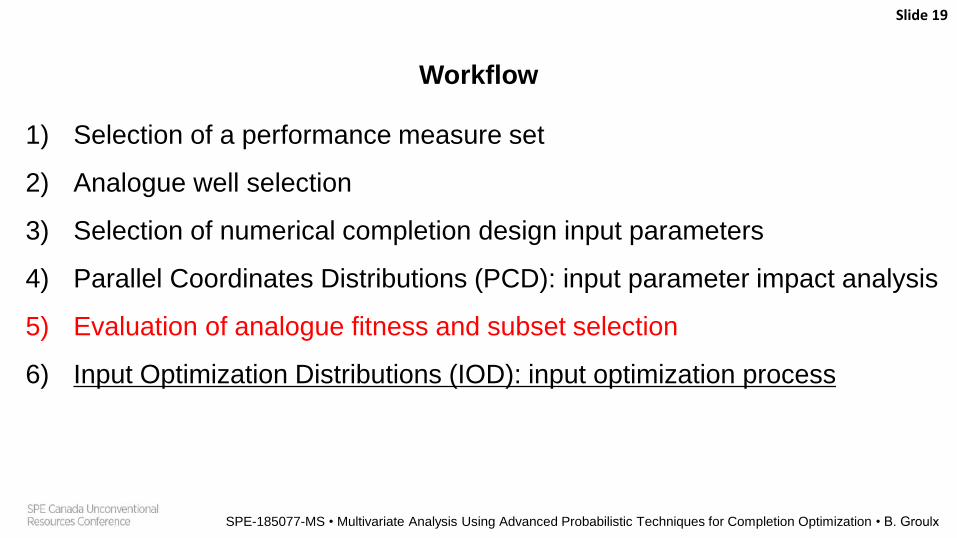
Workflow
1) Selection of a performance measure set
2) Analogue well selection
3) Selection of numerical completion design input parameters
4) Parallel Coordinates Distributions (PCD): input parameter impact analysis
5) Evaluation of analogue fitness and subset selection
6) Input Optimization Distributions (IOD): input optimization process
Slide 19
SPE-185077-MS • Multivariate Analysis Using Advanced Probabilistic Techniques for Completion Optimization • B. Groulx
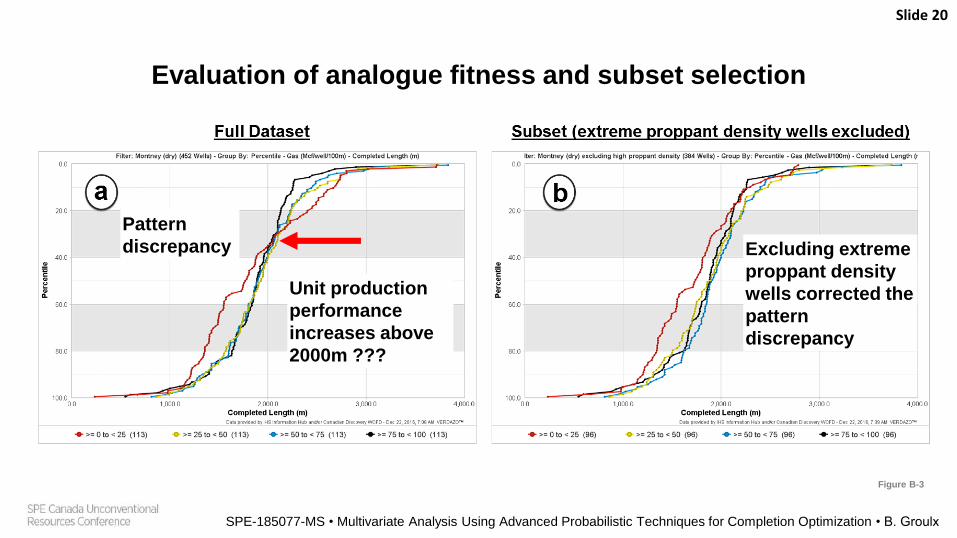
Evaluation of analogue fitness and subset selection
Map and insights
Slide 20
SPE-185077-MS • Multivariate Analysis Using Advanced Probabilistic Techniques for Completion Optimization • B. Groulx
Unit production
performance
increases above
2000m ???
Excluding extreme
proppant density
wells corrected the
pattern
discrepancy
Figure B-3
Pattern
discrepancy
Workflow
1) Selection of a performance measure set
2) Analogue well selection
3) Selection of numerical completion design input parameters
4) Parallel Coordinates Distributions (PCD): input parameter impact analysis
5) Evaluation of analogue fitness and subset selection
6) Input Optimization Distributions (IOD): input optimization process
Slide 21
SPE-185077-MS • Multivariate Analysis Using Advanced Probabilistic Techniques for Completion Optimization • B. Groulx
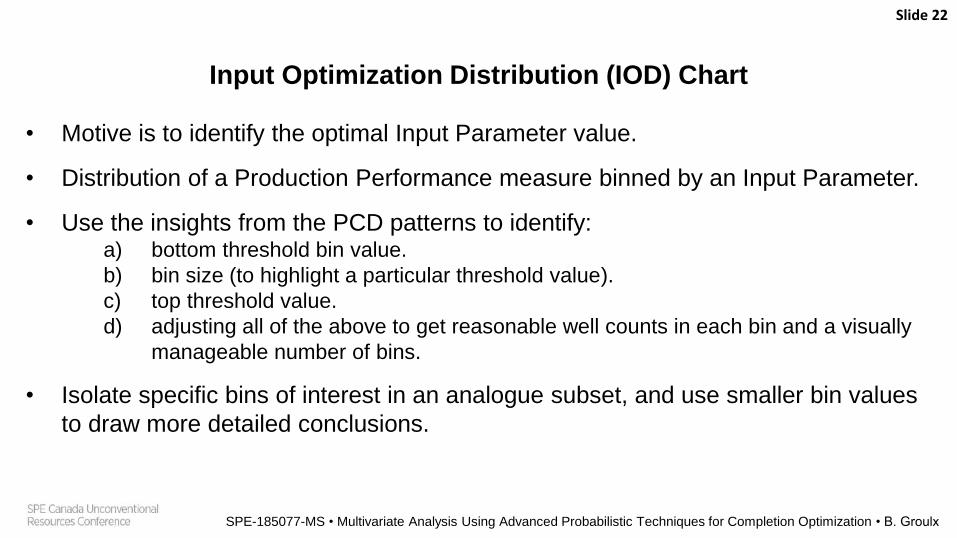
Input Optimization Distribution (IOD) Chart
• Motive is to identify the optimal Input Parameter value.
• Distribution of a Production Performance measure binned by an Input Parameter.
• Use the insights from the PCD patterns to identify:a) bottom threshold bin value.
b) bin size (to highlight a particular threshold value).
c) top threshold value.
d) adjusting all of the above to get reasonable well counts in each bin and a visually
manageable number of bins.
• Isolate specific bins of interest in an analogue subset, and use smaller bin values
to draw more detailed conclusions.
Slide 22
SPE-185077-MS • Multivariate Analysis Using Advanced Probabilistic Techniques for Completion Optimization • B. Groulx

IOD applied to a PCD with a Clear Performance Pattern
Slide 23
SPE-185077-MS • Multivariate Analysis Using Advanced Probabilistic Techniques for Completion Optimization • B. Groulx
Figure 7
Frac Spacing Bins
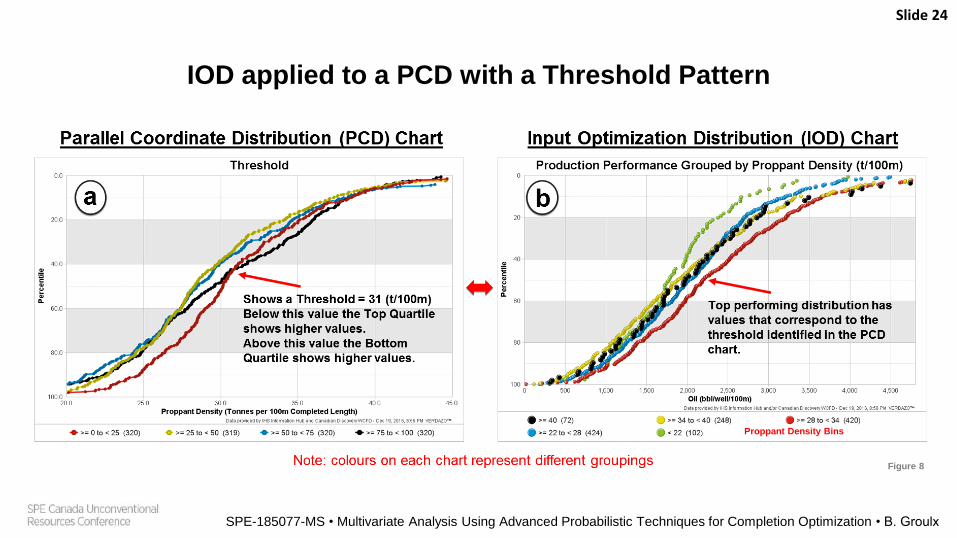
IOD applied to a PCD with a Threshold Pattern
Text
Slide 24
SPE-185077-MS • Multivariate Analysis Using Advanced Probabilistic Techniques for Completion Optimization • B. Groulx
Figure 8
Proppant Density Bins

IOD applied to a PCD with a Correlation Window
Text
Slide 25
SPE-185077-MS • Multivariate Analysis Using Advanced Probabilistic Techniques for Completion Optimization • B. Groulx
Figure 9
Pumping Rate Bins
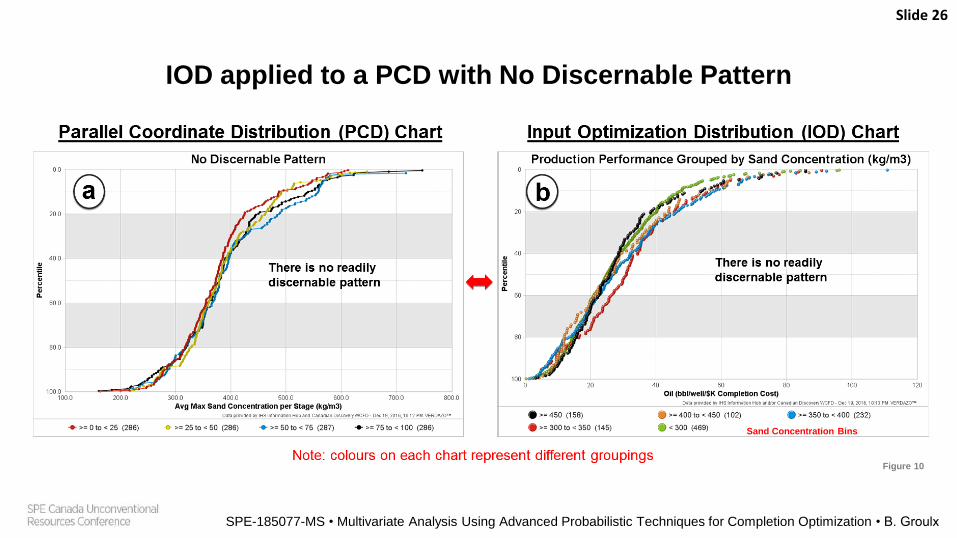
IOD applied to a PCD with No Discernable Pattern
Text
Slide 26
SPE-185077-MS • Multivariate Analysis Using Advanced Probabilistic Techniques for Completion Optimization • B. Groulx
Figure 10
Sand Concentration Bins
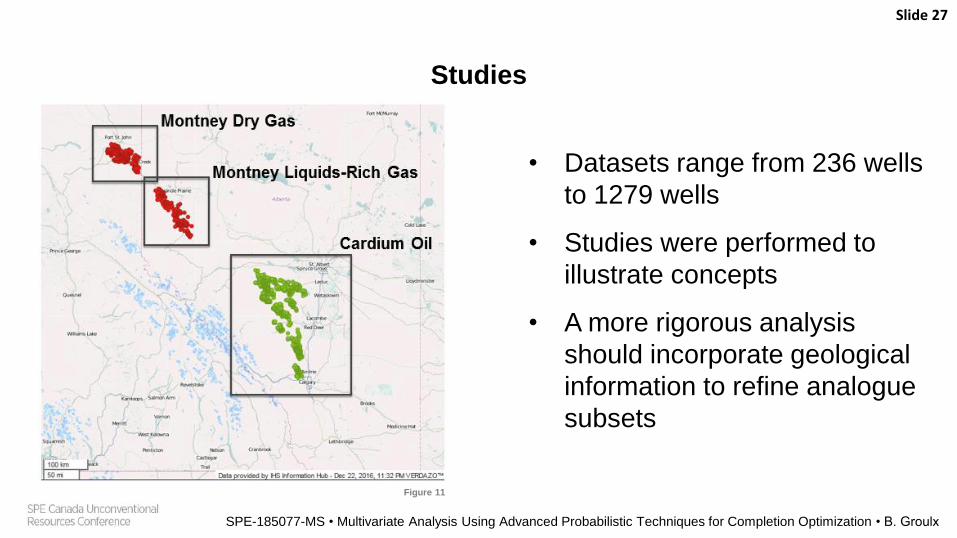
Studies
• Datasets range from 236 wells
to 1279 wells
• Studies were performed to
illustrate concepts
• A more rigorous analysis
should incorporate geological
information to refine analogue
subsets
Slide 27
SPE-185077-MS • Multivariate Analysis Using Advanced Probabilistic Techniques for Completion Optimization • B. Groulx
Figure 11
Workflow
1) Selection of a performance measure set
2) Analogue well selection
3) Selection of numerical completion design input parameters
4) Parallel Coordinates Distributions (PCD): input parameter impact analysis
5) Evaluation of analogue fitness and subset selection
6) Input Optimization Distributions (IOD): input optimization process
Slide 28
SPE-185077-MS • Multivariate Analysis Using Advanced Probabilistic Techniques for Completion Optimization • B. Groulx
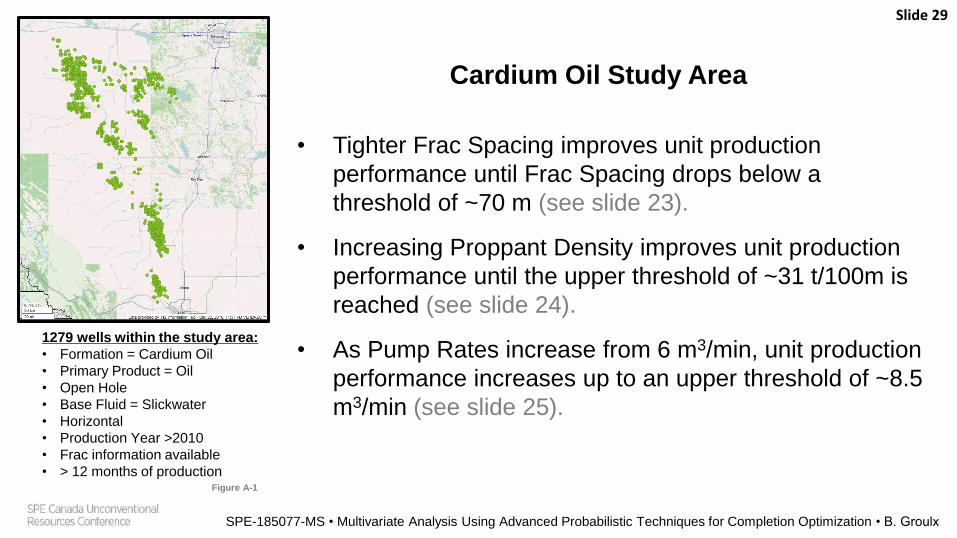
Cardium Oil Study Area
• Tighter Frac Spacing improves unit production
performance until Frac Spacing drops below a
threshold of ~70 m (see slide 23).
• Increasing Proppant Density improves unit production
performance until the upper threshold of ~31 t/100m is
reached (see slide 24).
• As Pump Rates increase from 6 m3/min, unit production
performance increases up to an upper threshold of ~8.5
m3/min (see slide 25).
Slide 29
SPE-185077-MS • Multivariate Analysis Using Advanced Probabilistic Techniques for Completion Optimization • B. Groulx
1279 wells within the study area:
• Formation = Cardium Oil
• Primary Product = Oil
• Open Hole
• Base Fluid = Slickwater
• Horizontal
• Production Year >2010
• Frac information available
• > 12 months of productionFigure A-1
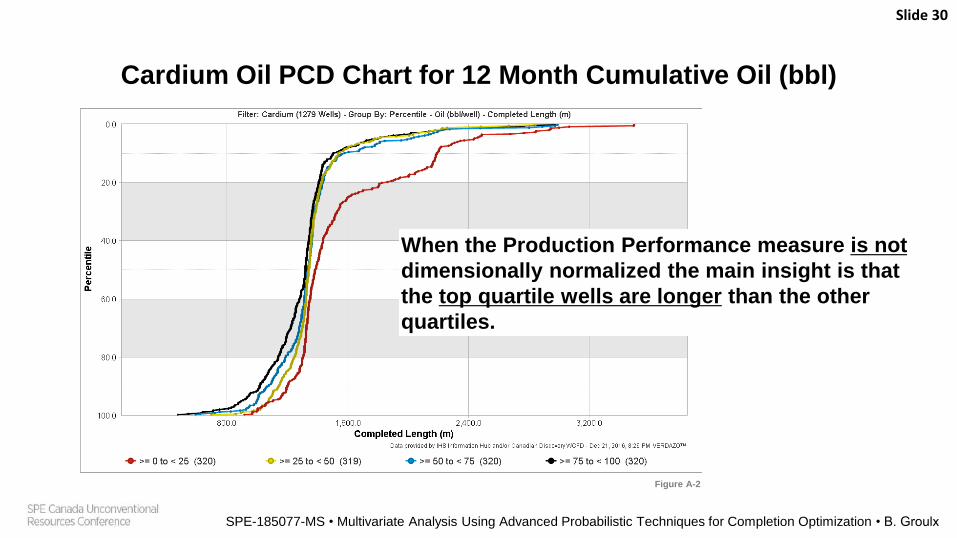
Cardium Oil PCD Chart for 12 Month Cumulative Oil (bbl)
Slide 30
SPE-185077-MS • Multivariate Analysis Using Advanced Probabilistic Techniques for Completion Optimization • B. Groulx
When the Production Performance measure is not
dimensionally normalized the main insight is that
the top quartile wells are longer than the other
quartiles.
Figure A-2
Cardium Oil PCD Chart for 12 Month Cumulative Oil (bbl/100m)
Map and insights
Slide 31
SPE-185077-MS • Multivariate Analysis Using Advanced Probabilistic Techniques for Completion Optimization • B. Groulx
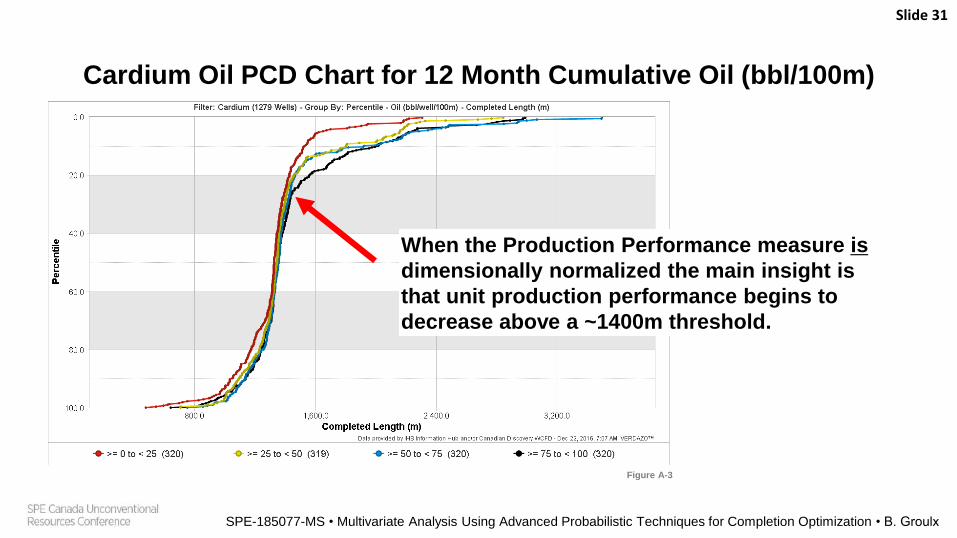
When the Production Performance measure is
dimensionally normalized the main insight is
that unit production performance begins to
decrease above a ~1400m threshold.
Figure A-3

Montney Dry Gas Study Area
• Demonstrated a contradictory PCD pattern on
Completed Length that required investigating an
analogue subset selection (to separate out extreme
proppant density wells).
• Reduction in unit production performance above
upper threshold of ~ 2000m completed length.
• Dramatic increase in unit production performance
with higher Proppant Density (t/100m) with no
upper threshold.
Slide 32
SPE-185077-MS • Multivariate Analysis Using Advanced Probabilistic Techniques for Completion Optimization • B. Groulx
452 wells within the study area:
• Formation = Montney
• Primary Product = Gas
• Cased
• Base Fluid = Slickwater
• Horizontal
• Production Year >2009
• Frac information available
• > 12 months of production
`Figure B-1
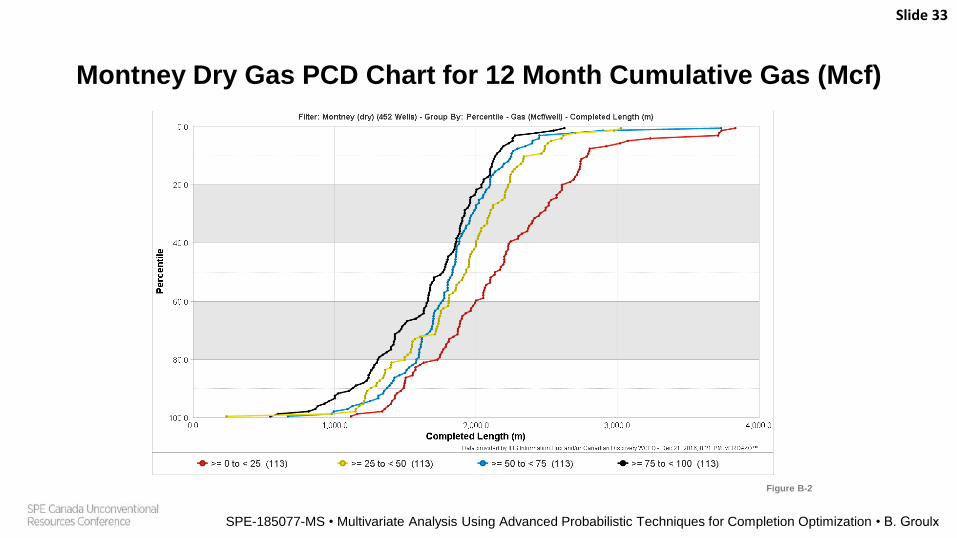
Montney Dry Gas PCD Chart for 12 Month Cumulative Gas (Mcf)
Map and insights
Slide 33
SPE-185077-MS • Multivariate Analysis Using Advanced Probabilistic Techniques for Completion Optimization • B. Groulx
Figure B-2
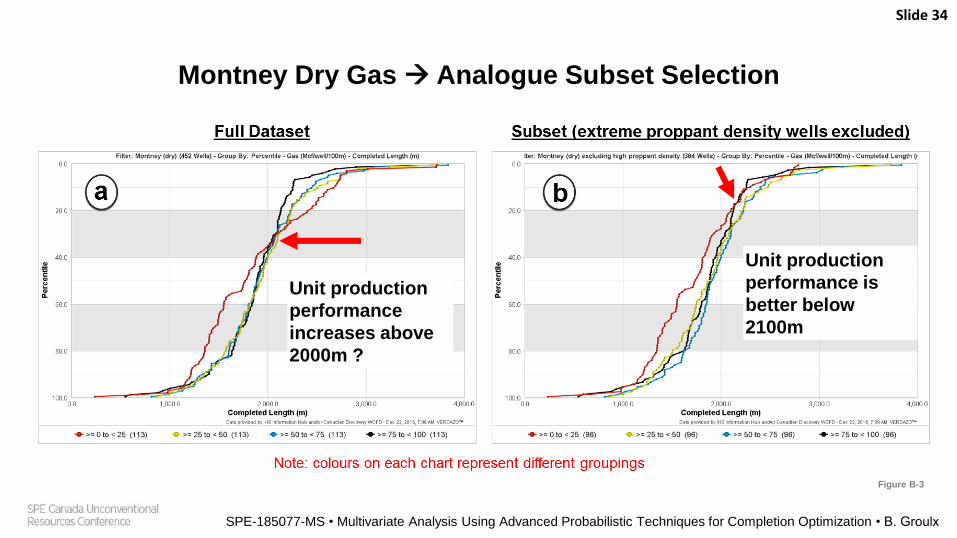
Montney Dry Gas Analogue Subset Selection
Map and insights
Slide 34
SPE-185077-MS • Multivariate Analysis Using Advanced Probabilistic Techniques for Completion Optimization • B. Groulx
Unit production
performance
increases above
2000m ?
Unit production
performance is
better below
2100m
Figure B-3
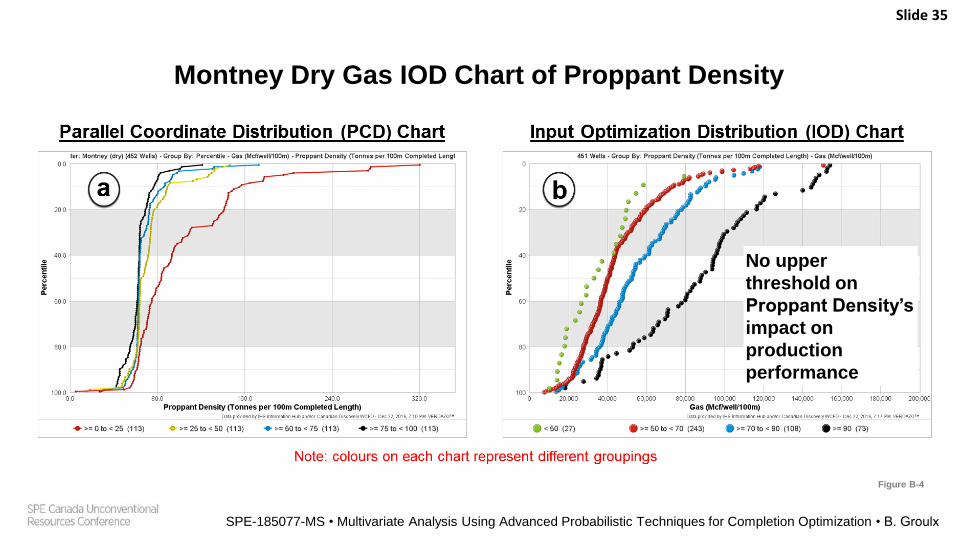
Montney Dry Gas IOD Chart of Proppant Density
Map and insights
Slide 35
SPE-185077-MS • Multivariate Analysis Using Advanced Probabilistic Techniques for Completion Optimization • B. Groulx
No upper
threshold on
Proppant Density’s
impact on
production
performance
Figure B-4
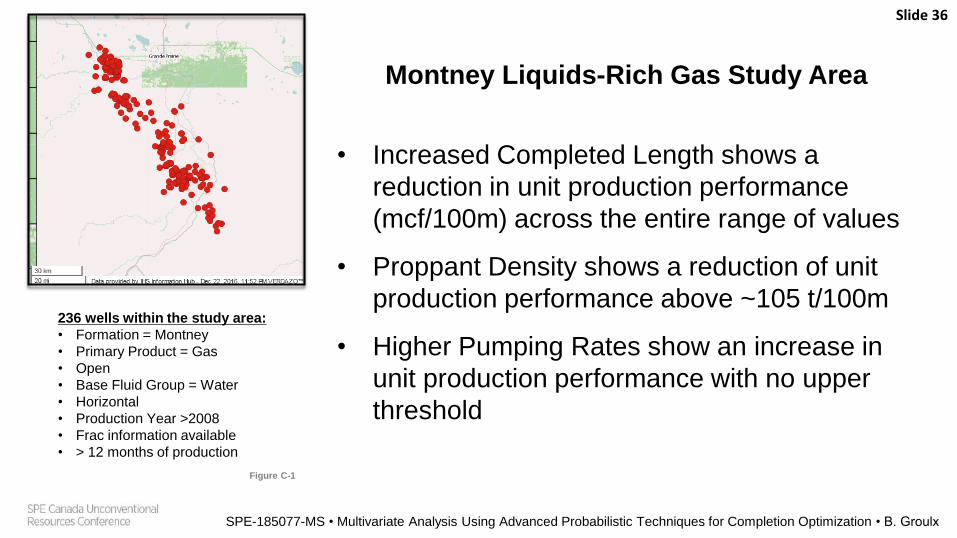
Montney Liquids-Rich Gas Study Area
• Increased Completed Length shows a
reduction in unit production performance
(mcf/100m) across the entire range of values
• Proppant Density shows a reduction of unit
production performance above ~105 t/100m
• Higher Pumping Rates show an increase in
unit production performance with no upper
threshold
Slide 36
SPE-185077-MS • Multivariate Analysis Using Advanced Probabilistic Techniques for Completion Optimization • B. Groulx
236 wells within the study area:
• Formation = Montney
• Primary Product = Gas
• Open
• Base Fluid Group = Water
• Horizontal
• Production Year >2008
• Frac information available
• > 12 months of production
Figure C-1
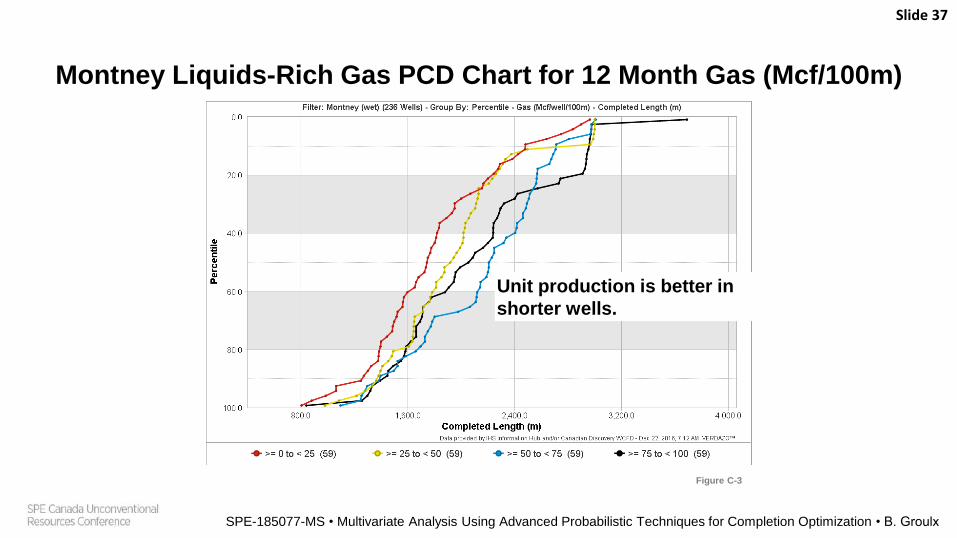
Montney Liquids-Rich Gas PCD Chart for 12 Month Gas (Mcf/100m)
Map and insights
Slide 37
SPE-185077-MS • Multivariate Analysis Using Advanced Probabilistic Techniques for Completion Optimization • B. Groulx
Unit production is better in
shorter wells.
Figure C-3
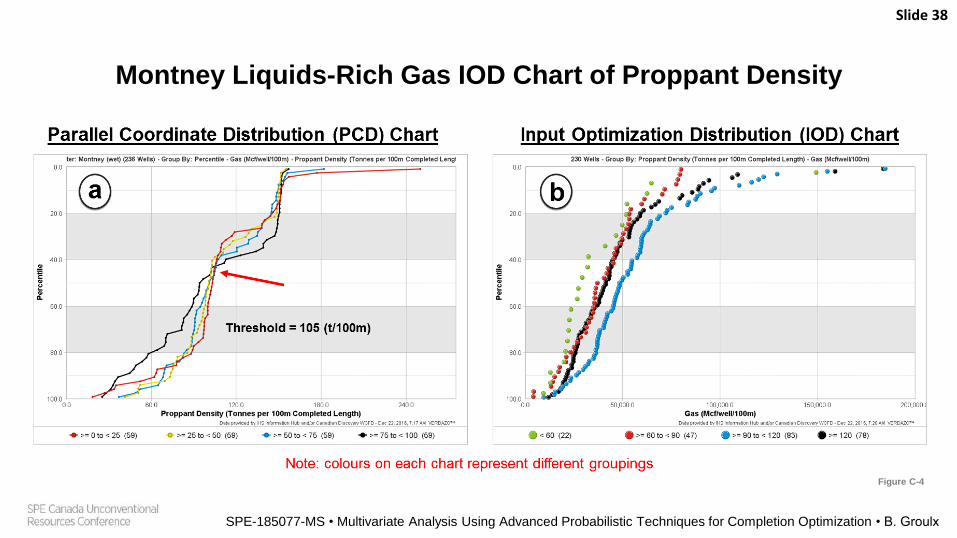
Montney Liquids-Rich Gas IOD Chart of Proppant Density
Map and insights
Slide 38
SPE-185077-MS • Multivariate Analysis Using Advanced Probabilistic Techniques for Completion Optimization • B. Groulx
Figure C-4
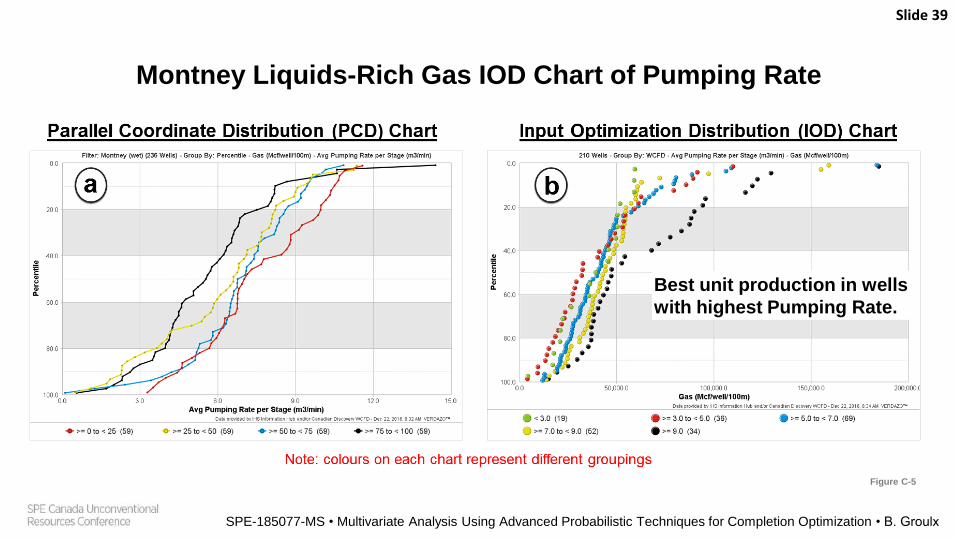
Montney Liquids-Rich Gas IOD Chart of Pumping Rate
Map and insights
Slide 39
SPE-185077-MS • Multivariate Analysis Using Advanced Probabilistic Techniques for Completion Optimization • B. Groulx
Best unit production in wells
with highest Pumping Rate.
Figure C-5

Conclusions Part 1
• The PCD and IOD visual analysis methodology is suitable for testing any input’s impact
on any performance measure.
• PCD Patterns were identifiable in all study areas, suggesting this methodology is
suitable for all play types.
• Where rate restriction practices are being used it is recommended that cumulative
production (for >= 12 months) be used (i.e. IP90 or other near-term performance
measures could yield misleading results).
• Patterns are better defined when performance measures and inputs use dimensional
normalization.
• Lateral length is the easiest, and most effective, input parameter to correct for.
Slide 40
SPE-185077-MS • Multivariate Analysis Using Advanced Probabilistic Techniques for Completion Optimization • B. Groulx

Conclusions Part 2
• Inputs require enough statistical variability to see PCD Patterns (observations indicate
that P10:P90 of input parameter values need to be >1.6)
• This approach is effective at communicating nuances in the data, such as thresholds
and correlation windows.
• Specific threshold values and correlation window ranges can be valuable inputs to
other regression techniques or modelling efforts.
• The approach is scalable, accommodating datasets containing greater than 1000 wells
down to as few as 80 wells.
• Inexplicable patterns are an effective way of identifying the need for analogue review
and subset selection.
Slide 41
SPE-185077-MS • Multivariate Analysis Using Advanced Probabilistic Techniques for Completion Optimization • B. Groulx
Acknowledgements / Thank You / Questions
The authors wish to acknowledge:
• IHS Markit’s Canadian Information Hub for production data.
• Canadian Discovery Ltd.’s Well Completion and Frac Database (now
owned by geoLOGIC Systems) for completion data.
• Verdazo Analytics Inc. and Rose and Associates for their support.
Slide 42

Supporting slide for anticipated question:
“Why did you not use production/stage as
your performance measure?”
Stages work collectively as a system, not
independently. As you increase stage spacing
you increase the degree to which the
stimulated rock volumes for each stage
overlap (as evidenced in this image).
Optimal production for a well occurs when the
amount of overlap for a collection of stages
produces the highest production levels. The
maximum production/stage will not deliver
optimal well production unless the stages do
not interfere with one another.
Slide 43
SPE-185077-MS • Multivariate Analysis Using Advanced Probabilistic Techniques for Completion Optimization • B. Groulx
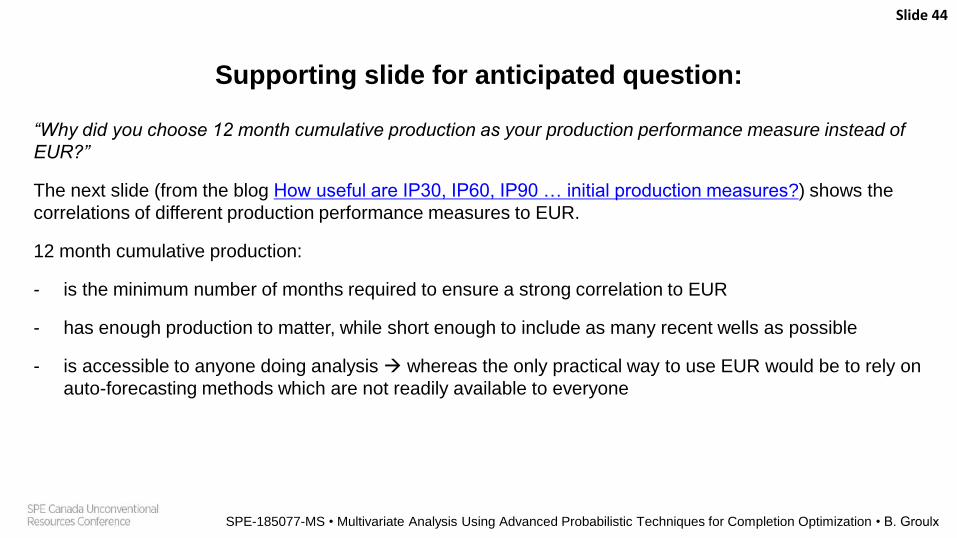
Supporting slide for anticipated question:
“Why did you choose 12 month cumulative production as your production performance measure instead of
EUR?”
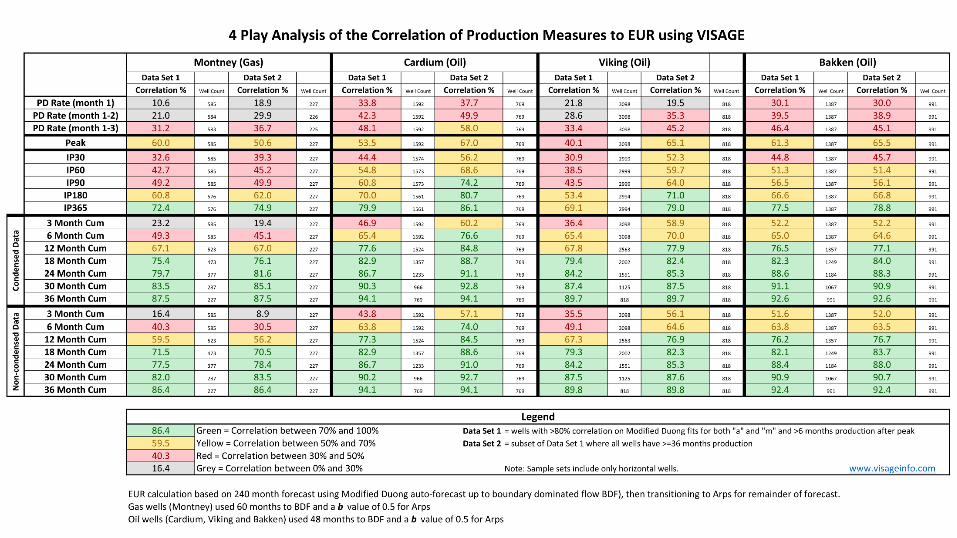
The next slide (from the blog How useful are IP30, IP60, IP90 … initial production measures?) shows the
correlations of different production performance measures to EUR.
12 month cumulative production:
- is the minimum number of months required to ensure a strong correlation to EUR
- has enough production to matter, while short enough to include as many recent wells as possible
- is accessible to anyone doing analysis whereas the only practical way to use EUR would be to rely on
auto-forecasting methods which are not readily available to everyone
Slide 44
SPE-185077-MS • Multivariate Analysis Using Advanced Probabilistic Techniques for Completion Optimization • B. Groulx
Support for possible questions:
Slide 45
SPE-185077-MS • Multivariate Analysis Using Advanced Probabilistic Techniques for Completion Optimization • B. Groulx