spec open systems group cloud computing working group · spec open systems group cloud computing...
TRANSCRIPT

SPEC OPEN SYSTEMS GROUP
CLOUD COMPUTING WORKING GROUP
Report on Cloud
Computing to the
OSG Steering Committee

Table of Contents
Introduction and Objectives ...................................................... 3
1 Cloud Computing ............................................................ 5
1.1 Definition of the Cloud .......................................................... 5 1.1.1 Characteristics .............................................................................. 5 1.1.2 Service Models ............................................................................. 6 1.1.3 Deployment Models ...................................................................... 6
1.2 Interested parties of a Cloud Benchmark ............................. 6 1.2.1 Participants ................................................................................... 7 1.2.2 Cloud Benchmark Audience Types .............................................. 7
1.3 Cloud Computing Use Cases ............................................... 8 1.3.1 Computing Use Cases .................................................................. 8 1.3.2 Use Case to Customer Map ......................................................... 9 1.3.3 Use Case to Processing Type Map ............................................ 10
1.4 Existing Cloud Frameworks ................................................ 11
2 Benchmark Considerations ........................................... 12
2.1 What is a Cloud SUT? ........................................................ 12
2.2 SUT Components ............................................................... 13
2.3 Full Disclosure Report (FDR) Requirements ...................... 14
3 Relevant Cloud Metrics ................................................. 16
3.1 Elasticity ............................................................................. 16
3.2 Response Time .................................................................. 19
3.3 Throughput ......................................................................... 19
3.4 Variability ............................................................................ 21
3.5 Durability ............................................................................ 21
3.6 Reliability ............................................................................ 21
3.7 Availability .......................................................................... 22
3.8 Power ................................................................................. 23
3.9 Price ................................................................................... 23

3.10 Density ............................................................................... 24
4 What Makes a Benchmark a Cloud Benchmark? .......... 24
4.1 Cloudizing an Existing Benchmark ..................................... 25
4.2 Cloudize Existing SPEC Benchmarks ................................ 26
4.3 Dos and Don’ts of Benchmarking a Cloud .......................... 27
5 Tools to Measure Cloud Metrics .................................... 28
5.1 AEOLUS (Red Hat) ............................................................ 28
5.2 BITT (Intel) ......................................................................... 29
5.3 CloudBench (IBM) .............................................................. 30
6 OSG Cloud Subcommittee ............................................ 31
6.1 Cloud Subcommittee Charter ............................................. 31
6.2 Subcommittee specific Issues ............................................ 31
Appendix A. OSG Cloud Contributors ................................... 32
Appendix B. Cloud Computing Use Cases ........................... 33
Appendix C. CloudBench Description ................................... 37 Introduction ............................................................................................. 37 Experiment 1 ........................................................................................... 41 Experiment 2 ........................................................................................... 42 How does CloudBench collect performance data? ................................. 45 How does CloudBench incorporate new benchmarks and workloads? . 47 CloudBench Instantiation on Amazon EC2 ............................................ 47 Metrics .................................................................................................... 48 How is CloudBench different from SPECvirt? ........................................ 49
Appendix D. Bibliography ..................................................... 50

O S G C L O U D W G
REPORT TO OSSC 3
Introduction and
Objectives
With Cloud Computing on the rise, there is a need to monitor and measure the
performance of cloud systems. To address this issue, SPEC started two
separate working groups to investigate this area: one under the Research Group
(RG) and the second under the Open Systems Group (OSG). This document
covers the investigations and recommendations from the OSGCloud working
group.
The OSGCloud working group was formed with the main goal to research and
recommend application workloads for cloud computing in collaboration with
other osg sub-committees and the Research working group. The list of goals
included the following:
Help develop a cohesive cloud picture for OSG.
Develop a consensus definition of cloud computing.
Identify where the working group fits within the OSG spectrum.
Collaborate with OSG sub-committees to define the cloud picture.
Recommend a common framework for cloud benchmarks.
Investigate potential cloud metrics and identify which metrics are most
relevant for various SPEC benchmarks.
Create a set of guidelines for OSG subcommittees to use when they
create benchmarks in the cloud computing context.
Determine and recommend application workloads for cloud computing.

O S G C L O U D W G
REPORT TO OSSC 4
In contrast, the RG Cloud Group takes a broader approach relevant for both
academia and industry. Benchmarks developed by this group are intended to be
used to gain larger understanding of Cloud behavior and performance. The
main goal of research benchmarks is to provide representative application
scenarios, defined at a higher level of abstraction that can be used as a basis to
evaluate early prototypes and research results as well as full-blown
implementations of Cloud platforms.
The OSG Cloud Working Group investigated its assigned goals from April
2011 to February 2012. The group based its definition and industry
conventions on the NIST Cloud Computing publication, originally published as
a draft, and ultimately a final document in September 2011. From this base, the
Working Group has identified three classes of interested parties to Cloud
benchmark results: Hardware/Software-Vendors, Cloud-Providers and End-
Consumers. These three parties form two distinct relationships which define
two types of benchmarks: Black Box and White Box. These two benchmark
types have both conflicting and common requirements, which are highlighted
throughout the document. We identified Cloud Computing specific metrics and
define them in Section 3. Some Cloud metrics will have benchmark specific
variations, while others remain constant across all benchmarks. Section 4.1 and
4.2 contain some initial steps to consider when converting a benchmark to run
in a Cloud.
The OSGCloud members recommend the following:
1) Creation of an OSG Cloud subcommittee with an initial charter described in Section 6.1.
E X E C U T I V E
S U M M A R Y

O S G C L O U D W G
REPORT TO OSSC 5
1 Cloud Computing
1.1 Definition of the Cloud
We adopted the definition of cloud computing from the NIST Special Publication
No. 145 [ (Mell & Grance, 2011)], which defines Cloud Computing as:
Cloud computing is a model for enabling ubiquitous, convenient, on-demand network access to a shared pool of
configurable computing resources (e.g., networks, servers,
storage, applications, and services) that can be rapidly provisioned and released with minimal management effort or
service provider interaction.
Three roles exist within cloud computing. Cloud-Providers sell computing or
software services purchased by the End Customer/Consumer. A Cloud-Provider
builds its cloud using products from various Hardware and Software Vendors. See
Section 1.2 (Interested parties of a Cloud Benchmark) for a more detailed
discussion.
The NIST document describes five essential cloud characteristics, three service
models, and four deployment models. We briefly describe these below, based on
the NIST document.
1.1.1 Characteristics
Cloud Computing has five essential characteristics, namely:
1. On-demand self-service, where a consumer can provision compute and storage
capabilities without requiring human intervention from provider.
2. Broad network access, where a consumer can access compute and storage
capabilities over the network.
3. Resource pooling, where a provider groups together resources such as CPU,
memory, disk, and storage to serve multiple consumers.
4. Rapid elasticity, where resources used can be rapidly and in some cases
automatically increased or decreased to handle demand.
5. Measure service, where the service used a consumer is metered.
1 The definition does not mandate the use of virtualization for a Cloud.

O S G C L O U D W G
REPORT TO OSSC 6
1.1.2 Service Models
There are three service models for cloud computing. They affect the definition of a
System Under Test (SUT) for any cloud benchmarks. The following are a brief
description of the service models.
The Service Provider gives the End-Consumer the capability to the provision
processing, storage, network, and basic computing resources. They can also deploy
and run arbitrary operating systems. The End-Consumer does not manage or
control the underlying physical cloud infrastructure, but has control over the
operating system, assigned storage, deployed applications, and limited control of
select networking components (e.g., host firewalls).
The Service Provider gives the End-Consumer the capability to deploy consumer-
created or acquired applications created using programming, languages, libraries,
services, and tools supported by the Service Provider. The Service Provider retains
control and manages the underlying cloud infrastructure, including network,
servers, operating systems, and physical storage. End-Consumer has control over
the deployed applications and configuration settings for the application-hosting
environment.
The Service Provider gives End-Consumer the capability to use the provider’s
applications running on a cloud infrastructure. The applications are accessible from
various client devices through either a thin client interface, such as a web browser
(e.g., web-based email), or a program interface. The Service Provider retains
control and manages the underlying cloud infrastructure, including individual
applications, these application configurations, network, servers, operating systems,
and physical storage. The End-Consumer might have limited control of user-
specific application configuration settings.
1.1.3 Deployment Models
The NIST document defines four deployment models, namely,
The cloud is configured for exclusive use by one or more organizations.
The cloud is configured for use by the general public.
The cloud is a composition of distinct infrastructures in order to retain the
proprietary technology by the consumer.
The cloud is provisioned for exclusive use for a community of consumers.
1.2 Interested parties of a Cloud Benchmark
There are at least three categories interested in the development and use of a cloud
benchmark. Between these three parties exists two relationship types.
Infrastructure as a
Service (IaaS)
Platform as a
Service (PaaS)
Software as a
Service (SaaS)
Private cloud
Public cloud
Hybrid cloud
Community cloud

O S G C L O U D W G
REPORT TO OSSC 7
1.2.1 Participants
The three identified parties are:
build data centers using standard hardware, network, and management software.
Amazon, IBM, HP, VMWare, Microsoft, Oracle and Terremark are examples of
companies that provide public or enterprise IaaS, Paas or SaaS clouds. They will
be interested in publishing the benchmark results of their service offerings. They
would also be interested in the benchmark results of hardware, software or network
vendor products, and how these components support the performance of their
service.
provide the hardware (computers, blades, or servers) and software (virtualization,
management, automation) products used to build the cloud. AMD, HP, Intel, IBM,
VMWare, OpenStack, Oracle, Red Hat, and VMware are examples of companies
that might publish benchmark results for their customers.
cloud customers might use cloud benchmark results to help select a Cloud-
Provider. These are primarily businesses. While there exist several collaboration
and social apps used by individuals, the recommendations in this document will not
address the needs of this community. We restrict our attention to business users of
the cloud.
1.2.2 Cloud Benchmark Audience Types
Based on the above, use of cloud benchmarks fall into two broad categories:
Published by one or more Hardware/Software Vendors and used by Cloud-
Providers to determine the right set of hardware and software products to deploy in
their cloud. Cloud-Providers can also publish results of the hardware and software
components used in their cloud.
Published by Cloud-Providers and used by End-Consumers to determine the
appropriate cloud service provider for their application needs.
D I F F E R E N C E S
A given workload can be tested either in the black-box or white-box context. Each
has differing implications for reporting and comparability, usually addressable by
the Run Rules defined for the released benchmark.
The SUT’s exact engineering specifications is known and under the control of the
tester. The benchmark results allow full comparisons, similar to existing
benchmark results.
Cloud-Providers
Hardware and
Software Vendors
End-Consumers
White Box
benchmark
disclosures
Black Box
benchmark
disclosures
White Box Benchmark

O S G C L O U D W G
REPORT TO OSSC 8
The Cloud-Provider provides a general specification of the SUT, usually in terms
of how the End-Consumer may be billed. For example, an end user of a cloud may
rent a cloud platform under the description of “2 compute units.” The exact
hardware details corresponding to these compute units may not be known. Due to
this vagueness or incompleteness, comparing benchmark results requires additional
information not currently collected or mandated. For example, the benchmark
disclosure may include additional conditions, such as time and place where
measurements were collected, or dynamic changes to the SUT during the collection
period.
1.3 Cloud Computing Use Cases
The OSG Working Group identified general classes of computing and mapped
these to the Research Group’s processing types.
1.3.1 Computing Use Cases
The general class of applications either use cloud computing infrastructure or might
transition all or subsets to cloud computing. See Appendix A for more details on
services and usage of each type.
Users access web servers to exchange messages with others, update information,
view recommendations or endorsements, and otherwise interact with other users,
both in real time and not.
The CloudBench/Olio benchmark currently simulates this collection of web server
activities, and scales by controlling the number of concurrent users.
A group of users share the same view and access into a data set. Access can be
through standard web browsers, custom plug-ins, or proprietary client software.
Private business e-mail servers can be easily moved to outsourced e-mail services.
Some of these companies run on private or public infrastructure clouds. More
sophisticated e-mail services or a portal site will interface with social networking,
calendar services, 3rd
party remote services, user profiling (for targeted ads), and
other non-e-mail things,
Many companies and groups are using the large clusters of hosts to evaluate large
data sets (log files; personal information; user comments on shows, books, or
events; interesting conversations), or extract sophisticated findings from multi-
layered data sets, with complex relationships.
Black Box Benchmark
Social Networking
Collaboration
Mail / Messaging
Data Analytics

O S G C L O U D W G
REPORT TO OSSC 9
This computing category builds on large sets of both structured and unstructured
data for later use by other types.
These non-relational databases can support peta-byte scale data sets, distributed
across hundreds to thousands of machines. They are used where ‘weak consistency
guarantee’ policies suffice. Real-time web applications, document databases,
graph databases, key-value data stores are among some current applications of this
technology.
This long-standing processing type is characterized by high data I/O volumes and
well defined data sets. Both real-time and scheduled processing exist.
A group of machines maintain a coherent and shared data space used by many
other types. It is typically used by multi-layered software, that also have latency
requirements.
High-performance computing (HPC) uses supercomputers and computer clusters
to solve advanced computation problems. This genre of workloads also includes
engineering, simulation, graphics and data applications that run on cluster-based
systems.
Similar to social networking or collaboration, but also maintain time-sensitive
services
An increasing number of consumers access music, books, or videos from various
media distribution companies.
Digital VoIP services are replacing and expanding audio communications for many
consumers and companies. This includes both audio and video transmissions
across the Internet, with stringent latency and computational needs.
1.3.2 Use Case to Customer Map
The following table identifies potential customers. It identifies companies or
industries known to use the Research Group’s processing types. The OSG Working
Group also polled members and other interested parties as to the usefulness or
criticality of a cloud benchmark in this processing category.
Data Warehousing
/ Mining
NoSQL Databases
Business OLTP
Memory Cloud
HPC
On-line Gaming
Streaming
Audio/Video
Voice over IP

O S G C L O U D W G
REPORT TO OSSC 10
Processing
Types Potential Audience
Survey
Score
Social
Networking
LinkedIn, Facebook, Twitter, Yelp,
Googleplus, Groupon, Goodreads,
Netflix (Social net component), Amazon
(Social net component), Workpress
3
Collaboration WebEx Screen sharing, Citrix GoToMeeting,
Skype, Microsoft Live Meeting
Mail / Messaging
Cloud providers, existing Internet Service
providers (AOL, cable operators, internet
portals), E-mail Outsourcing providers, e-mail
filtering services, Mid to large sized
companies.
3.43
Data Analytics Cloud providers, SaaS providers, mobile phone
companies 4.43
Data
Warehousing /
Mining
Cloud providers, 4
NoSQL
Databases
Amazon, Facebook, Twitter, Yahoo, Digg,
Hadoop users 2.44
Business OLTP Business users of databases, enterprises 3.56
Memory Cloud Web Service users,
Social Network users 3
HPC Cloud service providers
On-line Gaming
Game providers,
Cloud providers for games;
Government, military
2.57
Streaming
audio/video
TV networks, Apple TV, Google TV, Internet
Radio, Netflix, iTune, YouTube, Online
Universities
VOIP SPEC SIP customers,
1.3.3 Use Case to Processing Type Map
The following table shows which (Research Group’s) Processing Type is present in
each Cloud Computing Use Case.

O S G C L O U D W G
REPORT TO OSSC 11
Use
C
ase
Soci
al
Net
work
ing
Coll
ab
ora
tion
/ M
essa
gin
g (
IM, T
wee
ts)
Data
An
aly
tics
Data
Ware
hou
sin
g /
Min
ing
NoS
QL
Data
base
s
Bu
sin
ess
OL
TP
Mem
ory
Clo
ud
HP
C
On
-lin
e G
am
ing
Str
eam
ing au
dio
/vid
eo
VO
IP
Process Type
Clo
ud
Data-Intensive / Planned Batch Jobs
Processing Pipelines
Dynamic Websites
Business Processing / OLTP /
Mission Critical applications
Latency Sensitive
Application Extensions / Backends
for Mobile Communications
Bandwidth and Storage Intensive
Mail Applications
Others
1.4 Existing Cloud Frameworks
The Research cloud working group has summarized a list of publicly
available cloud benchmarks.
http://research.spec.org/en/benchmarking-portal/links.html.
The OSG Cloud Working Group presents the following as
some of the better known and available cloud benchmarks.
Benchmark Features Source
YCSB Evaluate performance of key-value based
databases
Measures Elasticity
Yahoo! Research at
http://research.yahoo.com/Web_I
nformation_Management/YCSB

O S G C L O U D W G
REPORT TO OSSC 12
Benchmark Features Source
Cloudstone
/ Olio Workloads: Web 2.0, MySQL, PostgressSQL,
and Memcached
By default, runs against Amazon EC2 but has
instructions on how to set up in other clouds
Berkeley RAD Lab project at
http://radlab.cs.berkeley.edu/wiki/
Projects/Cloudstone
Malstone Distributed, data intensive computing
workload, using synthetic data to determine
infection rates by website to its visitors.
Open Cloud Consortium project
at
http://code.google.com/p/malgen/
Hadoop Several workload types: cpu, map reduce,
machine learning, parallel computation,
distributed file system, and distributed
databases
Used by many 3rd
party benchmarks
No strict Run Rules
Open source project at
http://hadoop.apache.org
Cloud
Harmony Measure performance of black box cloud
deployments using various workloads
Offers comparison of various benchmark
results as a paid service
http://www.CloudHarmony.com
2 Benchmark Considerations
2.1 What is a Cloud SUT?
Defining SUT for a cloud benchmark is challenging due to conflicting goals of
interested parties and different cloud service models. As discussed in earlier
sections, an End-Consumer does not have knowledge of the physical infrastructure
for IaaS, PaaS, or a SaaS service. However, Hardware and Software Vendors are
one of the interested parties in a cloud benchmark. In order for a cloud benchmark
to have any useful meaning for these vendors, the physical infrastructure should
also be part of the results that a cloud benchmark reports. However, mandating the
reporting of physical infrastructure results is problematic, because it will exclude
benchmarking many existing public Cloud-Providers.
The System Under Test (SUT) comprises all components (cloud service, hardware,
software, network connections within the SUT, and support services which are
being tested by the cloud workload or required by the specific benchmark run rules.
It does not include any client(s) or driver(s) necessary to drive the cloud workload
or the network connections between the driver(s) and SUT.

O S G C L O U D W G
REPORT TO OSSC 13
By existing SPEC benchmark convention, the System Under Test (SUT) comprises
all components (cloud service, hardware, software, network connections within the
SUT, and support services which are being tested by the cloud workload or
required by the specific benchmark run rules. It does not include any client(s) or
driver(s) necessary to generate the cloud workload, nor the network connections
between the driver(s) and SUT.
Mandating the disclosure of the physical infrastructure presents many problems due
to the conflicting goals of interested parties and different cloud service models.
Hardware and Software Vendors provide benchmark results to their, the Cloud-
Providers, who derive the most useful meaning through the detailed description of
the physical infrastructure and the corresponding results. However, an End-
Consumer has little to no knowledge of the Cloud-Provider’s physical
infrastructure for IaaS, PaaS, or a SaaS service. Providing such a detailed
description is impossible without a Cloud-Provider’s cooperation. Therefore, a
mandate that reports must include the details of the physical infrastructure is
problematic, because it will exclude benchmarking many existing public Cloud-
Providers.
2.2 SUT Components
The actual set of SUT’s constituent pieces differs based on the relationship between
the SUT and the tester.
The SUT consists of a description of the specific cloud offering used to run the
workload with sufficient detail to meet Full Disclosure Report (FDR)
Requirements as described in Section 2.3 and the specific benchmark's
reproducibility requirements on and instance of the same offering.
The SUT description can be more specific, similar to many existing SPEC
benchmarks. These SUT descriptions consist of:
The host system(s) (including hardware and software) required to support
the Workload and databases.
All network components (hardware and software) between host machines
which are part of the SUT and all network interfaces to the SUT.
Components which provide load balancing within the SUT.
All software that is required to build, deploys, and run the specific
benchmark workload.
Any components which are required to form the physical TCP/IP connections
(commonly known as the NIC, Network Interface Card) from the host system(s) to
the client machines are considered part of the SUT.
A basic configuration consisting of one or more switches between the Driver and
the SUT is not considered part of the SUT. However, if any software/hardware is
used to influence the flow of traffic beyond basic IP routing and switching, it is
considered part of the SUT. For example, when DNS Round Robin is used to
Black Box Cloud
White Box Cloud
Comment 1
Comment 2

O S G C L O U D W G
REPORT TO OSSC 14
implement load balancing, the DNS server is considered part of the SUT and
therefore it must not run on a driver client.
2.3 Full Disclosure Report (FDR) Requirements
For both Black Box and White Box cloud types, the Full Disclosure Report (FDR)
must include a detailed description of the SUT, often referred to as a 'Bill of
Materials' (BOM). The intent of the BOM is to enable a reviewer to confirm that
the tested configuration satisfies the run rule requirements and to document the
components used with sufficient detail to enable a customer to reproduce the tested
configuration and obtain pricing information from the supplying vendors for each
component of the SUT.
The SUT description or BOM must reflect the level of detail a customer would see
on an itemized bill. It should list individual items in the SUT that are not part of a
standard package. For each item, the BOM should include the item's supplier,
description, the item's ID (the code used by the vendor when ordering the item),
and the quantity of that item in the SUT.
For example, a black box SUT for Amazon EC2 may be described as:
Supplier: Amazon
Description: Small vm with 1.7 GB memory
1 EC2 Compute Unit (1 virtual core with 1 EC2 Compute Unit) 160 GB instance storage 32-bit platform
I/O Performance: Moderate Region: US East coast
Zone: portion with region where VM is hosted
https://aws.amazon.com/ec2/instance-types/
ID: API name: m1.small Quantity: 1 (collocation details if the quantity is greater than 1)
Date and time of use:
An example of a White Box description may be similar to the one here:
http://www.spec.org/jEnterprise2010/results/res2011q3/jEnterprise2010-20110727-00023.html#bill_of_materials

O S G C L O U D W G
REPORT TO OSSC 15
Supplier Description Product # Qty
Application Server Oracle Oracle Oracle Oracle Oracle Oracle Oracle
Sun Blade X6270 M2 Base Assembly 3.46GHz Intel 6-Core Xeon X5690 4GB Registered DDR3-1333 DIMM Memory filler panel 300GB - 10K RPM SAS Disk 6Gbps SAS-2 RAID Expansion Module Premier Support for Systems 3 years
X6270-AB X6270-AA-16H3460 4910A 5879A-N RB-SS2CF-300G10K2 SG-SAS6-R-REM-Z Q-PREM-SPRT-SYS
1 2
12 6 4 1 1
Database Server
Oracle Oracle Oracle Oracle Oracle Oracle Oracle Oracle
Sun Blade X6270 M2 Base Assembly 3.46GHz Intel 6-Core Xeon X5690 8GB Registered DDR3-1333 DIMM 2.5in HDD Filler Panel Sun Storage 6180 Array 300 GB - 15000 rpm FC-AL HDD 6Gbps SAS-2 RAID Expansion Module Premier Support for Systems 3 years
X6270-AB X6270-AA-16H3460 4911A 6331A-N TA6180R11A2-O-N TC-FC1CF-300G15K-N SG-SAS6-R-REM-Z Q-PREM-SPRT-SYS
1 2
18 2 2
32 1 1
Blade Server Enclosure Oracle Oracle Oracle Oracle Oracle Oracle
Sun Blade 6000 Modular System Dual 10GbE 10GBE SFP+ PCIe Express Module 10 GigE Dual Rate SFP+ SR Transceiver, MMF 8GB PCI-E Dual FC/GbE Host Adapter EM Power cord, QTY4, AC Input 20A Premier Support for Systems 3 years
A90-D X1110A-Z 2129A SG-XPCIEFCGBE-Q8-N X5074A-Z-N Q-PREM-SPRT-SYS
1 3
6
1
1 1
Oracle Oracle Oracle Oracle Oracle Oracle
Oracle Linux Basic Support for 3 years Oracle Database 11g Enterprise Edition, Per Processor Unlimited Users for 3 years Partitioning, Per Processor Unlimited Users for 3 years Oracle Premium Support for 3 years Oracle WebLogic Server Standard Edition Release 10.3.5 Per Processor for 3 years Oracle Premium Support for 3 years
2 6*
6*
2
6*
1 (* 6 = 0.5 * 12) Explanation: For the purposes of counting the number of processors which require licensing, a multicore chip with 'n' cores shall be determined by multiplying 'n' cores by a factor of 0.5

O S G C L O U D W G
REPORT TO OSSC 16
3 Relevant Cloud Metrics
Metrics are used as the measurement criteria for the tests. The following metrics
have been identified as being the key indicators of performance for most workloads
in a Cloud environment. Note: Due to the breadth of cloud implementations, not all
metrics will be applicable to each benchmark. For instance, if End-Consumer tests
a public cloud, the density and power metrics are typically not measurable.
The key metrics identified are:
Elasticity, which consists of at least the following components
Provisioning Interval
Agility
Scaleup/Down
Elastic speedup
Throughput
Response time
Variability
Other relevant metrics include:
Durability
Reliability
Power
Price
Density
The nature of the cloud makes these metrics, while relevant, difficult to measure in
the context of benchmarking. These metrics also do not represent quantifiable
engineering metrics.
3.1 Elasticity
Elasticity has become a key component and buzz word when talking about cloud
services. The term has become synonymous with how quickly a service can adapt
to the changing needs of the customer. Thus, a highly elastic system can scale to
include newer instances, as well as quickly provision those instances. Based on this,
we define two metrics to characterize the term Elasticity.
The exact definitions of the metrics captured under Elasticity will vary based on the
service model and SUT definition.
Provisioning Interval is defined as the time needed to bring up or drop a resource.
This is the time between initiating the request to bring up a new resource or to
relinquish it, and when the resource is either ready to serve the first request or
when it serves the first request. The state of the new instance will have to be
Provisioning
interval

O S G C L O U D W G
REPORT TO OSSC 17
defined and disclosed by individual benchmarks. For example, the state may
include all the necessary operating system and database server patches. Or state
complies with specialized workload requirements, as in the case of IaaS.
E X A M P L E S O F P R O V I S I O N I N G I N T E R V A L M E T R I C S B Y P L A T F O R M
IaaS The measured time needed to bring up a new instance, or add more
resources (like cpu or storage) to existing instance.
PaaS
The measured time needed to bring up a new instance of an
application server (example: Microsoft Azure, or Java Enterprise),
or to bring up Hadoop datanode and tasktracker servers on the new
cluster nodes (which could be virtual machines).
SaaS
The measured time needed to bring new Application instances on-
line to meet increasing demand (moving from 10000 to 20000
concurrent users).
This metric characterizes the ability to scale the workload and the ability of a
system provisioned to be as close to the needs of the workload as possible.
One way to define this quantity would be as
Where
Cap_min(i) The difference between the minimum capacity needed to
meet the QOS at a given workload level for an interval i.
Cap_prov(i) The recorded capacity provisioned for interval i.
Excess(i) The excess capacity for interval i as determined by
Cap_prov(i) – Cap_min(i), when Cap_prov(i) > Cap_min(i)
and zero otherwise.
Shortage(i) The shortage capacity for interval I is determined by
Cap_min(i) – Cap_prov(i), when Cap_min(i) > Cap_prov(i)
and zero otherwise.
N The total number of data samples collected during the
measurement period
Agility maintained over a period can be defined as
For an ideal system, this number should be as close to zero as possible.
Agility

O S G C L O U D W G
REPORT TO OSSC 18
This is a measurement of the ability to scale up and down while maintaining a
specified QOS. The above definition will not be valid in a context where the QOS
is not met.
Scaleup/down is defined as measurements of the system’s ability to maintain a
consistent unit completion time when solving increasingly larger problems only by
adding a proportional amount of storage and computational resources—i.e., if we
double the resources, can we solve a problem twice as large? [(Toward a Standard
Benchmark for Computer Security Research, 2011)]
S C A L E U P / D O W N E X A M P L E :
1. Create an 8-node (1 master, 8 slaves) Hadoop cluster, and run Terasort .
Measure the Terasort completion time, T8.
2. Create a 16 node (1 master, 16 slaves) Hadoop cluster, and run Terasort.
Measure Terasort completion time, T16.
3. Compare T8 and T16 to determine how Hadoop scales for Terasort
workload.
Elastic Speedup indicates whether adding SUT resources as the workload is
running results in a corresponding decrease in the response time— i.e., if we
double the resources, we can solve the same problem twice as fast? We initiate a
known workload against a given number of servers. As the workload is running,
add one or more servers, and observe the impact on performance. A system that
offers good elasticity should show a performance improvement when the new
servers are added, with a short or non-existent period of disruption while the system
is reconfiguring itself to use the new server(s). (Benchmarking Cloud Serving
Systems with YCSB, 2010)
E L A S T I C S P E E D U P E X A M P L E :
The log files processing workload produces results by processing 100 log files per
second. The Company wants the information faster. So while the original 100
nodes are running, they add another 100 more servers to Hadoop cluster.
1. Create a 100-node hadoop workload, and store log files for one year to the
HDFS.
2. Start running a log files processing workload.
3. At the end of every hour, copy the new log files created during that hour to
the HDFS.
Now, the same log files processing workload is producing results for 200 log files
per second.
Scaleup/Down
Elastic Speedup

O S G C L O U D W G
REPORT TO OSSC 19
3.2 Response Time
The Response Time metric is the same as the traditional response time
measurements used by existing SPEC benchmarks. In the client-server context,
Response Time is the interval between when a request is made by a client or
workload generator and when the response is received by the client.
A benchmark may also have multiple definitions of Response Time, based on
specific scenarios inherent it is domain. For example, a variant response time
definition occurs where the client meters the time taken from when it sends a
request to when it receives a response. Web workloads are prime examples. The
SPECweb2005 benchmark defines one response time as the time taken to return the
entire page. On the other hand, it defines the response time for a large download as
the time to receive the first byte of the file. The time to receive the entire file is
usually measured by another metric, i.e. the throughput.
In each contexts, one determines the response time‘s mean value, and various
percentiles.
In addition to the client-server response time measurement, White Box benchmarks
have the ability to rely on internally measure response times within a SUT as well
as on its external workload generators.
For example, a SOA benchmark tested within a white box environment has direct
control of the servers and hosts locations. If the SOA benchmark measures a
vendor's underlying SOA platform, then one critical aspect is a set of service
clusters located on "separate" machines, as well as on the same machine. Such a
benchmark defines service clusters on the SOA platform, and could measure its
own response time to a request (after some simulated work), as well as send out its
own request downstream to other SOA services.
Black Box benchmarks have no direct knowledge of their servers’ physical
network connectivity. Various geographic distances may separate the hosts, or all
may reside on the same physical hardware within the same data center. The tester
cannot not ensure that the subsequent test set retain the same geographic
relationships. The benchmark needs to address locality and configuration variation
issues.
3.3 Throughput
This metric is the same as the throughput in traditional systems. This refers to the
units of work processed by the system or cloud per unit time. The exact definition
of this metric depends on the workload, and should be defined in that context. We
present the following examples from multiple scenarios, to help guide these
definition needs.
White Box Consideration
Black Box Considerations

O S G C L O U D W G
REPORT TO OSSC 20
This is the number of tasks completed per minute when the Hadoop cluster is at
100 percent utilization processing multiple Hadoop jobs
Throughput is the amount of data
read from the device(s) on a single node or cluster expressed in kilobytes
per second.
or
written to the device(s) on a single node or cluster expressed in kilobytes
per second
E X A M P L E S O F N E T W O R K T H R O U G H P U T :
Total number of
packets received per second
packets transmitted per second
bytes received per second
bytes transmitted per second
SPEC benchmarks Throughput metrics measure the amount of work performed (in
benchmark defined units of tasks or operations) per unit of time over the
measurement period. A benchmark may include a ramp-up and/or a ramp-down
period prior to or after the measurement period. This methodology enables the
throughput measurement during a steady state, and/or synchronizes the
measurement of parallel operations.
E X A M P L E S O F S P E C T H R O U G H P U T M E T R I C S
Benchmark Metrics Description
SPEC CPU2006 SPECrate
SPECint_rate2006,
SPECfp_rate2006
Geometric mean of normalized throughput ratios.
SPECjEnterprise2010
EjOPS
Average number of successful jEnterprise
Operations Per Second completed during the
Measurement Interval.
SPECjbb2005 bops Arithmetic mean of Summed throughputs for all
the points from N warehouses to 2*N inclusive
warehouses
Throughput in the
context of Hadoop
workloads:
Throughput in the
context of
Devices:
Throughput in
SPEC metrics:

O S G C L O U D W G
REPORT TO OSSC 21
Benchmark Metrics Description
SPECjbb2005 bops/JVM Divide the SPECjbb2005 bops metric by the
number of JVM instances
“XXX
SPECsfs2008_nfs.v3 ops
per second with an overall
response time of YYY
ms”
XXX represents the throughput value obtained
from the right-most data point of the throughput
divided by benchmark’s generated response time
curve
YYY represents the overall response time values as
collected by the benchmark reporting tools.
3.4 Variability
Variability measures the repeatability of the test results. Many variables affect the
repeatability and should be factored into defining the values for this metric. Note
that variability also exists in each of the other metrics defined here. For instance,
variability exists in the collected and computed response times, throughput,
provisioning interval, and other metrics.
The variability metric for any parameter should be based on the standard deviation
of the measurement. Variability could be measured against any of the following
parameters: Variability with time or Variability with SUT location. The measured
parameter should be collected in a number of iterations and the standard deviation
or a metric related to standard deviation should be reported.
White Box benchmark testers control both the SUT’s location and additional
processes running on the configuration.
Black Box performance metrics are known to show temporal variability due to
either changes in actual configurations, or the presence of other background load
on the system/systems.
3.5 Durability
Durability is defined as the probability of data loss. Depending upon the context,
this entity could be a requirement on the system and not tested in the duration
period of a normal benchmark run. Note that each benchmark may specify a
different requirement for durability.
3.6 Reliability
Reliability is the ability of a system or component to perform its required functions
under stated conditions for a specified period of time. The reliability of a system is
usually measured by the probability of failures or by the mean time between
failures (MTBF).
White Box SUT
Black Box SUT

O S G C L O U D W G
REPORT TO OSSC 22
MTBF is calculated by dividing the total time measured by the total number of
failures observed. For example, if 15400 units of SCSI hard drives run for 1000
hours and 11 units fail, then
MTBF is a statistical measure. As such, it cannot predict anything for a single unit. An MTBF of 1.4 million hours
doesn't imply that a specific SCCI hard drive will run for 1.4 million hours before failing, only that it is the
average of a 15400 sample set.
3.7 Availability
Availability is the degree to which a system or component is operational and
accessible when required for use. It is often expressed as a probability (or as a
fraction of time) the system is available to service user requests. Example: a
telephone system is 99.9999% (or 6-Nines) available.
The time during which the system is not available is called downtime; the time
during which the system is available is called uptime. A small uptime and a very
small downtime combination may result in a high availability measure – which
could be misleading. Therefore, the mean uptime is also often known as the Mean
Time Between Failures (MTBF), together with Mean Time To Repair (MTTR), and
considered as better indicators for availability. Where
In fault-tolerant systems, this is a combination of Mean Time Between Failures,
Mean Time To Repair.
The exact definition of Availability will be benchmark specific. This metric can be
measured, although it may become impractical to obtain accurate readings in the
case of highly reliable systems.
E X A M P L E S O F A V A I L A B I L I T Y R E Q U I R E M E N T S
Here are some examples of how availability requirements are defined in various
contexts/services.
Classic telephone service examples
US telephone service must continue for 80 hours after losing power.
During this period, any land line will be able to call another land line
telephone subscriber within at least the central office, if not the regional
service area.
Note

O S G C L O U D W G
REPORT TO OSSC 23
US phones must complete a call connection within 10 millisecond or
else indicate a busy circuit
Short message services will usually accept an uploaded SMS within 5
seconds, but do NOT guarantee delivery to recipients outside of their
service. Notification of delayed or non-delivery is not required, unlike
Internet e-mail messages.
Most Internet Service Providers guarantee 99.9% availability to their paying
e-mail customers, but only 95 to 98% for their non-paying customers.
Many e-commerce companies run a private "cloud" for their transaction
database, to ensure 0% data loss, and 100% transaction integrity.
Automated teller machines confirm all account debit transactions are
complete and accurate before dispensing cash. Loss of access to central
servers deactivates affected ATMs.
DARPA's original specification for the Internet required adaptive techniques
to detect and re-route established TCP/IP connections at the network layer
(the application layer is a separate matter). This does not apply to the
underlying UDP layer. Telephone companies switched to private TCP/IP
networks because network equipment makers had better detection and
recovery algorithms, once they switched to a digital encoding (aka
Ethernet).
3.8 Power
The Power measurement is defined as the total watts used by the SUT during the
tests. Guidelines for power measurement are provided in the SPECPower
methodology document.
Note that the power metric is another of the metrics that is not applicable or
measurable in all cases.
A Hardware/Software Vendor or Cloud Vendor has direct access to the SUT, and
can gather power measurements as defined by individual benchmarks.
Power measurements may not be possible since the tester does not know the
individual “computers” actually correspond to a stand-alone machine or a subset of
a larger host. The Cloud-Provider also may not provide access to power meter
measurements, or if one is attached at all.
3.9 Price
We note that while price is an important metric in the context of cloud, this is
somewhat temporal, and is clearly a non-engineering metric that may vary from
customer to customer. The recommended way to incorporate this aspect is to
include the Bill of Materials details as part of a benchmark disclosure. This list of
model numbers, quantities, software and support information may be used by the
benchmark consumer to construct the end price relevant to them. Inclusion of the
exact price details in the benchmark disclosure is not recommended.
White Box SUT
Black Box SUT

O S G C L O U D W G
REPORT TO OSSC 24
3.10 Density
Density measures how many instances of the workload can be run on the SUT
before performance degrades below a specified QOS.
IaaS Density may refer to the number of virtual machines running on a
physical hardware.
PaaS Density may refer to the number of application servers running on a
system.
SaaS Density may refer to the number of users that the system can service.
The Density metric is applicable because the tester directly controls how the
underlying host management system assigns each server to a physical host.
The Density metric is not applicable because the tester does not know if the
individual “computers” actually correspond to a stand-alone machine or a subset of
a larger host.
4 What Makes a Benchmark a Cloud Benchmark?
A Cloud benchmark will quantify the performance and scalability of cloud
computing services. The benchmark's workloads represent the typical set of
applications most likely to run in a cloud environment: business infrastructure (i.e.
mail, OLTP, automated testing), data analytics, and select "software services" such
as database, files.
A cloud benchmark utilizes both existing standards (SPEC and non-SPEC),
as well as adapting others to run within a cloud environment.
A cloud benchmark's primary and subordinate metrics reflect important
considerations such as agility/elasticity, durability, response time,
throughput, reliability, density and variability. Other metrics will be
documented and included as considerations necessary for comparison, but
impractical or too variable to measure. These might include provisioning
interval, durability, reliability, power, and price.
The SUT may run under virtualization conditions or not. It is not considered
a requirement. However, the benchmark's description section attempts to
standardize the computational capacity available to cloud customers, and
facilitate performance comparisons under known conditions.
Workload generation is benchmark specific, but should be done on a
separate set of hardware capable of measuring time reliably and accurately.
Communication between workload generator and SUT for all the client-
server type benchmarks must use TCP/IP or UDP protocol for
communication.
White Box SUT
Black Box SUT

O S G C L O U D W G
REPORT TO OSSC 25
Measurement states correspond to both distinct workloads (simplistic
transaction streams) and major subsections identified by the subcommittee
as relevant.
Benchmark scale may be subsumed as part of the workload factors.
In addition to the usual FDR, a cloud benchmark should include the following
components:
Metrics that include Elasticity. The benchmark should be geared to measure
elasticity and agility.
Benchmark must be capable of running at variable load levels and start and
stop on various physical as well as virtual systems.
Support for Virtualization.
4.1 Cloudizing an Existing Benchmark
As pointed in Section Cloud Benchmark Audience Types1.2.2, a cloud benchmark
may be used in the context of
1. Hardware/Software Vendor to Cloud-provider relationship or
2. Cloud-provider to End-Consumer relationship.
Most publicly available benchmarks run to meet the second category.
Given that any workload that runs on a stand-alone system can also run in the
cloud, most SPEC workloads are potential candidates to be cloudized or “modified
to understand a cloud environment.” In this section, we present general guidelines
for this step.
SPEC benchmark workloads fall into two types:
Throughput Designed to run at different rates with scaling.
Batch jobs Designed to record completion time.
Most workloads that run on regular computer systems can also run on the cloud.
Given this, the existing benchmarks that address various workload areas may intend
to “cloudize” their workloads. The following requirements are to be put in place in
order to make sure that the resultant benchmark is cloud-specific.
SPEC benchmarks do not account for SUTs physically located in other sites. The
benchmark should run from client systems, physically separated from the SUT,
accessing the SUT via a campus or wide area network. The client systems should
be reliable, so the benchmark can make time related measurements. (reference to
Run Rules of various benchmarks)
The SUT defined for the workload must be accessible via network connections.
Characterize
Workload Types
Separate
Locations

O S G C L O U D W G
REPORT TO OSSC 26
Where relevant, the benchmark should consider adding cloud-relevant metrics
including Elasticity and Agility.
Most cloud computing instances allow multiple applications to share computing
resources on a single computer. This means the tester may or may not control all
applications sharing the SUT during a benchmark run.
A Hardware/Software Vendor or Cloud Vendor knows and controls what other
applications run on the SUT.
The End-Consumer does not know or Cloud Vendor chooses to randomly select
machines from the computing cloud. The tester does not know the full application
set sharing the SUT. The benchmark should measure temporal variability in its
metrics. This can be done by running the benchmark at different times of the day to
different times that may be appropriate to measure and characterize the variability
in performance.
The benchmark harness should provide a dynamic load. In the case of batch jobs,
this could mean the ability to add, and configure or delete instances of the test
systems. In the case of throughput oriented workloads, this could refer to an ability
to vary the size of the workload as well as start and stop new instances.
4.2 Cloudize Existing SPEC Benchmarks
The Working Group asked each subcommittee chairperson some questions about
existing workloads and methodology. The following assessments and suggestions
are based on their responses or a review of sample disclosures.
In the table below, we provide some guidelines on the existing SPEC benchmarks,
whose workloads are likely candidates to be extended into the cloud space.
Fact
ors
& A
ctio
ns
Work
load
Typ
e
Sca
lab
le H
arn
ess?
Sca
lab
le W
ork
load
?
Intr
od
uce
Sca
lin
g?
Def
ine
a C
lou
d S
UT
?
Clo
ud
ize
Ben
chm
ark
Met
ric
Ad
d M
etri
c: E
last
icit
y
Ad
d M
etri
c: V
ari
ab
ilit
y
Ad
d M
etri
c:
Pro
vis
ion
ing I
nte
rval
CPU B N/A N/A N
Add Cloud-specific
Metrics
White Box
Black Box
Include Scalable
Workloads
Guidelines for SPEC Benchmarks

O S G C L O U D W G
REPORT TO OSSC 27
JBB 2005 T
JBB 2012 T
JEnterprise T
File Server T
Mail 2001 T
Mail 2009 T
Power ?
SIP T
SOA ?
Web T
Virtualization T
These are the currently known high-level modifications to each benchmark:
OSG
Benchmark Additional Notes
Web Eliminate manual setup steps
Mail Reactivate harness scaling code in Mail2009 harness
CPU
Benchmark needs to run only on a single system
Use a subset of CPU workloads to compare the actual
machine provided in cloud contexts vs. native lab
systems.
Virt TBD
JBB2005 TBD
JEnterprise
Modify Application servers to suit purpose of
elasticity
Make harness automatic
Power N/A
SIP Make harness and workload generators scalable
Include Cloud metrics
4.3 Dos and Don’ts of Benchmarking a Cloud
Here is a list of Do’s and Don’ts to note while creating a cloud benchmark.
Benchmark Changes

O S G C L O U D W G
REPORT TO OSSC 28
Consider the variation in performance due to the background load on the
SUT.
Treat virtualization as a technology behind the cloud and transparent to any
cloud benchmark. But virtualization should not be a requirement.
Vary the intensity of the workload over time, and both up and down in
different cycles) to measure the elasticity.
Report any metric that requires pricing. Instead provide all necessary
metrics for the consumer to compute the total cost (same as other
benchmarks?)
Report a metric that is not observable to the consumer. (Same as other
benchmarks?)
Include any time spent outside the boundary of the SUT (for example in the
Internet) for any latency type metrics. (Same as other benchmarks).
However when testing a Black Box, this will be impossible since the SUT
in the cloud is external to the tester’s benchmark harness and workload
generators. Assume the tester has no visibility into the cloud’s physical
infrastructure.
5 Tools to Measure Cloud Metrics
The OSGCloud team investigated various tools and frameworks that purportedly
tested and measured cloud computing. The following are only some of the tools
found in open source or restricted release forms. The team also hopes to have
canned demonstrations available for viewing.
5.1 AEOLUS (Red Hat)
Aeolus is an Open source project sponsored by Red Hat, designed as framework to
create and manage an on-premise hybrid cloud Infrastructure-as-a-Service (IaaS).
It provides self-service computing resources to users in a managed, governed, and
secure way. You can deploy and manage applications on any type of server -
physical, virtual, and public cloud.
Aeolus is focused on two distinct sets of capabilities related to IaaS:
1. Provide the tools to build and manage hybrid clouds 2. Provide the tools and processes to build, manage and launch applications
that run on hybrid clouds
It integrates with existing products and technologies, including physical servers and
virtualization platforms from other vendors, to provide the easiest on-ramp to an
Do’s
Don’ts

O S G C L O U D W G
REPORT TO OSSC 29
on-premise cloud. Using Aeolus, you can migrate to multiple public cloud
providers, including those running a software stack from a different vendor.
Aeolus delivers automated resource management, automated workflow and policies
to manage a diverse set of business applications in hybrid cloud environments. It
also allows organizations to leverage public clouds for pay-as-you-go utility
computing without creating another silo or losing control of IT security or
governance.
You can manage applications and infrastructure together as one unit, rather than as
separate silos, simplifying the task of ensuring continuous compliance. Thus, all the
infrastructure and applications will stay in sync with established policies at all
times.
http://aeolusproject.org
5.2 BITT (Intel)
Intel® Benchmark Install and Test Tool (Intel® BITT) provides tools to install,
configure, run, and analyze benchmark programs on small test clusters. It is
implemented in python and uses gnuplot to generate performance plots. Intel®
BITT currently runs on Linux and been used on OracleVM, Amazon and various
hardware platforms.
These are the major tools found in Intel® BITT:
Intel® BITT
Component Function/Role
installCli installs tar files on a cluster
monCli monitor performance of the cluster nodes and provides
options to start monitoring, stop monitoring and generate
cpu, disk i/o, memory and network performance plots for
the nodes and cluster.
hadoopCli automates the set up and control of the Hadoop test
environment
Command scripts enable configurable scripts to control monitoring actions.
XML files Sets benchmark configuration properties, including location
of installation, monitoring directories, monitoring sampling
duration, the list of the cluster nodes, and the list of the tar
files that need to be installed.
Templates Allows configurable plot generation
AEOLUS Website

O S G C L O U D W G
REPORT TO OSSC 30
http://software.intel.com/en-us/articles/intel-benchmark-install-and-test-tool-intel-
bitt-tools/
5.3 CloudBench (IBM)
IBM’s CloudBench (CB) is a meta-benchmark framework designed for
Infrastructure-as-a-Service (IaaS) clouds. It automates the execution, provisioning,
data collection, management and other steps within an arbitrary number and types
of individual benchmarks. CB will do the following:
Exercise the provisioned VM’s by submitting requests to applications
(individual benchmarks) that run on the provisioned VMs.
Exercise the operational infrastructure by submitting VM provision/de-
provision requests to the Cloud management platform.
Supports Black Box testing, with some support to embed data collection
nodes inside the SUT to collect metrics usually associated with White Box
tests.
Manages multiple application sets. The default workload generates various
types of workloads, but can be extended to support local custom application
sets.
Measures elasticity components: provisioning time, scaleup, as well as
variability, agility
Currently, not publically available. However once benchmarking activity begins, it
can be released or licensed. Please see Appendix C for a detailed description of the
tool.
BITT Website
CloudBench
Website

O S G C L O U D W G
REPORT TO OSSC 31
6 OSG Cloud Subcommittee
An OSG Cloud subcommittee should be formed to both release Cloud Computing
benchmarks, and work with other SPEC subcommittees when they are ready to
update their benchmarks into Cloud Computing environments.
6.1 Cloud Subcommittee Charter
We propose starting a subcommittee with the following charter:
Establish a common definition and methodology to measure cloud
performance
Some of this exists in the work done by the working group, but we can
continue refining this
Framework for the Cloud Benchmark
White box
Black box
Develop benchmarks using representative cloud workloads not covered by
other OSG groups.
Work with other SPEC sub-committees to add cloud metrics to their
benchmarks.
6.2 Subcommittee specific Issues
We have identified the following topics the Cloud subcommittee needs to address.
Provide an API layer for benchmarks to make a single consistent call to
Cloud-Providers.
How to spin up and down? Not coordinating may lead to harmonic
oscillations.
Are there simpler things we could do?
May want to start a new instance, but not load it.
Which of the characteristics can be addressed with the current benchmarks
during the next iteration period of the benchmark?

O S G C L O U D W G
REPORT TO OSSC 32
Appendix A. OSG Cloud Contributors
The following people in OSGcloud working group actively contributed to this
report.
Dean Chandler and Nurcan Coskun (Intel)
Salman Baset and Erich Nahum (IBM)
Steve Realmuto, Masud Khandker, and Tom Daly (Oracle)
Nicholas Wakou, Indrani Paul, and Louis Barton (Dell)
Mark Wagner (Red Hat)
Rema Hariharan (AMD)
KIT
Yun-seng Chao (Supporting Contributor)

O S G C L O U D W G
REPORT TO OSSC 33
Appendix B. Cloud Computing Use Cases
This section elaborates on the Computing Use Cases in Section 1.3.1.
A typical configuration probably has the following components and behavior:
Recommendation engine
Advertisement servers
Search engine(s)
Chat servers
Conferencing servers
Ratings engines and data sets
Large quantities of data reads and writes of small or moderate size
One or more Memory Cloud(s)
Access to one or more Digital Rights Management services
User Management and Verification
Payment servers (Credit cards, electronic transfers)
A typical configuration probably has the following components and behavior:
Search engine(s)
Chat servers
Conferencing servers
Large quantities of data reads and writes of small or moderate size
One or more Memory Cloud(s)
User Management and Verification
Publicly accessible collaboration services might also use
Recommendation engine
Advertisement servers
Ratings engines and data sets
Payment servers (Credit cards, electronic transfers)
A typical commercial configuration probably has the following components
and behavior:
Run e-mail servers (Exchange, sendmail, open source mail servers)
Anti-abuse/mal-ware processing engines (filters SMTP, SMS, IM, etc)
Social Networking
Collaboration
Mail / Messaging

O S G C L O U D W G
REPORT TO OSSC 34
IMAP4 servers (long-lived connections, some compute intensive
commands)
Large quantities of data reads and writes of varying sizes
User Management and Verification
More sophisticated or free services might also use
Coordination with calendar servers
Advertisement servers
Search engine(s)
This wide category of computing include
Expertise Searches for enhanced search results, and generated by
Editors and authors who generate useful meta-data
Users who generate click-streams and other data
Artificial Intelligence
The Ranking problem
Supervised machine learning
Iteratively retrieve and rank documents or information quanta
Incorporate all available cues: text similarity, classifications,
citations, user behavior and query logs
Process large data sets (Big Data, user profiling, pattern processing)
Extract from logs, transform and load processes
Cluster similar queries together
Extract, normalize, collate citation contexts
Needle in the hay stack searches (SETI)
Clustering
Process N-dimensional data sets to find natural partition clusters, similar
items within and between clusters
Find customer segmentation boundaries or company strategies
Find groups with similar behavior
Find customers with unusual behavior
Search large database of CAD drawings, groups of similar parts,
identify standard parts with each group, and use these standard parts
instead of custom parts
This computing category builds on large sets of both structured and
unstructured data.
Data collection
Data preparation (data factory) – ETL (extract, transform, load) reports
Data Analytics
Data Warehousing
/ Mining

O S G C L O U D W G
REPORT TO OSSC 35
Business intelligence analysis
Ad-hoc queries
These non-relational databases can support peta-byte scale data sets, distributed
across hundreds to thousands of machines. They are used where ‘weak
consistency guarantee’ policies suffice. Real-time web applications, document
databases, graph databases, key-value data stores are among some current
applications of this technology.
This long-standing processing type is characterized by high data I/O volumes
and well defined data sets. Both real-time and scheduled processing exist.
A group of machines maintain a coherent and shared data space used by
Web search databases and queries
Graphs of social network connections
Virtualized Java VMs – multiple Java applications share the same
memory space
Web productivity suites
Leverages NoSQL or key-value pair databases
High Performance Computing
Monte-Carlo simulations
Biological Molecule simulations
DNA sequence analysis
Computational fluid dynamics
Weather and climate simulation
Fraud detection
Similar to social networking or collaboration, but also maintain time-sensitive
services
Game servers
Session servers
Game databases
Player databases of relationships, roles, characters
User Management and Verification
Advertisement servers
NoSQL Databases
Business OLTP
Memory Cloud
HPC
On-line Gaming

O S G C L O U D W G
REPORT TO OSSC 36
Recommendation engine
Payment servers (Credit cards, electronic transfers)
Large quantities of data reads and writes of varying sizes
An increasing number of consumers access music, books, or videos from
various media distribution companies.
Recommendation engine
User Management and Verification
Media retrieval
Media format conversions
Advertisement servers
Payment servers (Credit cards, electronic transfers)
Access to one or more Digital Rights Management services
Large quantities of data reads in fixed sized blocks
Less quantities (but still numerous) uploads and data writes in fixed
sized blocks
Time-sensitive I/O to users
Replacing and expanding audio communications.
Network connections limit determines host count, not cpu, for audio
conversations or conferences.
CPU and network connection limits determine host count for video
conference or personal calls.
Media format conversion servers
User Management and Verification
Bi-directional audio streams of varying sizes
Time sensitive I/O to and from users
Payment servers (Credit cards, electronic transfers)
Usually accompanied by Instant Messaging / Chat
Streaming
Audio/Video
Voice over IP

O S G C L O U D W G
REPORT TO OSSC 37
Appendix C. CloudBench Description
Introduction
CloudBench (CB) is framework that allows automated execution of meta-benchmarks on multiple “Infrastructure as a Service” (IaaS) Clouds. In the context of CB, a meta-benchmark is a composition of an arbitrary number and types of individual benchmarks, arranged with the purpose of exercising both the Cloud’s provisioned VMs and Cloud’s operational infrastructure. Regarding the first Cloud characteristic, the exercising is achieved by the submission of requests to applications (individual benchmarks) that runs on the provisioned VMs. For the second, it is achieved by the submitting of VM provision/de-provision requests to the Cloud management platform (which will in turn direct it to an hypervisor). While the data collection on the performance of benchmarks running on individual VMs on a Cloud is an intrinsic characteristics of any IaaS Cloud (i.e., a “black box” view of Cloud performance is the standard view for public Clouds), collection on some of the specific characteristics of resource usage by a group of VMs on an hypervisor (i.e., a “white box” view) requires special provisions from the Cloud, to allow direct access to the hypervisors. While CB can certainly collect and process both black-box and white-box data, the second type is usually only made available on private Clouds. Still is important to note that even though unable to collect detailed hypervisor resource usage information from public Clouds (e.g., Amazon EC2, Rackspace Cloud Servers), CB can and will collect information pertaining the time to provision a new VM, even in a public Cloud.
The “application performance” capabilities of a Cloud are assessed by determining what is the maximum combined performance achieved by the benchmark set being executed on Virtual Machines (VMs) provisioned on a Cloud This particular set of metrics is of interest primarily for Cloud users or “consumers”. These could, by designing an experiment to match the characteristics of both their own set of internal applications and its access patterns (i.e., application load levels and load variation), have a projection on how adequate, performance-wise or even better price-performance-wise, a particular Cloud would be. This manner, before deciding to move its internal applications to a Cloud, a consumer can assess multiple Cloud providers in a manner that is not only objective and consistent, but also fully automated.

O S G C L O U D W G
REPORT TO OSSC 38
The “operational performance”2 capabilities are relevant first and foremost for Cloud providers. In addition to a particular set of selected benchmarks, a meta-benchmark execution can also include a description of one or more patterns for the arrival and departure of VMs. This manner, the natural flow of new consumers being added to the Cloud (through VM provisioning), and old consumers leaving it (through VM de-provisioning) can be replicated. By combining this continuous motion with the constant benchmark execution on individual VMs, a provider can assess the capabilities of its own infrastructure to quickly incorporate new users while in the face of constant (and eventually, heavy) computing resource use by old users.
From the users perspective, CloudBench can be seen as an “execution engine” for the meta-benchmark scenarios composed by them. The scenarios are assembled by the employment of several abstractions built by CB for this purpose. The first relevant abstraction is designated “Application Instance” (AI). An AI is a set of VMs, logically grouped together in order to execute a specific benchmark. For instance, the “DayTrader” application benchmark, built to simulate a complete online stock trading system (users can login, view their portfolio, lookup stock quotes, and buy or sell stock) is composed by at least three VMs: one executing an automated “load driver” (to simulate users actions), one executing the application server for user action processing (e.g., WebSphere Application Server) and finally one VM executing a database server for results persistency (e.g., DB2). Another relevant example of an AI is the Hadoop application. It is composed by one “master” VM running control processes (e.g., JobTracker, NameNode) and one or more “slave” VMs, running information operation processes (e.g., DataNode, TaskTracker). It is important to note that the concept of an AI is internal to CB. While a Cloud management platform is required to keep track of the state of individual VMs that it provisions, typically there is no information on the dependence and/or association among these. In addition to the actual composition of an AI, CB allows the experimenter to specify a description of the variation of the “load intensity” level to be applied to an AI, in the form of random distributions. It is important to note that actual meaning of the “load intensity” level is entirely AI-specific. For instance, while “level” might refer to the number of simultaneous clients in case of a DayTrader AI, it might refer to the size of the dataset to be “mapped and reduced” in case of a Hadoop AI.
2 From CB’s standpoint, “operations” are VM provisioning/de-provisioning, VM “image capture” and VM migration (the latter two are not yet fully included on the CB).

O S G C L O U D W G
REPORT TO OSSC 39
Figure 1 – Application performance assessment experiment description
The AI is the primary abstraction used to describe scenarios where the application performance capabilities of a Cloud are assessed. A scenario is composed by a collection of AI groups (called simply “scenario” in the CB nomenclature). By adding an execution “time table” for such scenario, a meta-benchmark run is defined. The Figure 1 illustrates it with an example.
A scenario is composed by the specification of multiple AI groups, each with its own load variation characteristics. The variation is expressed by two random distributions, one used by CB for the determination of a specific load intensisty level, and another used for the determination of the duration of a given intensity level. The random distribution is specified by five parameters: distribution type (e.g., normal, exponential, gamma, uniform, etc.), average, standard deviation, maximum and minimum values. For each individual AI in a group, CB applies a different “load intensity” level lasting for a specific “load duration” time. At the end the “load duration” time, new values for both load intensity and load variation are selected from the random distributions. Every individual AI within a group has individual load values selected for it. AIs on a group share the same random distributions, but not the same values. As can be seem in the example, an experimenter can even specify different AI groups with the same benchmark types, but with different load variation parameters.

O S G C L O U D W G
REPORT TO OSSC 40
The second relevant abstraction introduced by CloudBench is the “Application Submitter” (AS). An AS is a process that continuously creates and destroys AIs on a Cloud, simulating the behavior of cloud consumers arriving and leaving. To this end, the AS create new AIs at specific intervals, and assigns a lifetime to each individual AI, periodically destroying those that are being executed for a time longer than its expiration. This abstraction is of primary interest for Cloud providers, as it allows the specification of scenarios with multiple Application Submitters are used to produce consumer population fluctuation while keeping the Cloud resource usage at a desired level. The Figure 2 illustrates a complete experiment for the assessment of the management (provision/de-provision) capabilities of a Cloud.
Figure 2– Runtime performance assessment experiment description
In this case, a scenario is composed by the specification of multiple AS groups, each with its own arrival rate, lifetime and load variation characteristics. Exactly as it is the case for the AIs, the all characteristics here are expressed by random distributions. In the case of arrival rate, a new value is selected from the random distribution after every individual AI creation. Each individual AI within an AS also is assigned its own individual lifetime value. Finally, the load variation characteristics are also

O S G C L O U D W G
REPORT TO OSSC 41
selected from the appropriate random distributions and applied to individual AIs within an AS. AIs generated by an AS share random distributions, but not particular values for any of its parameters. For illustrative purposes, the values of maximum and minimum for each distribution were omitted in the description of the second experiment, but they are exactly the same (i.e., average, standard deviation, maximum and minimum) enumerated during the description of runtime performance assessment experiments.
It is important to note that the use of random distributions, while highly desirable due to its capability of capturing the behavior of real Clouds through modeling, does not give any predictability in terms of monotonicity on the specified characteristics of an AI or an AS. For instance, using a random distribution for load intensity level provides no guarantees that a particular AI will experience constantly growing intensity. In case predictable growth or shrinkage of load is more important than random variation, any AI or AS characteristic can be also specified as a arithmetic or geometric progression, assuring monotonic variation on such characteristic.
Once designed, a scenario has to be translated to CloudBench’s meta-benchmark language description. This language is based on two primitive directives – “attach” and “detach” – that represents the activation or de-activation of actual objects (e.g., VMs, through the “vmattach” and “vmdetach” directives) or CB abstractions (e.g., “aiattach”, “asdetach”) during the meta-benchmark’s lifecycle. This language is processed by a frontend, which runs a Command Line Interface (CLI) that allow CB users to interactively follows the progress of a meta-benchmark. An execution trace is normally stored on text file containing a sequence of directives. The use of text files allows quick re-execution if necessary, even in an automated fashion. Illustrative examples for the experiments displayed on Figure 1 and Figure 2 follows:
Experiment 1
cldattach ec2 AMAZ /*attaches a new Cloud called “AMAZ” using the EC2 API*/
vmcattach AMAZ us-east-1 /* All VMs will be created on EC2’s “us-east-1”
aiattach AMAZ daytrader normal,50,10,95,5 uniform,X,X,20min,10min
/* this command is repeated 18 times, since we want do define the instances individually */
aiattach AMAZ daytrader exponential,10,X,30,10 gamma,1h,0.8h,3h,0.5h
/* repeat 23 times */
aiattach AMAZ hadoop uniform,X,X,30,20 normal,40min,10min,80min,5min
/* repeat 10 times */
aiattach AMAZ coremark gamma,50000,100,80000,1000 uniform,X,X,8min,5min
/* repeat 5 times */
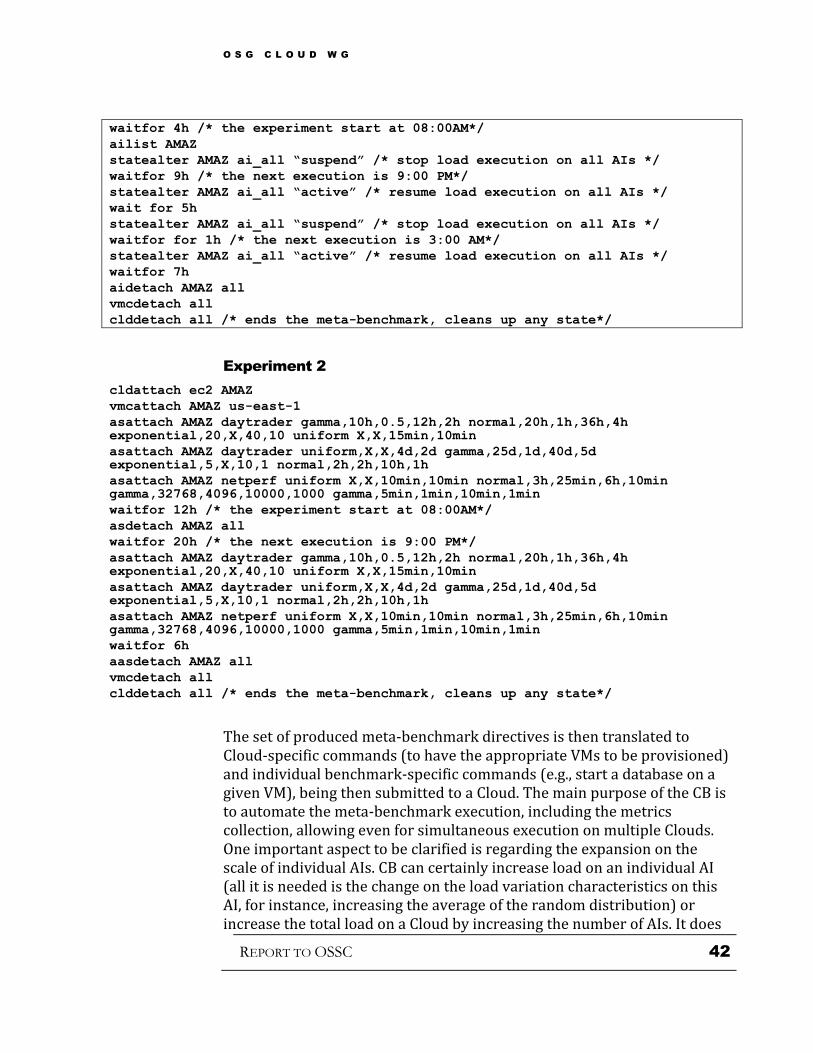
O S G C L O U D W G
REPORT TO OSSC 42
waitfor 4h /* the experiment start at 08:00AM*/
ailist AMAZ
statealter AMAZ ai_all “suspend” /* stop load execution on all AIs */
waitfor 9h /* the next execution is 9:00 PM*/
statealter AMAZ ai_all “active” /* resume load execution on all AIs */
wait for 5h
statealter AMAZ ai_all “suspend” /* stop load execution on all AIs */
waitfor for 1h /* the next execution is 3:00 AM*/
statealter AMAZ ai_all “active” /* resume load execution on all AIs */
waitfor 7h
aidetach AMAZ all
vmcdetach all
clddetach all /* ends the meta-benchmark, cleans up any state*/
Experiment 2
cldattach ec2 AMAZ
vmcattach AMAZ us-east-1
asattach AMAZ daytrader gamma,10h,0.5,12h,2h normal,20h,1h,36h,4h exponential,20,X,40,10 uniform X,X,15min,10min
asattach AMAZ daytrader uniform,X,X,4d,2d gamma,25d,1d,40d,5d exponential,5,X,10,1 normal,2h,2h,10h,1h
asattach AMAZ netperf uniform X,X,10min,10min normal,3h,25min,6h,10min gamma,32768,4096,10000,1000 gamma,5min,1min,10min,1min
waitfor 12h /* the experiment start at 08:00AM*/
asdetach AMAZ all
waitfor 20h /* the next execution is 9:00 PM*/
asattach AMAZ daytrader gamma,10h,0.5,12h,2h normal,20h,1h,36h,4h exponential,20,X,40,10 uniform X,X,15min,10min
asattach AMAZ daytrader uniform,X,X,4d,2d gamma,25d,1d,40d,5d exponential,5,X,10,1 normal,2h,2h,10h,1h
asattach AMAZ netperf uniform X,X,10min,10min normal,3h,25min,6h,10min gamma,32768,4096,10000,1000 gamma,5min,1min,10min,1min
waitfor 6h
aasdetach AMAZ all
vmcdetach all
clddetach all /* ends the meta-benchmark, cleans up any state*/
The set of produced meta-benchmark directives is then translated to Cloud-specific commands (to have the appropriate VMs to be provisioned) and individual benchmark-specific commands (e.g., start a database on a given VM), being then submitted to a Cloud. The main purpose of the CB is to automate the meta-benchmark execution, including the metrics collection, allowing even for simultaneous execution on multiple Clouds. One important aspect to be clarified is regarding the expansion on the scale of individual AIs. CB can certainly increase load on an individual AI (all it is needed is the change on the load variation characteristics on this AI, for instance, increasing the average of the random distribution) or increase the total load on a Cloud by increasing the number of AIs. It does

O S G C L O U D W G
REPORT TO OSSC 43
not have the ability, however, to increase the number of VMs (i.e., the “size”) of an individual AI. The “scale-out” of an AI is an operation that is very application-benchmark specific, and therefore has no directly mapped uniform directive on CloudBench. For instance, while “scale-out” is an almost trivial operation for a Hadoop-type AI (all that is needed is the increase in the number of “slave VMs”) it would require significant configuration changes for a DayTrader-type AI (e.g., clustering, load-balance configuration changes). The Figure 3 displays the usual execution flow for CB.
Figure 3 – CloudBench’s meta-benchmark execution flow.
While the Cloud maintains the state of provisioned VMs, the state of each AI and AS has to be maintained by CB itself. To this end, CloudBench manages its own Object Store (OS), which contains all the relevant information pertaining an experiment’s execution lifecycle. Information about each created AS and AI, the AI’s lifetimes, the random distributions associated to each AI and AS, the list of VMs that needs to be provisioned by a new AI of a given type, are all registered on the OS. Being an entity completely separated from the CloudBench frontend CLI, the OS allows asynchronous changes to an experiment to be submitted from multiple sources (i.e., multiple CLIs can connect to the same OS), to dynamically and adaptively change an experiment during its execution. The OS is
Cloud
User
1
Meta-
benchmark
CloudBench
Host
Amazon EC2
RackSpace
CloudServers
(OpenStack)
IBM SmartCloud
Enterprise
Meta-
benchmark
Meta-
benchmark
Meta-
benchmark
CloudBench
HostCloud
User
N
Cloud
Admin
Meta-
benchmarkCloudBench
Host
Cloud
management
platform
Meta-benchmark Designed
CloudBench CLI
Cloud-Specific Operations
Performance/Status Monitor

O S G C L O U D W G
REPORT TO OSSC 44
implemented as an in-memory key-value store (in the current implementation, Redis is used, but other stores, as Memcached or Voldemort would be equally suitable). This particular form of implementation for the OS was selected by its scalability (key-value stores can be easily and quickly horizontally scaled), its high write performance (10s of thousands of inserts per seconds even on desktop computers) and its ease to initial setup. It is important to note that the use of an in-memory store is possible mostly because there is no need for persistency on this data. While the state of each AI and AS is important during the experiment’s execution, it does not need to be kept after it finishes.
Given the fact that CB is also in charge of performance data collection, a second data store, designated Metric Store (MS) is also managed in the same way of the OS. The details of the performance metrics collection will be made explicit on the next section, but for now suffices to say that the requirements for it, specially in terms of write performance are even more stringent than the ones required by the OS. For this reason, the MS is also implemented as an in-memory key-value store. Contrary to the OS however, the MS do needs persistence of the information stored there, since such information is the main outcome of an experiment executed by CloudBench. This requirement is fulfilled by the existence of one or more “performance reporters”, processes that reads data from the MS and writes it to individual comma separated values (csv) files for latter analysis and processing. This manner, the performance data can be submitted to MS is a manner that is both scalable and flexible, while this same data can be stored asynchronously.
As can be seen in the Figure 4, CloudBench’s architecture is inherently distributed. The creation of a new AI triggers the spawning of a short-lived “application instance creator” process on the CloudBench host (the same machine that executes the frontend CLI), which will be in charge of the VM creation and automatic application startup. After that, however, each AI has a VM selected as a “driver”, which will act as a manager to this AI, selecting load intensity levels and load duration through the “Load Manager” (LM) process and collecting performance data through the “Performance Collector” process. Both processes will run on the “driver” VM throughout the AI’s entire lifecycle. In addition to that, each AS has a long running “application submitter daemon” associated to it. This daemon is kept running on the CloudBench host, continuously creating new AIs at selected intervals (the inter-AI arrival time) and destroying “expired” ones.

O S G C L O U D W G
REPORT TO OSSC 45
Figure 4 – CloudBench’s multi-process architecture description.
How does CloudBench collect performance data?
The two different aspects of Cloud performance explored by CloudBench have very distinct collection mechanisms. For the operational performance, the relevant performance data pieces are simply the time intervals between two successive events. During the provisioning of a new VM, CB will record the time between the VM creation request and the actual VM start, the time between the VM start and VM establishment of the VM’s network connectivity and finally the time to start an individual component application on a VM (e.g., time to start a database or web server on a given VM). All these metrics, being fixed during the VM’s lifecycle (they happen only once) are in fact stored by CB on the Object Store, instead of the Metric Store. Nevertheless, they are also read by the same performance reporter previously described and also stored on a (separate) csv file.
The performance metrics collection for the application performance is somewhat more elaborated. As previously explained, each individual AI has a VM elected as its “driver” (co-located on the Cloud with the other VMs on an AI). This VM will run a “Performance Collector” process, which will receive performance data from all VMs belonging to this same AI. This data is then processed (only the data format is changed) and is written,
Cloudbench Host
Application
Instance
Submiter
Performance
ReporterCloudBench
Comand
Processor
Object Store
Server
Object Store
Log Store
Server
Log Store
Metric Store
Server
Metric
Store
Cloud Infrastructure
VMC 3
VMC 5
VMC 4
LOST
Application
Instance
VMC 2
VMC 1
DayTrader
Application
Instance
VM LD
(iwlengine)
VM WAS
VM DB2
VM LD
(jmeter)
VM
Apache
VM
MySQL
Cloud management platform
Application
Instance Creator
(Transient)
Cloud-specifc
Provisioning
Request/Responses
Load Manager
Performance
Collector
Performance data
from VMs on
the AI
(and VMCs,
if possible)
through Ganglia
Load
to the AI

O S G C L O U D W G
REPORT TO OSSC 46
without any summarization, on the MS. Asynchronously, the performance reporter reads the data from it and writes it to a csv file.
Figure 5 – Runtime performance data collection flow.
The runtime metrics collection requires two components: collectors and a transport framework. Although these components are theoretically orthogonal, in practice there is great synergy in the leverage of an integrated solution. In the case of CloudBench, the Ganglia framework is used. Ganglia’s architecture has two types of processes: a ganglia monitor (gmond) that can trigger the collection an then the sending of the performance data and ganglia meta daemon (gmetad) which aggregates data from multiple gmond processes (running on multiple VMs). The performance information is exchanged through an XML data representation, transported (typically) over UDP. Ganglia has native collectors for VM Operating System metrics, like CPU, Memory, Network and Disk I/O (the data collected is very similar to what would be obtained by utilities like ps, mem, sar, netstat and iostat). In addition to that, a special utility (called “gmetric”) is provided to allow any arbitrary value to be inserted on the same transport data stream used be the native collectors. In case of CloudBench, this utility is used to report application-specific metrics (e.g., Application servers Performance Management Infrastructure queries or SQL queries to a database) back to the VM in
Cloudbench Host
Cloud
Application
Instance
VM Driver
VM "role 1"
(e.g. WAS)
VM "role 2"
(e.g. DB2"
Performance
Reporter
Metric Store
Server
Metric
Store
Performance
Collector
Ganglia
Monitor
(gmond)
Ganglia
Monitor
(gmond)
Ganglia
Monitor
(gmond)
Ganglia
Meta
(gmetad)
VM Driver
Performance
CollectorGanglia
Monitor
(gmond)
Ganglia
Meta
(gmetad)
0
Guest OS metrics from all VMs on the AI
Application specific metrics from each VM on the AII
1
Aggregate
data
polled
3
Put data
points
4
Get data
points
2
Processed
data
O S G C L O U D W G
REPORT TO OSSC 47
charge of concentrating all data. The Figure 5 presents the runtime performance data collection flow.
The “Performance Collector” continuously reads (in fact, pulls) performance data from the gmetad concentrator (both running on the “driver” VM) and writes it to the Metric Store. While Ganglia is used here mainly for its ease of use and maturity, there is nothing unique to it that prevents other frameworks from being employed with the same effect. Frameworks like OpenTSDB or Collectd could be used in the very same way that Ganglia is. From the CloudBench perspective, all that is required is the delivery of performance metrics to a “driver” VM, where they could be properly read by the “Performance Collector” process and written to the MS.
How does CloudBench incorporate new benchmarks and
workloads?
During an AI creation, CloudBench obtains a list of VMs with specific “roles”, being each “role” associated with a set of actions to be automatically performed. For instance, a VM with a “role” DB2 requires a database instance of this type to be automatically started there. Therefore a script that executes the startup of this application has to be provided for CloudBench. While CB will automatically transfer the script to the appropriate VM, execute it, react appropriately according to the execution results (e.g., re-trying if the script signals failure), the actual script is highly application (and even VM Operating System) dependent, and has to be provided by the owner of the benchmark being added. A similar case is to be made for the actual benchmark process. A new benchmark also requires an appropriate execution script that can then be automatically executed by CloudBench. Typically, such script should take as parameters the load intensity and the load duration. This second is optional, since CloudBench can be programmatically instructed to unconditionally kill a benchmark process instance with a given load level before starting a new one.
The requirements for a new benchmark can be summarized as follows: for each VM application that composes an AI, supply a start/re-start script, and supply also a benchmark execution script.
CloudBench Instantiation on Amazon EC2
In order to deploy CB on a public Cloud like Amazon EC2, it is highly recommended that all CloudBench architectural components are co-located within the same Cloud. This manner the CB Host, housing the CLI processor, the AS daemons (and the associated short-lived AI creation processes) and performance reporter process, can have direct network

O S G C L O U D W G
REPORT TO OSSC 48
access to the VMs belonging to the newly created AIs. This access is of importance during the creation of new AIs: the “application instance creator” process requires a very brief SSH access to the AI’s VMs at the beginning of its lifecycle, in order to startup every application component of a given benchmark before actual load can be applied to it.
Given the fact that each individual AI’s “driver VM” requires constant access to both the Object and Metric Stores throughout its whole lifecycle (for the performing of “load management” and performance collection activities), there is a clear benefit for CB’s function in the placement of such components in close proximity with the AIs, with the lowest possible network access latency.
Collocating all three CB components on a single VM on the same public Cloud has two additional advantages, in addition to remote connection performance. The first is the ease of deployment, since there is no need for security configuration changes on the local network (as there would be in the case CB components are not co-located in the same Cloud) to allow the VMs to reach the Object Store and Metric Store (again, with a much higher latency anyway). The second advantage is on the potential cost savings. While public Clouds normally charge for data traffic that crosses the boundary of its premises, they do not have the same restriction for traffic between co-located VMs.
The CloudBench code is fairly self-contained – a single directory contains all python modules required for its operation – with a few third-party python modules that could also be easily installed on a newly instantiated VM on EC2. In addition to that, the fact that both the Object Store and Metric Store use the same key-value store (Redis) makes the deployment of these on a newly created VM fairly simple. Alternatively there is always the possibility of the use of an already configured “CloudBench template VM”, available on EC2.
Metrics
The mapping between each specific metric collected by CloudBench during the
execution of a meta-benchmark and its role in the assessment of specific Cloud
characteristics is the following:
Used in the assessment of “application performance” characteristic of a Cloud,
this metric is sent, by the supplied “execution script”, after every execution of
an individual benchmark on an AI (an “execution” represents the running of an
individual benchmark with a given load intensity level, for a given load level
duration)
Very similar to Throughput.
Throughput:
Response Time:

O S G C L O U D W G
REPORT TO OSSC 49
Used in the assessment of “operational performance” characteristic of a Cloud,
this metric is collected by the CloudBench Host, during the creation of a new
AI. The time to create a new AI is broken down in specific sub-components,
like the time between the VMs’ creation request and the VM’s starting, and the
time to have the applications on the VM started.
Also used in the assessment of “operational performance”. Given the fact that
CB does not have provisions to increase the “size” of AI (i.e., the number of
VMs that composes an AI) automatically, the only metric collected here - time
to create a new AI - is exactly the same as previous one.
All metrics are collected and stored on flat csv files for later analysis. From
there, parameters like average, standard deviation (and thus coefficient of
variation) can be quickly extracted.
How is CloudBench different from SPECvirt?
A “SPECvirt Tile” seems to be the equivalent of a single CB scenario, with a fixed number of AIs. In this sense CB is more flexible given the fact that a scenario is composed by any number of different AIs, each with its own load variation characteristics. The key differences are that CB:
Contributes VM life cycles Number of VMs can be varied in any way we want
Elasticity:
Agility:

O S G C L O U D W G
REPORT TO OSSC 50
Appendix D. Bibliography
Cooper, B. F., Silberstein, A., Tam, E., Ramakrishnan, R., & Sears, R. (2010).
Benchmarking Cloud Serving Systems with YCSB. Santa Clara, CA, USA:
Yahoo! Research.
Dumitras, T., & Shou, D. (2011). Toward a Standard Benchmark for Computer
Security Research. Carnegie Mellon University.
Mell, P., & Grance, T. (2011, Sept). NIST CSRC Special Publications.
Retrieved from NIST Computer Security Division: Computer Security
Resource Center: http://csrc.nist.gov/publications/nistpubs/800-145/SP800-
145.pdf