special focus 1 - world bankpubdocs.worldbank.org/en/752761493655512338/global-economic...global...
TRANSCRIPT
Debt Dynamics in Emerging Market and Developing Economies: Time to Act?
SPECIAL FOCUS 1


SPECIAL FOCUS 1 GLOBAL ECONOMIC PROSPECTS | JUNE 2017 49
Introduction
As growth becomes more durable and inflation rates get closer to central banks’ targets, monetary policy in advanced economies is expected to normalize. While this normalization is likely to proceed smoothly, there is a possibility that it could stir financial market volatility with adverse implications for EMDEs (Arteta et al. 2015). In many EMDEs, both public and private sector vulnerability to financing cost spikes has risen since the global financial crisis.
Government debt dynamics in EMDEs have deteriorated since the global financial crisis(Huidrom, Kose, and Ohnsorge 2016; World Bank 2015a). On average across EMDEs, government debt has risen by 12 percentage points of GDP since 2007 to 47 percent of GDP by 2016, and fiscal deficits have widened to about 5 percent of GDP in 2016 from a surplus of roughly 1 percent of GDP in 2007 (Figure SF1.1). At end-2016, government debt exceeded its 2007 level by more than 10 percentage points of GDP in more than half of EMDEs. In addition, the fiscal balance worsened from 2007 levels by more than 5 percentage points of GDP in one-third of EMDEs.
Benign financing conditions have contributed to shifts in the composition of government balance sheets, but not always to strengthen its resilience (Kose et al., forthcoming). In the median EMDE,
for example, the share of short-term components of debt securities held by nonresidents has been smaller since 2007. However, the share of nonresident-held debt itself has risen and the maturity of government debt has been on a
Debt Dynamics in Emerging Market and Developing
Economies: Time to Act?
Since the global financial crisis, rising private sector debt and deteriorating government debt dynamics have made some
emerging market and developing economies (EMDEs) more vulnerable to financing shocks. Specifically, at end-2016, government debt exceeded its 2007 level by more than 10 percentage points of GDP in more than half of EMDEs and the
fiscal balance worsened from its 2007 level by more than 5 percentage points of GDP in one-third of EMDEs. Although
many EMDEs have strengthened their monetary policy frameworks and accumulated significant reserve buffers over the past two decades, they now need to shore up their fiscal positions to prevent sudden spikes in financing cost from forcing them into
fiscal tightening.
Note: 8is Special Focus was prepared by M. Ayhan Kose, Franziska Ohnsorge, and Naotaka Sugawara.
FIGURE SF1.1 Evolution of fiscal space in EMDEs
In many EMDEs, both government and private sector debt has risen
sharply since the global financial crisis. During periods of severe financial
stress, private sector debt can burden public balance sheets.
B. Overall fiscal balance, by EMDE
region
A. Overall fiscal balance and
government gross debt in EMDEs
Sources: International Monetary Fund, World Bank.
A.-C. GDP-weighted averages.
A.C. The year of global recession (2009) is shaded in gray.
B. EAP, ECA, LAC, MNA, SAR, and SSA stand for, respectively, East Asia and Pacific, Europe
and Central Asia, Latin America and the Caribbean, Middle East and North Africa, South Asia, and Sub-Saharan Africa.
D. The year of the onset of banking crises is in parentheses. Bars show average general government
gross debt-to-GDP ratios in the two years before and the two years after the onset of crises.
D. Government gross debt in selected
banking crises in EMDEs
C. Credit to the private sector in
EMDEs

SPECIAL FOCUS 1 GLOBAL ECONOMIC PROSPECTS | JUNE 2017 50
Long-term government debt dynamics depend on debt and deficits but also on the macroeconomic context, especially the paths of GDP growth and interest rates. This Special Focus examines the evolution of EMDE fiscal positions since the global financial crisis as well as during typical episodes of financial stress. To do so, it combines fiscal indicators and macroeconomic factors into a single measure of government debt dynamics: the fiscal sustainability gap, defined as the difference between the actual fiscal balance and the debt-stabilizing fiscal balance.1 Specifically, this Special Focus addresses the following questions:
• How have fiscal positions in EMDEs evolved since the global financial crisis?
• How do fiscal positions typically evolve during episodes of financial stress?
Evolution of fiscal positions
Definitions. A simple summary metric of the evolution of government debt dynamics is the fiscal sustainability gap (Blanchard 1993; Buiter 1985; Cottarelli and Escolano 2014; Escolano 2010). The fiscal sustainability gap compares a country’s actual fiscal balance with its debt-stabilizing balance. The debt-stabilizing balance captures the long-term, cumulative impact of sustained fiscal deficits on debt stocks under assumed macroeconomic and financial conditions. For example, the debt burden generated by sustained fiscal deficits will be easier to service if interest rates are lower and growth (and, hence, the potential for tax revenue raising) is stronger.
Specifically, the sustainability gap (pbsusgap) for country c in year t is defined (in Kose et al., forthcoming) as:
where p is the primary balance (in percent of GDP), i is the nominal interest rate, γ the
FIGURE SF1.2 Debt relief under the HIPC and MDRI
initiatives
Debt relief from both multilateral and bilateral creditors has helped
significantly reduce debt in recipient countries.
B. Total HIPC and MDRI debt relief by
multilateral creditors as of 2015
A. Government and external debt
in HIPC
Sources: IMF (2016a), International Monetary Fund, World Bank.
Note: There are a total of 36 Heavily Indebted Poor Countries (HIPC) that have reached completion
points as of April 2017: 5 from Latin America and the Caribbean (LAC), 1 from South Asia (SAR), and 30 from Sub-Saharan Africa (SSA).
A. GDP-weighted average general government gross debt and external debt in 36 HIPC. The year of global recession (2009) is shaded in gray.
B. Blue bars refer to median, red lines to interquartile range. Both HIPC assistance committed (under
the assumption of full participation of creditors) and MDRI (multilateral debt relief initiative) delivered by multilateral creditors as of end-August 2015 are included. GDP data are for 2015.
declining path. The share of government debt in foreign currency has increased in the median EMDE since the late 2000s.
In addition, private sector debt in EMDEs has risen sharply since 2007, reflecting a combination of financial deepening and credit booms. Since 2007, domestic bank credit to the private sector has risen by 12 percentage points of GDP to 52 percent of GDP in 2016 (excluding China) and by more than 20 percentage points of GDP in one-fifth of EMDEs. Firm-level data also suggest that the corporate sector has become more financially fragile since the global financial crisis as solvency positions weakened (Alfaro et al. 2017). During episodes of severe financial stress, private sector debt may become a contingent liability for the public sector. For example, before 2008, some EMDEs suffered systemic banking crises that required governments to provide substantial financial support. Though typically not fully reflected in deficits, such outlays significantly increased public debt above and beyond increases attributable to an accumulation of fiscal imbalances (Laeven and Valencia 2013). As these experiences show, the fiscal space implicit in low debt levels can shrink rapidly during periods of elevated financial stress.
1The analysis in this Special Focus is based on a new database on fiscal space, which includes a wide range of indicators of fiscal space for a large number of countries over the period of 1990-2016 (Kose
et al., forthcoming).
,

SPECIAL FOCUS 1 GLOBAL ECONOMIC PROSPECTS | JUNE 2017 51
nominal GDP growth, and d* the target debt ratio (in percent of GDP) defined as the country-specific historical median ratio. The interest rate and nominal GDP growth are evaluated at their fixed long-term averages.2 Implicitly, this assumes that future trends will not deviate materially from their long-term averages and that the historical median debt level is an appropriate reference point for future sustainable debt levels. This approach yields similar results to that of a common bench-mark: the median debt ratio across all EMDEs over 1990-2016 (about 45 percent of GDP). A positive gap indicates a primary balance that would, over time, diminish government debt below its historical median, if sustained. Con-versely, a negative gap shows a primary balance that would increase the stock of debt above its historical median.3 These sustainability gaps are calculated for 72 EMDEs for 1990-2016.4
Evolution. Since 2000, debt sustainability in EMDEs has steadily improved as debt stocks declined and deficits narrowed or turned into surpluses. Among low-income countries, this partly reflected major debt relief initiatives such as the Highly Indebted Poor Countries (HIPC) initiative and the Multilateral Debt Relief Initiative (MDRI). The largest beneficiaries of these initiatives were EMDEs in Sub-Saharan Africa (SSA) and Latin America and the Caribbean (LAC) (Figure SF1.2; IMF 2016a). Between the HIPC decision and completion dates, government debt in recipient countries fell by up to 150 percentage points of GDP.
Following a steady pre-crisis improvement, government debt dynamics have deteriorated sharply since the global financial crisis (Figure
SF1.3). In EMDEs, debt-reducing fiscal positions (i.e., positive sustainability gaps of, on average, almost 2 percent of GDP) in 2007 turned into debt-increasing fiscal positions (i.e., negative gaps of more than 2 percent of GDP, on average) by 2016. In the two-thirds of EMDEs that are commodity-exporting, this deterioration partly reflected the sharp growth slowdown that accompanied the steep post-crisis slide in commodity prices. In commodity-importing EMDEs, fiscal positions remain weak as a result of fiscal stimulus implemented during the global financial crisis, chronic primary deficits, and, in some EMDEs, anemic post-crisis growth.
By 2016, fiscal positions in most EMDEs set government debt on clearly rising trajectories. Negative sustainability gaps exceeded 1 percent of GDP in roughly 80 percent of commodity-
FIGURE SF1.3 Evolution of sustainability gaps
In EMDEs, fiscal sustainability has deteriorated materially from pre-crisis
averages. The deterioration was largest among commodity-exporting
EMDEs.
B. Fiscal balance, growth, and
sustainability gap in EMDEs A. Sustainability gap
D. Sustainability gap, by
commodity exporter status
C. Share of EMDEs with sizable
negative sustainability gap
Sources: International Monetary Fund, World Bank.
Note: A sustainability gap is defined as the difference between the actual fiscal balance
and the debt-stabilizing balance. The year of global recession (2009) is shaded in gray.
A.B.D. GDP-weighted averages.
B. Figure shows overall fiscal balance.
C. Share of EMDEs with negative sustainability gaps of 1 percent of GDP or more. Sample includes 72 EMDEs, consisting of 44 commodity-exporting economies and 28 commodity-importing
economies.
D. Samples include 44 commodity-exporting EMDEs and 28 commodity-importing EMDEs.
2This assumption implies that variations over time in the sustainability gap are only attributable to changes in debt and deficits. It also implies that sharp exchange rate swings do not affect the
benchmark stock of debt, although they affect fiscal balances through higher interest cost. 3Depending on country specifics, some countries may be able to support debt above historical medians (i.e., run negative sustainability gaps) for extended periods of time, whereas financial markets may
force others to reduce debt below its historical median (i.e., run positive sustainability gaps). 4Sustainability can also be defined as the difference between the level of government debt and the debt limit, defined as the value at which debt becomes unsustainable (Ostry et al. 2010). The existing
literature employs different analytical frameworks to examine fiscal sustainability (e.g., Bohn 1998; Kose et al., forthcoming).
SPECIAL FOCUS 1 GLOBAL ECONOMIC PROSPECTS | JUNE 2017 52
exporting EMDEs and in about 40 percent of commodity-importing EMDEs. In more than 70 percent of EMDEs, debt dynamics had worsened materially (i.e., sustainability gaps had deteriora-ted by more than 1 percentage point of GDP) from 2007. In principle, temporary negative sustainability gaps that are quickly reversed would be of limited concern; however, sustainability gaps and fiscal deficits in EMDEs have worsened steadily since 2012. That said, in 27 percent of EMDEs, debt dynamics in 2016 were still more favorable than in 2000, when a period of steady improvement began that lasted until the global financial crisis.
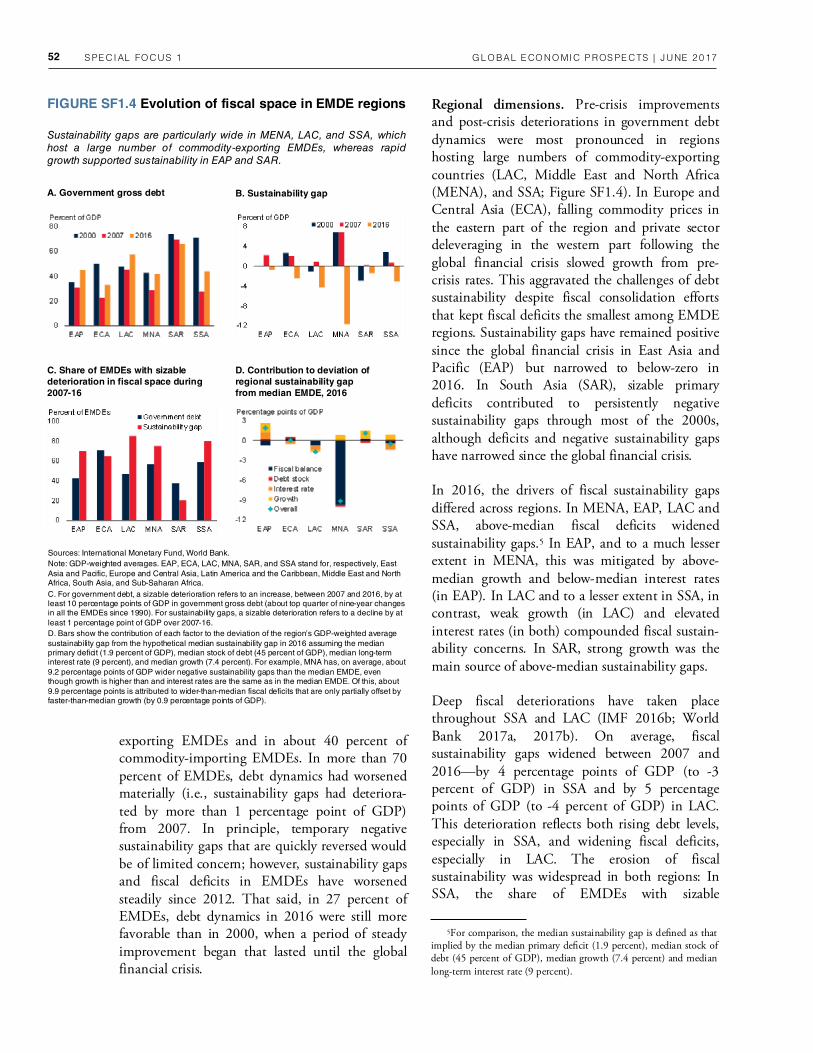
Regional dimensions. Pre-crisis improvements and post-crisis deteriorations in government debt dynamics were most pronounced in regions hosting large numbers of commodity-exporting countries (LAC, Middle East and North Africa (MENA), and SSA; Figure SF1.4). In Europe and Central Asia (ECA), falling commodity prices in the eastern part of the region and private sector deleveraging in the western part following the global financial crisis slowed growth from pre-crisis rates. This aggravated the challenges of debt sustainability despite fiscal consolidation efforts that kept fiscal deficits the smallest among EMDE regions. Sustainability gaps have remained positive since the global financial crisis in East Asia and Pacific (EAP) but narrowed to below-zero in 2016. In South Asia (SAR), sizable primary deficits contributed to persistently negative sustainability gaps through most of the 2000s, although deficits and negative sustainability gaps have narrowed since the global financial crisis.
In 2016, the drivers of fiscal sustainability gaps differed across regions. In MENA, EAP, LAC and SSA, above-median fiscal deficits widened sustainability gaps.5 In EAP, and to a much lesser extent in MENA, this was mitigated by above-median growth and below-median interest rates (in EAP). In LAC and to a lesser extent in SSA, in contrast, weak growth (in LAC) and elevated interest rates (in both) compounded fiscal sustain-ability concerns. In SAR, strong growth was the main source of above-median sustainability gaps.
Deep fiscal deteriorations have taken place throughout SSA and LAC (IMF 2016b; World Bank 2017a, 2017b). On average, fiscal sustainability gaps widened between 2007 and 2016—by 4 percentage points of GDP (to -3 percent of GDP) in SSA and by 5 percentage points of GDP (to -4 percent of GDP) in LAC. This deterioration reflects both rising debt levels, especially in SSA, and widening fiscal deficits, especially in LAC. The erosion of fiscal sustainability was widespread in both regions: In SSA, the share of EMDEs with sizable
5For comparison, the median sustainability gap is deEned as that implied by the median primary deEcit (1.9 percent), median stock of debt (45 percent of GDP), median growth (7.4 percent) and median
long-term interest rate (9 percent).
FIGURE SF1.4 Evolution of fiscal space in EMDE regions
Sustainability gaps are particularly wide in MENA, LAC, and SSA, which
host a large number of commodity-exporting EMDEs, whereas rapid
growth supported sustainability in EAP and SAR.
B. Sustainability gap A. Government gross debt
D. Contribution to deviation of
regional sustainability gap
from median EMDE, 2016
C. Share of EMDEs with sizable
deterioration in fiscal space during
2007-16
Sources: International Monetary Fund, World Bank.
Note: GDP-weighted averages. EAP, ECA, LAC, MNA, SAR, and SSA stand for, respectively, East
Asia and Pacific, Europe and Central Asia, Latin America and the Caribbean, Middle East and North Africa, South Asia, and Sub-Saharan Africa.
C. For government debt, a sizable deterioration refers to an increase, between 2007 and 2016, by at least 10 percentage points of GDP in government gross debt (about top quarter of nine-year changes in all the EMDEs since 1990). For sustainability gaps, a sizable deterioration refers to a decline by at
least 1 percentage point of GDP over 2007-16.
D. Bars show the contribution of each factor to the deviation of the region’s GDP-weighted average
sustainability gap from the hypothetical median sustainability gap in 2016 assuming the median primary deficit (1.9 percent of GDP), median stock of debt (45 percent of GDP), median long-term interest rate (9 percent), and median growth (7.4 percent). For example, MNA has, on average, about
9.2 percentage points of GDP wider negative sustainability gaps than the median EMDE, even though growth is higher than and interest rates are the same as in the median EMDE. Of this, about
9.9 percentage points is attributed to wider-than-median fiscal deficits that are only partially offset by faster-than-median growth (by 0.9 percentage points of GDP).
SPECIAL FOCUS 1 GLOBAL ECONOMIC PROSPECTS | JUNE 2017 53
deterioration in sustainability gaps (i.e., worsened by 1 percentage point of GDP or more) over 2007-16 was 80 percent; in LAC, 85 percent of economies in the region experienced sizable deteriorations over the same period. In both regions, improvements in government debt dynamics that occurred in the early 2000s were unwound by 2016.
Weakening government debt dynamics in those regions were also accompanied by a rapid increase in private sector debt, although from modest initial levels, reflecting a combination of financial deepening and credit booms (World Bank 2016). In 2016, private credit by domestic banks averaged 48 percent of GDP in LAC and 29 percent of GDP in SSA. In one-third of EMDEs in SSA and more than one-quarter of EMDEs in LAC, private sector credit rose by more than 10 percentage points of GDP between 2007 and 2016.
Fiscal positions in episodes of financial stress
The deterioration in government debt dynamics since the global financial crisis is considerably more persistent than after previous episodes of financial stress. For EMDE commodity exporters, such episodes of financial stress can also be associated with terms-of-trade shocks. EMDEs typically emerge within two years of such episodes with restored government debt dynamics. After adverse terms-of-trade shocks, a deterioration in government debt dynamics is typically rapidly reversed.
Financial stress episodes. To analyze the evolution of fiscal debt sustainability around financial stress events since 1990, 117 episodes are identified in 94 EMDEs for which data on government debt, fiscal balance, sustainability gaps, and private sector credit are available (Gourinchas and Obstfeld 2012; Laeven and Valencia 2013). Figure SF1.5 presents the evolution of debt sustainability around these stress episodes, including banking, currency and debt crises, and compares these events against recent developments.
In the run-up to and during these stress episodes, debt dynamics typically deteriorated somewhat as fiscal balances and sustainability gaps weakened, government debt increased, in part because of support to banking systems (Tagkalakis 2013), and (often) exchange rate depreciation raised the local currency value of government debt. However, within two years of financial stress episodes, fiscal debt sustainability improved and debt returned to a stable path. This improvement may have partly reflected debt restructuring and the loss of access to financing that forces governments to rein in spending or raise revenues.
Oil price plunges. Some of the sharpest post-crisis deteriorations in fiscal positions have been among
FIGURE SF1.5 Debt dynamics around financial stress
events and in 2016
Within two years of financial stress episodes in EMDEs, government debt
typically returns to a stable path.
B. Government gross debt A. Sustainability gap
D. Credit to the private sector C. Overall fiscal balance
Sources: International Monetary Fund, World Bank.
Note: Year t refers to the year of onset of financial stress episodes. The solid blue lines are simple
averages for all episodes, while the dashed blue lines show the interquartile range. The red line is shown for reference and based on all EMDEs, although it is not a stress episode. Financial stress
episodes are taken from Gourinchas and Obstfeld (2012) and Laeven and Valencia (2013). When consecutive events are identified within a five-year period in a country, the one associated with the lowest real GDP growth is used.
A.-C. Separately, the statistical significance of restored government debt dynamics in two and three years after financial stress events, from deteriorations during stress events, is confirmed in a linear
regression of each fiscal indicator on dummy variables for financial stress events (with up to three lags and leads), with country- and year-fixed effects.
C. Samples are restricted to episodes where data on sustainability gaps are available.

SPECIAL FOCUS 1 GLOBAL ECONOMIC PROSPECTS | JUNE 2017 54
collapses in global oil prices (in 1991, 1998, 2001, 2008, and 2014), as identified in World Bank (2015b).6
Fiscal positions deteriorated sharply during past oil price plunges but subsequently rebounded as a result of a pro-cyclical fiscal tightening. Initially debt-reducing fiscal positions (i.e., positive sustainability gaps of 3 percent of GDP) in the year before the average oil price plunge turned into debt-increasing fiscal positions (i.e., negative sustainability gaps of 1 percent of GDP), on average, in the year following the plunge as resource revenues declined. Within two years after the oil price plunge, however, sustainability gaps and fiscal balances were restored close to their pre-plunge levels. After a steep increase in the wake of the oil price plunge, government debt returned to a stable path. Depending on country circumstances and the depth of the growth slowdown triggered by the oil price plunge, private credit may rise (Miyajima 2017) or decline (Barajas et al. 2010). On average, a small increase in private credit in the year following the oil price plunge is mostly reversed in the subsequent years.
Comparison of current fiscal positions with historical experience. In 2016, despite lower government debt levels on average, government debt dynamics compared unfavorably with those on the eve of typical financial stress episodes and oil price plunges. At -3.5 percent of GDP, sustainability gaps in 2016 were weaker than those prior to the average financial stress episode (although still within the range of such episodes). This mainly reflected the rapid deterioration in fiscal balances in commodity-exporting EMDEs.
Notwithstanding weaker fiscal positions, non-fiscal buffers have strengthened in EMDEs over the 2000s. Monetary policy frameworks have improved. A growing share (more than one-
FIGURE SF1.6 Debt dynamics in EMDE oil exporters
around oil price plunges
Oil price plunges are historically accompanied by deteriorating fiscal debt
sustainability in oil exporters, reflecting shrinking oil revenues, and weaker
growth, but fiscal positions recover quickly after the initial shock.
B. Government gross debt A. Sustainability gap
D. Credit to the private sector C. Overall fiscal balance
Sources: International Monetary Fund, World Bank.
Note: Year t refers to the year of oil price plunges. Past oil price plunges include collapses in global oil
prices in 1991, 1998, 2001, and 2008 (World Bank 2015b). Simple averages of 36 EMDE oil exporters in all episodes. The red lines are for the latest plunge starting in 2014.
C. Samples are restricted to episodes where data on sustainability gaps are available.
6The most recent oil price decline resembles that of 1985-86. The 1985-86 oil price slump was also associated with changing supply conditions, as OPEC reverted to its production target of 30 million
barrels per day despite rising unconventional oil supply from the North Sea and Mexico (World Bank 2015b). Prices dropped 60 percent from January to July 1986, ringing in two decades of low oil prices—in contrast with other similarly sharp oil price drops that were quickly reversed.
energy exporters. Energy-exporting EMDEs rely heavily on fiscal revenues from the resource sector. For example, in 2014, on the eve of the most recent plunge in oil prices, hydrocarbon revenues accounted for more than half of fiscal revenues in Angola, Algeria, Azerbaijan, Iraq, Kuwait, Nigeria, Saudi Arabia, and the United Arab Emirates, and more than one-quarter of revenues in Mexico, the Islamic Republic of Iran, Kazakhstan, and the Russian Federation. The subsequent plunge in oil prices has forced some energy-exporting economies into severe fiscal adjustment and reserve losses (Danforth, Medas, and Salins 2016). Fiscal positions have deterio-rated sharply in energy-exporting EMDEs, but less sharply than in earlier episodes of oil price plunges, albeit from a weaker starting position. Figure SF1.6 illustrates fiscal developments in energy-exporting EMDEs during the five major
SPECIAL FOCUS 1 GLOBAL ECONOMIC PROSPECTS | JUNE 2017 55
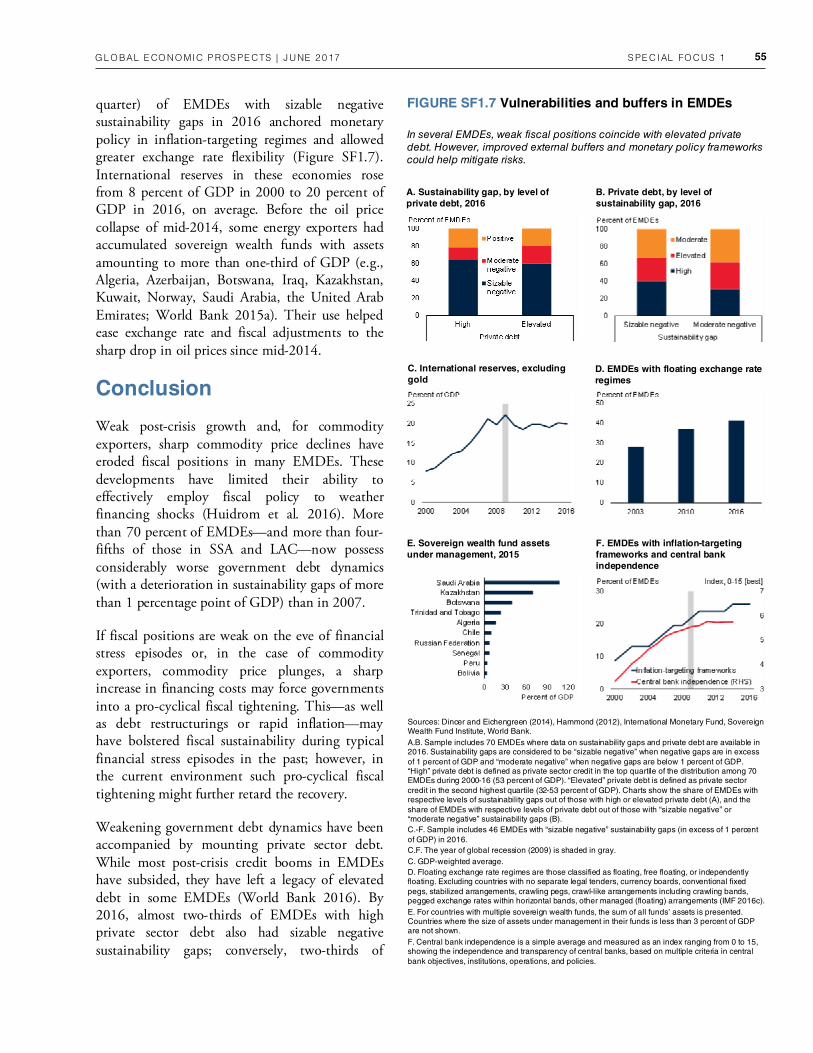
quarter) of EMDEs with sizable negative sustainability gaps in 2016 anchored monetary policy in inflation-targeting regimes and allowed greater exchange rate flexibility (Figure SF1.7). International reserves in these economies rose from 8 percent of GDP in 2000 to 20 percent of GDP in 2016, on average. Before the oil price collapse of mid-2014, some energy exporters had accumulated sovereign wealth funds with assets amounting to more than one-third of GDP (e.g., Algeria, Azerbaijan, Botswana, Iraq, Kazakhstan, Kuwait, Norway, Saudi Arabia, the United Arab Emirates; World Bank 2015a). Their use helped ease exchange rate and fiscal adjustments to the sharp drop in oil prices since mid-2014.
Conclusion
Weak post-crisis growth and, for commodity exporters, sharp commodity price declines have eroded fiscal positions in many EMDEs. These developments have limited their ability to effectively employ fiscal policy to weather financing shocks (Huidrom et al. 2016). More than 70 percent of EMDEs—and more than four-fifths of those in SSA and LAC—now possess considerably worse government debt dynamics (with a deterioration in sustainability gaps of more than 1 percentage point of GDP) than in 2007.
If fiscal positions are weak on the eve of financial stress episodes or, in the case of commodity exporters, commodity price plunges, a sharp increase in financing costs may force governments into a pro-cyclical fiscal tightening. This—as well as debt restructurings or rapid inflation—may have bolstered fiscal sustainability during typical financial stress episodes in the past; however, in the current environment such pro-cyclical fiscal tightening might further retard the recovery.
Weakening government debt dynamics have been accompanied by mounting private sector debt. While most post-crisis credit booms in EMDEs have subsided, they have left a legacy of elevated debt in some EMDEs (World Bank 2016). By 2016, almost two-thirds of EMDEs with high private sector debt also had sizable negative sustainability gaps; conversely, two-thirds of
FIGURE SF1.7 Vulnerabilities and buffers in EMDEs
In several EMDEs, weak fiscal positions coincide with elevated private
debt. However, improved external buffers and monetary policy frameworks
could help mitigate risks.
B. Private debt, by level of
sustainability gap, 2016
A. Sustainability gap, by level of
private debt, 2016
D. EMDEs with floating exchange rate
regimes
C. International reserves, excluding
gold
Sources: Dincer and Eichengreen (2014), Hammond (2012), International Monetary Fund, Sovereign Wealth Fund Institute, World Bank.
A.B. Sample includes 70 EMDEs where data on sustainability gaps and private debt are available in 2016. Sustainability gaps are considered to be “sizable negative” when negative gaps are in excess
of 1 percent of GDP and “moderate negative” when negative gaps are below 1 percent of GDP. “High” private debt is defined as private sector credit in the top quartile of the distribution among 70 EMDEs during 2000-16 (53 percent of GDP). “Elevated” private debt is defined as private sector
credit in the second highest quartile (32-53 percent of GDP). Charts show the share of EMDEs with respective levels of sustainability gaps out of those with high or elevated private debt (A), and the
share of EMDEs with respective levels of private debt out of those with “sizable negative” or “moderate negative” sustainability gaps (B).
C.-F. Sample includes 46 EMDEs with “sizable negative” sustainability gaps (in excess of 1 percent
of GDP) in 2016.
C.F. The year of global recession (2009) is shaded in gray.
C. GDP-weighted average.
D. Floating exchange rate regimes are those classified as floating, free floating, or independently floating. Excluding countries with no separate legal tenders, currency boards, conventional fixed
pegs, stabilized arrangements, crawling pegs, crawl-like arrangements including crawling bands, pegged exchange rates within horizontal bands, other managed (floating) arrangements (IMF 2016c).
E. For countries with multiple sovereign wealth funds, the sum of all funds’ assets is presented. Countries where the size of assets under management in their funds is less than 3 percent of GDP are not shown.
F. Central bank independence is a simple average and measured as an index ranging from 0 to 15, showing the independence and transparency of central banks, based on multiple criteria in central
bank objectives, institutions, operations, and policies.
F. EMDEs with inflation-targeting
frameworks and central bank
independence
E. Sovereign wealth fund assets
under management, 2015

SPECIAL FOCUS 1 GLOBAL ECONOMIC PROSPECTS | JUNE 2017 56
EMDEs with sizable negative sustainability gaps had above-median private debt. In these countries, bouts of financial stress could curtail both private and public sector activity, with weaknesses in both amplifying each other.
While monetary policy normalization in major advanced economies will, in all likelihood, proceed smoothly, there remains a risk of episodes of financial market volatility. These episodes could be accompanied by sharp increases in financing cost for EMDEs. Against this backdrop, the simultaneous weakening of government and private sector balance sheets underscores the need to shore up fiscal positions.
In the short term, while global financial conditions remain benign, measures to strengthen the resilience of government balance sheets can be prioritized. In particular, some EMDE governments with ample market access can take advantage of still-low borrowing costs to lengthen the maturity profile of their debt or shift its currency composition toward domestic currency (World Bank 2015a). Such immediate steps can be complemented with broader public debt management reform measures. Depending on country circumstances, these range from better coordination between debt management, cash management and fiscal policy to legislation and regulation to streamline responsibilities and improved recording and reporting systems (World Bank 2007).
Several measures are also available to shore up fiscal sustainability directly. In many commodity importers, where growth has generally been robust since the global financial crisis, unexpected revenue windfalls can be set aside to reduce fiscal deficits and debt. Across EMDEs, structural reforms can be implemented that support fiscal credibility and generate long-term fiscal gains with limited short-term growth impact (e.g., pension reforms).
Across EMDEs, revenue collection efforts can be enhanced to raise spending envelopes. Such revenue measures could include broadening tax bases to remove loopholes for higher-income households or profitable corporates. In addition, a
reallocation of expenditures away from less efficient expenditures (often subsidies) towards more growth-enhancing or better-targeted ones (such as public spending or means-tested income support) can be considered. In low-income countries, strong revenue bases and improvements in spending efficiency are essential to finance investment needed to achieve their development goals (Baum et al. 2017).
In addition to fiscal positions, improved policy frameworks and reserve buffers can mitigate the impact of terms of trade shocks (Adler, Magud, and Werner 2017). A growing number of EMDEs employ inflation targeting and allow greater exchange rate flexibility to absorb shocks. On average, reserve buffers have strengthened significantly and allowed, especially, energy-exporting EMDEs to soften the adjustment to prospects of lower commodity prices.
References
Adler, G., N. E. Magud, and A. Werner. 2017. “Terms-of-Trade Cycles and External Adjustment.” Working Paper 17/29, International Monetary Fund, Washington, DC.
Alfaro, L., G. Asis, A. Chari, and U. Panizza. 2017. “Lessons Unlearned? Corporate Debt in Emerging Markets.” NBER Working Paper 23407, National Bureau of Economic Research, Cambridge.
Arteta, C., M. A. Kose, F. Ohnsorge, and M. Stocker. 2015. “The Coming U.S. Interest Rate Tightening Cycle: Smooth Sailing or Stormy Waters?” Policy Research Note 2, World Bank, Washington, DC.
Barajas, A., R. Chami, R. Espinoza, and H. Hesse. 2010. “Recent Credit Stagnation in the MENA Region: What to Expect? What can be Done?” IMF Working Paper 10/219, International Monetary Fund, Washington, DC.
Baum, A., A. Hodge, A. Mineshima, M. Moreno Badia, and R. Tapsoba. 2017. “Can They Do It All? Fiscal Space in Low-Income Countries.” IMF

SPECIAL FOCUS 1 GLOBAL ECONOMIC PROSPECTS | JUNE 2017 57
and Developing Economies.” World Bank Policy Research Working Paper 7725, World Bank, Washington, DC.
Huidrom, R., M. A. Kose, J. J. Lim, and F. L. Ohnsorge. 2016. “Do Fiscal Multipliers Depend on Fiscal Positions?” World Bank Policy Research Working Paper 7724, World Bank, Washington, DC.
IMF (International Monetary Fund). 2016a. “Heavily Indebted Poor Countries (HIPC) Initiative and Multilateral Debt Relief Initiative (MDRI)—Statistical Update.” A report prepared by IMF and World Bank staff, International Monetary Fund, Washington, DC.
________. 2016b. Regional Economic Outlook: Western Hemisphere—Managing Transitions and Risks. April. Washington, DC: International Monetary Fund.
________. 2016c. Annual Report on Exchange Rate Arrangements and Exchange Restrictions 2016. Washington, DC: International Monetary Fund.
Kose, M. A, S. Kurlat, F. Ohnsorge, and N. Sugawara. Forthcoming. “A Cross-Country Database of Fiscal Space.” World Bank Policy Research Working Paper, World Bank, Washington, DC.
Laeven, L., and F. Valencia. 2013. “Systemic Banking Crises Database.” IMF Economic Review 61 (2): 225–270.
Miyajima, K. 2017. “What Influences Bank Lending in Saudi Arabia?” IMF Working Paper 17/31, International Monetary Fund, Washington, DC.
Ostry, J. D., A. R. Ghosh, J. I. Kim, and M. S. Qureshi. 2010. “Fiscal Space.” IMF Staff Position Note 10/11, International Monetary Fund, Washington, DC.
Tagkalakis, A. 2013. “The Effects of Financial Crisis on Fiscal Positions.” European Journal of Political Economy 29 (March): 197–213.
Working Paper 17/110, International Monetary Fund, Washington, DC.
Blanchard, O. J. 1993. “Suggestions for a New Set of Fiscal Indicators.” In The Political Economy of Government Debt, edited by H. A. A. Verbon and F. A. A. M. van Winden, 307–325. New York: North-Holland.
Bohn, H. 1998. “The Behavior of U.S. Public Debt and Deficits.” The Quarterly Journal of Economics 113 (3): 949–963.
Buiter, W. H. 1985. “A Guide to Public Sector Debt and Deficits.” Economic Policy 1 (1): 13–79.
Cottarelli, C., and J. Escolano. 2014. “Debt Dynamics and Fiscal Sustainability.” In Post-crisis Fiscal Policy, edited by C. Cottarelli, P. R. Gerson, and A. S. Senhadji, 31–47. Cambridge: MIT Press.
Danforth, J., P. Medas, and V. Salins. 2016. “Fiscal Policy: How to Adjust to a Large Fall in Commodity Prices.” IMF How to Notes 1, International Monetary Fund, Washington, DC.
Dincer, N. N., and B. Eichengreen. 2014. “Central Bank Transparency and Independence: Updates and New Measures.” International Journal of Central Banking 10 (1): 189–253.
Escolano, J. 2010. “A Practical Guide to Public Debt Dynamics, Fiscal Sustainability, and Cyclical Adjustment of Budgetary Aggregates.” IMF Tech-nical Notes and Manuals 10/02, International Monetary Fund, Washington, DC.
Gourinchas, P.-O., and M. Obstfeld. 2012. “Stories of the Twentieth Century for the Twenty-First.” American Economic Journal: Macroeconomics 4 (1): 226–265.
Hammond, G. 2012. “State of the Art of Inflation Targeting – 2012.” Centre for Central Banking Studies Handbook 29, Bank of England, London.
Huidrom, R., M. A. Kose, and F. L. Ohnsorge. 2016. “Challenges of Fiscal Policy in Emerging

SPECIAL FOCUS 1 GLOBAL ECONOMIC PROSPECTS | JUNE 2017 58
World Bank. 2007. Managing Public Debt: From Diagnostics to Reform Implementation. Washington, DC: World Bank.
________. 2015a. Global Economic Prospects: Having Fiscal Space and Using It. January. Washington, DC: World Bank.
________. 2015b. Global Economic Prospects: The Global Economy in Transition. June. Washington, DC: World Bank.
________. 2016. Global Economic Prospects: Divergences and Risks. June. Washington, DC: World Bank.
________. 2017a. Africa’s Pulse. April. Washington, DC: World Bank.
________. 2017b. Leaning against the Wind: Fiscal Policy in Latin America and the Caribbean in a Historical Perspective. April. Washington, DC: World Bank.