special issue: peptoids part 1
TRANSCRIPT
Special Issue: Peptoids – Part 1 Guest Editors: Kent Kirshenbaum (New York University, U.S.A.) and Ronald N. Zuckermann (Lawrence Berkeley National
Laboratory, U.S.A.) EDITORIAL Peptoids in Wonderland Kent Kirshenbaum and Ronald N. Zuckermann, Biopolymers 2019, doi: 10.1002/bip.23279 REVIEW Design and preparation of organic nanomaterials using self-assembled peptoids Alessia Battigelli, Biopolymers 2019, doi: 10.1002/bip.23265 FULL PAPERS Dual-responsive pegylated polypeptoids with tunable cloud point temperatures Xiaohui Fu, Jiliang Tian, Zheng Li, Jing Sun and Zhibo Li, Biopolymers 2019, doi: 10.1002/bip.23243 Solid-phase synthesis of three-armed star-shaped peptoids and their hierarchical self-assembly Haibao Jin, Tengyue Jian, Yan-Huai Ding, Yulin Chen, Peng Mu, Lei Wang and Chun-Long Chen, Biopolymers 2019, doi: 10.1002/bip.23258 Polymerization rate difference of N-alkyl glycine NCAs: Steric hindrance or not? Tianwen Bai and Jun Ling, Biopolymers 2019, doi: 10.1002/bip.23261 Linking two worlds in polymer chemistry: The influence of block uniformity and dispersity in amphiphilic block copolypeptoids on their self-assembly Niklas Gangloff, Marcel Höferth, Vladimir Stepanenko, Benedikt Sochor, Bernhard Schummer, Joachim Nickel, Heike Walles, Randolf Hanke, Frank Würthner, Ronald N. Zuckermann and Robert Luxenhofer, Biopolymers 2019, doi: 10.1002/bip.23259 Peptoids advance multidisciplinary research and undergraduate education in parallel: Sequence effects on conformation and lipid interactions Christian J. Jimenez, Jiacheng Tan, Kalli M. Dowell, Gillian E. Gadbois, Cameron A. Read, Nicole Burgess, Jesus E. Cervantes, Shannon Chan, Anmol Jandaur, Tara Karanik, Jaenic J. Lee, Mikaela C. Ley, Molly McGeehan, Ann McMonigal, Kira L. Palazzo, Samantha A. Parker, Andre Payman, Maritza Soria, Lauren Verheyden, Vivian T. Vo, Jennifer Yin, Anna L. Calkins, Amelia A. Fuller and Grace Y. Stokes, Biopolymers 2019, doi: 10.1002/bip.23256 Phosphoramitoids—A submonomer approach to sequence defined N-substituted phosphoramidate polymers Thomas Horn, Michael D. Connolly and Ronald N. Zuckermann, Biopolymers 2019, doi: 10.1002/bip.23268 Solution effects on the self-association of a water-soluble peptoid Amelia A. Fuller, Jonathan Huber, Christian J. Jimenez, Kalli M. Dowell, Samuel Hough, Alberto Ortega, Kyra N. McComas, Jeffrey Kunkel and Prashanth Asuri, Biopolymers 2019, doi: 10.1002/bip.23248

Special Issue: Peptoids – Part 1 Guest Editors: Kent Kirshenbaum (New York University, U.S.A.) and Ronald N. Zuckermann (Lawrence Berkeley National
Laboratory, U.S.A.) A facile on-bead method for fully symmetric tetra-substituted DOTA derivatizations using peptoid moieties Vineeta Rustagi and D. Gomika Udugamasooriya, Biopolymers 2019, doi: 10.1002/bip.23249 Macrocyclization enhances affinity of chemokine-binding peptoids Kevin Brahm, Julia S. Wack, Stefanie Eckes, Victoria Engemann and Katja Schmitz, Biopolymers 2019, doi: 10.1002/bip.23244

Special Issue: Peptoids – Part 2 Guest Editors: Kent Kirshenbaum (New York University, U.S.A.) and Ronald N. Zuckermann (Lawrence Berkeley National
Laboratory, U.S.A.) EDITORIAL Molecular folding science Kent Kirshenbaum and Ronald N. Zuckermann, Biopolymers 2019, doi: 10.1002/bip.23314 REVIEWS Peptoids as tools and sensors Adrian S. Culf, Biopolymers 2019, doi: 10.1002/bip.23285 Peptoid drug discovery and optimization via surface X-ray scattering Konstantin Andreev, Michael W. Martynowycz and David Gidalevitz, Biopolymers 2019, doi: 10.1002/bip.23274 Polypeptoids synthesis based on Ugi reaction: Advances and perspectives Yue Tao, Zhen Wang and Youhua Tao, Biopolymers 2019, doi: 10.1002/bip.23288 FULL PAPERS NCα‐gem‐dimethylated peptoid side chains: A novel approach for structural control and peptide sequence mimetics Radhe Shyam, Lionel Nauton, Gaetano Angelici, Olivier Roy, Claude Taillefumier and Sophie Faure, Biopolymers 2019, doi: 10.1002/bip.23273 Unconstrained peptoid tetramer exhibits a predominant conformation in aqueous solution Leah T. Roe, Jeffrey G. Pelton, John R. Edison, Glenn L. Butterfoss, Blakely W. Tresca, Bridgette A. LaFaye, Stephen Whitelam, David E. Wemmer and Ronald N. Zuckermann, Biopolymers 2019, doi: 10.1002/bip.23267 Oligomers of α‐ABpeptoid/β3‐peptide hybrid Kang Ju Lee, Ganesh A. Sable, Min-Kyung Shin and Hyun-Suk Lim, Biopolymers 2019, doi: 10.1002/bip.23289 Stereochemistry of polypeptoid chain configurations Ryan K. Spencer, Glenn L. Butterfoss, John R. Edison, James R. Eastwood, Stephen Whitelam, Kent Kirshenbaum and Ronald N. Zuckermann, Biopolymers 2019, doi: 10.1002/bip.23266 Peptoid microsphere coatings: The effects of helicity, temperature, pH, and ionic strength German R. Perez Bakovic, Jesse L. Roberts, Bryce Colford, Myles Joyce and Shannon L. Servoss, Biopolymers 2019, doi: 10.1002/bip.23283 Antibacterial mechanisms of GN-2 derived peptides and peptoids against Escherichia coli Paola Saporito, Mojsoska Biljana, Anders Løbner Olesen and Håvard Jenssen, Biopolymers 2019, doi: 10.1002/bip.23275 Toward a clinical antifungal peptoid: Investigations into the therapeutic potential of AEC5 Sabrina K. Spicer, Aarthi Subramani, Angelica L. Aguila, R. Madison Green, Erin E. McClelland and Kevin L. Bicker, Biopolymers 2019, doi: 10.1002/bip.23276 Helical side chain chemistry of a peptoid-based SP-C analogue: Balancing structural rigidity and biomimicry Nathan J. Brown, Jennifer S. Lin and Annelise E. Barron, Biopolymers 2019, doi: 10.1002/bip.23277

F U L L P A P E R
Unconstrained peptoid tetramer exhibits a predominantconformation in aqueous solution
Leah T. Roe1 | Jeffrey G. Pelton2 | John R. Edison1 | Glenn L. Butterfoss3 |
Blakely W. Tresca1,4 | Bridgette A. LaFaye1 | Stephen Whitelam1 | David E. Wemmer5 |
Ronald N. Zuckermann1
1The Molecular Foundry, Lawrence BerkeleyNational Laboratory, Berkeley, California2QB3 Institute, University of California,Berkeley, California3Center for Genomics and Systems Biology,New York University Abu Dhabi, Abu Dhabi,United Arab Emirates4Department of Chemistry, KalamazooCollege, Kalamazoo, Michigan5Department of Chemistry, University ofCalifornia, Berkeley, California
CorrespondenceRonald N. Zuckermann, The MolecularFoundry, Lawrence Berkeley NationalLaboratory, 1 Cyclotron Rd., Berkeley,CA 94720.Email: [email protected]
Funding informationBasic Energy Sciences, Grant/Award Number:DE-AC02-05CH11231; Defense AdvancedResearch Projects Agency, Grant/AwardNumber: Fold F(x) program; National Institutesof Health, Grant/Award Number: GM68933
AbstractConformational control in peptoids, N-substituted glycines, is crucial for the design and synthesis of
biologically-active compounds and atomically-defined nanomaterials. While there are a growing
number of structural studies in solution, most have been performed with conformationally-
constrained short sequences (e.g., sterically-hindered sidechains or macrocyclization). Thus, the
inherent degree of heterogeneity of unconstrained peptoids in solution remains largely unstudied.
Here, we explored the folding landscape of a series of simple peptoid tetramers in aqueous solution
by NMR spectroscopy. By incorporating specific 13C-probes into the backbone using bromoacetic
acid-2-13C as a submonomer, we developed a new technique for sequential backbone assignment
of peptoids based on the 1,n-Adequate pulse sequence. Unexpectedly, two of the tetramers, con-
taining an N-(2-aminoethyl)glycine residue (Nae), had preferred conformations. NMR and molecular
dynamics studies on one of the tetramers showed that the preferred conformer (52%) had a trans-
cis-trans configuration about the three amide bonds. Moreover, >80% of the ensemble contained a
cis amide bond at the central amide. The backbone dihedral angles observed fall directly within the
expected minima in the peptoid Ramachandran plot. Analysis of this compound against similar pep-
toid analogs suggests that the commonly used Nae monomer plays a key role in the stabilization of
peptoid structure via a side-chain-to-main-chain interaction. This discovery may offer a simple, syn-
thetically high-yielding approach to control peptoid structure, and suggests that peptoids have
strong intrinsic conformational preferences in solution. These findings should facilitate the predictive
design of folded peptoid structures, and accelerate application in areas ranging from drug discovery
to biomimetic nanoscience.
KEYWORDS
peptoid structure, 2D NMR, conformational control, molecular dynamics
1 | INTRODUCTION
The peptoid backbone without any imposed conformational constraint
is considered to be flexible.[1,2] To design effective drugs or protein
mimetic materials from peptoids, it is essential to understand and con-
trol their conformation. Thus, researchers have developed a variety of
methods to constrain peptoid structure, including macrocyclization,[3]
steric congestion,[4,5] side chain chirality,[5–7] and electronic interac-
tions.[8,9] Most of these rely on bulky, hydrophobic groups, which can
dominate the molecular properties and restrict water solubility, hinder-
ing the development of biological applications. As a result, most peptoid
structures obtained thus far have been determined in either the solid
state or in organic solvent.[10]
To better understand the solution structure of minimally constrained
peptoids in water, we examine a family of tetramers that contain simple
ethyl-substituted side chains that have been widely used in peptoid sci-
ence: N-(2-phenylethyl)glycine (Npe), N-(2-aminoethyl)glycine (Nae), and
N-(2-carboxyethyl)glycine (Nce). These three monomers, when arranged
Received: 18 November 2018 Revised: 29 January 2019 Accepted: 12 February 2019
DOI: 10.1002/bip.23267
Biopolymers. 2019;110:e23267. wileyonlinelibrary.com/journal/bip © 2019 Wiley Periodicals, Inc. 1 of 10https://doi.org/10.1002/bip.23267
in longer chains with an alternating aromatic-ionic sequence motif, form
highly ordered supramolecular nanosheets in aqueous solution. Peptoid
nanosheets are a functionally diverse class of materials[11] that show
great promise as affinity reagents, templates for mineralization, and as
cell-surface mimetics. Nanosheets have a well-defined molecular struc-
ture with their backbones containing primarily cis amide bonds,[12] as
determined by solid-state NMR, X-ray diffraction, electron microscopy
and atomic force microscopy, despite being comprised of only these
three sterically unhindered monomers. However, because the
nanosheets are micron-scale objects (in length and width) and tumble
very slowly in solution, their detailed molecular conformations cannot be
probed by solution NMR, which is very often the technique of choice for
studying molecular structure and dynamics in solution.
NMR is often used to determine the solution structure of
moderately-sized proteins.[13] The procedure typically involves uni-
form 15N and 13C isotope labeling via bacterial expression using 15N
ammonium chloride and 13C glucose as the sole nitrogen and carbon
sources. For proteins predominately in a folded state, the well-
dispersed amide proton and nitrogen resonances provide a good start-
ing point for resonance assignment and structure determination.
Peptoid NMR structure determination, in contrast, involves several
additional challenges. Because the peptoid backbone lacks an amide
proton, assignments must center on the backbone CH2 groups (the
alpha carbons). The proton and carbon shifts of these methylene
groups show poor dispersion relative to protein amide proton and
nitrogen shifts, leading to spectral crowding. Crowding is further exac-
erbated by the fact that the amide bonds in peptoids tend to readily
adopt both cis and trans conformations, leading to as many as 2(n−1)
amide states, for a peptoid of n residues. Fortunately, specific 13C
labeling at backbone CH2 and carbonyl positions[14] is straightforward
for peptoids, but labeling the sidechains is laborious, generally necessi-
tating less sensitive natural abundance 13C experiments. The problem
with longer oligomers then becomes assigning and obtaining structural
information on a growing number of resonances. The longest peptoid
structure determined by solution NMR was a 9mer homo-oligomer of
the hindered, structure-inducing monomer N-(1-phenylethyl)glycine.[7]
Herein, we present detailed solution NMR characterization of four
peptoid tetramers. Tetramers were chosen to be short enough to charac-
terize, but long enough to avoid chain termini effects. Unexpectedly, we
found that two of the peptoids examined have preferred conformations
in solution. The central residues in both these sequences are Npe-Nae,
and we observe a clear preference for the amide bond between these
two residues to be in the cis conformation.
2 | MATERIALS AND METHODS
2.1 | Peptoid synthesis
All peptoid tetramers were synthesized using the solid-phase submono-
mer method[15] at 50!C. Before starting the submonomer cycle, rink
amide resin was first swelled in NMP for 10 minutes and then depro-
tected with 20% 4-methyl-piperidine in NMP for 10 minutes. During
the bromoacetylation step of the submonomer cycle, the resin was
treated with a 1:1 mixture of 2 M bromoacetic acid and 2 M
N,N0-diisoproplycarbodiimide in NMP and mixed for 5 minutes. At steps
where 13C labeling was desired, bromoacetic acid-2-13C was used in
place of bromoacetic acid. The displacement step was carried out using
a 1 M solution of the amine in NMP for a duration of 5 minutes. Crude
peptoid products were cleaved from resin using a cocktail of 95:2.5:2.5
trifluorocetic acid (TFA):triisopropylsilane:water for 1 hour at room tem-
perature. The cleavage solution was then filtered and the volatiles
removed in vacuo using a Biotage V10 Evaporator. Crude peptoid prod-
uct was dissolved into a 5:95 acetonitrile:water solution and further
purified using reverse-phase chromatography on a Waters Prep150LC
system with Waters 2489 UV/Visible Detector on a Waters XBridge
BEH300 Prep C18 column using a 5-40% acetonitrile in water with
0.1% TFA gradient over 30 minutes. Final products were dissolved in
water and lyophilized. All final products were analyzed by Waters
Acquity UPLC system with Acquity Diode Array UV detector and
Waters SQD2 mass spectrometer on a Waters Acquity UPLC Peptide
BEH C18 Column over a 5-50% gradient.
2.2 | NMR spectroscopy
All NMR samples were prepared at a peptoid concentration of 10 mM
solution in 90% D2O and 10% 40 mM sodium phosphate buffer in water
at pH 7.4. All peptoids are in the presence of TFA salt, and amino groups
on Nae sidechains are expected to be protonated at pH 7.4.
NMR spectra (1H and HSQC) for peptoids 1-4 were recorded on
a Bruker Avance500 II, using locking to the deuterated solvent and
using tetramethylsilane as an internal standard. All chemical shifts are
quoted using the δ scale, and all coupling constants (J) are expressed
in Hertz (Hz). Further NMR experiments for peptoids 1 and 5-9 were
recorded on a Bruker-Biospin Inc Avance II NMR spectrometer oper-
ating at 900 MHz, and controlled with Topspin software (version 3.2)
and equipped with a TCI cryoprobe at 25 !C.
2.2.1 | Peptoid 1
An edited 1H-13C HSQC spectrum of peptoid 1was recorded using pulse
sequence hsqcedetgpsisp2.2 using spectral widths of 16 ppm (1H) and
165 ppm (13C), carrier frequencies of 4.69 ppm (1H) and 70 ppm (13C),
and with 1024 (1H) and 128 complex points (13C). A total of four scans
were recorded for each t1 increment along with a recycle time of 2 sec-
onds, resulting in an experiment time of 36 minutes.
A 2D 1H-13C HMBC experiment on peptoid 1 was recorded using
pulse sequence hmbcgplpndqf using spectral widths of 11 ppm (1H) and
222 ppm (13C), carrier frequencies of 4.69 (1H) and 100 ppm (13C) and
with 1024 (1H) and 128 (13C) complex points. The 1JCH and long-range
JCH coupling values were set to 145 Hz and 10 Hz, respectively. A total
of 16 scans were recorded for each t1 increment with a recycle delay of
1.5 seconds, resulting in an experiment time of 57 minutes.
A gradient COSY experiment was recorded with pulse sequence
cosygpqf using spectral widths of 16 ppm in both dimensions, carrier
frequency of 4.69 ppm, and 2048 (direct dimension) and 128 complex
points (indirect dimension). A total of four scans were averaged for
each t1 increment and the recycle delay was set to 1.5 seconds,
resulting in a total experiment time of 28 minutes.
A 2D ROESY experiment was recorded using pulse sequence roe-
syetgp.2 that was modified to include presaturation of the residual HDO
2 of 10 ROE ET AL.
resonance during the recycle delay. The mixing time was composed of
100 μs 180x,180-x pulses applied for a total time of 300 ms. The spec-
trum was recorded with spectral widths of 11 ppm in each dimension, a
carrier frequency of 4.69 ppm, and with 2048 complex points in the
direct dimension, and 256 complex points in the indirect dimension. A
total of 32 scans was used for each t1 increment, along with a recycle
time of 2 seconds, resulting in an experiment time of 3 hours.
2.2.2 | Peptoids with 13C-enriched backbones
A 2D 1H-13C HSQC experiment focused on the backbone 13C reso-
nances was recorded with spectral widths of 11 ppm (1H) and 20 ppm
(13C) and with carrier frequencies set to 4.69 ppm and 50 ppm. A total
of 1024 (1H) and 128 complex points (13C) were recorded using four
scans and a recycle delay of 2 seconds, for a total experiment time of
36 minutes. Similar spectra were recorded on the singly labeled peptoids
6-9. Because these data were used to quantify the abundance of each
conformer, the delay between scans was increased to 4.25 seconds, to
ensure that the magnetization was fully recovered between scans. For
these experiments the total experiment time was 77 minutes.
A 2D 1,n-Adequate spectrum was recorded with pulse sequence
adeq1netgprdsp using spectral widths of 11 ppm (1H) and 20 ppm (13C),
carrier frequencies of 4.69 ppm (1H) and 50 ppm (13C),and with 1024
(1H) and 128 (13C) complex points. The 1JCH,1JCC,
nJCC, andn'JCC cou-
pling constants were set to standard values of 145 Hz, 45 Hz, 9.5 Hz,
and 8 Hz, respectively. Optimization of these parameters for the small
three-bond couplings between backbone 13C spins of neighboring resi-
dues, may improve the sensitivity of the experiment. A total of 16 scans
per t1 increment were recorded and the recycle delay was set to 2 sec-
onds, resulting in a total experiment time of 5 hours.
A 2D 1H-13C HSQC-ROESY experiment was recorded using pulse
sequence hsqcetgprosp.2 with spectral widths of 6 ppm (1H) and
10 ppm (13C), carrier frequencies of 4.70 ppm (1H) and 50 ppm (13C)
and 1024 (1H) and 100 (13C) complex points. Similar to the 1H-1H
ROESY, the mixing time was composed of 100 μs 180x,180-x pulses
applied for a total time of 300 ms. A total of 128 scans was used for
each t1 increment, along with a recycle time of 2 seconds, resulting in
a total experiment time of 18 hours.
2.2.3 | 3D experiments
Three dimensional hCCH-TOCSY and two HcCH-TOCSY experiments
with different mixing times were recorded on peptoids 6-9 labeled
with 13C at each backbone position on a Bruker Avance 800 MHz
spectrometer equipped with a room-temperature TXI probe operating
at 25 !C. These experiments were designed for the assignment of the
sidechain 1H and 13C signals of proteins, taking advantage of strong
single-bond 13C-13C spin couplings (~35 Hz) and were optimized for
the large chemical shift dispersion of protein sidechain 13C resonances
(~70 ppm). The three-bond 13C-13C spin couplings are significantly
smaller (estimated to be less than 2 Hz), and the dispersion of the sig-
nals is significantly less (4 ppm). To account for these differences, the
pulse sequences were unmodified, but the rf field strength of the mix-
ing time was reduced to 1.67 kHz, and the duration was increased to
260 ms for complete transfer among the four carbon (hCCH-TOCSY)
or proton (HcCH-TOCSY) resonances, and to 97.5 ms for limited
transfer to adjacent proton spins.
In each experiment a total of 1024 (F3,1H) and 24 (F1,13C) complex
points were recorded with spectral widths of 11 ppm (1H) and 10 ppm
(13C), and carrier frequencies of 4.69 and 50 ppm. A total of 16 scans
were averaged for each fid, and the recycle delay was set to 2 seconds.
In the hCCH-TOCSY experiment (pulse sequence hcchdigp3d2),
the mixing time was set to 260 ms, and 32 complex points were col-
lected in the indirect TOCSY dimension (F2, 13C). The experiment was
recorded in 33.5 hours. In the HcCH-TOCSY experiment (pulse
sequence hcchdigp3d), 128 complex points were collected in the indi-
rect TOCSY dimension (F2, 1H). The HcCH-TOCSY experiments with
the longer, and shorter mixing times were recorded in 67 hours, and
62.5 hours, respectively.
2.3 | Molecular dynamics
NAMD simulation[16] package was used for our classical Molecular
Dynamics simulations. The interactions between the peptoid residues
were described by the MFTOID forcefield[17] developed at the Molecu-
lar Foundry. A single peptoid was solvated in a cubic water box of size
(40 Å × 40 Å × 40 Å). Two negatively charged ions were added to the
system to keep it net neutral. We used the TIP3P potential to describe
the interactions of water molecules. The SHAKE algorithm was used to
fix the positions of the hydrogen atoms. Short range interactions were
cut-off at 12 Å and electrostatic interactions were estimated using
Ewald summation with a grid spacing of 1 Å. The integration time step
was set to 1 fs. A Langevin thermostat was used to fix the temperature
at 298 K. The system was initially equilibrated in the NPT ensemble for
1 ns, followed by an NVT run for 10 ns. The simulation trajectory is pro-
vided as supporting information and consists of 10 structures taken at
equal time intervals over the 10 ns simulation.
2.4 | Quantum mechanics
All DFT modeling was done with Gaussian16.[18] DFT analysis of peptoid
1 began with 30 starting conformations: 20 extracted from periodic
snapshots of the unrestrained trans-cis-trans MD trajectory described
above, and 10 were built manually (also with a trans-cis-trans amide pat-
tern). The 30 structures were initially optimized with +2 charges and pro-
tonated Nae sidechains at the B3LYP/6-31G* level of theory (in vacuo)
and the 12 lowest energy structures (0-14.3 kcal/mol range of relative
energies) were selected. These 12 were further geometry optimized at
both the B3LYP/6-311G** (with PCM) and M06-2X/6-311G** (with
PCM) levels of theory.
3 | RESULTS AND DISCUSSION
3.1 | Structural survey of peptoid tetramers
We selected a set of four peptoid tetramers, three of which represent
short sections of the nanosheet-forming sequence, Block28 (Figure 1).[12]
Peptoids 1 and 2 were taken from the amino and carboxy termini,
respectively, while peptoid 4 is taken from the center of the chain. Pep-
toid 3 is a control sequence. Tetramer segments were chosen for ease of
ROE ET AL. 3 of 10

structural analysis, and to mimic the interior of longer peptoid chains.
Peptoids 1-4 were synthesized by the solid-phase submonomer method
and purified to homogeneity by reverse-phase HPLC (Table 1). These
four peptoids were dissolved in 90% D2O and 10% sodium phosphate
buffer at pH 7.4 in water and analyzed for structural homogeneity
using NMR.
1D 1H and 2D 1H-13C HSQC experiments were used to identify the
presence or absence of a major conformation in solution for the four
tetramers.[19] As can be seen in Figure 2, peptoids 1 (Figure 2A) and 3
(Figure 2C) exhibit preferred conformations (e.g., four distinct backbone
methylene singlet peaks), while peptoids 2 (Figure 2B) and 4 (Figure 2D)
show less conformational preference. The 1H peaks for peptoid 2 were
broader, indicating conformational exchange on the millisecond time
scale. Notably, the most ordered peptoids, 1 and 3, both have Npe-Nae
in the central two positions, suggesting these residues have a role in
driving a preferred conformation. Because compound 1 appeared to be
the most conformationally-defined, it was chosen for detailed analysis of
its major and minor conformations by 2D and 3D NMR.
3.2 | Peptoid 1 major conformation structuralanalysis
Peptoid 1 has 12 methylene groups—four in the backbone (BB) and
eight in the side chains (SC)—that serve as the principal guideposts for
determining the structure (see Figure 3 for naming convention). The
general method for structure assignment follows: (a) HSQC to assign1H-13C connections of the major conformation, (b) COSY to group SC
methylenes by residue, (c) HMBC to connect SCs to BBs and assign
monomer type, (d) 1,n-Adequate to place residues in sequence order,
and (e) ROESY to identify key through space interactions between
protons.
3.3 | HSQC
An HSQC experiment was used to verify the presence of a major
conformation, and correlate the 12 methylene carbons to their
attached hydrogens. For peptoid 1, the presence of 12 intense dis-
tinct correlations indicated that one conformation predominates in
solution (Figure 4). This is in contrast to peptoids 2 and 4, where the
HSQC spectra of both showed at least 24 correlations at a similar
FIGURE 1 The nanosheet forming sequence, Block28 (above), was broken into a series of shorter tetramer sequences in order to examine theirconformational preferences by solution NMR
TABLE 1 Peptoid tetramer sequences
Peptoid SequenceExpectedmass
Observedmass Puritya
1 Nae-Npe-Nae-Npe 540.3 540.5 >99%
2 Nce-Npe-Nce-Npe 597.3 598.0 >99%
3 Nce-Npe-Nae-Npe 568.3 569.0 >99%
4 Nae-Npe-Nce-Npe 568.3 570.0 >99%
5 Naeb-Npeb-Naeb-Npeb 544.3 544.5 >99%
6 Naeb-Npe-Nae-Npe 541.3 541.5 >99%
7 Nae-Npeb-Nae-Npe 541.3 542.0 >99%
8 Nae-Npe-Naeb-Npe 541.3 541.2 >99%
9 Nae-Npe-Nae-Npeb 541.3 542.0 >99%
aAfter HPLC purification.bContains 13C at the alpha carbon.
4 of 10 ROE ET AL.

contrast level (Supporting Information Figure S7 and Figure S13),
indicating greater than two major conformers. Peptoid 3 similarly
displayed 12 intense correlations (Supporting Information Figure S9),
indicating one predominant conformation. HSQC conformational
homogeneity analyses were consistent with 1D 1H data (Figure 2).
All 12 peptoid 1 1H-13C pairs were identified at a high contour
view of the 1H-13C HSQC spectrum. Each correlation arises from a 1H
directly bonded to a 13C, allowing us to take advantage of 13C shift
values in successive assignment experiments. Correlations are
grouped according to their position on the peptoid chain, with distinct
clusters for BB, SC1 and SC2 type peaks. The cluster types have
strong grouping along the 13C axis, with R2 BB being a noteworthy
outlier in the BB type. As would be expected, the clustering is weaker
in the 1H axis, but separates SC2 protons from those closer to the BB.
3.4 | COSY
We established connectivity of the two sidechain methylene groups
within a single residue via 2D COSY.[20] As can be seen in Figure 5, four
strong cross peaks associated with the sidechains of the major confor-
mation were clearly visible in the spectrum, allowing for identification
of the four pairs of sidechain CH2 resonances. Transferring the proton
FIGURE 2 1D 1H NMR spectra of the four peptoids in 90% D2O and 10% sodium phosphate buffer at pH 7.4 in water (A) peptoid 1, (B) peptoid2, (C) peptoid 3, (D) peptoid 4
FIGURE 3 Atom labeling scheme for peptoid 1. The four residues(R) each have their own backbone methylene (BB) and two sidechainmethylenes (SC1 and SC2). The sequence is Nae-Npe-Nae-Npe
FIGURE 4 1H-13C HSQC spectrum of peptoid 1 at a high contourthreshold, showing both backbone and sidechain correlations for allfour residues of the major conformer
ROE ET AL. 5 of 10

shifts to the HSQC spectrum, the corresponding 1H-13C signals were
catalogued as belonging to sidechains, and the 13C signals for each of
the side chain's ethyl groups was determined. The four remaining peaks
in the HSQC spectrum were classified as belonging to backbone CH2
groups. Because the backbone CH2 groups are isolated, that is, have no
proton neighbors, they do not appear in the COSY spectrum, allowing
us to analyze each sidechain independently.
3.5 | HMBC
Each sidechain SC1 CH2 resonance correlated with its own backbone
alpha carbon resonance via three-bond proton-carbon couplings in an
HMBC experiment[14] (Figure 6). Additionally, the SC2 proton resonances
of the two aromatic groups were identified through correlations between
the SC2 CH2 protons and carbon resonances of its own aromatic group
(Supporting Information Figure S4), providing classification of the spin
systems as belonging to Nae or Npe residues. 1H-13C HMBC experi-
ments have been used previously to sequentially assign adjacent back-
bone CH2 groups to one another in peptoids using correlations between
carbonyl carbons.[21] In the case of peptoid 1, overlap of 13CO reso-
nances made sequential assignment by this method difficult. We there-
fore developed a new method based on 1,n-Adequate experiments.
3.6 | 1,n-Adequate
Because the HMBC data did not allow us to assign the sequential back-
bone methylene group connectivity, we developed a new sequential
assignment method based on 1,n-Adequate experiments.[22] In the pro-
tein ubiquitin, three-bond Ca-Ca coupling constants range from one to
two Hertz.[23] We reasoned that the three-bond coupling constants in
our peptoids should have similar values, and could be useful for making
sequential assignments. The Adequate family of experiments is often
used in the assignment of the 1H and 13C resonances of small mole-
cules.[24] Of interest here was the 1,n-Adequate experiment which cor-
relates protons with carbons several bonds removed via multi-bond
carbon-carbon couplings. It is typically employed on samples without13C enrichment. In our case, to increase sensitivity, all the backbone
alpha carbons of peptoid 1 were specifically labeled with 13C to make
peptoid 5 (Table 1). This was readily achieved by using bromoacetic
acid-2-13C during routine submonomer synthesis.[14,15]
A 1,n-Adequate spectrum of peptoid 5 is shown in Figure 7. Weak
one-bond 1H-13C correlations for each of the backbone resonances
appear opposite in phase (blue) to the stronger cross peaks (green).
Strong cross peaks can be seen, which correlate each backbone pro-
ton with the 13C resonances of neighboring residues. For example,
backbone proton R3 at 3.80 ppm (R3 BB) is correlated to carbon
FIGURE 5 2D COSY spectrum of peptoid 1 showing correlationsbetween sidechain atoms SC1 and SC2 for each residue in the majorconformer
FIGURE 6 2D 1H-13C HMBC spectrum of peptoid 1. Correlationsbetween backbone protons and the sidechain carbon atoms of SC1for the major form are labeled. These correlations were used toconnect the sidechain and backbone resonances
FIGURE 7 1,n-Adequate spectrum of peptoid 5 labeled with 13C atall backbone positions. Blue peaks correspond to one-bond 1H-13Ccorrelations, and are labeled with residue number for the major form.The green peaks result from magnetization transfer to adjacent 13Cspins (dashed lines), allowing for sequential assignment of the peptoidbackbone (black/gray arrows)
6 of 10 ROE ET AL.

atoms at 48.8 ppm and 50.4 ppm, corresponding to the carbon reso-
nances of R2 and R4, respectively. These data were sufficient to
determine the connections between backbone 1H-13C signals for the
major conformer. Together with residue type assignments from the
HMBC experiment, we were able to unambiguously assign the chain
directionality and all backbone and sidechain ethyl resonances for this
conformer.
3.7 | ROESY
ROESY experiments[25] use the Nuclear Overhauser effect to give pairs
of protons with separations of less than 5 Å. ROESY experiments can
be used to identify peptoid backbone cis/trans patterns using ROEs that
arise between backbone alpha carbon protons to identify cis amide
bonds, and a lack of ROEs between backbone protons to infer trans
amide bonds.[7] Upon analysis of the ROESY spectra for the major con-
form of peptoid 1 (Figure 8A), an ROE was observed between the
backbone protons of R2 and R3, indicating a backbone pattern of
trans-cis-trans. An additional inter-residue ROE was observed between
R1 backbone (BB) and R2 sidechain 1 (SC1). Both observed distance
constraints can be rationalized in minimized molecular dynamics model
(Figure 8C) as described below. Other ROEs arise from expected intra-
residue correlations.
3.8 | Minor conformation structural analysis
In order to determine the cis-trans backbone pattern of the minor
conformers, we employed 3D NMR techniques because of their
low abundance and spectral crowding. Based on the success of the
1,n-Adequate experiment in correlating neighboring 13C spins along
the peptoid backbone, we hypothesized that 3D hCCH-TOCSY and
HcCH-TOCSY experiments[26] could be used to assign the backbone1H and 13C resonances of the minor forms, in analogy to the use of
these experiments in assignment of protein sidechain resonances. The
advantage of the HCCH-TOCSY methods over the 2D 1,n-Adequate
is that it is possible to correlate all four 1H and 13C resonances of a
conformer with each 1H-13C pair, rather than just the 13C resonances
of neighboring residues. Another advantage is that the data are sepa-
rated into three dimensions, helping to resolve this crowded region of
the spectrum.
hCCH-TOCSY (Supporting Information Figure S17) and HcCH-
TOCSY (Supporting Information Figure S18) spectra were used to cat-
alog four 1H-13C correlations for five conformers and three 1H-13C
correlations for one conformer. An HcCH-TOCSY experiment with a
shorter mixing time (Supporting Information Figure S19) was then
used to identify neighbors in analogy to the COSY experiment, and
hence, the relative order of the resonances. Even though the order of
the resonances was now known, the start and end of each sequence
remained ambiguous. The ambiguity was resolved by identifying the1H-13C pairs for all of the R1 residues from an HSQC spectrum
recorded on a sample in which only the R1 position was labeled with13C (peptoid 6). To confirm the assignments, the 1H-13C resonances
of residues R2, R3, and R4 were also identified from HSQC spectra of
singly labeled samples (peptoids 7-9). Integrated peaks of these singly
labeled samples were also used to determine the abundance of each
conformer (Supporting Information Table S1).
The cis-trans configuration of the three predominate forms were
determined from ROEs observed in a 2D 1H-13C HSQC-ROESY spec-
trum (Supporting Information Figure S16). The 2D 1H-13C version was
chosen to alleviate signal overlap of 1H signals in the 2D 1H-1H ROESY.
For further confirmation, additional HSQC-ROESY spectra (Supporting
Information Figure S21, S23, S25, and S27) were recorded on each of
the singly labeled peptoids (peptoids 6-9). Interestingly, the three high-
est abundance conformers, which in total represent 80% of ensemble
population, exhibit a cis amide bond between R2 and R3 (Table 2).
FIGURE 8 (A) 2D ROESY spectrum of peptoid 1. Blue peaks correspond to ROEs, indicating that the protons are close in space (<5 Å). (B) For themajor conformer, ROEs are observed between backbone (BB) protons of R2 and R3, and between the backbone (BB) protons of R1 and the SC1sidechain protons of R2. (C) Inter-proton distances, superimposed on a molecular dynamics minimized structure, are indicated by dashed lines.Distances are reported as the average between the four protons in each ROE correlation
ROE ET AL. 7 of 10

3.9 | Major conformation of peptoid 3
As was the case for peptoid 1, the 1D 1H and 2D HSQC spectra indi-
cated the presence of a major conformation. A similar conformation
analysis was applied to the major conformation of peptoid 3. Results
showed similar inter-residue ROEs between R2 BB and R3 BB, indica-
tive of a cis amide bond, and between R1 BB and R2 SC1. The
sequence identity of the two central residues in peptoids 1 and 3,
Npe-Nae, suggest that these play an important role in stabilization of
the major conformation. Molecular dynamics modeling and quantum
mechanics computations were done to help elucidate stabilizing
interactions.
3.10 | Molecular dynamics simulation
Classical molecular dynamics simulations were performed on peptoid
1 in water. We simulated the predominant (as determined by NMR)
trans-cis-trans backbone pattern of this compound (conformer 1,
Table 2). Simulations were run using the NAMD package for 10 ns,
the last 5 ns of which were analyzed for conformational preferences.
The simulations indicate that the 3-dimensional backbone trace is
well preserved over the trajectory, while there is significant variation
in side chain orientations (Figure 9A). In all cases, the structures were
consistent with the distance constraints derived from the ROESY
experiment (Figure 8C). Further analysis of the backbone dihedral
angles for the central two residues, R2 and R3, was performed
because they are internal and separated from the chain termini. Over
the last 5 ns of simulation time, we computed the dihedral angles on a
Ramachandran plot (Figure 9B). Interestingly, the spread in dihedral
angles was very narrow for both of these residues, and they populate
the known energy minima of the Ac-Sar-Sar-N(Me)2 Ramachandran
plot.[27] Specifically, residue 2 and residue 3 occupy the ZRt and ZSc
conformations, respectively.[28]
3.11 | Quantum mechanics modeling
We asked whether the observed preference for the cis conformation
at the central amide bond might be driven by backbone interactions
with the Nae side chain. We first surveyed the relative conformational
energies of a simple peptoid monomer model compound: protonated
N-(2-aminoethyl)-N-methylacetamide (Supporting Information Figure
S28). The lowest energy conformation (by ~5 kcal/mol) contained a cis
amide bond with a hydrogen bond between the ammonium group and
the carbonyl (Supporting Information Table S2).
For more detailed predictions of the types of internal interactions
that may stabilize the solution structure, we analyzed a series of peptoid
1 geometries via DFT. We used two levels of theory B3LYP/6-311G**
and M06-2X/6-311G**, both in implicit water solvent (see methods for
further details). The overall lowest energy structure predicted by B3LYP
features hydrogen bonds between the central Nae amine and both the
preceding and succeeding carbonyl oxygens (Figure 10A). The second
most favorable B3LYP structure (Figure 10B, 0.98 kcal/mol relative
energy) is similar but the central Nae only participates in a single hydro-
gen bond (with its neighboring N-terminal carbonyl). Also in this struc-
ture, the N-terminal Nae amino and C-terminal amide are both involved
in hydrogen bonds with their nearest backbone carbonyls. The lowest
energy M06-2X structure (Figure 10C) is a compact reverse turn, remi-
niscent of a touch-turn.[29,30]The central Nae hydrogen bonds with its
neighboring N-terminal carbonyl and the N-terminal Nae participates in
both a hydrogen bond with the C-terminal carbonyl and a π-cation inter-
action with the second Npe side chain. The second lowest energy
M06-2X geometry (Figure 10D, 0.46 kcal/mol relative energy) features
the central Nae forming a hydrogen bond with both of the following
backbone carbonyls rather than with its neighboring N-terminal car-
bonyl. The N-terminal Nae side chain also participates in a hydrogen
bond with the C-terminal carbonyl and a π-cation interaction with the
fourth Npe. The more compact geometries of the tetramer optimized by
TABLE 2 Predominant conformations of peptoid 1
Conformer Abundance (%) Backbone cis/trans pattern
1 (major) 52 trans-cis-trans
2 18 cis-cis-trans
3 10 trans-cis-cis
FIGURE 9 Molecular dynamics simulation of compound 1, confined to a trans-cis-trans backbone configuration, as determined by NMR, revealsa predominant backbone conformation. (A) Overlay of five structural snapshots from the last 5 ns of the molecular dynamics simulationtrajectory. (B) The two internal peptoid monomers, residue 2 (green), and residue 3 (purple) have well-defined dihedral angles as overlaid ona cis Ramachandran plot[27] that fall within known energy minima for peptoids
8 of 10 ROE ET AL.
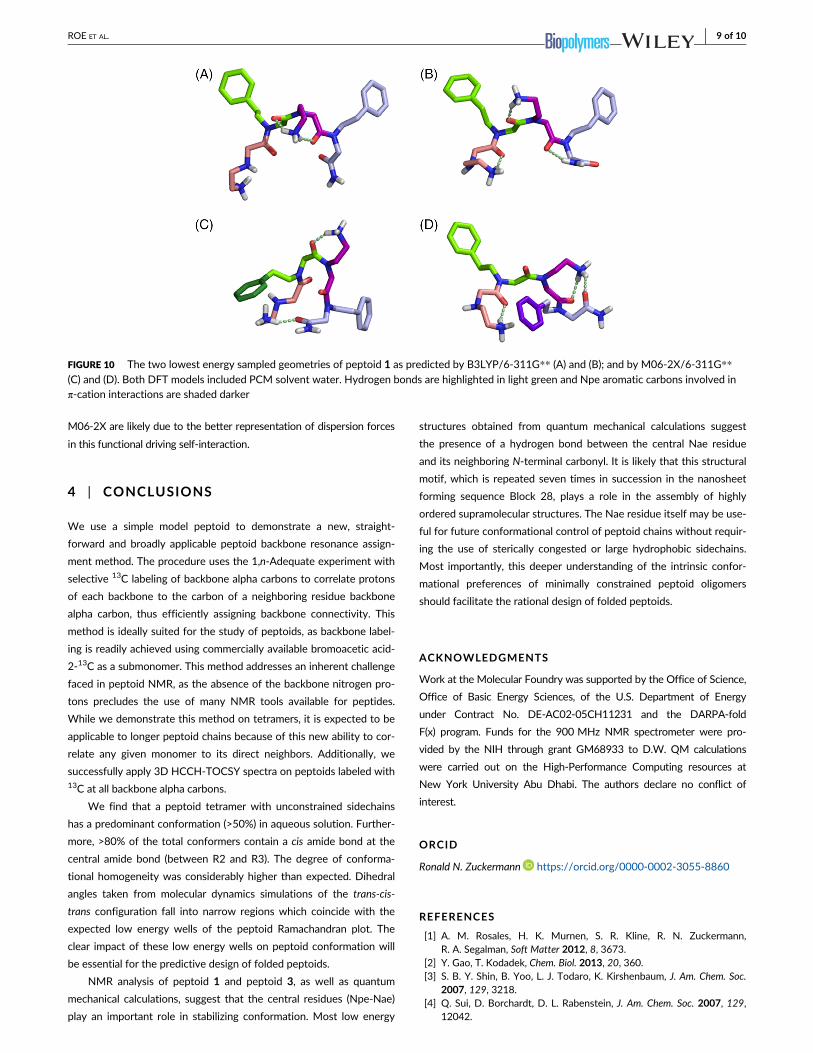
M06-2X are likely due to the better representation of dispersion forces
in this functional driving self-interaction.
4 | CONCLUSIONS
We use a simple model peptoid to demonstrate a new, straight-
forward and broadly applicable peptoid backbone resonance assign-
ment method. The procedure uses the 1,n-Adequate experiment with
selective 13C labeling of backbone alpha carbons to correlate protons
of each backbone to the carbon of a neighboring residue backbone
alpha carbon, thus efficiently assigning backbone connectivity. This
method is ideally suited for the study of peptoids, as backbone label-
ing is readily achieved using commercially available bromoacetic acid-
2-13C as a submonomer. This method addresses an inherent challenge
faced in peptoid NMR, as the absence of the backbone nitrogen pro-
tons precludes the use of many NMR tools available for peptides.
While we demonstrate this method on tetramers, it is expected to be
applicable to longer peptoid chains because of this new ability to cor-
relate any given monomer to its direct neighbors. Additionally, we
successfully apply 3D HCCH-TOCSY spectra on peptoids labeled with13C at all backbone alpha carbons.
We find that a peptoid tetramer with unconstrained sidechains
has a predominant conformation (>50%) in aqueous solution. Further-
more, >80% of the total conformers contain a cis amide bond at the
central amide bond (between R2 and R3). The degree of conforma-
tional homogeneity was considerably higher than expected. Dihedral
angles taken from molecular dynamics simulations of the trans-cis-
trans configuration fall into narrow regions which coincide with the
expected low energy wells of the peptoid Ramachandran plot. The
clear impact of these low energy wells on peptoid conformation will
be essential for the predictive design of folded peptoids.
NMR analysis of peptoid 1 and peptoid 3, as well as quantum
mechanical calculations, suggest that the central residues (Npe-Nae)
play an important role in stabilizing conformation. Most low energy
structures obtained from quantum mechanical calculations suggest
the presence of a hydrogen bond between the central Nae residue
and its neighboring N-terminal carbonyl. It is likely that this structural
motif, which is repeated seven times in succession in the nanosheet
forming sequence Block 28, plays a role in the assembly of highly
ordered supramolecular structures. The Nae residue itself may be use-
ful for future conformational control of peptoid chains without requir-
ing the use of sterically congested or large hydrophobic sidechains.
Most importantly, this deeper understanding of the intrinsic confor-
mational preferences of minimally constrained peptoid oligomers
should facilitate the rational design of folded peptoids.
ACKNOWLEDGMENTS
Work at the Molecular Foundry was supported by the Office of Science,
Office of Basic Energy Sciences, of the U.S. Department of Energy
under Contract No. DE-AC02-05CH11231 and the DARPA-fold
F(x) program. Funds for the 900 MHz NMR spectrometer were pro-
vided by the NIH through grant GM68933 to D.W. QM calculations
were carried out on the High-Performance Computing resources at
New York University Abu Dhabi. The authors declare no conflict of
interest.
ORCID
Ronald N. Zuckermann https://orcid.org/0000-0002-3055-8860
REFERENCES
[1] A. M. Rosales, H. K. Murnen, S. R. Kline, R. N. Zuckermann,R. A. Segalman, Soft Matter 2012, 8, 3673.
[2] Y. Gao, T. Kodadek, Chem. Biol. 2013, 20, 360.[3] S. B. Y. Shin, B. Yoo, L. J. Todaro, K. Kirshenbaum, J. Am. Chem. Soc.
2007, 129, 3218.[4] Q. Sui, D. Borchardt, D. L. Rabenstein, J. Am. Chem. Soc. 2007, 129,
12042.
FIGURE 10 The two lowest energy sampled geometries of peptoid 1 as predicted by B3LYP/6-311G** (A) and (B); and by M06-2X/6-311G**(C) and (D). Both DFT models included PCM solvent water. Hydrogen bonds are highlighted in light green and Npe aromatic carbons involved inπ-cation interactions are shaded darker
ROE ET AL. 9 of 10

[5] B. C. Gorske, E. M. Mumford, C. G. Gerrity, I. Ko, J. Am. Chem. Soc.2017, 139, 8070.
[6] J. R. Stringer, J. A. Crapster, I. A. Guzei, H. E. Blackwell, J. Am. Chem.Soc. 2011, 133, 15559.
[7] K. Huang, C. W. Wu, T. J. Sanborn, J. A. Patch, K. Kirshenbaum,R. N. Zuckermann, A. E. Barron, I. Radhakrishnan, J. Am. Chem. Soc.2006, 128, 1733.
[8] B. C. Gorske, R. C. Nelson, Z. S. Bowden, T. A. Kufe, A. M. Childs,J. Org. Chem. 2013, 78, 11172.
[9] C. Caumes, O. Roy, S. Faure, C. Taillefumier, J. Am. Chem. Soc. 2012,134, 9553.
[10] A. S. Knight, E. Y. Zhou, M. B. Francis, R. N. Zuckermann, Adv. Mater.2015, 27, 5665.
[11] E. J. Robertson, A. Battigelli, C. Proulx, R. V. Mannige, T. K. Haxton,L. Yun, S. Whitelam, R. N. Zuckermann, Acc. Chem. Res. 2016,49, 379.
[12] B. C. Hudson, A. Battigelli, M. D. Connolly, J. Edison, R. K. Spencer,S. Whitelam, R. N. Zuckermann, A. K. Paravastu, J. Phys. Chem. Lett.2018, 9, 2574.
[13] D. Marion, Mol. Cell. Proteomics: MCP 2013, 12, 3006.[14] E. K. Bradley, J. M. Kerr, L. S. Richter, G. M. Figliozzi, D. A. Goff,
R. N. Zuckermann, D. C. Spellmeyer, J. M. Blaney, Mol. Divers. 1997,3, 1.
[15] R. N. Zuckermann, J. M. Kerr, S. B. H. Kent, W. H. Moos, J. Am. Chem.Soc. 1992, 114, 10646.
[16] J. C. Phillips, R. Braun, W. Wang, J. Gumbart, E. Tajkhorshid, E. Villa,C. Chipot, R. D. Skeel, L. Kale, K. Schulten, J. Comput. Chem. 2005,26, 1781.
[17] D. T. Mirijanian, R. V. Mannige, R. N. Zuckermann, S. Whitelam,J. Comput. Chem. 2014, 35, 360.
[18] Frisch, M. J.; Trucks, G. W.; Schlegel, H. B.; Scuseria, G. E.; Robb,M. A.; Cheeseman, J. R.; Scalmani, G.; Barone, V.; Petersson, G. A.;Nakatsuji, H.; Li, X.; Caricato, M.; Marenich, A. V.; Bloino, J.;Janesko, B. G.; Gomperts, R.; Mennucci, B.; Hratchian, H. P.;Ortiz, J. V.; Izmaylov, A. F.; Sonnenberg, J. L.; Williams; Ding, F.;Lipparini, F.; Egidi, F.; Goings, J.; Peng, B.; Petrone, A.; Henderson, T.;Ranasinghe, D.; Zakrzewski, V. G.; Gao, J.; Rega, N.; Zheng, G.;Liang, W.; Hada, M.; Ehara, M.; Toyota, K.; Fukuda, R.; Hasegawa, J.;Ishida, M.; Nakajima, T.; Honda, Y.; Kitao, O.; Nakai, H.; Vreven, T.;Throssell, K.; Montgomery Jr., J. A.; Peralta, J. E.; Ogliaro, F.;Bearpark, M. J.; Heyd, J. J.; Brothers, E. N.; Kudin, K. N.;Staroverov, V. N.; Keith, T. A.; Kobayashi, R.; Normand, J.;
Raghavachari, K.; Rendell, A. P.; Burant, J. C.; Iyengar, S. S.; Tomasi, J.;Cossi, M.; Millam, J. M.; Klene, M.; Adamo, C.; Cammi, R.;Ochterski, J. W.; Martin, R. L.; Morokuma, K.; Farkas, O.;Foresman, J. B.; Fox, D. J., Gaussian, Inc. Wallingford, CT, 2016.
[19] J. A. Crapster, J. R. Stringer, I. A. Guzei, H. E. Blackwell, Biopolymers2011, 96, 604.
[20] W. F. Reynolds, R. G. Enríquez, J. Nat. Prod. 2002, 65, 221.[21] P. Armand, K. Kirshenbaum, R. A. Goldsmith, S. Farr-Jones,
A. E. Barron, K. T. V. Truong, K. A. Dill, D. F. Mierke, F. E. Cohen,R. N. Zuckermann, E. K. Bradley, Proc. Natl. Acad. Sci. 1998, 95, 4309.
[22] M. Reibarkh, R. T. Williamson, G. E. Martin, W. Bermel, J. Magn.Reson. 2013, 236, 126.
[23] M. Hennig, W. Bermel, H. Schwalbe, C. Griesinger, J. Am. Chem. Soc.2000, 122, 6268.
[24] G. E. Martin, in Annual Reports on NMR Spectroscopy (Ed:G. A. Webb), Academic Press, Cambridge, MA, 2011, p. 215.
[25] T. L. Hwang, A. J. Shaka, J. Am. Chem. Soc. 1992, 114, 3157.[26] L. E. Kay, G. Y. Xu, A. U. Singer, D. R. Muhandiram, J. D. Forman-Kay,
J. Magn. Reson. Ser. B 1993, 101, 333.[27] J. R. Edison, R. K. Spencer, G. L. Butterfoss, B. C. Hudson,
A. I. Hochbaum, A. K. Paravastu, R. N. Zuckermann, S. Whitelam,Proc. Natl. Acad. Sci. 2018, 115, 5647.
[28] R. K. Spencer, G. L. Butterfoss, J. R. Edison, J. Eastwood, S. Whitelam,K. Kirshenbaum, R. N. Zuckermann, Biopolymers 2019, e23266.
[29] G. L. Butterfoss, K. Drew, P. D. Renfrew, K. Kirshenbaum,R. Bonneau, Biopolymers 2014, 102, 369.
[30] L. L. Videau, W. B. Arendall, J. S. Richardson, Proteins: Struct. Funct.Bioinform. 2004, 56, 298.
SUPPORTING INFORMATION
Additional supporting information may be found online in the Sup-
porting Information section at the end of this article.
How to cite this article: Roe LT, Pelton JG, Edison JR, et al.
Unconstrained peptoid tetramer exhibits a predominant con-
formation in aqueous solution. Biopolymers. 2019;110:e23267.
https://doi.org/10.1002/bip.23267
10 of 10 ROE ET AL.