special issue the world of wine: economic issues and outlook
TRANSCRIPT

Also in this issue
Is the World Overflowing with Wine? The Global Context for California Wine Supply and DemandDaniel A. Sumner.............................2
The Southern Hemisphere and Global Wine Markets to 2030: Case Study of AustraliaKym Anderson..................................6
European Wine Market Issues and Prospects in the Context of the Changes to the Common Market Organization for WineÉtienne Montaigne.........................9
Looking Forward: Imagining the Market For California Wine in 2030
James T. Lapsely.............................12
V. 13 no. 6 • Jul/Aug 2010
Special Issue The World of Wine: Economic Issues and OutlookNotes from the Guest Editor: Daniel A. Sumner
In conjunction with the 4th Annual Meeting of the American Wine Eco-nomics Association, the Agricultural
Issues Center and the Robert Mondavi Institute for Wine and Food Science Center for Wine Economics held a one-day symposium on “Outlook and Issues for the World Wine Market.” Robert Smiley, wine industry expert and former dean of the UC Davis Gradu-ate School of Management, chaired the event and coordinated the discussion among 150 wine industry participants. The articles in this special issue are based on the four main presentations made at the June 25th symposium held at the University of California, Davis.
Daniel Sumner highlights potential changes in world wine production and consumption that are likely to evolve from changing policy, population, income, and per capita consumption pat-terns around the world. He finds that the U.S. is soon likely to become the world’s largest wine market as consumption in the traditional regions of Europe declines.
Kym Anderson explains how the Southern Hemisphere industry has gone from boom to bust in the recent cycle with prices dropping as production has increased, especially in Australia where prices for bulk wines are now well below costs for many producers.
Étienne Montaigne considers the balance in Europe between reductions in government-created incentives to produce and reductions in government programs to take wine off the market. The EU is paying producers to remove
vines and reducing price supports, while phasing out its long-standing program to pay for distillation of surplus wines.
James Lapsley brings the world wine situation back to California. He analyzes the growing demand for wine among different demographic groups in the United States. He also shows that com-petitive challenges, in part from the suc-cess of the tree nut industry, may make it hard for wineries that use California winegrapes to remain competitive with low-cost wines produced elsewhere.
In addition to these presentations, the symposium featured remarks by two distinguished wine industry leaders. Jon Moramarco, former CEO of Constellation as well as several other major interna-tional wine companies and now president of Winebow, a major importer, provided insight especially about European and global issues. Tom Selfridge, former CEO of Hess Collection and other premium wine firms and now an industry consul-tant, opened the discussion of U.S. issues with perceptive comments about how he saw the U.S. wine market evolving.
The world of wine, especially in the lower price categories that dominate total volumes, faces many challenges for producers. The consumer base is grow-ing and the quality of low-end wine may be better than ever. But, as often happens in agriculture, producers face periodic low prices and losses that must be made up during periods of higher prices. The current challenging period will end, but probably not before severe losses drive many producers to the edge.
Daniel Sumner and the other authors of this special issue would like to express their appreciation to John Thomas Rosen-Molina for his valuable contributions to all four articles.

Giannini Foundation of Agricultural Economics • University of California2
To set the stage for the regional perspectives to follow, this article provides an overview of the situ-
ation and outlook for wine that affect all regions and may be particularly crucial for California. Here I review recent production and consumption patterns in order to better understand how the future is likely to evolve. I also use simple statistical projec-tions of consumption that can be the basis for considering more complex changes likely to occur over the next few decades. Finally, I consider some supply and demand drivers and addi-tional factors that are likely to influ-ence how wine markets evolve.
One of the most interesting features of wine markets is the differentiation by product characteristics and price. A first step to getting our bearing in the world of wine, however, is to consider wine markets in aggregate without breaking down the numbers by price grouping, variety, or other specifics. We know that not all wine markets move together, but getting a sense of the aggregates will provide a background to discussions of the markets differ-entiated by product characteristics.
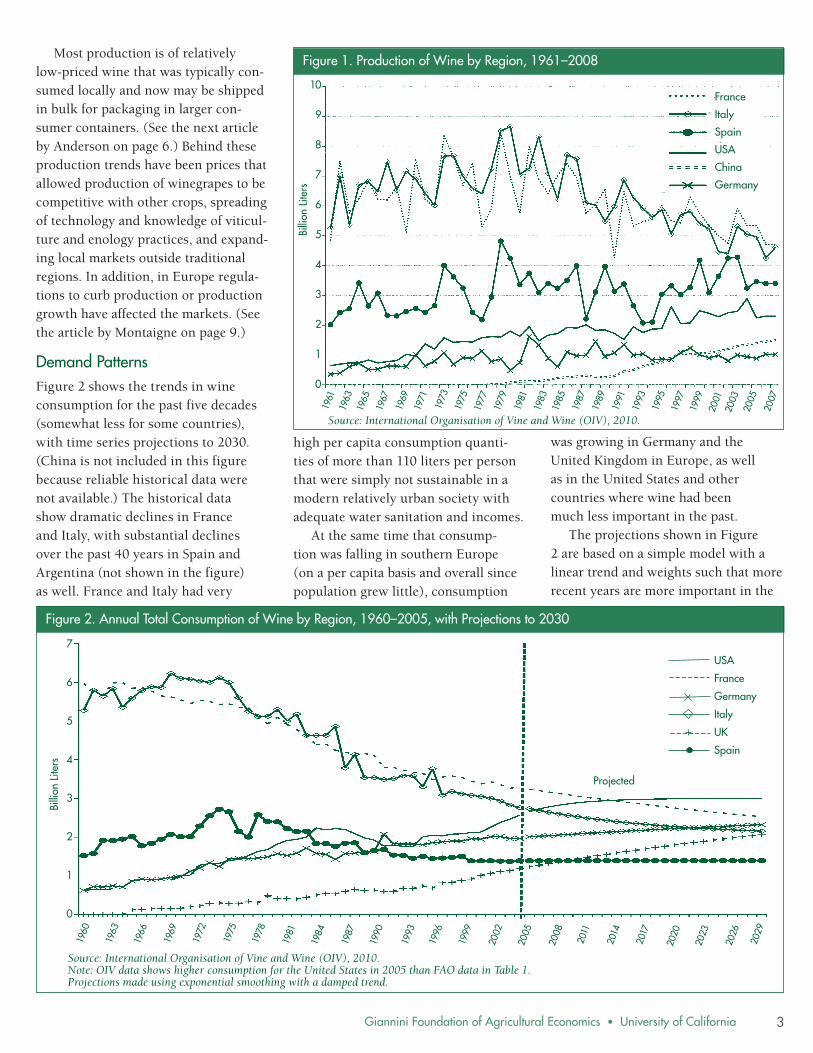
Production PatternsFigure 1 shows that wine produc-tion in the big production nations of France and Italy rose through about 1980, before declining by almost half. Production in Spain and Argen-tina (not shown in the figure) grew during the 1960s and 1970s and, since then, has been variable. Over the same period, production has grown in the United States (steadily), Ger-many (in the early years), and China (especially in recent years). Produc-tion growth has also been rapid for the Southern Hemisphere exporters: Australia, Chile, and South Africa.
Is the World Overflowing with Wine? The Global Context for California Wine Supply and DemandDaniel A. Sumner
Table 1. Wine Production 20081 and Consumption 20071, by Country
CountryProduction Consumption
(billion liters)
France 4.7 3.3
Italy 4.6 2.6
Spain 3.4 1.6
U.S.A. 2.3 2.1
Argentina 1.5 1.1
China 1.5 1.6
Germany 1.0 2.0
UK (minor) 1.2
Total of listed countries
19.1 15.5
World 27.3 24.0
Share of listed countries
70% 64%
Source: FAOSTAT. 2010. http://faostat.fao.org/site/636/Desktop/Default.aspx?PageID= 636#ancor.1 Latest available data.
Wine consumption is shifting from southern Europe to less traditional wine regions while production is also shifting, but more slowly. Projections suggest leveling of per capita consumption, but major regions, such as the Middle East will continue to be largely outside the wine world.
For the past few decades the main trends in the world of wine have been the continued rapid decline in wine consumption in the traditional produc-ing and consuming countries of Europe, especially the big three—France, Italy, and Spain. Over the same period, pro-duction in those countries has also been steady or declined as well. These trends matter because the world of wine continues to revolve around what happens in the big three, which pro-duce about half and consume about 30% of all the wine in the world.
Table 1 shows the top eight wine-consuming nations and the top seven producers. These countries account for about two-thirds of production and almost two-thirds of consumption. The United States is the number three consumer, the number four producer, and is a small net exporter. Germany is a significant producer but a major net importer. Within Europe, the UK is a major consumer, but not a producer.
Among the consumers outside Europe, only the United States, China, and Argentina make the list. China, with a huge population, growing income, and a tradition of consuming alcoholic beverages, is the only nation outside Europe and the Americas to make the list of top consumers and producers. Just outside the list of top producers are significant wine produc-ers with relatively small consuming populations, such as Australia, South Africa, and Chile, and significant European consumers and produc-ers, such as Romania and Portugal.
Important questions for the future are where production and consumption are going over the next two decades. First, let us consider the trends on pro-duction over the past half century or so.
3Giannini Foundation of Agricultural Economics • University of California
Figure 1. Production of Wine by Region, 1961–2008
Billi
on L
iters
France
Italy
Spain
USA
China
Germany
10
9
8
7
6
5
4
3
2
1
0
1999
1997
2005
2003
2001
1963
1961
1983
1981
1979
1977
1975
1971
1969
1967
1965
1991
1989
1987
1985
1995
1993
1973
2007
Source: International Organisation of Vine and Wine (OIV), 2010.
Most production is of relatively low-priced wine that was typically con-sumed locally and now may be shipped in bulk for packaging in larger con-sumer containers. (See the next article by Anderson on page 6.) Behind these production trends have been prices that allowed production of winegrapes to be competitive with other crops, spreading of technology and knowledge of viticul-ture and enology practices, and expand-ing local markets outside traditional regions. In addition, in Europe regula-tions to curb production or production growth have affected the markets. (See the article by Montaigne on page 9.)
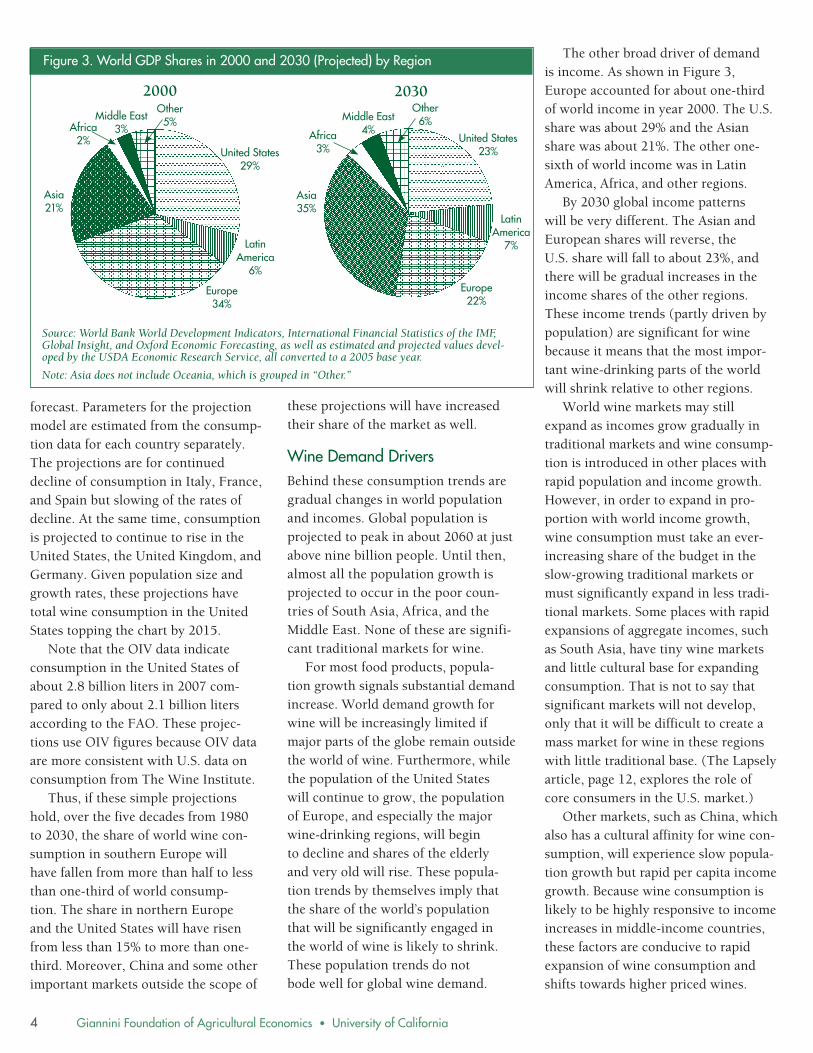
Demand PatternsFigure 2 shows the trends in wine consumption for the past five decades (somewhat less for some countries), with time series projections to 2030. (China is not included in this figure because reliable historical data were not available.) The historical data show dramatic declines in France and Italy, with substantial declines over the past 40 years in Spain and Argentina (not shown in the figure) as well. France and Italy had very
high per capita consumption quanti-ties of more than 110 liters per person that were simply not sustainable in a modern relatively urban society with adequate water sanitation and incomes.
At the same time that consump-tion was falling in southern Europe (on a per capita basis and overall since population grew little), consumption
was growing in Germany and the United Kingdom in Europe, as well as in the United States and other countries where wine had been much less important in the past.
The projections shown in Figure 2 are based on a simple model with a linear trend and weights such that more recent years are more important in the
Figure 2. Annual Total Consumption of Wine by Region, 1960–2005, with Projections to 203020
17
2014
2026
2023
2020
1963
1960
1993
1990
1987
1984
1981
1975
1972
1969
1966
2005
2002
1999
1996
2011
2008
1978
2029
Projected
USA
France
Germany
Italy
UK
Spain
7
6
5
4
3
2
1
0
Billi
on L
iters
Source: International Organisation of Vine and Wine (OIV), 2010. Note: OIV data shows higher consumption for the United States in 2005 than FAO data in Table 1. Projections made using exponential smoothing with a damped trend.
Giannini Foundation of Agricultural Economics • University of California4
forecast. Parameters for the projection model are estimated from the consump-tion data for each country separately. The projections are for continued decline of consumption in Italy, France, and Spain but slowing of the rates of decline. At the same time, consumption is projected to continue to rise in the United States, the United Kingdom, and Germany. Given population size and growth rates, these projections have total wine consumption in the United States topping the chart by 2015.
Note that the OIV data indicate consumption in the United States of about 2.8 billion liters in 2007 com-pared to only about 2.1 billion liters according to the FAO. These projec-tions use OIV figures because OIV data are more consistent with U.S. data on consumption from The Wine Institute.
Thus, if these simple projections hold, over the five decades from 1980 to 2030, the share of world wine con-sumption in southern Europe will have fallen from more than half to less than one-third of world consump-tion. The share in northern Europe and the United States will have risen from less than 15% to more than one-third. Moreover, China and some other important markets outside the scope of
these projections will have increased their share of the market as well.
Wine Demand DriversBehind these consumption trends are gradual changes in world population and incomes. Global population is projected to peak in about 2060 at just above nine billion people. Until then, almost all the population growth is projected to occur in the poor coun-tries of South Asia, Africa, and the Middle East. None of these are signifi-cant traditional markets for wine.
For most food products, popula-tion growth signals substantial demand increase. World demand growth for wine will be increasingly limited if major parts of the globe remain outside the world of wine. Furthermore, while the population of the United States will continue to grow, the population of Europe, and especially the major wine-drinking regions, will begin to decline and shares of the elderly and very old will rise. These popula-tion trends by themselves imply that the share of the world’s population that will be significantly engaged in the world of wine is likely to shrink. These population trends do not bode well for global wine demand.
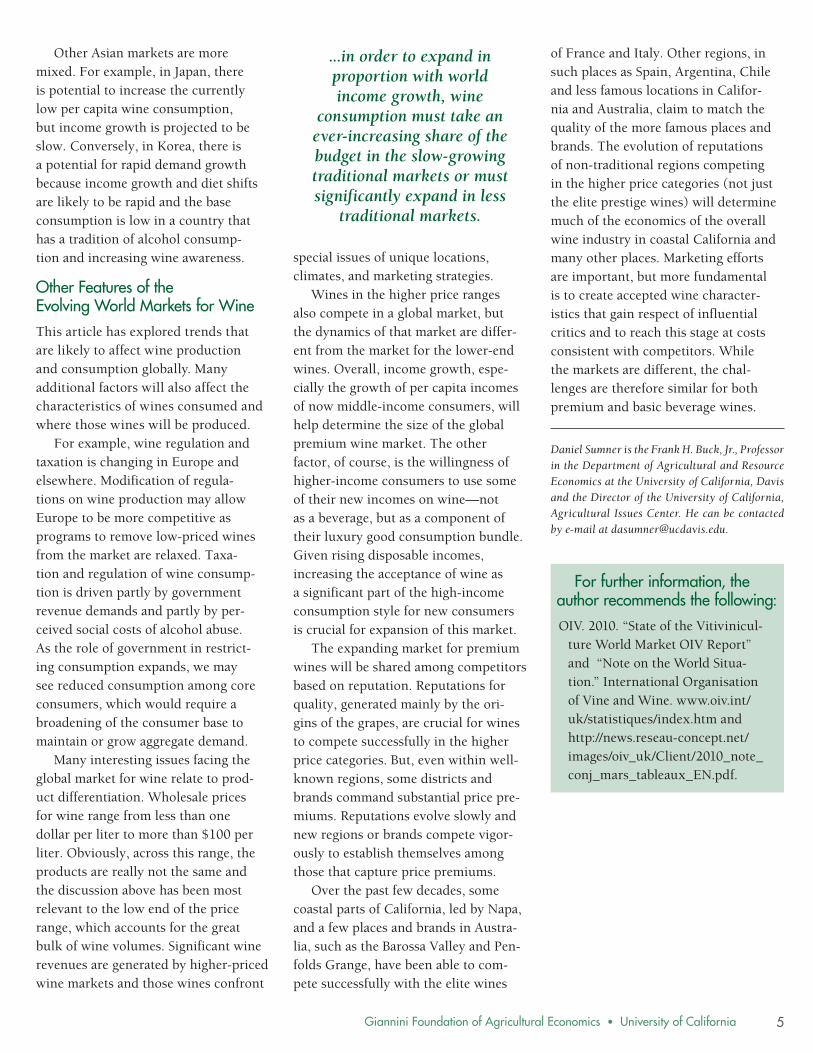
The other broad driver of demand is income. As shown in Figure 3, Europe accounted for about one-third of world income in year 2000. The U.S. share was about 29% and the Asian share was about 21%. The other one-sixth of world income was in Latin America, Africa, and other regions.
By 2030 global income patterns will be very different. The Asian and European shares will reverse, the U.S. share will fall to about 23%, and there will be gradual increases in the income shares of the other regions. These income trends (partly driven by population) are significant for wine because it means that the most impor-tant wine-drinking parts of the world will shrink relative to other regions.
World wine markets may still expand as incomes grow gradually in traditional markets and wine consump-tion is introduced in other places with rapid population and income growth. However, in order to expand in pro-portion with world income growth, wine consumption must take an ever-increasing share of the budget in the slow-growing traditional markets or must significantly expand in less tradi-tional markets. Some places with rapid expansions of aggregate incomes, such as South Asia, have tiny wine markets and little cultural base for expanding consumption. That is not to say that significant markets will not develop, only that it will be difficult to create a mass market for wine in these regions with little traditional base. (The Lapsely article, page 12, explores the role of core consumers in the U.S. market.)
Other markets, such as China, which also has a cultural affinity for wine con-sumption, will experience slow popula-tion growth but rapid per capita income growth. Because wine consumption is likely to be highly responsive to income increases in middle-income countries, these factors are conducive to rapid expansion of wine consumption and shifts towards higher priced wines.
Figure 3. World GDP Shares in 2000 and 2030 (Projected) by Region
Source: World Bank World Development Indicators, International Financial Statistics of the IMF, Global Insight, and Oxford Economic Forecasting, as well as estimated and projected values devel-oped by the USDA Economic Research Service, all converted to a 2005 base year.
Note: Asia does not include Oceania, which is grouped in “Other.”
2030
Middle East4%Africa
3%
Asia 35%
Europe 22%
Latin America
7%
United States 23%
Other 6%
2000
Middle East3%Africa
2%
Asia 21%
Europe 34%
Latin America
6%
United States 29%
Other 5%
5Giannini Foundation of Agricultural Economics • University of California
Other Asian markets are more mixed. For example, in Japan, there is potential to increase the currently low per capita wine consumption, but income growth is projected to be slow. Conversely, in Korea, there is a potential for rapid demand growth because income growth and diet shifts are likely to be rapid and the base consumption is low in a country that has a tradition of alcohol consump-tion and increasing wine awareness.
Other Features of the Evolving World Markets for WineThis article has explored trends that are likely to affect wine production and consumption globally. Many additional factors will also affect the characteristics of wines consumed and where those wines will be produced.
For example, wine regulation and taxation is changing in Europe and elsewhere. Modification of regula-tions on wine production may allow Europe to be more competitive as programs to remove low-priced wines from the market are relaxed. Taxa-tion and regulation of wine consump-tion is driven partly by government revenue demands and partly by per-ceived social costs of alcohol abuse. As the role of government in restrict-ing consumption expands, we may see reduced consumption among core consumers, which would require a broadening of the consumer base to maintain or grow aggregate demand.
Many interesting issues facing the global market for wine relate to prod-uct differentiation. Wholesale prices for wine range from less than one dollar per liter to more than $100 per liter. Obviously, across this range, the products are really not the same and the discussion above has been most relevant to the low end of the price range, which accounts for the great bulk of wine volumes. Significant wine revenues are generated by higher-priced wine markets and those wines confront
Daniel Sumner is the Frank H. Buck, Jr., Professor in the Department of Agricultural and Resource Economics at the University of California, Davis and the Director of the University of California, Agricultural Issues Center. He can be contacted by e-mail at [email protected].
For further information, the author recommends the following:OIV. 2010. “State of the Vitivinicul-
ture World Market OIV Report” and “Note on the World Situa-tion.” International Organisation of Vine and Wine. www.oiv.int/uk/statistiques/index.htm and http://news.reseau-concept.net/images/oiv_uk/Client/2010_note_conj_mars_tableaux_EN.pdf.
special issues of unique locations, climates, and marketing strategies.
Wines in the higher price ranges also compete in a global market, but the dynamics of that market are differ-ent from the market for the lower-end wines. Overall, income growth, espe-cially the growth of per capita incomes of now middle-income consumers, will help determine the size of the global premium wine market. The other factor, of course, is the willingness of higher-income consumers to use some of their new incomes on wine—not as a beverage, but as a component of their luxury good consumption bundle. Given rising disposable incomes, increasing the acceptance of wine as a significant part of the high-income consumption style for new consumers is crucial for expansion of this market.
The expanding market for premium wines will be shared among competitors based on reputation. Reputations for quality, generated mainly by the ori-gins of the grapes, are crucial for wines to compete successfully in the higher price categories. But, even within well-known regions, some districts and brands command substantial price pre-miums. Reputations evolve slowly and new regions or brands compete vigor-ously to establish themselves among those that capture price premiums.
Over the past few decades, some coastal parts of California, led by Napa, and a few places and brands in Austra-lia, such as the Barossa Valley and Pen-folds Grange, have been able to com-pete successfully with the elite wines
of France and Italy. Other regions, in such places as Spain, Argentina, Chile and less famous locations in Califor-nia and Australia, claim to match the quality of the more famous places and brands. The evolution of reputations of non-traditional regions competing in the higher price categories (not just the elite prestige wines) will determine much of the economics of the overall wine industry in coastal California and many other places. Marketing efforts are important, but more fundamental is to create accepted wine character-istics that gain respect of influential critics and to reach this stage at costs consistent with competitors. While the markets are different, the chal-lenges are therefore similar for both premium and basic beverage wines.
...in order to expand in proportion with world income growth, wine
consumption must take an ever-increasing share of the budget in the slow-growing traditional markets or must significantly expand in less
traditional markets.

Giannini Foundation of Agricultural Economics • University of California6
Twenty five years ago, the Southern Hemisphere contributed 12% of the world’s wine production and
1% of global exports. By 2009, however, it accounted for 18% of global produc-tion and a huge 27% of global wine exports. Australia’s export-led growth is particularly striking, its shares rising from barely 1% to more than 4% of global production and from a mere 0.2% to 9% of global exports. Australia now exports two-thirds of its output (up from 2% in 1980–84), and is now the world’s fourth largest wine exporter after France, Italy, and Spain. The huge vineyard expansion needed to deliver that dramatic transformation also has caused the stocks-to-sales ratio to spike.
In light of the current global over-supply situation, and drawing also on lessons from past booms, this paper focuses on how the Australian wine industry’s international competitive-ness and market shares might evolve over the next two decades. The longer term should see Australia trading its way out of the current surplus and back to expanding its global market share, especially in value terms as produc-ers seek to differentiate their product more and focus on raising quality.
The Wine Industry in the New and Old WorldThe spurt of vineyard plantings from the mid-1990s, first in Australia and
early 1980s (to 18%), and its share of global exports has risen from 1% to 27%. That export growth has been at the expense of not only Western Euro-pean suppliers, but also the rest of the world whose share of global wine exports has dropped from 22% to 9%.
The decline in consumption in tradi-tional wine-exporting countries (and in Argentina) has been matched by con-sumption growth in other New World countries, in wine-importing countries of Europe, and, most recently, in East Asia.
Winery Size and ConcentrationAnother important feature that distinguishes the Old and New World producers is the size and ownership of wineries. In the New World, it is not uncommon for the largest firm to account for one-quarter of sales. In the cases of Chile and South Africa, the biggest firm’s share is close to one-third. The share of the two or three next-biggest firms also is huge except in South Africa, such that the many medium and small wineries account for only a minority of sales. The latter are mainly family companies, but the large firms are typically listed national companies or multinationals operating in several countries. By contrast, in the traditional producing countries of Europe, the shares of the four largest wineries are tiny, accounting for between 4% and 20% of total sales. (In China the top four account for 28%.)
This difference in firm concentra-tion may well be important as both the Old and New World producers seek to obtain retail shelf space in a world in which large supermarkets are becoming ever-more dominant as outlets for wine sales. If negotiating strength is related to size, small and
The Southern Hemisphere and Global Wine Markets to 2030: Case Study of AustraliaKym Anderson
then followed by other New World countries, has led to wine produc-tion growing far faster than wine consumption in the Southern Hemi-sphere. Initially, that output growth was driven by perceived export growth prospects as baby boomers reached middle age and supermarkets became a major outlet for retail wine sales.
However, the expansion in those export markets has been temporarily halted by the recessions on each side of the North Atlantic. The Southern Hemi-sphere has thus added to the chronic surpluses in Europe’s wine-exporting countries (due to steeply declining wine consumption and slow adjustment by producers in those traditional markets). It has resulted in major declines recently in prices of grapes and wine, and in values of vineyard and winery assets in Australia, New Zealand, and elsewhere.
Booms and crises are not new to Southern Hemisphere wine producers, nor to wine markets in the rest of the world. Indeed they are normal for capi-tal-intensive perennial crops, albeit with long cycles. That does not make the pain any easier for current producers though. Nor does it mean the pathway and speed of return to profitability are obvious, for the forces behind the latest cycle are different from those associated with pre-vious cycles. In particular, the world’s wine markets have become far more globalized over the past two decades, which has both broadened the market opportunities and increased the chal-lenges from international competition.
Even as export volumes have grown, the share of global exports from the top five European suppliers has fallen from just over three-quarters to just under three-fifths. The Southern Hemi-sphere share of global wine produc-tion has increased by half since the
Much like wine industries across the world, the Australian and Southern Hemisphere wine industry has been hit hard by the global recession and declining prices. Nonetheless, the Australian wine industry is well-positioned to recover from the current market situation.
7Giannini Foundation of Agricultural Economics • University of California
Figure 2. Volume and Average Price of Export Sales of Australian Wine, 1980–81 to 2008–09 (Million Liters and Australian Cents per Liter)
Source: Authors’ derivation from data at www.awbc.com.au.
1982
-83
1980
-81
2004
-05
2002
-03
2000
-01
1998
-99
1996
-97
1990
-91
1988
-89
1986
-87
1984
-85
2008
-09
2006
-07
1994
-95
1992
-93
Price
Volume
600
500
400
300
200
100
0
Pric
e (c
ents
per
lite
r)
900
800
700
600
500
400
300
200
100
0
Tota
l Win
e Ex
ports
(mill
ion
liter
s)
medium-sized wineries may struggle in negotiating with such retailers.
As well, in the United States the number of wholesale distributors in each state has fallen dramatically, so there too it may be the biggest wineries that capture the lion’s share of the import-ers’ attention. On the other hand, listed companies are always under pressure to deliver good news in their quarterly reports to shareholders, so some of the large wineries may look to shed assets or even vacate the industry if a long recovery period from the current over-supply situation appears likely.
Such moves could provide oppor-tunities for those smaller, often unlisted firms that are in the busi-ness for the long haul: they may be able to acquire selected assets at fire-sale prices, thereby underwrit-ing their prosperity as the industry recovers from its current surpluses.
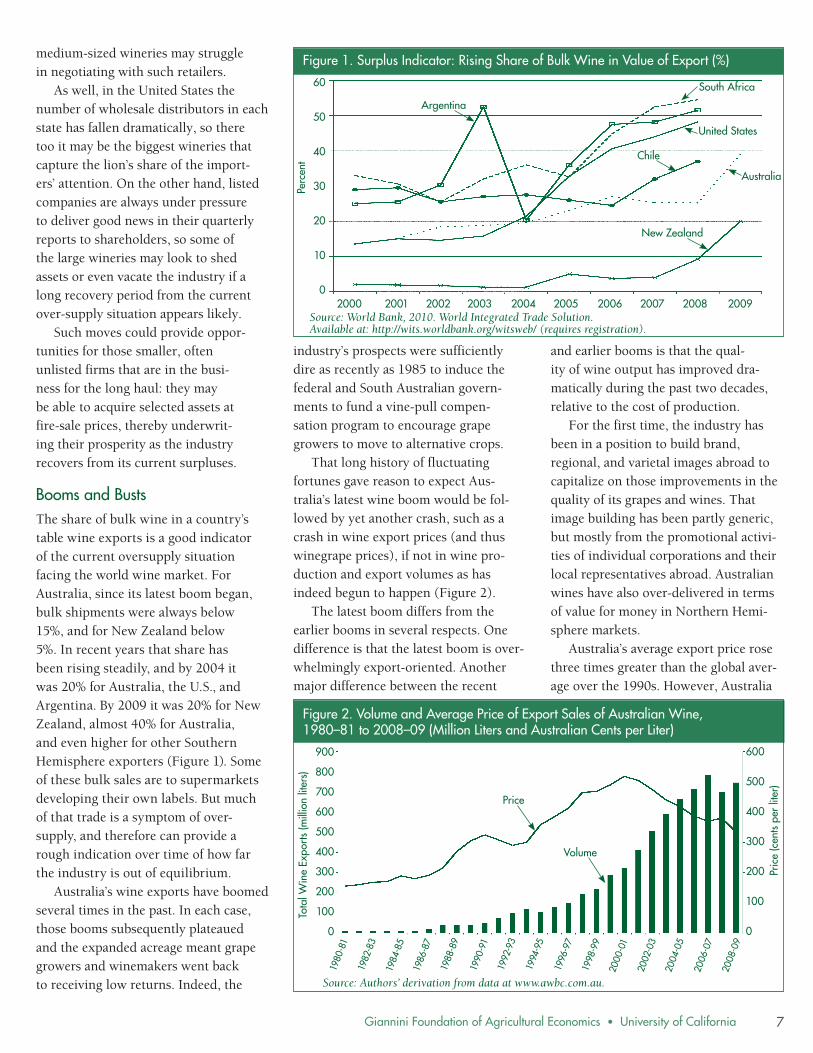
Booms and BustsThe share of bulk wine in a country’s table wine exports is a good indicator of the current oversupply situation facing the world wine market. For Australia, since its latest boom began, bulk shipments were always below 15%, and for New Zealand below 5%. In recent years that share has been rising steadily, and by 2004 it was 20% for Australia, the U.S., and Argentina. By 2009 it was 20% for New Zealand, almost 40% for Australia, and even higher for other Southern Hemisphere exporters (Figure 1). Some of these bulk sales are to supermarkets developing their own labels. But much of that trade is a symptom of over-supply, and therefore can provide a rough indication over time of how far the industry is out of equilibrium.
Australia’s wine exports have boomed several times in the past. In each case, those booms subsequently plateaued and the expanded acreage meant grape growers and winemakers went back to receiving low returns. Indeed, the
industry’s prospects were sufficiently dire as recently as 1985 to induce the federal and South Australian govern-ments to fund a vine-pull compen-sation program to encourage grape growers to move to alternative crops.
That long history of fluctuating fortunes gave reason to expect Aus-tralia’s latest wine boom would be fol-lowed by yet another crash, such as a crash in wine export prices (and thus winegrape prices), if not in wine pro-duction and export volumes as has indeed begun to happen (Figure 2).
The latest boom differs from the earlier booms in several respects. One difference is that the latest boom is over-whelmingly export-oriented. Another major difference between the recent
and earlier booms is that the qual-ity of wine output has improved dra-matically during the past two decades, relative to the cost of production.
For the first time, the industry has been in a position to build brand, regional, and varietal images abroad to capitalize on those improvements in the quality of its grapes and wines. That image building has been partly generic, but mostly from the promotional activi-ties of individual corporations and their local representatives abroad. Australian wines have also over-delivered in terms of value for money in Northern Hemi-sphere markets.
Australia’s average export price rose three times greater than the global aver-age over the 1990s. However, Australia
Figure 1. Surplus Indicator: Rising Share of Bulk Wine in Value of Export (%)
Source: World Bank, 2010. World Integrated Trade Solution. Available at: http://wits.worldbank.org/witsweb/ (requires registration).
60
50
40
30
20
10
0Pe
rcen
t2000 2001 2002 2003 2004 2005 2006 2007 2008 2009
Argentina
United States
South Africa
New Zealand
Chile
Australia
Giannini Foundation of Agricultural Economics • University of California8
2008
-09
2007
-08
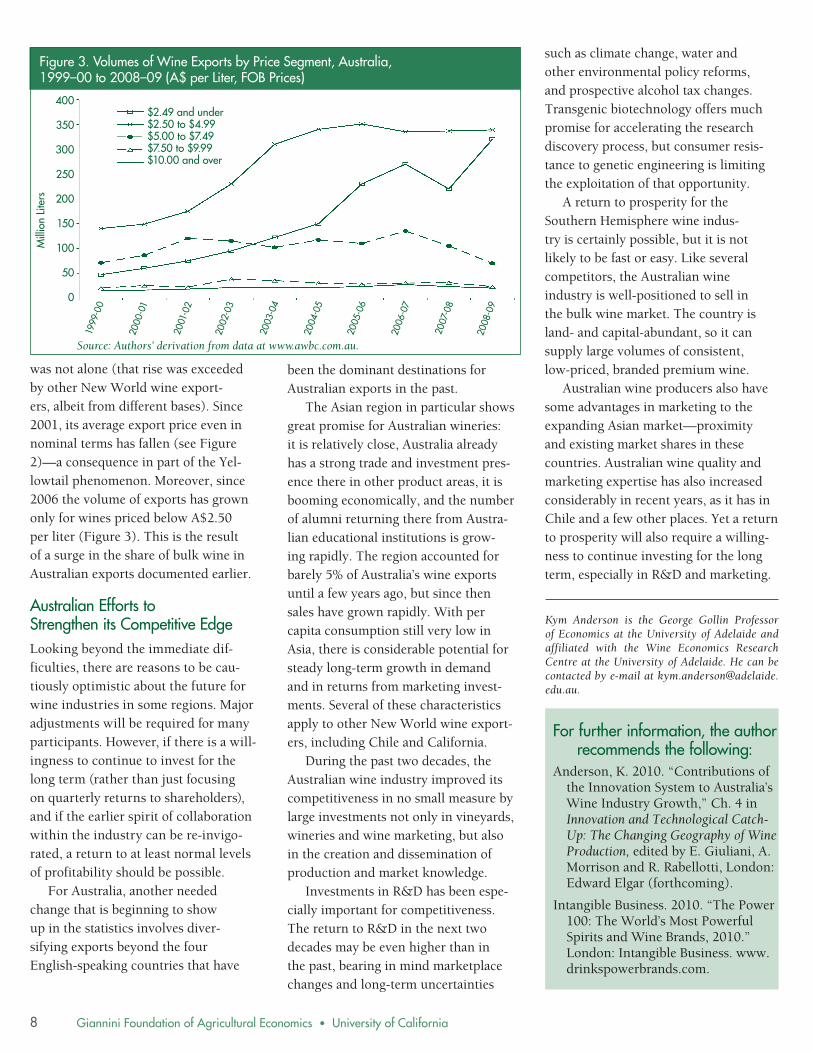
Figure 3. Volumes of Wine Exports by Price Segment, Australia, 1999–00 to 2008–09 (A$ per Liter, FOB Prices)
$2.49 and under$2.50 to $4.99$5.00 to $7.49$7.50 to $9.99$10.00 and over
400
350
300
250
200
150
100
50
0
Mill
ion
Liter
s
2000
-01
1999
-00
2004
-05
2003
-04
2002
-03
2001
-02
2006
-07
2005
-06
Source: Authors’ derivation from data at www.awbc.com.au.
was not alone (that rise was exceeded by other New World wine export-ers, albeit from different bases). Since 2001, its average export price even in nominal terms has fallen (see Figure 2)—a consequence in part of the Yel-lowtail phenomenon. Moreover, since 2006 the volume of exports has grown only for wines priced below A$2.50 per liter (Figure 3). This is the result of a surge in the share of bulk wine in Australian exports documented earlier.
Australian Efforts to Strengthen its Competitive Edge Looking beyond the immediate dif-ficulties, there are reasons to be cau-tiously optimistic about the future for wine industries in some regions. Major adjustments will be required for many participants. However, if there is a will-ingness to continue to invest for the long term (rather than just focusing on quarterly returns to shareholders), and if the earlier spirit of collaboration within the industry can be re-invigo-rated, a return to at least normal levels of profitability should be possible.
For Australia, another needed change that is beginning to show up in the statistics involves diver-sifying exports beyond the four English-speaking countries that have
been the dominant destinations for Australian exports in the past.
The Asian region in particular shows great promise for Australian wineries: it is relatively close, Australia already has a strong trade and investment pres-ence there in other product areas, it is booming economically, and the number of alumni returning there from Austra-lian educational institutions is grow-ing rapidly. The region accounted for barely 5% of Australia’s wine exports until a few years ago, but since then sales have grown rapidly. With per capita consumption still very low in Asia, there is considerable potential for steady long-term growth in demand and in returns from marketing invest-ments. Several of these characteristics apply to other New World wine export-ers, including Chile and California.
During the past two decades, the Australian wine industry improved its competitiveness in no small measure by large investments not only in vineyards, wineries and wine marketing, but also in the creation and dissemination of production and market knowledge.
Investments in R&D has been espe-cially important for competitiveness. The return to R&D in the next two decades may be even higher than in the past, bearing in mind marketplace changes and long-term uncertainties
such as climate change, water and other environmental policy reforms, and prospective alcohol tax changes. Transgenic biotechnology offers much promise for accelerating the research discovery process, but consumer resis-tance to genetic engineering is limiting the exploitation of that opportunity.
A return to prosperity for the Southern Hemisphere wine indus-try is certainly possible, but it is not likely to be fast or easy. Like several competitors, the Australian wine industry is well-positioned to sell in the bulk wine market. The country is land- and capital-abundant, so it can supply large volumes of consistent, low-priced, branded premium wine.
Australian wine producers also have some advantages in marketing to the expanding Asian market—proximity and existing market shares in these countries. Australian wine quality and marketing expertise has also increased considerably in recent years, as it has in Chile and a few other places. Yet a return to prosperity will also require a willing-ness to continue investing for the long term, especially in R&D and marketing.
Kym Anderson is the George Gollin Professor of Economics at the University of Adelaide and affiliated with the Wine Economics Research Centre at the University of Adelaide. He can be contacted by e-mail at [email protected].
For further information, the author recommends the following:
Anderson, K. 2010. “Contributions of the Innovation System to Australia’s Wine Industry Growth,” Ch. 4 in Innovation and Technological Catch-Up: The Changing Geography of Wine Production, edited by E. Giuliani, A. Morrison and R. Rabellotti, London: Edward Elgar (forthcoming).
Intangible Business. 2010. “The Power 100: The World’s Most Powerful Spirits and Wine Brands, 2010.” London: Intangible Business. www.drinkspowerbrands.com.

9Giannini Foundation of Agricultural Economics • University of California
The European wine market has undergone two recent economic dislocations. The first started
in 2004, with oversupply of wine on world markets, and the impact of this oversupply continues to affect mainly low-cost wines. The second slump started in 2008, with the global finan-cial crisis and recession in Europe and America, which reduced incomes and increased uncertainty. The high-quality wines, such as Champagne and the famous wines of Burgundy and Bordeaux, were the most significantly affected by this “demand shock.”
The long-evolving changes to the European Union (EU) Common Market Organization for wine (CMO) were finally agreed to in 2008 in the context of these severe market concerns. These policy and program changes have not yet been fully implemented, but are intended to improve the economic prospects of EU producers by reducing overproduction and increasing the com-petitiveness of EU wines on the world market. Under the CMO, member states in the EU that produce wine, such as Spain or France, choose a set of specific mechanisms among a common “menu.”
The most important program is the replacement of up to 175,000 hectares of winegrapes with other crops in just four years. Currently, planting of vines is tightly restricted to specific parcels of land in most regions. Therefore, this removal of
winegrape acreage, by removing vines, is designed to lead to smaller harvests.
The CMO will also include sup-port programs aimed to increase the competitiveness of the European wine industry through promotion, a single-payment program, and increased investment. New regulatory measures in the CMO are also intended to help revitalize the European wine industry.
Supply, Demand and Trade Background Viticulture is a traditional and impor-tant European agricultural activity, particularly in the south of Europe and in the new member states of the southern central and Eastern Euro-pean countries. In the EU, Spain has about 30% of the European winegrape area, whereas France has 20%, and Italy 22% (Figure 1).
The gap between European wine production and consumption has
widened in recent years. In the 2008/2009 wine year, the EU produced 17.3 billion liters, including about 10.5 billion liters of ordinary wine and 6.8 billion liters of higher qual-ity wines. That year, EU consumption amounted to 13.5 billion liters of wine.
In 2006, the last year for which con-sistent data are readily available, the EU wine industry exported 6.2 billion liters of wine, of which about 4.5 billion liters were shipped within the EU, and about 1.7 billion liters were exported to coun-tries outside the EU. In 2006, coun-tries in the European Union imported 5.8 billion liters, of which 1.2 billion liters came from non-EU countries.
European viticulture is facing global competition and the wine industry must adapt to a changing world. During the last half-century, vineyard area has been decreasing in Europe, but still the large Mediterranean countries account for most of the winegrape area. (The
European Wine Market Issues and Prospects in the Context of the Changes to the Common Market Organization for WineÉtienne Montaigne
The European Union introduced its new Common Market Organization (CMO) to reduce production, reduce government disposal, and increase market demand for low-priced wines. It is not clear if European wine exports will decrease as a result of the CMO.
Figure 1. Area Occupied by European Vineyards, in Thousand Hectares, 2009
Source: OIV 2010. Note: Includes vat vines, table wines, dried grapes, in production or awaiting production.
Italy818
Portugal 243
France 840
Others 485
Romania 205
Spain 1,113
Total = 3,704 thousand hectares
Giannini Foundation of Agricultural Economics • University of California10
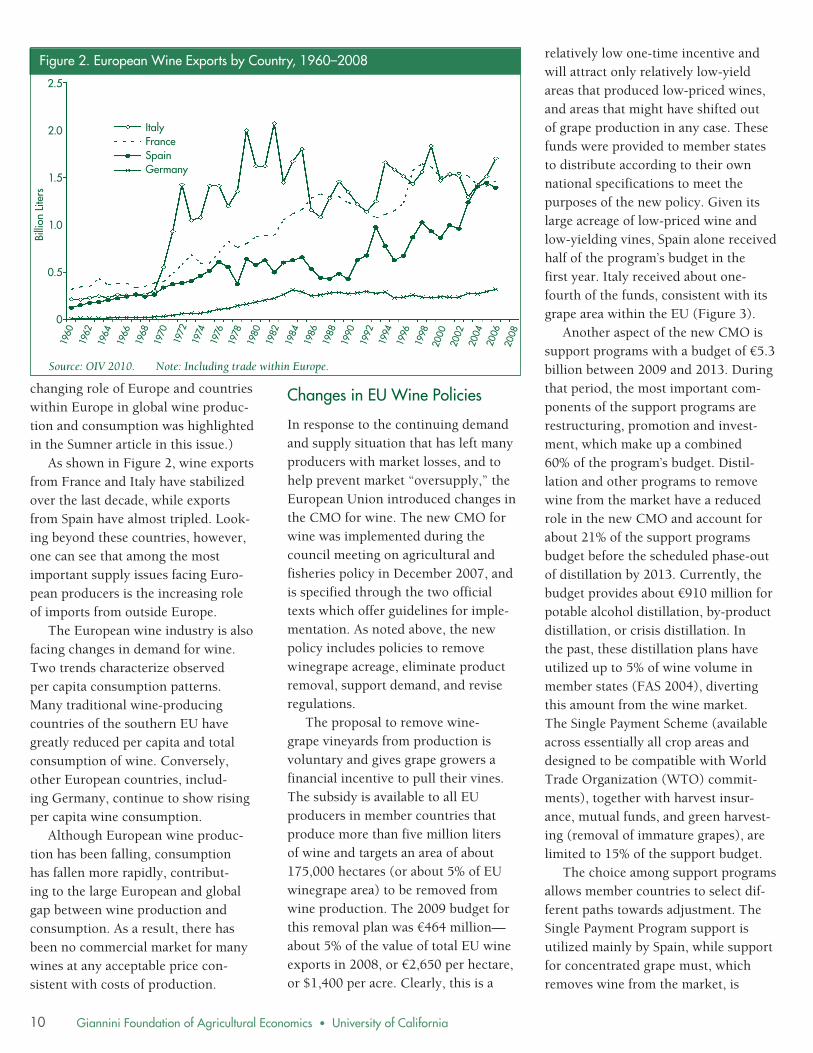
changing role of Europe and countries within Europe in global wine produc-tion and consumption was highlighted in the Sumner article in this issue.)
As shown in Figure 2, wine exports from France and Italy have stabilized over the last decade, while exports from Spain have almost tripled. Look-ing beyond these countries, however, one can see that among the most important supply issues facing Euro-pean producers is the increasing role of imports from outside Europe.
The European wine industry is also facing changes in demand for wine. Two trends characterize observed per capita consumption patterns. Many traditional wine-producing countries of the southern EU have greatly reduced per capita and total consumption of wine. Conversely, other European countries, includ-ing Germany, continue to show rising per capita wine consumption.
Although European wine produc-tion has been falling, consumption has fallen more rapidly, contribut-ing to the large European and global gap between wine production and consumption. As a result, there has been no commercial market for many wines at any acceptable price con-sistent with costs of production.
Changes in EU Wine Policies
In response to the continuing demand and supply situation that has left many producers with market losses, and to help prevent market “oversupply,” the European Union introduced changes in the CMO for wine. The new CMO for wine was implemented during the council meeting on agricultural and fisheries policy in December 2007, and is specified through the two official texts which offer guidelines for imple-mentation. As noted above, the new policy includes policies to remove winegrape acreage, eliminate product removal, support demand, and revise regulations.
The proposal to remove wine-grape vineyards from production is voluntary and gives grape growers a financial incentive to pull their vines. The subsidy is available to all EU producers in member countries that produce more than five million liters of wine and targets an area of about 175,000 hectares (or about 5% of EU winegrape area) to be removed from wine production. The 2009 budget for this removal plan was €464 million—about 5% of the value of total EU wine exports in 2008, or €2,650 per hectare, or $1,400 per acre. Clearly, this is a
relatively low one-time incentive and will attract only relatively low-yield areas that produced low-priced wines, and areas that might have shifted out of grape production in any case. These funds were provided to member states to distribute according to their own national specifications to meet the purposes of the new policy. Given its large acreage of low-priced wine and low-yielding vines, Spain alone received half of the program’s budget in the first year. Italy received about one- fourth of the funds, consistent with its grape area within the EU (Figure 3).
Another aspect of the new CMO is support programs with a budget of €5.3 billion between 2009 and 2013. During that period, the most important com-ponents of the support programs are restructuring, promotion and invest-ment, which make up a combined 60% of the program’s budget. Distil-lation and other programs to remove wine from the market have a reduced role in the new CMO and account for about 21% of the support programs budget before the scheduled phase-out of distillation by 2013. Currently, the budget provides about €910 million for potable alcohol distillation, by-product distillation, or crisis distillation. In the past, these distillation plans have utilized up to 5% of wine volume in member states (FAS 2004), diverting this amount from the wine market. The Single Payment Scheme (available across essentially all crop areas and designed to be compatible with World Trade Organization (WTO) commit-ments), together with harvest insur-ance, mutual funds, and green harvest-ing (removal of immature grapes), are limited to 15% of the support budget.
The choice among support programs allows member countries to select dif-ferent paths towards adjustment. The Single Payment Program support is utilized mainly by Spain, while support for concentrated grape must, which removes wine from the market, is
Figure 2. European Wine Exports by Country, 1960–2008
Source: OIV 2010. Note: Including trade within Europe.
1998
1996
2004
2002
2000
1962
1960
1982
1980
1978
1976
1974
1970
1968
1966
1964
1990
1988
1986
1984
1994
1992
1972
2006
2008
ItalyFranceSpainGermany
2.5
2.0
1.5
1.0
0.5
0
Billi
on L
iters

11Giannini Foundation of Agricultural Economics • University of California
utilized by France and Italy. There are payments for green harvesting, which also removes production from the market and occurs primarily in Italy.
Overall, the CMO allows each member state a large degree of freedom in spending its budget, which may be thought of as a form of “nationaliza-tion” of the common wine policy. There is also a large historical effect on reform, in the sense that former budget amounts that were devoted to wine remain in place. The new CMO for wine did not achieve budget savings for the European Union.
The CMO reform also includes new regulatory measures. Among these measures, the planting-rights regime is one of the most controversial. There is currently a prohibition of new plant-ings of vines until December 31, 2015. The new planting rights will allow wine producers to plant vines after the mora-torium expires, but this decision was postponed until 2016. Growers who produce wines in delimited areas with protected designation of origin believe that uncontrolled and unlimited wine-grape plantings will result in overpro-duction and a fall in perceived quality.
ConclusionsThe new wine CMO represents a set of compromises between the 27 member states. The CMO is not really a uni-fied policy, and every member state is attempting to obtain as much as it can from the new policy and budget. The CMO is a step towards a common agricultural policy for wine in Europe that is “WTO compatible.” None-theless, the CMO allows a degree of “nationalization,” and member states can influence policy by demonstrat-ing the relevance to their own situa-tion. At the same time, many of the most controversial aspects of the CMO have been delayed for the transition.
The new CMO has succeeded in encouraging the removal of many vine-yards from production, allowing other
crops to be grown on this acreage. Moreover, the politics and some of the economics of the new CMO are now more “agricultural” than specific to wine.
Since the 1980s, the European wine industry has faced increased produc-tion against a declining demand in European countries. Exports from European wine producers increased during this period, but increased competition from producers outside of Europe limit this expansion.
The CMO is intended to achieve a better balance between supply and demand on the European market. How-ever, it is difficult to estimate the over-all effects of these policies on European wine exports and production. Some measures of the CMO will likely reduce wine production. Removal of vineyards from production and the reduced role of some support programs decrease the incentive for growers to overproduce.
However, other measures of the CMO stimulate production. These include domestic and export promo-tion, and changes to the planting-rights-regime. In addition, phas-ing out (or down) the distillation program allows more wine to enter
the market. Uncertainty regarding the impacts of these counteracting measures means it is impossible to know whether European wine pro-duction and exports will increase or decrease as a result of the new CMO.
Étienne Montaigne is a Professor of Food Economics and currently scientific administrator in the Agricultural Mediterranean Institute of Montpellier (IAMM) in France. He can be contacted by e-mail at [email protected].
For further information, the author recommends the following:
U.S. Department of Agriculture, Foreign Agricultural Service 2009. EU-27 Wine Annual Report 2009. GAIN Report Number: E49021. www.fas.usda.gov/gain-files/200903/146327359.pdf.
Brunke, H., R. Mueller and D.A. Sumner. 2008. “California Wine and the EU Wine Policy Reform.” AIC Issues Brief no. 34. Available at: http://aic.ucdavis.edu/pub/briefs/brief34.pdf.
Figure 3. EU Budget for Removal of Land Under Wine Grape Cultivation, 2008–2009
Source: European Commission 2008.
Spain236
Greece7
Hungary10
Portugal14
France71
Others10
Italy116
Total 464 m Euro
Giannini Foundation of Agricultural Economics • University of California12
In 2010, the United States was the largest wine market by value and set to overtake France in volume. Of the
wine consumed by U.S. consumers, 30% came from outside the United States.
In 2009, according to Wine Institute figures, California supplied 61% of all wine sold in the United States and the U.S. market accounted for approxi-mately 83% of California’s total sales that year. Wines retailing for less than $9.25 per liter (about $7 per bottle) constituted 72% of the total market, with over 30% of the market retailing at under $3.96 per liter. California exports were also relatively low value: of the approximately 378.5 million liters of California wine exported, roughly half was shipped in bulk with a value of just over $1 a liter, while exported bottled wine averaged just over $3 a liter. Much of this article, therefore, focuses on the large volume market for relatively low-priced wine. What might demand and supply be like in twenty years?
The Market for U.S. Wine in 2030In 2030 the last of the Baby Boomers, a 77 million-strong cohort that has driven American marketing trends for the past 50 years, will turn 65. Their children, the so-called Millennials, a cohort of approximately 70 million that turned
21 after the start of the 21st century, will be well along in their careers and raising families. According to projec-tions from the U.S. Census Bureau, the United States’ population will grow by 20%, from approximately 310 mil-lion in 2010 to 373 million in 2030. The country will be more ethnically diverse and older. Almost 20% of the population will be over 65, as com-pared to 13% in 2010. The proportion of the population considered “white” will have shrunk from 66% to 57% and increased in actual number by 7 million, contributing just over 11% of the population increase. By contrast, other ethnic groups will increase their share: Asian-Americans will constitute 7% of the population compared to 5% in 2010; African-Americans will have grown slightly from 12% to 13%; and Hispanics are projected to grow to 23% of the population, an increase to 86 million from their current 50 million.
Wine consumed is a product of per capita consumption multiplied by population of drinking age. In 2010 there are approximately 220 million Americans of legal drinking age, and that number is expected to increase by almost 22% to 268 million, which would imply a market of about 2.97 billion liters of table wine—up from the current total of 2.45 billion liters in 2008. To refine this projection requires reviewing some history and some recent consumption patterns.
According to studies contracted by the Wine Market Council, in 2009 approximately 43% of adult Ameri-cans claim not to consume alcohol in any form. This level of abstinence has remained fairly constant at around 40% since 1994, when the Wine Market Council commissioned its first study. Compared with other developed coun-tries, America’s level of abstinence is
extraordinarily high. The World Health Organization’s Global Status Report on Alcohol 2004 shows Germany with 5.1% abstinence, followed by France at 6.3%, the UK at 12%, and Japan at 13.5%. Canada, which is perhaps most similar to the United States, has one of the highest rates of abstinence at 22%, but that is still about half the rate of that of the United States. If, during the next two decades, abstinence dropped from 43% to even 30% of the adult popula-tion, an additional 27 million drink-ers would be added to the market.
Of those Americans who say they consume some alcohol, slightly over half (30% of all adult Americans) con-sume wine. Americans who drink wine split roughly 50/50 between so-called “core” consumers—those Americans who consume at least one glass of wine per week—and the “marginal consumers” who consume less than one glass a wine of per week. Accord-ing to the 2009 Wine Market Council survey, the core consumers are the key market for wine, responsible for 91% of all wine consumed. As in any population, core consumers are not a homogeneous group. Some drink only one glass of wine a week, while others consume wine daily. Collectively, core consumers are about 34 million in number and average 70 liters of wine per person per year (roughly one glass of wine per day). Clearly, core consum-ers are key to the U.S. wine market.
The ethnicity of current core con-sumers differs from that of the general population. Currently, Caucasians, which represent 66% of the general population (assuming that Hispanics are considered separate from Cauca-sians), account for 84% of core con-sumers. African-Americans account for approximately 5% of core consump-tion, but represent just over 12% of the
Looking Forward: Imagining the Market For California Wine in 2030James T. Lapsely
Per capita consumption is increasing in the United States as the demographic make-up of wine drinkers is changing. Sales will be higher in 2030, but costs in California and increased branding of bulk imports mean a higher share of wine may come from imports.

13Giannini Foundation of Agricultural Economics • University of California
general population. Asian-Americans are 7% of core consumers while only 5% of the general population. Hispan-ics, at 59 million people, represent 16% of the United States’ population, but are only 4% of core consumers.
Considering that the Hispanic popu-lation in the United States is expected to increase by over 70% in the next 20 years to 86 million, and is predicted to account for over 50% of the total popula-tion increase, it is clear that straight-line projections of total wine volume are suspect, and the nature of wine drinking among the Hispanic population must be taken into account. In 2006, the Wine Market Council contracted with Epe-rian-Simmons, a market research com-pany, to study Hispanic consumers. Not surprisingly, they found that Hispanic wine consumers tended to have achieved higher levels of education and be profes-sionally employed than were Hispanic non-wine consumers. About 23% of His-panics in this 2005 survey drank wine as opposed to 34% of the general market; however, younger Hispanics, those under 40 years old, were a significantly larger portion of the Hispanic market for wine than were their age counter-parts in the general market. In addi-tion, they consumed about one more glass of wine a month than did their age counterparts in the general market. Hispanic wine drinkers also seem to be more acculturated than Hispanics that do not drink wine: 56% of Hispanic wine drinkers preferred to speak English as opposed to 41% of Hispanics who are not wine drinkers. Note, however, that approximately half of the increase in the number of Hispanics will come from immigration, and wine consumption among this group will continue to lag.
Millennials in all ethnic groups are adopting wine at a higher rate than did their parents, and ethnic composi-tion is changing, so it seems likely that the share of abstainers will decline. If half the new consumers buy wine and that new group is split roughly in half
between core and marginal consumers, then core consumers would grow to between 18–19% of the adult population and marginal consumers would account for 16%. If core consumers continue to account for 90% of total wine consump-tion and they remain at their current average of 70 liters, the total table wine market in 2030 would be 3.67 bil-lion liters, or 0.54 to 0.63 billion liters higher than a straight-line projection based solely on population growth.
Of course, wine consumption has gone in and out of fashion in the United States. During the 1980s, per capita consumption of wine declined, but increased again in the 1990s. Lack of industry advertising, tougher laws des-ignating lower blood alcohol levels for driving under the influence, government warning labels on alcoholic beverages, and a government-sponsored “war on drugs” have often been suggested as con-tributing to the decline in per capita con-sumption in the 1980s. But the 1980s was also the time when Baby Boomers were home with children—and stud-ies have repeatedly shown that house-holds with children have lower rates of wine consumption than do similar households with no children. In 2030, the older Millennials will be in their child-rearing years and it is possible that per capita consumption will again decline. That said, it seems more likely that wine consumption in the United States will converge gradually toward the norm in other developed nations.
SupplyLow-cost wines must come from inex-pensive grapes, and most of Califor-nia’s production comes from the San Joaquin Valley. Crush districts 12, 13 and 14, which constitute the Central Valley south of the Delta to Bakersfield, produced 52% of all grapes crushed in 2009. District 13, which is composed of Fresno, Madera and Tulare counties, alone accounted for almost one-third of all of California’s winegrape production.
A 2030 market of 3.67 billion liters of table wine means that the U.S. market would expand by 1.13 billion liters, requiring approximately 1.75 million tons of grapes. Assuming that California supplied 60% of that increase and that half of the volume retailed for under $5, then the southern San Joaquin Valley would need to expand its production by about 500,000 tons, which would require an additional 42,000 acres at a yield of 12 tons per acre. Hence, using these estimates, unless yield were further increased, acreage in the San Joaquin Valley would need to expand by about 30% to satisfy this additional demand.
The recent trend in winegrape acre-age in the region is actually down not up. After reaching a peak of 182,000 acres in 2001, acreage fell to 150,000 in 2005 and further to 140,000 in 2009 for the San Joaquin Valley crush districts 12, 13 and 14. Table 2 shows some of what was behind the decline in winegrape acreage. For the seven valley counties that comprise the bulk of the acres for
Group
Share in Core, 2010
Share in Core, 2030
Population, 2030
Core Consumers, 2030
(Percent) (Millions)
Caucasian 13.9 16 212 33.9
African-American 4.3 4.5 48 2.2
Asian-American 14.8 16 27 4.3
Hispanic 3.2 8 86 6.8
Total 47.2
Table 1. Core Wine Consumers in 2030
Source: Based on projections from U.S. Census and wine consumption survey data as described in the text. Note: The percent of core consumers are shares of the total population (including those under 21 years of age) since Bureau of Census projections broken out by both age group and ethnicity were not available.
Giannini Foundation of Agricultural Economics • University of California14
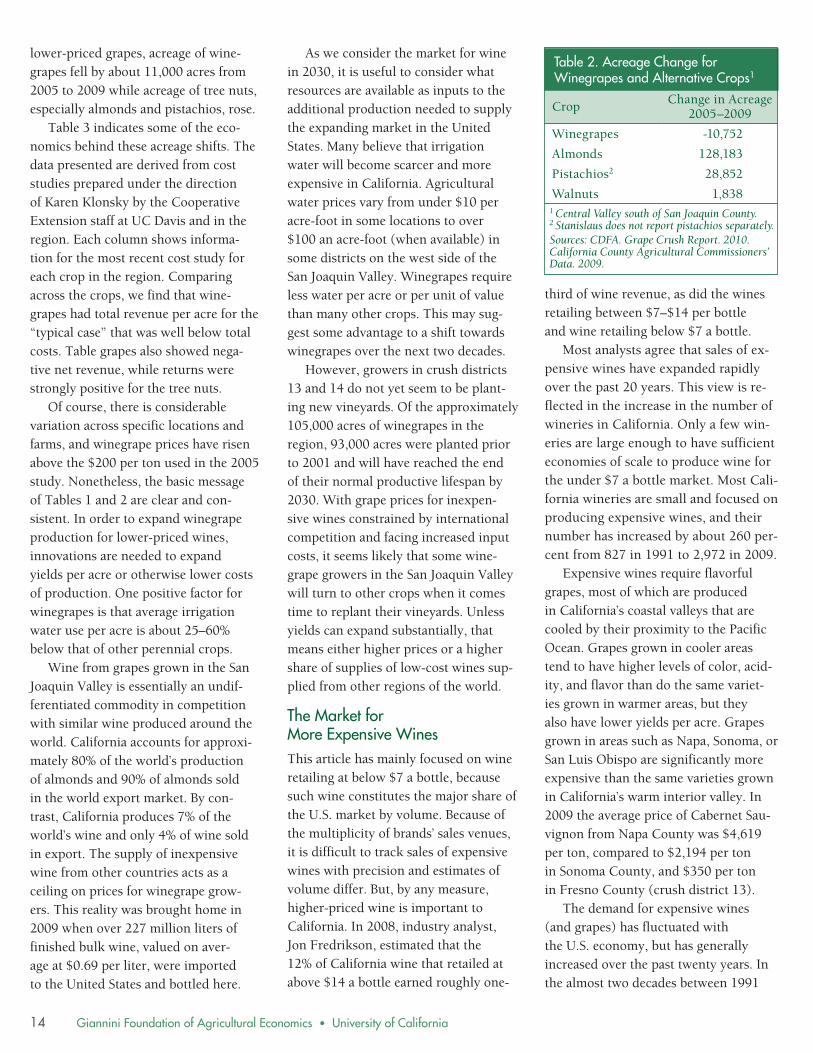
lower-priced grapes, acreage of wine-grapes fell by about 11,000 acres from 2005 to 2009 while acreage of tree nuts, especially almonds and pistachios, rose.
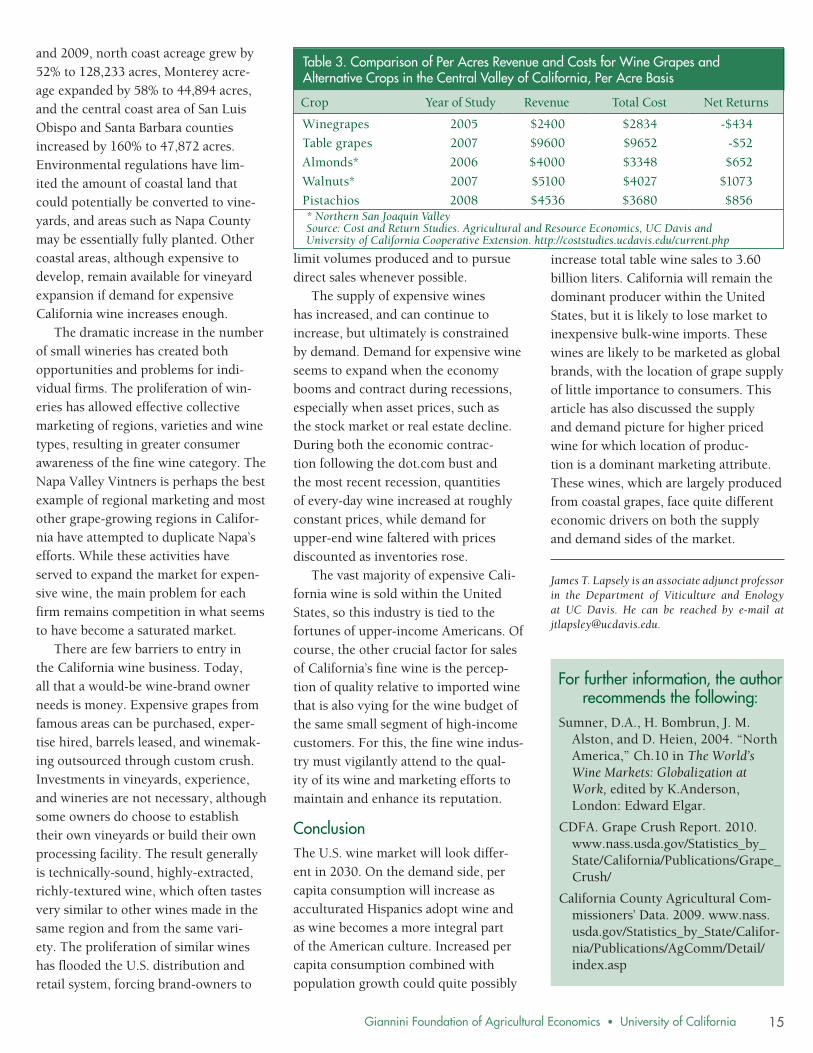
Table 3 indicates some of the eco-nomics behind these acreage shifts. The data presented are derived from cost studies prepared under the direction of Karen Klonsky by the Cooperative Extension staff at UC Davis and in the region. Each column shows informa-tion for the most recent cost study for each crop in the region. Comparing across the crops, we find that wine-grapes had total revenue per acre for the “typical case” that was well below total costs. Table grapes also showed nega-tive net revenue, while returns were strongly positive for the tree nuts.
Of course, there is considerable variation across specific locations and farms, and winegrape prices have risen above the $200 per ton used in the 2005 study. Nonetheless, the basic message of Tables 1 and 2 are clear and con-sistent. In order to expand winegrape production for lower-priced wines, innovations are needed to expand yields per acre or otherwise lower costs of production. One positive factor for winegrapes is that average irrigation water use per acre is about 25–60% below that of other perennial crops.
Wine from grapes grown in the San Joaquin Valley is essentially an undif-ferentiated commodity in competition with similar wine produced around the world. California accounts for approxi-mately 80% of the world’s production of almonds and 90% of almonds sold in the world export market. By con-trast, California produces 7% of the world’s wine and only 4% of wine sold in export. The supply of inexpensive wine from other countries acts as a ceiling on prices for winegrape grow-ers. This reality was brought home in 2009 when over 227 million liters of finished bulk wine, valued on aver-age at $0.69 per liter, were imported to the United States and bottled here.
As we consider the market for wine in 2030, it is useful to consider what resources are available as inputs to the additional production needed to supply the expanding market in the United States. Many believe that irrigation water will become scarcer and more expensive in California. Agricultural water prices vary from under $10 per acre-foot in some locations to over $100 an acre-foot (when available) in some districts on the west side of the San Joaquin Valley. Winegrapes require less water per acre or per unit of value than many other crops. This may sug-gest some advantage to a shift towards winegrapes over the next two decades.
However, growers in crush districts 13 and 14 do not yet seem to be plant-ing new vineyards. Of the approximately 105,000 acres of winegrapes in the region, 93,000 acres were planted prior to 2001 and will have reached the end of their normal productive lifespan by 2030. With grape prices for inexpen-sive wines constrained by international competition and facing increased input costs, it seems likely that some wine-grape growers in the San Joaquin Valley will turn to other crops when it comes time to replant their vineyards. Unless yields can expand substantially, that means either higher prices or a higher share of supplies of low-cost wines sup-plied from other regions of the world.
The Market for More Expensive WinesThis article has mainly focused on wine retailing at below $7 a bottle, because such wine constitutes the major share of the U.S. market by volume. Because of the multiplicity of brands’ sales venues, it is difficult to track sales of expensive wines with precision and estimates of volume differ. But, by any measure, higher-priced wine is important to California. In 2008, industry analyst, Jon Fredrikson, estimated that the 12% of California wine that retailed at above $14 a bottle earned roughly one-
third of wine revenue, as did the wines retailing between $7–$14 per bottle and wine retailing below $7 a bottle.
Most analysts agree that sales of ex-pensive wines have expanded rapidly over the past 20 years. This view is re-flected in the increase in the number of wineries in California. Only a few win-eries are large enough to have sufficient economies of scale to produce wine for the under $7 a bottle market. Most Cali-fornia wineries are small and focused on producing expensive wines, and their number has increased by about 260 per-cent from 827 in 1991 to 2,972 in 2009.
Expensive wines require flavorful grapes, most of which are produced in California’s coastal valleys that are cooled by their proximity to the Pacific Ocean. Grapes grown in cooler areas tend to have higher levels of color, acid-ity, and flavor than do the same variet-ies grown in warmer areas, but they also have lower yields per acre. Grapes grown in areas such as Napa, Sonoma, or San Luis Obispo are significantly more expensive than the same varieties grown in California’s warm interior valley. In 2009 the average price of Cabernet Sau-vignon from Napa County was $4,619 per ton, compared to $2,194 per ton in Sonoma County, and $350 per ton in Fresno County (crush district 13).
The demand for expensive wines (and grapes) has fluctuated with the U.S. economy, but has generally increased over the past twenty years. In the almost two decades between 1991
1 Central Valley south of San Joaquin County.2 Stanislaus does not report pistachios separately.Sources: CDFA. Grape Crush Report. 2010. California County Agricultural Commissioners’ Data. 2009.
Crop Change in Acreage2005–2009
Winegrapes -10,752
Almonds 128,183
Pistachios2 28,852
Walnuts 1,838
Table 2. Acreage Change for Winegrapes and Alternative Crops1
15Giannini Foundation of Agricultural Economics • University of California
Table 3. Comparison of Per Acres Revenue and Costs for Wine Grapes and Alternative Crops in the Central Valley of California, Per Acre Basis
Crop Year of Study Revenue Total Cost Net Returns
Winegrapes 2005 $2400 $2834 -$434
Table grapes 2007 $9600 $9652 -$52
Almonds* 2006 $4000 $3348 $652
Walnuts* 2007 $5100 $4027 $1073
Pistachios 2008 $4536 $3680 $856* Northern San Joaquin Valley Source: Cost and Return Studies. Agricultural and Resource Economics, UC Davis and University of California Cooperative Extension. http://coststudies.ucdavis.edu/current.php
James T. Lapsely is an associate adjunct professor in the Department of Viticulture and Enology at UC Davis. He can be reached by e-mail at [email protected].
For further information, the author recommends the following:
Sumner, D.A., H. Bombrun, J. M. Alston, and D. Heien, 2004. “North America,” Ch.10 in The World’s Wine Markets: Globalization at Work, edited by K.Anderson, London: Edward Elgar.
CDFA. Grape Crush Report. 2010. www.nass.usda.gov/Statistics_by_State/California/Publications/Grape_Crush/
California County Agricultural Com-missioners’ Data. 2009. www.nass.usda.gov/Statistics_by_State/Califor-nia/Publications/AgComm/Detail/index.asp
and 2009, north coast acreage grew by 52% to 128,233 acres, Monterey acre-age expanded by 58% to 44,894 acres, and the central coast area of San Luis Obispo and Santa Barbara counties increased by 160% to 47,872 acres. Environmental regulations have lim-ited the amount of coastal land that could potentially be converted to vine-yards, and areas such as Napa County may be essentially fully planted. Other coastal areas, although expensive to develop, remain available for vineyard expansion if demand for expensive California wine increases enough.
The dramatic increase in the number of small wineries has created both opportunities and problems for indi-vidual firms. The proliferation of win-eries has allowed effective collective marketing of regions, varieties and wine types, resulting in greater consumer awareness of the fine wine category. The Napa Valley Vintners is perhaps the best example of regional marketing and most other grape-growing regions in Califor-nia have attempted to duplicate Napa’s efforts. While these activities have served to expand the market for expen-sive wine, the main problem for each firm remains competition in what seems to have become a saturated market.
There are few barriers to entry in the California wine business. Today, all that a would-be wine-brand owner needs is money. Expensive grapes from famous areas can be purchased, exper-tise hired, barrels leased, and winemak-ing outsourced through custom crush. Investments in vineyards, experience, and wineries are not necessary, although some owners do choose to establish their own vineyards or build their own processing facility. The result generally is technically-sound, highly-extracted, richly-textured wine, which often tastes very similar to other wines made in the same region and from the same vari-ety. The proliferation of similar wines has flooded the U.S. distribution and retail system, forcing brand-owners to
limit volumes produced and to pursue direct sales whenever possible.
The supply of expensive wines has increased, and can continue to increase, but ultimately is constrained by demand. Demand for expensive wine seems to expand when the economy booms and contract during recessions, especially when asset prices, such as the stock market or real estate decline. During both the economic contrac-tion following the dot.com bust and the most recent recession, quantities of every-day wine increased at roughly constant prices, while demand for upper-end wine faltered with prices discounted as inventories rose.
The vast majority of expensive Cali-fornia wine is sold within the United States, so this industry is tied to the fortunes of upper-income Americans. Of course, the other crucial factor for sales of California’s fine wine is the percep-tion of quality relative to imported wine that is also vying for the wine budget of the same small segment of high-income customers. For this, the fine wine indus-try must vigilantly attend to the qual-ity of its wine and marketing efforts to maintain and enhance its reputation.
ConclusionThe U.S. wine market will look differ-ent in 2030. On the demand side, per capita consumption will increase as acculturated Hispanics adopt wine and as wine becomes a more integral part of the American culture. Increased per capita consumption combined with population growth could quite possibly
increase total table wine sales to 3.60 billion liters. California will remain the dominant producer within the United States, but it is likely to lose market to inexpensive bulk-wine imports. These wines are likely to be marketed as global brands, with the location of grape supply of little importance to consumers. This article has also discussed the supply and demand picture for higher priced wine for which location of produc-tion is a dominant marketing attribute. These wines, which are largely produced from coastal grapes, face quite different economic drivers on both the supply and demand sides of the market.

The University of California is an Equal Opportunity/Affirmative Action employer.
http://giannini.ucop.edu
Agricultural and Resource Economics
UPDATE
Co-Editors
Steve BlankDavid Roland-Holst
Richard Sexton David Zilberman
Managing Editor and Desktop Publisher
Julie McNamara
Published by the Giannini Foundation of Agricultural Economics
ARE Update is published six times per year by the Giannini Foundation of Agricultural Economics, University of California.
Domestic subscriptions are available free of charge to interested parties. To subscribe to ARE Update by mail contact:
Julie McNamara, Outreach Coordinator Department of Agricultural and Resource Economics University of California One Shields Avenue, Davis, CA 95616 E-mail: [email protected] Phone: 530-752-5346
To receive notification when new issues of the ARE Update are available online, submit an e-mail request to join our listserv to [email protected].
Articles published herein may be reprinted in their entirety with the author’s or editors’ permission. Please credit the Giannini Foundation of Agricultural Economics, University of California.
ARE Update is available online at www.agecon.ucdavis.edu/extension/update/
Department of Agricultural and Resource EconomicsUC DavisOne Shields AvenueDavis CA 95616GPBS