special olympics massachusetts, inc. · special olympics massachusetts, inc. statement of...
TRANSCRIPT

Special Olympics Massachusetts, Inc. Financial Report December 31, 2015 and 2014

Contents
Independent auditor’s report 1 Financial statements
Statements of financial position 2
Statements of activities 3
Statements of functional expenses 4-5
Statements of cash flows 6 Notes to financial statements 7-16
Independent auditor’s report on the supplementary information 17
Supplementary information
Schedules of expense percentages 18-19

1
Independent Auditor’s Report To the Board of Directors Special Olympics Massachusetts, Inc. Marlborough, Massachusetts Report on the Financial Statements We have audited the accompanying financial statements of Special Olympics Massachusetts, Inc. (“SOMA”) which comprise the statements of financial position as of December 31, 2015 and 2014, and the related statements of activities, functional expenses and cash flows for the years then ended and the related notes to the financial statements. Management’s Responsibility for the Financial Statements Management is responsible for the preparation and fair presentation of these financial statements in accordance with accounting principles generally accepted in the United States of America; this includes the design, implementation, and maintenance of internal control relevant to the preparation and fair presentation of financial statements that are free from material misstatement, whether due to fraud or error. Auditor’s Responsibility Our responsibility is to express an opinion on these financial statements based on our audits. We conducted our audits in accordance with auditing standards generally accepted in the United States of America. Those standards require that we plan and perform the audit to obtain reasonable assurance about whether the financial statements are free from material misstatement. An audit involves performing procedures to obtain audit evidence about the amounts and disclosures in the financial statements. The procedures selected depend on the auditor’s judgment, including the assessment of the risks of material misstatement of the financial statements, whether due to fraud or error. In making those risk assessments, the auditor considers internal control relevant to the entity’s preparation and fair presentation of the financial statements in order to design audit procedures that are appropriate in the circumstances, but not for the purpose of expressing an opinion on the effectiveness of the entity’s internal control. Accordingly, we express no such opinion. An audit also includes evaluating the appropriateness of accounting policies used and the reasonableness of significant accounting estimates made by management, as well as evaluating the overall presentation of the financial statements. We believe that the audit evidence we have obtained is sufficient and appropriate to provide a basis for our audit opinion. Opinion In our opinion, the financial statements referred to above present fairly, in all material respects, the financial position of Special Olympics Massachusetts, Inc. as of December 31, 2015 and 2014, and the changes in its net assets and its cash flows for the years then ended in accordance with accounting principles generally accepted in the United States of America.
Boston, Massachusetts May 17, 2016

Special Olympics Massachusetts, Inc.
Statements of Financial Position
December 31, 2015 and 2014
2015 2014
Assets
Current assets:
Cash and cash equivalents 800,635$ 397,370$
Assets limited as to use 187,891 296,460
Contributions receivable 597,008 629,556
Current portion of pledges receivable 71,820 104,997
Prepaid expenses 50,039 61,624
Total current assets 1,707,393 1,490,007
Noncurrent assets:
Investments 4,451,187 4,472,483
Assets Limited as to Use - 136,749
Cash Surrender Value of Life Insurance and Other Assets 854,518 854,518
Pledges Receivable, Net of Current Portion 25,900 53,670
Land, Building and Equipment, Net 8,070,988 8,294,211
Deferred Financing Charges, Net 39,249 53,967
Total assets 15,149,235$ 15,355,605$
Liabilities and Net Assets
Current liabilities:
Current portion of bonds payable 103,878$ 100,280$
Accounts payable and accrued expenses 201,936 345,348
Deferred revenue 27,264 15,102
Total current liabilities 333,078 460,730
Bonds payable, net of current portion 4,678,536 4,782,429
Total liabilities 5,011,614 5,243,159
Net assets:
Unrestricted:
Undesignated 5,588,714 5,481,296
Board designated 4,451,187 4,472,483
Total unrestricted net assets 10,039,901 9,953,779
Temporarily restricted net assets 97,720 158,667
Total net assets 10,137,621 10,112,446
Total liabilities and net assets 15,149,235$ 15,355,605$
See notes to financial statements.
2

Special Olympics Massachusetts, Inc.
Statements of Activities
Years Ended December 31, 2015 and 2014
Temporarily Temporarily
Unrestricted Restricted Total Unrestricted Restricted Total
Revenue and other support:
Corporate donations 409,162$ -$ 409,162$ 388,229$ -$ 388,229$
Individual and other donations 666,731 - 666,731 492,607 - 492,607
Heritage telemarketing 641,169 - 641,169 885,044 - 885,044
Fundraising activities 2,312,117 - 2,312,117 2,270,686 - 2,270,686
Direct mail 314,883 - 314,883 367,318 - 367,318
Grants 292,691 - 292,691 269,382 - 269,382
DialAmerica Magazine 31,198 - 31,198 50,517 - 50,517
Program service fees 83,813 - 83,813 83,631 - 83,631
Investment income 119,757 - 119,757 121,068 - 121,068
Loss on disposal of equipment (876) - (876) (484) - (484)
Other income 34,747 - 34,747 27,438 - 27,438 Net realized and unrealized losses on investments (88,685) - (88,685) (17,084) - (17,084) Write-off of uncollectible pledges receivable - (11,472) (11,472) - - -
Net assets released from restrictions 49,475 (49,475) - 69,650 (69,650) -
4,866,182 (60,947) 4,805,235 5,008,002 (69,650) 4,938,352
In-kind contributions 7,810,222 - 7,810,222 8,196,890 - 8,196,890
Total revenue and other support 12,676,404 (60,947) 12,615,457 13,204,892 (69,650) 13,135,242
Expenses:
Program services 10,847,433 - 10,847,433 11,780,485 - 11,780,485
Management and general 425,548 - 425,548 500,309 - 500,309
Fundraising 1,317,301 - 1,317,301 1,183,154 - 1,183,154
Total expenses 12,590,282 - 12,590,282 13,463,948 - 13,463,948
Change in net assets 86,122 (60,947) 25,175 (259,056) (69,650) (328,706)
Net assets, beginning of year 9,953,779 158,667 10,112,446 10,212,835 228,317 10,441,152
Net assets, end of year 10,039,901$ 97,720$ 10,137,621$ 9,953,779$ 158,667$ 10,112,446$
See notes to financial statements.
20142015
3

Special Olympics Massachusetts, Inc.
Statement of Functional Expenses
Year Ended December 31, 2015
Management
Program and
Services General Fundraising Total
Salaries and stipends 773,107$ 235,853$ 460,775$ 1,469,735$
Competitions 1,037,411 - - 1,037,411
Fundraising events - - 415,066 415,066
Payroll taxes and fringe benefits 176,306 53,786 105,079 335,171
Heritage telemarketing fees 146,187 - 219,280 365,467
Professional fees - 43,664 - 43,664
Section office expense 35,341 - - 35,341
Auto and travel expense 21,169 8,298 20,977 50,444
Volunteer and family expense 44,966 - - 44,966
Telephone 15,545 4,743 9,265 29,553
Special Olympics Incorporated - chapter fee 43,455 43,454 - 86,909
Interest 181,503 4,033 16,134 201,670
Insurance 64,932 1,443 5,772 72,147
Supplies 14,278 4,356 8,509 27,143
Promotional expense 13,356 400 2,668 16,424
Postage 6,033 1,841 3,596 11,470
Technology related expenses 18,619 5,682 11,098 35,399
Souvenirs 864 - 1,056 1,920
Conferences 34,472 5,010 2,888 42,370
Training 1,650 - - 1,650
Repairs and maintenance 45,589 1,013 4,052 50,654
Appreciation 12,711 - - 12,711
Utilities 83,237 1,850 7,399 92,486
Printing 9,106 203 809 10,118
Membership, dues and subscriptions - 4,199 - 4,199
Total expenses before in-kind and depreciation
and amortization 2,779,837 419,828 1,294,423 4,494,088
In-kind expenses 7,810,222 - - 7,810,222
Total expenses before depreciation and
amortization 10,590,059 419,828 1,294,423 12,304,310
Depreciation and amortization 257,374 5,720 22,878 285,972
Total expenses 10,847,433$ 425,548$ 1,317,301$ 12,590,282$
See notes to financial statements.
4
Special Olympics Massachusetts, Inc.
Statement of Functional Expenses
Year Ended December 31, 2014
Management
Program and
Services General Fundraising Total
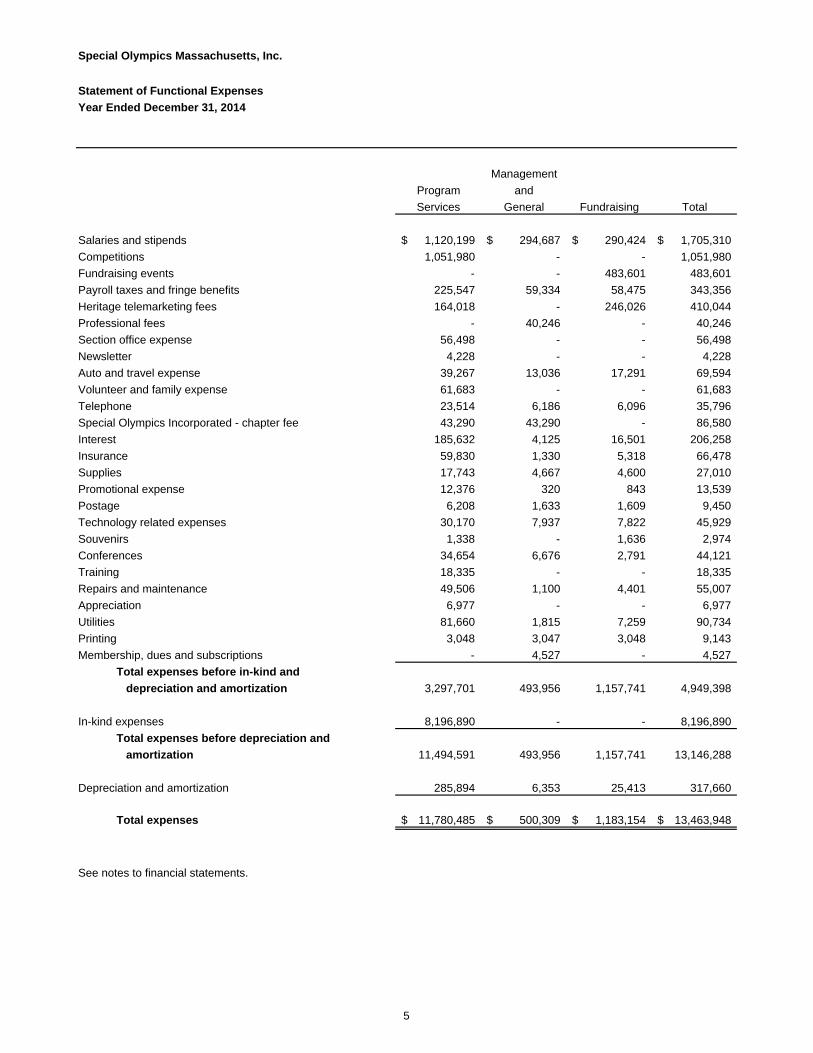
Salaries and stipends 1,120,199$ 294,687$ 290,424$ 1,705,310$
Competitions 1,051,980 - - 1,051,980
Fundraising events - - 483,601 483,601
Payroll taxes and fringe benefits 225,547 59,334 58,475 343,356
Heritage telemarketing fees 164,018 - 246,026 410,044
Professional fees - 40,246 - 40,246
Section office expense 56,498 - - 56,498
Newsletter 4,228 - - 4,228
Auto and travel expense 39,267 13,036 17,291 69,594
Volunteer and family expense 61,683 - - 61,683
Telephone 23,514 6,186 6,096 35,796
Special Olympics Incorporated - chapter fee 43,290 43,290 - 86,580
Interest 185,632 4,125 16,501 206,258
Insurance 59,830 1,330 5,318 66,478
Supplies 17,743 4,667 4,600 27,010
Promotional expense 12,376 320 843 13,539
Postage 6,208 1,633 1,609 9,450
Technology related expenses 30,170 7,937 7,822 45,929
Souvenirs 1,338 - 1,636 2,974
Conferences 34,654 6,676 2,791 44,121
Training 18,335 - - 18,335
Repairs and maintenance 49,506 1,100 4,401 55,007
Appreciation 6,977 - - 6,977
Utilities 81,660 1,815 7,259 90,734
Printing 3,048 3,047 3,048 9,143
Membership, dues and subscriptions - 4,527 - 4,527
Total expenses before in-kind and
depreciation and amortization 3,297,701 493,956 1,157,741 4,949,398
In-kind expenses 8,196,890 - - 8,196,890
Total expenses before depreciation and
amortization 11,494,591 493,956 1,157,741 13,146,288
Depreciation and amortization 285,894 6,353 25,413 317,660
Total expenses 11,780,485$ 500,309$ 1,183,154$ 13,463,948$
See notes to financial statements.
5
Special Olympics Massachusetts, Inc.
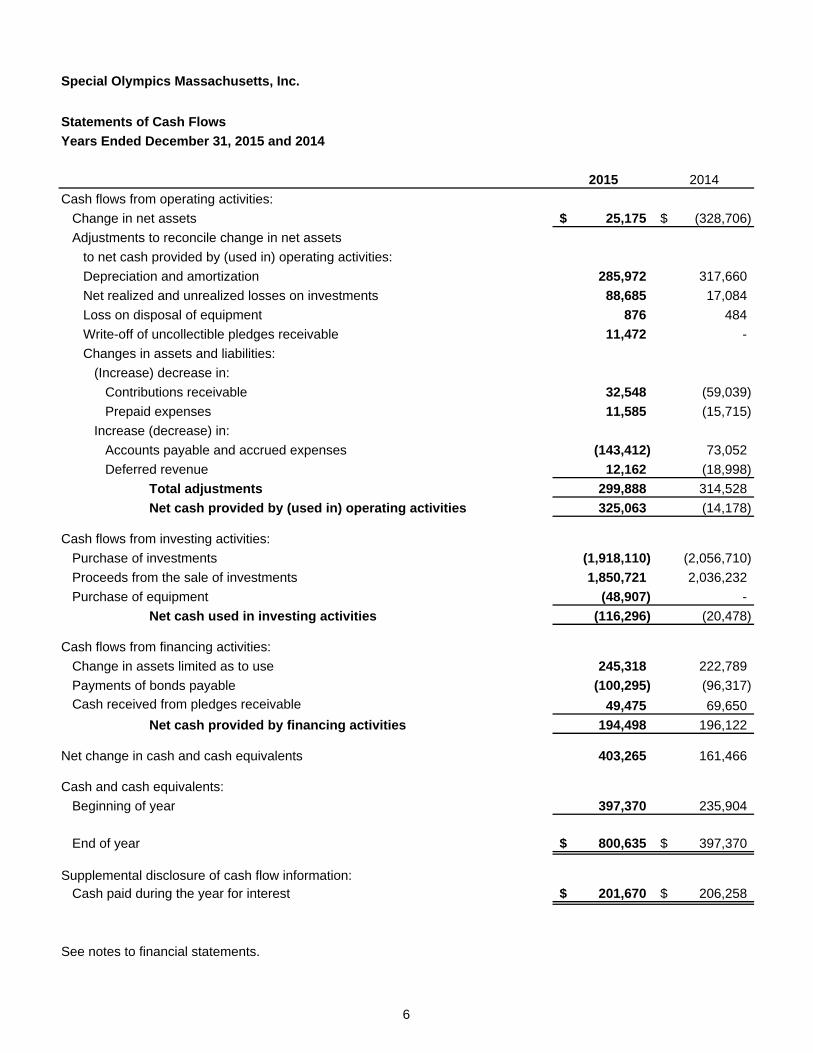
Statements of Cash Flows
Years Ended December 31, 2015 and 2014
2015 2014
Cash flows from operating activities:
Change in net assets 25,175$ (328,706)$
Adjustments to reconcile change in net assets
to net cash provided by (used in) operating activities:
Depreciation and amortization 285,972 317,660
Net realized and unrealized losses on investments 88,685 17,084
Loss on disposal of equipment 876 484
Write-off of uncollectible pledges receivable 11,472 -
Changes in assets and liabilities:
(Increase) decrease in:
Contributions receivable 32,548 (59,039)
Prepaid expenses 11,585 (15,715)
Increase (decrease) in:
Accounts payable and accrued expenses (143,412) 73,052
Deferred revenue 12,162 (18,998)
Total adjustments 299,888 314,528
Net cash provided by (used in) operating activities 325,063 (14,178)
Cash flows from investing activities:
Purchase of investments (1,918,110) (2,056,710)
Proceeds from the sale of investments 1,850,721 2,036,232
Purchase of equipment (48,907) -
Net cash used in investing activities (116,296) (20,478)
Cash flows from financing activities:
Change in assets limited as to use 245,318 222,789
Payments of bonds payable (100,295) (96,317)
Cash received from pledges receivable 49,475 69,650
Net cash provided by financing activities 194,498 196,122
Net change in cash and cash equivalents 403,265 161,466
Cash and cash equivalents:
Beginning of year 397,370 235,904
End of year 800,635$ 397,370$
Supplemental disclosure of cash flow information:Cash paid during the year for interest 201,670$ 206,258$
See notes to financial statements.
6

Special Olympics Massachusetts, Inc. Notes to Financial Statements
7
Note 1. Nature of Activities and Significant Accounting Policies Nature of activities: Special Olympics Massachusetts, Inc. ("SOMA" or “the Organization”) is a state chapter of Special Olympics, Inc., a nonprofit charitable organization that provides year-round sports training and competition in a variety of Olympic type sports for children and adults with intellectual disabilities, giving them the ability to develop physical fitness, prepare for entry into school and community programs, demonstrate courage, experience joy, and participate in the sharing of gifts, skills and friendship with families, other Special Olympics athletes and the community. SOMA has pioneered two major global initiatives; Unified Sports® and Healthy Athletes®. Unified Sports® promotes inclusion in sports by teaming intellectually disabled athletes with their non-handicapped age-appropriate counterparts for both training and competition purposes. The Healthy Athletes® Initiative provides health related programming designed to ultimately increase access to quality healthcare for people with intellectual disabilities. Through these and other program opportunities, SOMA contributes greatly to the overall quality of life for this population. A summary of SOMA’s significant accounting policies follows: Classification and reporting of net assets: SOMA’s financial statement presentation follows the requirements of accounting principles generally accepted in the United States of America (“GAAP”). Under GAAP, SOMA is required to report information regarding its financial position and activities according to three classes of net assets: unrestricted net assets, temporarily restricted net assets and permanently restricted net assets. SOMA does not have any permanently restricted net assets.
Unrestricted net assets represent the portion of net assets of SOMA that is neither permanently restricted nor temporarily restricted by donor-imposed stipulations. In addition, unrestricted net assets of SOMA include Board designated funds, which represent unrestricted resources designated by the Board of Directors for specific purposes.
Temporarily restricted net assets represent contributions and other inflows of assets whose use
by SOMA is limited by donor-imposed stipulations that either expire by passage of time or can be fulfilled and removed by actions of SOMA pursuant to those stipulations.
Cash and cash equivalents: SOMA considers all highly liquid debt instruments purchased with an initial maturity of three months or less to be cash equivalents. SOMA maintains its cash in bank deposit accounts, which at times may exceed federally insured limits. SOMA has not experienced any losses in such accounts. SOMA believes it is not exposed to any significant credit risk on cash and cash equivalents. Investments and fair value measurements: Investments are presented in the financial statements at fair value, as established by the major securities markets. Purchases and sales of securities are recorded on trade dates. Realized and unrealized gains and losses are reported as increases or decreases in unrestricted net assets unless the use of the assets received is limited by donor-imposed restrictions. Under the FASB’s authoritative guidance on fair value measurements, fair value is the price that would be received to sell an asset or paid to transfer a liability in an orderly transaction between market participants at the measurement date. In determining fair value, SOMA uses various methods including market, income and cost approaches.

Special Olympics Massachusetts, Inc. Notes to Financial Statements
8
Note 1. Nature of Activities and Significant Accounting Policies (Continued) Based on these approaches, SOMA often utilizes certain assumptions that market participants would use in pricing the asset or liability, including assumptions about risk and or the risks inherent in the inputs to the valuation technique. These inputs can be readily observable, market corroborated, or generally unobservable inputs. SOMA utilizes valuation techniques that maximize the use of observable inputs and minimize the use of unobservable inputs. Based on the observability of the inputs used in the valuation techniques SOMA is required to provide the following information according to the fair value hierarchy. The fair value hierarchy ranks the quality and reliability of the information used to determine fair values. Financial assets and liabilities carried at fair value will be classified and disclosed in one of the following three categories:
Level 1: Quoted prices for identical assets and liabilities traded in active exchange markets, such as the New York Stock Exchange.
Level 2: Observable inputs other than Level 1 including quoted prices for similar assets or liabilities,
quoted prices in less active markets, or other observable inputs that can be corroborated by observable market data.
Level 3: Unobservable inputs supported by little or no market activity for financial instruments whose
value is determined using pricing models, discounted cash flow methodologies, or similar techniques, as well as instruments for which the determination of fair value requires significant management judgment or estimation; also includes observable inputs for nonbinding single dealer quotes not corroborated by observable market data.
In some instances, the inputs used to measure fair value may fall into different levels of the fair value hierarchy. In such cases, an asset’s level within the fair value hierarchy is based on the lowest level input that is significant to the fair value measurement. SOMA has various processes and controls in place to ensure that fair value is reasonably estimated. While SOMA believes its valuation methods are appropriate and consistent with other market participants, the use of different methodologies or assumptions to determine the fair value of certain financial instruments could result in a different estimate of fair value at the reporting date. During the years ended December 31, 2015 and 2014, there were no changes to SOMA’s valuation techniques that had, or are expected to have, a material impact on its statements of financial position or changes in net assets. The following is a description of the valuation methodologies used for instruments measured at fair value: Equity securities, exchange traded funds, and bonds: The fair value of equity securities, exchange traded funds, and bonds is the market value based on quoted market prices. Money market funds: Money market funds are open ended funds that generally have subscription and redemption activity at a $1.00 stable net asset value (“NAV”). On a daily basis a fund’s NAV is calculated using the amortized cost (not market value) of the securities held in the fund.

Special Olympics Massachusetts, Inc. Notes to Financial Statements
9
Note 1. Nature of Activities and Significant Accounting Policies (Continued) Land, building and equipment: Land, building and equipment are recorded at cost, or if donated, at fair value on the date of the donation. Deprecation is provided over the estimated useful life of each class of depreciable asset and is computed using the straight-line method over the following estimated useful lives:
Description Years
Building 39 Capital Improvements 20 Furniture and fixtures 7 Equipment 5-7 Motor vehicles 5 Software 3 Expenditures for major renewals and improvements are capitalized while expenditures for maintenance and repairs are expensed as incurred. Asset retirement obligation: SOMA follows FASB ASC 410, Asset Retirement and Environmental Obligations; this standard requires a liability be recorded at fair value specific to certain legal environmental obligations. The recording of a liability is required if such conditions exist and the obligation can be reasonably estimated. As of December 31, 2015 and 2014, SOMA is unaware of any such obligations. SOMA will recognize a liability in the period in which it becomes aware of such liability and sufficient information is available to reasonably estimate the fair value. Impairment of long-lived assets: Long-lived assets, which consist primarily of property, plant and equipment, are reviewed for impairment whenever events or changes in circumstances indicate that the carrying amount of the asset may not be recoverable. When such events occur, SOMA compares the carrying amounts of the assets to the undiscounted expected future cash flows over the remaining life of the asset. If this comparison indicates that there may be impairment, the amount of impairment is calculated as the difference between the carrying value and fair value. During the years ended December 31, 2015 and 2014, no impairment indicators were identified. Deferred financing charges: SOMA incurred certain issuance costs related to the issuance of debt, which have been classified as deferred charges and are being amortized over the term of the debt. Contributions and revenue recognition: Revenues are recognized when there is persuasive evidence of an arrangement, delivery has occurred, the fee is fixed or determinable, and collectability is reasonably assured. Amounts billed or collected prior to satisfying SOMA’s revenue recognition policy are reflected as deferred revenue. Revenues are reported as increases in unrestricted net assets unless use of the related assets is limited by donor-imposed restrictions. Expenses are reported as decreases in unrestricted net assets. Gains and losses on investments and other assets or liabilities are reported as increases or decreases in unrestricted net assets unless their use is restricted by explicit donor stipulation or by law. Expirations of temporary restrictions on net assets by fulfillment of the donor-stipulated purpose or by passage of the stipulated time period are reported as net assets released from restrictions. Contributions, including unconditional promises to give, are initially recognized at fair value as revenues in the period in which the unconditional promises to give are made. Conditional promises to give are not recognized until they become unconditional, that is, at the time when the conditions on which they depend are substantially met. Contributions of assets other than cash are reported at their estimated fair value.

Special Olympics Massachusetts, Inc. Notes to Financial Statements
10
Note 1. Nature of Activities and Significant Accounting Policies (Continued) Contributions to be received after one year are discounted at a rate commensurate with the risk involved. Amortization of discount is recorded as additional contribution revenue in accordance with donor-imposed restrictions, if any, on the contributions. An allowance for uncollectible contributions and pledges receivable is provided based upon management's judgment of potential defaults. The determination includes such factors as prior collection history, type of contribution and nature of fundraising activities. Contributions received with donor-imposed restrictions that are met in the same year as received are reported as revenues of the unrestricted net asset class. SOMA receives various program materials and facilities without charge or at discounted rates. To the extent determinable, the value of such donations is recorded at the estimated fair value on the date of the gift and is reported as support and program expense in the year the materials or facilities are used. A substantial number of unpaid volunteers make significant contributions of their time to assist in SOMA’s programs, principally in the coaching of athletes and in the conduct of competitions and other events. To the extent determinable, the value of such contributed services is recorded at the estimated fair value on the date of service and is reported as support and program expense in the year the services are provided. Allocation of joint costs: SOMA follows the accounting standard, Accounting for Costs of Activities that Include Fundraising, subsections of ASC 958-720. The standard requires that, if the criteria of purpose, audience, and content as defined in the standard are met, the costs of joint activities that are identifiable with a particular function should be charged to that function, and joint costs should be allocated between fundraising and the appropriate program or management and general function. If any of the criteria of purpose, audience, and content are not met, all costs of the activity should be reported as fundraising costs. SOMA conducts a telemarketing campaign aimed at individual consumers and businesses. This campaign includes requests for contributions, but also contains educational and public relations components. The joint costs of conducting these types of activities which are not specifically attributable to particular components of the activity included a total of $365,467 and $410,044 for 2015 and 2014, respectively. These joint costs are allocated based upon the average program content percentage of the campaign literature. For 2015 and 2014, SOMA allocated $219,280 and $246,026, respectively, to fundraising, and $146,187 and $164,018, respectively, to program. Income tax status: SOMA is qualified under Section 501(c)(3) of the Internal Revenue Code and is exempt from Federal and state income taxes except for net revenue from unrelated business activities. Uncertainty of income taxes: SOMA follows ASC 740, Income Taxes, which clarifies the accounting for uncertainty in income taxes by prescribing the recognition threshold a tax position is required to meet before being recognized in the financial statements. SOMA recognizes a tax benefit from an uncertain tax position only if it is more likely than not that the tax position will be sustained upon examination by taxing authorities. Management evaluated SOMA’s tax positions and concluded that SOMA has no material uncertainties in income taxes as of December 31, 2015 and 2014. With few exceptions, SOMA is no longer subject to income tax examinations by the U.S. federal, state or local tax authorities for years before 2012. SOMA will account for interest and penalties related to uncertain tax positions, if any, as part of tax expense.

Special Olympics Massachusetts, Inc. Notes to Financial Statements
11
Note 1. Nature of Activities and Significant Accounting Policies (Continued) Use of estimates: The preparation of financial statements in conformity with accounting principles generally accepted in the United States of America requires management to make estimates and assumptions that affect the reported amounts of assets and liabilities and disclosure of contingent assets and liabilities at the date of the financial statements and the reported amounts of revenue and expenses during the reporting period. Actual results could differ from those estimates. Functional expenses: The costs of providing the various programs and other activities of SOMA have been summarized on a functional basis in the statements of activities. Accordingly, certain costs have been allocated between the programs and supporting services based on salaries and square footage. Subsequent events: SOMA has evaluated subsequent events through May 17, 2016, the date the financial statements were available to be issued. Recently issued accounting pronouncements: In May 2014, the FASB issued ASU 2014-09, Revenue from Contracts with Customers (Topic 606), requiring an entity to recognize the amount of revenue to which it expects to be entitled for the transfer of promised goods or services to customers. The updated standard will replace most existing revenue recognition guidance in U.S. GAAP when it becomes effective and permits the use of either a full retrospective or retrospective with cumulative effect transition method. In August 2015, the FASB issued 2015-14, Revenue from Contracts with Customers (Topic 606) Deferral of the Effective Date and voted to delay the effective date of the proposed standard. The updated standard will be effective for annual reporting periods beginning after December 15, 2018, and interim periods within annual reporting periods beginning after December 15, 2019. Early implementation is not permitted. SOMA has not yet selected a transition method and is currently evaluating the effect that the updated standard will have on the financial statements. In August 2014, the FASB issued ASU 2014-15, Presentation of Financial Statements—Going Concern (Subtopic 205-40): Disclosure of Uncertainties about an Entity's Ability to Continue as a Going Concern. ASU 2014-15 explicitly requires management to evaluate, at each annual or interim reporting period, whether there are conditions or events that exist which raise substantial doubt about an entity's ability to continue as a going concern and to provide related disclosures. ASU 2014-15 is effective for annual periods ending after December 15, 2016, and annual and interim periods thereafter, with early adoption permitted. The adoption of ASU 2014-15 is not expected to have a material effect on SOMA’s financial statements or disclosures. In April 2015, the FASB issued ASU 2015-03, Interest – Imputation of Interest (Subtopic 835-30) simplifying the Presentation of Debt Issuance Costs. The amendments in this update require that debt issuance costs related to a recognized debt liability be presented in the statement of financial position as a direct deduction from the carrying amount of the debt liability, consistent with debt discounts. The recognition and measurement guidance for debt issuance costs are not affected by the amendments in this Update. The amendments are effective for fiscal years beginning after December 31, 2015. The adoption of ASU 2015-03 is not expected to have a material effect on SOMA’s financial statements or disclosures.
In February 2016, the FASB issued ASU 2016-02, Leases (Topic 842). The guidance in this ASU supersedes the leasing guidance in Topic 840, Leases. Under the new guidance, lessees are required to recognize lease assets and lease liabilities on the balance sheet for all leases with terms longer than 12 months. Leases will be classified as either finance or operating, with classification affecting the pattern of expense recognition in the income statement. The new standard is effective for fiscal years beginning after December 15, 2019, including interim periods within those fiscal years. A modified retrospective transition approach is required for lessees for capital and operating leases existing at, or entered into after, the beginning of the earliest comparative period presented in the financial statements, with certain practical expedients available. SOMA is currently evaluating the impact of the pending adoption of the new standard on its financial statements.

Special Olympics Massachusetts, Inc. Notes to Financial Statements
12
Note 2. Affiliated Organization SOMA received contributions from Special Olympics Incorporated (“SOI”), an affiliated organization, representing its portion of a direct mailing campaign in the amount of $314,883 and $367,318 for the years ended December 31, 2015 and 2014, respectively. The balance due from SOI relating to the direct mailing campaign at December 31, 2015 and 2014 was $22,336 and $58,637, respectively, and is included in contributions receivable. For the years ended December 31, 2015 and 2014, SOMA paid $86,909 and $86,580, respectively, of chapter fees to SOI. Note 3. Contributions Receivable Unconditional promises to give are included in the financial statements as contributions receivable and revenue in the appropriate net asset class. The unconditional promises to give are expected to be received within one year and consist mostly of amounts due under that year’s telemarketing agreement (see note 15), direct mailings and various corporate sponsorships for events that occurred during the year. The total amount of outstanding contributions at December 31, 2015 and 2014 are $597,008 and $629,556, respectively. This includes the balances due from SOI in note two. The amounts are expected to be fully collected in the following calendar year, and therefore no allowance for doubtful accounts or discount has been recorded. Note 4. Pledges Receivable During 2005, SOMA began a capital campaign to further its mission, continue to grow, and construct a 25,000 sq. ft. state-of-the-art headquarters/training center in Marlborough, Massachusetts which was completed in October 2009. Unconditional promises to give related to SOMA’s campaign are included in the financial statements as pledges receivable and revenue in the appropriate net asset category. The pledges are due in various payment streams. 2015 2014 Amounts due in: Less than one year $ 71,820 $ 104,997 One to five years 25,900 53,670 Total pledges receivable, gross $ 97,720 $ 158,667 Note 5. Investments The fair value of investments was as follows at December 31: 2015 2014 Domestic equity securities $ 1,874,589 $ 2,040,888 International equity securities 381,657 226,765 Corporate bonds 1,568,553 1,495,751 U.S. government bonds - 82,196 Municipal bonds 200,723 129,002 Exchange-traded mutual funds 288,063 305,894 Money market funds 137,602 191,987 $ 4,451,187 $ 4,472,483

Special Olympics Massachusetts, Inc. Notes to Financial Statements
13
Note 6. Fair Value Measurements The following tables are a summary of assets that SOMA measures at fair value on a recurring basis, by level, within the fair value hierarchy at December 31: 2015 Level 1 Level 2 Level 3 Total Investments: Domestic equity securities $ 1,874,589 $ - $ - $ 1,874,589International equity securities 381,657 - - 381,657Corporate bonds 1,568,553 - - 1,568,553Municipal bonds 200,723 - - 200,723Exchange-traded mutual funds 288,063 - - 288,063Money market funds - 137,602 - 137,602 $ 4,313,585 $ 137,602 $ - $ 4,451,187
2014 Level 1 Level 2 Level 3 Total Investments: Domestic equity securities $ 2,040,888 $ - $ - $ 2,040,888International equity securities 226,765 - - 226,765Corporate bonds 1,495,751 - - 1,495,751U.S. government bonds 82,196 - - 82,196Municipal bonds 129,002 - - 129,002Exchange-traded mutual funds 305,894 - - 305,894Money market funds - 191,987 - 191,987
$ 4,280,496 $ 191,987 $ - $ 4,472,483 Note 7. Land, Building and Equipment Land, building and equipment was as follows at December 31: 2015 2014 Building $ 9,019,208 $ 9,003,796 Land 407,116 407,116 Furniture and fixtures 106,075 96,175 Equipment 499,535 569,118 Software 333,789 346,422 10,365,723 10,422,627 Less - accumulated depreciation and amortization (2,294,735) (2,128,416) $ 8,070,988 $ 8,294,211 Depreciation expense totaled $271,254 and $302,942 for the years ended December 31, 2015 and 2014, respectively.
Special Olympics Massachusetts, Inc. Notes to Financial Statements
14
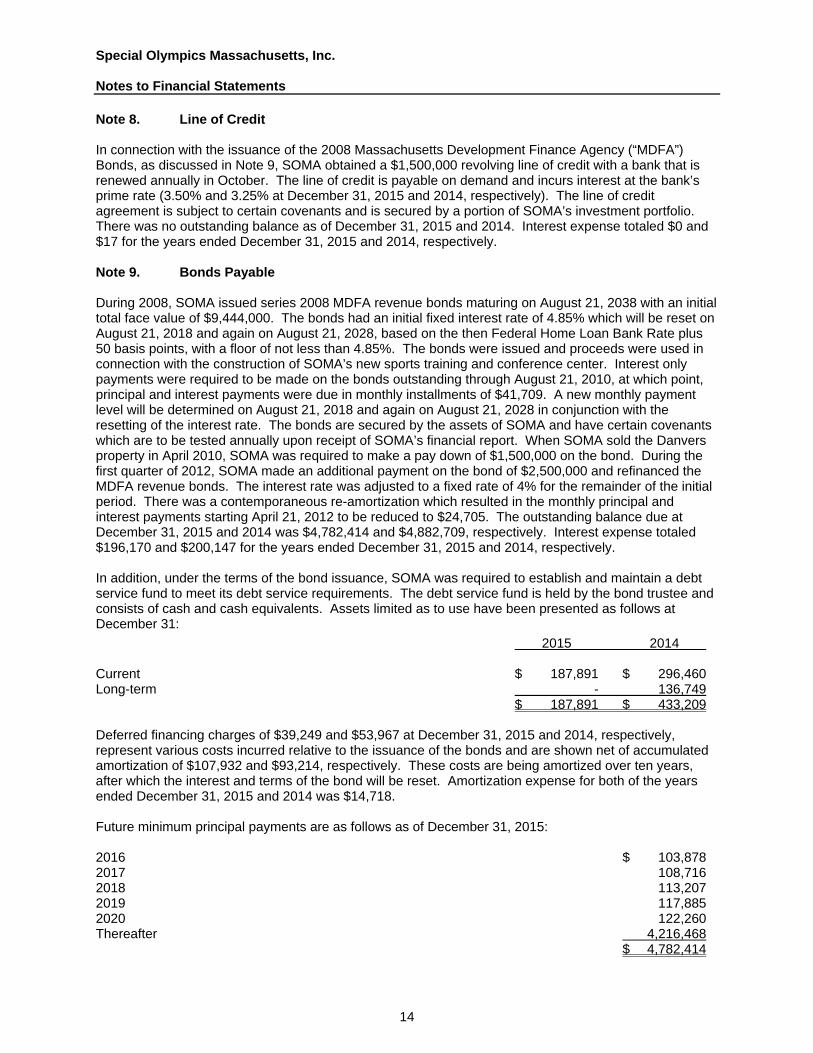
Note 8. Line of Credit In connection with the issuance of the 2008 Massachusetts Development Finance Agency (“MDFA”) Bonds, as discussed in Note 9, SOMA obtained a $1,500,000 revolving line of credit with a bank that is renewed annually in October. The line of credit is payable on demand and incurs interest at the bank’s prime rate (3.50% and 3.25% at December 31, 2015 and 2014, respectively). The line of credit agreement is subject to certain covenants and is secured by a portion of SOMA’s investment portfolio. There was no outstanding balance as of December 31, 2015 and 2014. Interest expense totaled $0 and $17 for the years ended December 31, 2015 and 2014, respectively. Note 9. Bonds Payable During 2008, SOMA issued series 2008 MDFA revenue bonds maturing on August 21, 2038 with an initial total face value of $9,444,000. The bonds had an initial fixed interest rate of 4.85% which will be reset on August 21, 2018 and again on August 21, 2028, based on the then Federal Home Loan Bank Rate plus 50 basis points, with a floor of not less than 4.85%. The bonds were issued and proceeds were used in connection with the construction of SOMA’s new sports training and conference center. Interest only payments were required to be made on the bonds outstanding through August 21, 2010, at which point, principal and interest payments were due in monthly installments of $41,709. A new monthly payment level will be determined on August 21, 2018 and again on August 21, 2028 in conjunction with the resetting of the interest rate. The bonds are secured by the assets of SOMA and have certain covenants which are to be tested annually upon receipt of SOMA’s financial report. When SOMA sold the Danvers property in April 2010, SOMA was required to make a pay down of $1,500,000 on the bond. During the first quarter of 2012, SOMA made an additional payment on the bond of $2,500,000 and refinanced the MDFA revenue bonds. The interest rate was adjusted to a fixed rate of 4% for the remainder of the initial period. There was a contemporaneous re-amortization which resulted in the monthly principal and interest payments starting April 21, 2012 to be reduced to $24,705. The outstanding balance due at December 31, 2015 and 2014 was $4,782,414 and $4,882,709, respectively. Interest expense totaled $196,170 and $200,147 for the years ended December 31, 2015 and 2014, respectively. In addition, under the terms of the bond issuance, SOMA was required to establish and maintain a debt service fund to meet its debt service requirements. The debt service fund is held by the bond trustee and consists of cash and cash equivalents. Assets limited as to use have been presented as follows at December 31:
2015 2014 Current $ 187,891 $ 296,460 Long-term - 136,749 $ 187,891 $ 433,209 Deferred financing charges of $39,249 and $53,967 at December 31, 2015 and 2014, respectively, represent various costs incurred relative to the issuance of the bonds and are shown net of accumulated amortization of $107,932 and $93,214, respectively. These costs are being amortized over ten years, after which the interest and terms of the bond will be reset. Amortization expense for both of the years ended December 31, 2015 and 2014 was $14,718. Future minimum principal payments are as follows as of December 31, 2015: 2016 $ 103,878 2017 108,716 2018 113,207 2019 117,885 2020 122,260 Thereafter 4,216,468 $ 4,782,414

Special Olympics Massachusetts, Inc. Notes to Financial Statements
15
Note 10. Contributed Materials and Facilities The value of contributed materials and facilities during the years ended December 31, 2015 and 2014 was $587,596 and $430,081, respectively. Note 11. Contributed Services The value of contributed services during the years ended December 31, 2015 and 2014 was $7,222,626 and $7,766,809, respectively. Note 12. Operating Lease Obligations SOMA leases office equipment under operating lease agreements requiring monthly payments ranging from $169 to $247 expiring in various dates through February 2021. Lease expense totaled $6,133 and $1,980 for each of the years ended December 31, 2015 and 2014, respectively. SOMA leased an office building that required monthly payments ranging from $2,078 to $2,185 per month, expiring in October 2015. SOMA also leased other office spaces requiring monthly payments of $800 and $1,500 under agreements that expired in February 2010 and June 2012, respectively. Both leases were month to month during 2015. Lease expense for the years ended December 31, 2015 and 2014 was $30,850 and $53,555, respectively. During 2015, SOMA consolidated operations to the headquarters office in Marlborough, MA and no longer pays rent, or has any obligation to do so, at the former satellite locations throughout the state. Future minimum lease payments are as follows as of December 31: 2016 $ 7,836 2017 7,836 2018 3,934 2019 2,028 2020 2,028 Thereafter 338 $ 24,000 Note 13. Life Insurance Policies Certain individuals including board members and the former CEO’s of SOMA have obtained life insurance policies naming SOMA as beneficiary of the death benefits and any cash surrender value on the policies. The cash surrender value on these policies was $8,101 at December 31, 2015 and 2014. In addition, SOMA had purchased a split dollar life insurance policy for the benefit of the then CEO. This individual, who retired from SOMA in March 2013, is the sole owner of the policy and may exercise all ownership rights granted by the terms of the policy, but the existing assignment of the policy to SOMA shall not be revised without the consent of SOMA. The premium for the policy was paid by SOMA during the individual’s employment. The final premium paid on the policy was made during the year ended December 31, 2013. SOMA has the right to receive a portion of the policy’s benefit, equal to the total amount of its share of the premiums paid, net of the taxable amounts reported to the former CEO, upon death of the insured. The policy can only be terminated through joint approval of both SOMA and the former CEO. Premiums paid to date on the policy as of December 31, 2015 and 2014 totaled $881,010. The cash surrender value of the policy at December 31, 2015 and 2014 was $738,569 and $817,269, respectively. SOMA has recorded an asset of $846,417, which is equal to the total premiums paid to date, net of the taxable amounts reported in previous years, as SOMA has no intention to terminate the policy.

Special Olympics Massachusetts, Inc. Notes to Financial Statements
16
Note 14. Retirement Benefits SOMA maintains a defined contribution retirement plan. All employees 21 years of age or older who have completed one year of service and one thousand hours of service are eligible for the plan. During the years ended December 31, 2015 and 2014, SOMA made discretionary contributions, which were approved by the Board of Directors, of $51,477 and $66,377, respectively, to the plan. Note 15. Telemarketing SOMA has an agreement with The Heritage Co. (“Heritage”), a telemarketing company, for telemarketing and fundraising services, with the goals of education of the public, identification of potential program athletes, coaches and volunteers, encouragement for support on local levels by way of attendance at athletic events, and current fundraising. Contributions raised through them during the years ended December 31, 2015 and 2014 were $641,169 and $885,044, respectively. Fees charged by the telemarketing company for fundraising services for the years ended December 31, 2015 and 2014 were $365,467 and $410,044, respectively. Under the terms of the agreement, Heritage has guaranteed SOMA a minimum of $275,000 and $475,000 of contributions for the years ended December 31, 2015 and 2014, respectively. At December 31, 2015 and 2014, Heritage owed SOMA $67,646 and $266,760, respectively, which is included in contributions receivable. At December 31, 2015 and 2014, SOMA owed Heritage $51,220 and $84,884, respectively, which is included in accrued expenses. Note 16. Temporarily Restricted Net Assets The following is a summary of temporarily restricted net assets as of December 31: 2015 2014 The Capital Campaign-time restrictions $ 97,720 $ 158,667 Note 17. Net Assets Released from Donor Restrictions Net assets released from donor restrictions for the years ended December 31 were as follows: 2015 2014 Operating:
Receipts of Capital Campaign pledges receivable $ 49,475 $ 69,650

17
Independent Auditor’s Report on the Supplementary Information
To the Board of Directors Special Olympics Massachusetts, Inc. Marlborough, Massachusetts We have audited the financial statements of Special Olympics Massachusetts, Inc. as of and for the years ended December 31, 2015 and 2014, and have issued our report thereon, dated May 17, 2016, which contained an unmodified opinion on those financial statements. Our audits were performed for the purpose of forming an opinion on the financial statements as a whole. We have not performed any procedures with respect to the audited financial statements subsequent to May 17, 2016. The accompanying supplementary information is presented for purposes of additional analysis and is not a required part of the financial statements. Such information is the responsibility of management and was derived from and relates directly to the underlying accounting and other records used to prepare the financial statements. The information has been subjected to the auditing procedures applied in the audits of the financial statements and certain additional procedures, including comparing and reconciling such information directly to the underlying accounting and other records used to prepare the financial statements or to the financial statements themselves, and other additional procedures in accordance with auditing standards generally accepted in the United States of America. In our opinion, the information is fairly stated in all material respects in relation to the financial statements as a whole.
Boston, Massachusetts May 17, 2016

Special Olympics Massachusetts, Inc.
Schedule of Expense Percentages
Year Ended December 31, 2015
Management
and
Program General Fundraising
Percentage of total expenses 86.16% 3.38% 10.46%
ProManagement andFundraising
Including in-kind ## 3.38% ##
Program86.16%
Management and General3.38%
Fundraising10.46%
18

Special Olympics Massachusetts, Inc.
Schedule of Expense Percentages
Year Ended December 31, 2014
Management
and
Program General Fundraising
Percentage of total expenses 87.49% 3.72% 8.79%
ProManagement andFundraisingIncluding in-kind ## 3.72% ##
Program87.49%
Management and General3.72%
Fundraising8.79%
19