special project final report template
TRANSCRIPT

SPECIAL PROJECTFINAL REPORT
All the following mandatory information needs to be provided.
Project Title: Small-scale severe weather events: Downscaling using Harmonie
Computer Project Account: spnlster
Start Year - End Year : 2015 - 2015
Principal Investigator(s) Andreas Sterl
Affiliation/Address: KNMI (Royal Netherlands Meteorological Institute)
P.O. Box 201
3730 AE De Bilt
Netherlands
Other Researchers (Name/Affiliation):
Henk van den Brink ([email protected])
Bert van Ulft ([email protected])
June 2016 Page1of 11

The following should cover the entire project duration.
Summary of project objectives (10 lines max)
The non-hydrostatic Harmonie model is used to downscale climate model results. It offers the possibility to investigate the effect of climate change on small-scale phenomena like convective rainfall and wind gusts. This is not only relevant from a scientific point of view, but has many applications. For example, wind turbines suffer from night-time low level jets that are not represented well in current climate models, and convective events are only parameterized.
Summary of problems encountered(If you encountered any problems of a more technical nature, please describe them here. )
• The request for this proposal was based on using Harmonie on a horizontal domain of 500 x 500 grid points (7°W – 10°E, 48°N – 59°N). This domain turned out to be too small, as often convective systems developing over France are advected into the Netherlands. A new domain, including the whole of France and comprising of 800 x 800 grid points (roughly 10°W – 18°E, 42°N –60°N), had to be used instead. This increases CPU usage and storage amount by roughly a factor of 2.5.
• In 2015 a lot of test runs to determine the optimal configuration of the system had to be performed. Therefore, and because much more CPU time was needed (see foregoing item), only one year (2012) of downscaling could be performed.
Experience with the Special Project framework (Please let us know about your experience with administrative aspects like the application procedure, progress reporting etc.)
no issues.
Summary of results (This section should comprise up to 10 pages and can be replaced by a short summary plus an existing scientific report on the project.)
OverviewThe work concentrated on three aspects,
1. technically set up the model at ECMWF and create an environment for running it over long periods of time,
2. identify the most suitable combination of model physics (parameter values and parametrizations),
3. perform and evaluate one year of downscaling.
Although Harmonie is used operationally at KNMI, action (2) is needed because we use a newer version of the Harmonie code (38h1.2) than is used in operations, with improved parametrizations, and because we want to run the model in climate mode rather than in forecast mode. In climate mode only values at the lateral boundaries of the model domain are regularly updated from the driving model (here ERA-Interim), while it is free to evolve in the interior. In forecast mode, also
June 2016 Page 2 of 11

interior values are regularly updated. The suitability of the model to run in climate mode had to be established.
Setting up the modelThe originally envisaged model domain of 500 x 500 grid points proved to be too small. Convectivesystems often develop over France and are advected into the Netherlands. As convection is not properly resolved in the driving model (the model from which the lateral boundary conditions are taken), this process is not well represented when the southern model boundary lies over northern France. The model domain had therefore to be extended to the 800 x 800 point domain shown in Figure 1.
Figure 1: New model domain with surface temperature as illustration.
The technical infrastructure to perform long model runs was established. It is now possible to run the model in three modes, namely
1. forecast mode: series of short runs, each fully initialized from driving model (“cold start”)
2. hindcast mode: as 1., but soil parameters not initialized but taken from preceding run
3. climate mode: only lateral boundary values and SST from driving model.
Hindcast mode was used for testing. Results from hindcast mode and climate mode do not differ much. The weather in the limited domain over Europe is mainly driven by the large scale circulation.
Model physicsA new model version of Harmonie is used (version 38h1.2). It comes with several new parametrization options, which had to be tested. Especially, we tested new parametrizations of
ice clouds, and
turbulence (called HaRaTu).
The latter is based on the RACMO turbulence scheme, where it greatly improved the representation of shallow convection. Furthermore, in Harmonie the cloud inhomogeneity factor (INHF) is traditionally set to 0.7. We also investigated the impact of the more natural choice of setting it to 1.
June 2016 Page 3 of 11
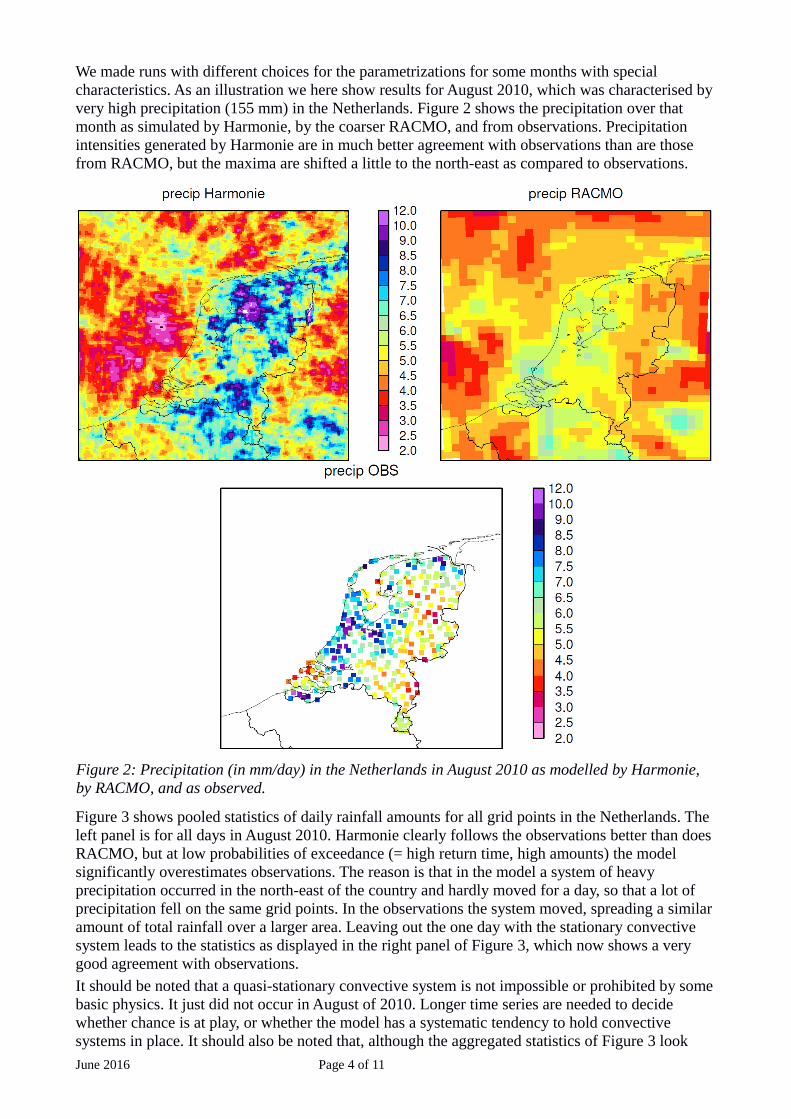
We made runs with different choices for the parametrizations for some months with special characteristics. As an illustration we here show results for August 2010, which was characterised byvery high precipitation (155 mm) in the Netherlands. Figure 2 shows the precipitation over that month as simulated by Harmonie, by the coarser RACMO, and from observations. Precipitation intensities generated by Harmonie are in much better agreement with observations than are those from RACMO, but the maxima are shifted a little to the north-east as compared to observations.
Figure 3 shows pooled statistics of daily rainfall amounts for all grid points in the Netherlands. The left panel is for all days in August 2010. Harmonie clearly follows the observations better than does RACMO, but at low probabilities of exceedance (= high return time, high amounts) the model significantly overestimates observations. The reason is that in the model a system of heavy precipitation occurred in the north-east of the country and hardly moved for a day, so that a lot of precipitation fell on the same grid points. In the observations the system moved, spreading a similar amount of total rainfall over a larger area. Leaving out the one day with the stationary convective system leads to the statistics as displayed in the right panel of Figure 3, which now shows a very good agreement with observations.
It should be noted that a quasi-stationary convective system is not impossible or prohibited by somebasic physics. It just did not occur in August of 2010. Longer time series are needed to decide whether chance is at play, or whether the model has a systematic tendency to hold convective systems in place. It should also be noted that, although the aggregated statistics of Figure 3 look
June 2016 Page 4 of 11
Figure 2: Precipitation (in mm/day) in the Netherlands in August 2010 as modelled by Harmonie, by RACMO, and as observed.

very good, local correlations between observations and model results are often low. This shows that convective precipitation is a highly stochastic process, and that the model is able to reproduce its statistical characteristics.
Figure 3: Pooled statistics (all Dutch land grid points) of daily precipitation amount vs. probability of exceedance for August 2010. Comparison between Harmonie, RACMO, and observations. Left: all days, right: all days except July 4 (see text for explanation).
Figure 4: Comparison of model runs using different parametrization packages and observations from the Cabauw meteorological tower. Red and blue: default Harmonie with two different values for INHF (0.7 and 1), green: with HaRaTu, yellow: with old parametrization of ice clouds. Upper row: mean daily cycle of long wave radiation (left) and total cloud cover (right). Lower row: night-time vertical profiles of wind (left) and temperature (right).
Figure 4 shows comparisons of some model variables as obtained from different parametrization settings with measurements taken at the Cabauw tower. All four panels show that invoking the RACMO-based turbulence scheme has by far the largest impact. With the exception of near-surface temperature, this parametrization also leads to a better correspondence between model and observations.June 2016 Page 5 of 11

One year downscalingERA-interim results for 2012 were downscaled using both hindcast and climate mode. As the results do not differ much, only the climate run is considered here. Three variables have been assessed and are presented here, namely temperature, precipitation and soil moisture.
The quality of the model output is assessed by comparing it to the following observational data sets
hourly KNMI station data, obtained from http://www.knmi.nl/nederland-nu/klimatologie/ uurgegevens,
daily precipitation data from KNMI precipitation stations, obtained from http://www.knmi.nl/nederland-nu/klimatologie/monv/reeksen,
daily E-OBS data (Haylock et al., 2008) on a regular 0.25º grid. Gridded data set of precipitation and temperature, based on station observations,
ERA-Interim (Dee et al., 2011) reanalysis. 6-hourly data on a regular 1.5º grid,
soil-water index (SWI) derived from satellite observations (METOPS-ASCAT) on a regular 0.1º grid from the Copernicus Global Land Service (http://land.copernicus.vgt.vito.be/PDF/portal/Application.html#Home),
soil moisture and ground water data from Cabauw.
TemperatureThe annual-mean temperatures from the Harmonie run, E-OBS and ERA-Interim are compared in Figure 5. While E-OBS and ERA-Interim compare well, Harmonie is clearly too cold, and the difference is larger over France than in the north-eastern part of the domain.
Figure 5: Annual-mean temperature in Harmonie (top left), E-OBS (top right) and ERA-Interim (bottom).
June 2016 Page 6 of 11

Figure 6: Maximum temperatures on 19 August 2012, from Harmonie, E-OBS, and ERA-Interim.
The cold bias of Harmonie is not only visible in the mean, but in general also appears in cold and warm extremes. Figure 6 shows Harmonie, E-OBS and ERA-Interim values for the maximum temperature on 19 August 2012, which in large parts of Europe was the hottest day of the year. Harmonie clearly underestimates the high temperatures that were observed in a large area from the Benelux into Poland, but overestimates them over much of France. However, Harmonie is clearly superior to ERA-Interim, where maxima do not exceed 36º, while observed values reach 40º in parts of France, and Harmonie even exceeds 42º.
The ability of a high-resolution model to better capture high extremes shows the value of such a model in investigating the impact of climate change on extreme temperatures, which was one reason to start this project.
June 2016 Page 7 of 11

Figure 7: Precipitation over Europe, annual sum over 2012 from Harmonie (upper), E-OBS, and ERA-Interim (lower). Harmonie box-smoothed over 10 and 50 grid points (left and right, respectively). Note that the contour interval increases from 100 to 500 mm at 1500 mm.
Precipitation
Figure 7 compares the annual precipitation from Harmonie, E-OBS, and ERA-Interim. E-OBS (Haylock et al., 2008) is an observation-based gridded dataset of daily precipitation with a spatial resolution of 0.25º. The Harmonie output has been smoothed over 10 (50) grid boxes to make the spatial scales of Harmonie comparable to those of E-OBS.
The patterns from Harmonie and E-OBS compare well (see, e.g., the local maximum over Pommerania (north-east Poland), the maximum along the Swedish west coast, or the minimum in the area of Frankfurt (Germany)). However, while the patterns are very similar, the total precipitation amounts are higher in Harmonie than in E-OBS, especially in areas of steep orography(e.g., the mountains along the German-Czech border). The notable exception to the latter is Brittany(Bretange), where the observed maximum is not present in Harmonie. This may be an artifact of thefact that the domain boundary of Harmonie is very close to this area. The tendency for Harmonie to produce precipitation amounts higher than observed has also been found by Lindstedt et al. (2015). They also find that ERA-Interim precipitation is higher than E-OBS data, a tendency that can also be seen in Figure 7.
The overestimation of precipitation is especially large during high-precip events. For instance, on 10 May 2012 Harmonie produced nearly 50 mm over a large area spanning north-west Germany, while E-OBS only shows less than 20 mm. However, the pattern of precipitation is the same in bothdata sets (not shown).
June 2016 Page 8 of 11
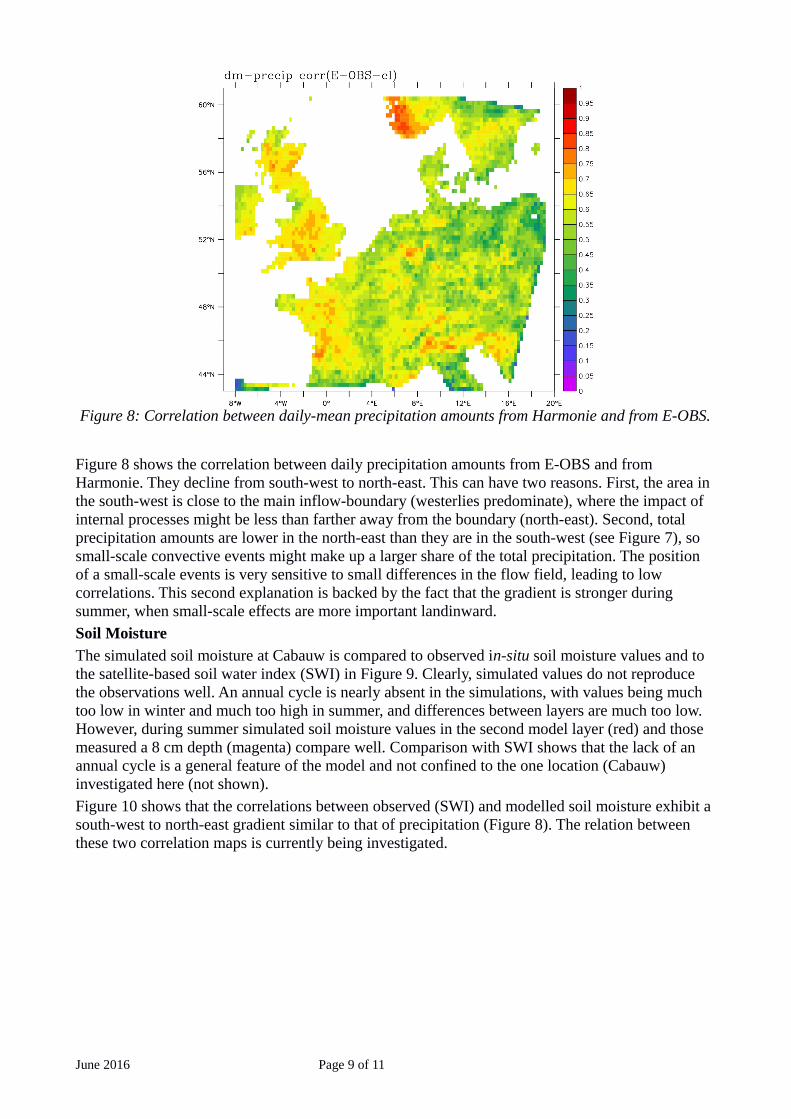
Figure 8: Correlation between daily-mean precipitation amounts from Harmonie and from E-OBS.
Figure 8 shows the correlation between daily precipitation amounts from E-OBS and from Harmonie. They decline from south-west to north-east. This can have two reasons. First, the area in the south-west is close to the main inflow-boundary (westerlies predominate), where the impact of internal processes might be less than farther away from the boundary (north-east). Second, total precipitation amounts are lower in the north-east than they are in the south-west (see Figure 7), so small-scale convective events might make up a larger share of the total precipitation. The position of a small-scale events is very sensitive to small differences in the flow field, leading to low correlations. This second explanation is backed by the fact that the gradient is stronger during summer, when small-scale effects are more important landinward.
Soil Moisture
The simulated soil moisture at Cabauw is compared to observed in-situ soil moisture values and to the satellite-based soil water index (SWI) in Figure 9. Clearly, simulated values do not reproduce the observations well. An annual cycle is nearly absent in the simulations, with values being much too low in winter and much too high in summer, and differences between layers are much too low. However, during summer simulated soil moisture values in the second model layer (red) and those measured a 8 cm depth (magenta) compare well. Comparison with SWI shows that the lack of an annual cycle is a general feature of the model and not confined to the one location (Cabauw) investigated here (not shown).
Figure 10 shows that the correlations between observed (SWI) and modelled soil moisture exhibit a south-west to north-east gradient similar to that of precipitation (Figure 8). The relation between these two correlation maps is currently being investigated.
June 2016 Page 9 of 11

Figure 9: Soil moisture in Cabauw in first (black), second (red) and third (green) layer, SWI/100 (blue) and measured soil moisture at depths 3 cm (cyan) and 8 cm (magenta).
Figure 10: Correlations between daily values of observed (SWI) and modelled (WSA) soil moisture.
Conclusions
A configuration of Harmonie suited for climate studies has been found. The RACMO turbulence package has been implemented into Harmonie and shown to yield better results than the old turbulence scheme. Results from a one-year long (2012) downscaling exercise in which the lateral boundary conditions were taken from ERA-Interim show a general south-west to north-east gradientJune 2016 Page 10 of 11

in model performance. In general, model results compare better with E-OBS over France than over Poland. At the moment it is unclear whether this is caused by France being closer to the main inflow-boundary of the model domain, or by different physical processes playing the main role in generating variability in different parts of the model domain. Also the interplay between temperature, soil moisture and precipitation needs further investigation.
ReferencesDee, D.P., S.M. Uppala, A.J. Simmons, P. Berrisford, P. Poli, S. Kobayashi, U. Andrae, M.A. Balmaseda, G. Balsamo, P. Bauer, P. Bechtold, A.C.M. Beljaars, L. van de Berg, J. Bidlot, N. Bormann, C. Delsol, R. Dragani, M. Fuentes, A.J. Geer, L. Haimberger, S.B. Healy, H. Hersbach, E.V. Holm, L. Isaksen, P. Kållberg,M. Köhler, M. Matricardi, A.P. McNally, B.M. Monge-Sanz, J.-J. Morcrette, B.-K. Park, C. Peubey, P. de Rosnay, C. Tavolato, J.-N. Thepaut, and F. Vitart (2011): The ERA-Interim reanalysis: configuration and performance of the data assimilation system, Q.J.R. Meteorol. Soc., 137, 553597, doi: 10.1002/qj.828.
Haylock, M.R., N. Hofstra, A.M.G. Klein Tank, E.J. Klok, P.D. Jones, M. New (2008): A European daily high-resolution gridded dataset of surface temperature and precipitation. J. Geophys. Res. (Atmospheres), 113, D20119, doi:10.1029/2008JD10201.
Lindstedt, D., P. Lind, E. Kjellström, and C. Jones (2015): A new regional climate model operating at the meso-gamma scale: performance over Europe. Tellus A, 67, 24138, doi: 10.3402/tellusa.v67.24138.
List of publications/reports from the project with complete references
n/a
Future plans (Please let us know of any imminent plans regarding a continuation of this research activity, in particular if they are linked to another/new Special Project.)
We still plan to continue the project and downscale at least 10 years ERA-Interim as a reference, and two times 10 years of EC-Earth, both for present and future climate, to investigate the climate-change signal. As shown above, the performance regarding soil moisture needs improving. Currently we are implementing a new surface scheme (SURFEX) to deal with this problem.
Unfortunately, our regular request to extend the Special Project was rejected, and we were only granted a new project in April. Therefore, and because we have to implement the new surface scheme,no long runs have been made in 2016 so far. Continuing the downscaling will be continued soon, and we will apply for an extension of the project for 2017 and beyond.
June 2016 Page 11 of 11