special purpose vehicles: empirical evidence on...
TRANSCRIPT

Special Purpose Vehicles: Empirical Evidence on Determinants and Earnings Management*
Mei Feng Katz Graduate School of Business, University of Pittsburgh
E-mail: [email protected] Phone: (412) 624-1347
Jeffrey D. Gramlich
University of Southern Maine School of Business and Copenhagen Business School E-mail: [email protected]
Phone: (207) 228-8232
Sanjay Gupta Eli Broad College of Business, Michigan State University
E-mail: [email protected] Phone: (517) 432-6488
Forthcoming in The Accounting Review.
The authors gratefully acknowledge John Graham, Andy Leone, Cathy Shakespeare, and The Corporate Library for sharing various data used in this study (the remainder of the data is obtained from publicly available sources). Helpful comments from Anwer Ahmed, Patty Dechow, Amy Dunbar, Harry Evans, Liming Guan, Emre Karaoglu, Jim Largay, Mary Lea McAnally, Sarah McVay, Lil Mills, Kaye Newberry, Tom Omer, John Phillips, Cathy Shakespeare, Marjorie Shelley, Anup Srivastava, Terry Shevlin, Tom Stober, Jake Thomas, Terry Warfield and Dan Weimer, and workshop participants at Texas A&M University, the University of Pittsburgh, University of Connecticut, University of Wisconsin, the 2005 American Accounting Association annual meeting, and the 2006 Hong Kong University of Science and Technology Summer Accounting Symposium are gratefully appreciated.
Special Purpose Vehicles: Empirical Evidence on Determinants and Earnings Management
Abstract: We investigate the use, determinants, and earnings effects of special purpose
vehicles. Based on a proxy of SPV activity that can be applied to a broad cross-section of
firms over time, we find a two-and-a-half fold monotonic increase in the percentage of
firms using at least one SPV during the eight-year period from 1997 through 2004. Tobit
regressions of the determinants of SPV use show that SPV activity increases with
financial reporting incentives and economic and tax motivations, but strong corporate
governance tends to mitigate their use. In addition, the evidence is consistent with SPVs
arranged for financial reporting purposes being associated with earnings management,
whereas the same does not appear to be the case for SPVs set up mainly for economic,
tax, and other reasons.
JEL Codes: M41, G35
Keywords: Special purpose vehicles; Off-balance sheet entities; Earnings management;
Taxes; Corporate governance.
Data Availability: Data are available from public sources.

1
Special Purpose Vehicles: Empirical Evidence on Determinants and Earnings Management
I. INTRODUCTION
Special purpose vehicles (SPVs), also referred to as special purpose entities or variable interest
entities, have attracted considerable attention from policymakers and regulators following some
spectacular corporate scandals involving their use. Yet, not much is known about the prevalence of SPVs
or the importance of different motivations associated with their use. In addition, despite concerns, much
remains to be learned about SPVs’ role in managing firms’ earnings, as prior research has mostly focused
on their balance sheet implications. In this study, we provide large-sample evidence on both of these
issues. Specifically, we have two research objectives. First, we investigate the determinants of SPV use
by examining the extent that SPV activity is explained by financial reporting motivations, economic and
tax incentives, and corporate governance quality. Second, we examine whether SPVs formed primarily
for financial reporting reasons are associated with earnings management. We base our analysis on a new
proxy for SPV use that can be applied to a broad cross-section of firms over time.
An SPV is a legally distinct entity with a limited life created to carry out a narrow pre-defined
activity or series of transactions for a “sponsor” company (Coallier 2002; Dharan 2002; Hartgraves and
Benston 2002; Soroosh and Ciesielski 2004). SPVs can serve legitimate business purposes by raising
capital for their sponsors and by isolating and homogenizing cash flows and business risks of a specific
asset class. SPVs are also used frequently for tax purposes, especially for cross-jurisdictional tax planning
and for optimally allocating tax benefits among investor classes. Despite these compelling economic
motivations, much of the discussion around SPVs has centered on the financial reporting benefits that
result when a sponsor avoids consolidating the SPV in its financial statements.1 Specifically, treating the
SPV as a separate entity allows a sponsor to not only hide debt but to also manage its earnings.
1 Until 2003, per EITF 90-15, SPV consolidation could be avoided if outside investors maintained equity of at least three percent of the SPV’s total capitalization (FASB 1990). Although this guidance was provided for leasing transactions, the SEC staff’s response to the bulletin effectively extended the three percent test to other transactions. In response to perceived abuses involving SPVs, FASB issued FIN 46(R) (FASB 2003), a principles-based guidance for consolidating and disclosing SPVs, and a recent Exposure Draft amending FIN 46(R) (FASB 2008). Both pronouncements are discussed in more detail later.

2
The extensive investigations around Enron’s collapse provide the most direct evidence about
SPVs’ role in earnings management. The Special Investigative Committee on Enron reported that
transactions with certain SPVs “allowed Enron to conceal from the market very large losses resulting
from Enron’s merchant investments” (Powers 2002, 4). Enron’s court-appointed bankruptcy examiner
explained that an important motivation for using SPVs was the “compensation structure that depended
heavily on the reported financial performance of the company, with particular emphasis on the
achievement of goals for net income and cash flow” (Batson 2003, 92). While Enron was arguably an
extreme example, financial commentators (e.g., Bryan-Low and Brown 2002; Covert 2002; Cowan and
Talley 2002), including Enron’s auditor (Berardino 2001), caution investors that the company was not
alone in its use of SPVs to mask its underlying financial risk and operating performance. Indeed, other
SEC investigations, including PNC Financial, Conseco, and Amerco, reveal instances where SPV use has
been intended to achieve financial reporting objectives.2 Summarizing its descriptive study of SPVs
conducted under the mandate of the Sarbanes-Oxley legislation, the SEC’s staff wrote:
Issuers often structure transfers in order to achieve or avoid sale accounting, trigger or avoid the recognition of losses (or gains), or change the measurement attribute applied to the recorded assets and liabilities. The Staff believes, based on its reviews of issuer filings, that the most frequent structuring goal is to achieve sale treatment without consolidation of any related SPEs. While economic motivations for most asset transfers exist, some transfers of financial assets appear to be significantly, primarily, or even solely entered into with accounting motivations in mind (SEC 2005, 45).
The SEC’s and FASB’s recent regulatory response requiring disclosure of off-balance sheet entities and
increasing the requirements for excluding SPV effects from sponsor financial statements, respectively,
underscores the importance of their concerns.
To perform our empirical analysis, we employ a proxy for SPV use that is a count of the limited
partnerships, limited liability partnerships, limited liability companies, and trusts included in the list of
2 In particular, these investigations indicate that SPVs have been improperly used for earnings management. For instance, PNC Financial transferred $762 million in troubled (nonperforming) loans and venture capital investments to SPVs in order to overstate 2001 pretax earnings by $240 million, a 52 percent overstatement of earnings per share (SEC 2002). For its part in facilitating PNC Financial’s illicit use of SPVs, AIG paid $126 million in penalties, interest, and disgorgement to the SEC (SEC 2004b). In a separate investigation, the SEC found that Conseco Inc. used SPVs to hide declines in the values of securities, thus overstating its 1999 earnings by $367 million (SEC 2004a). Amerco’s July 2002 Form 10-K restatement of 2001 earnings includes the losses of a previously excluded SPV that decreased the company’s earnings by $12 million, or 92 percent of previously-reported earnings.

3
subsidiaries and affiliates in Exhibit 21 of the SEC Form 10-K. We choose this proxy because: (1) it
applies to a broad cross-section of firms over a time period when few disclosure requirements concerning
SPVs existed, and (2) SPVs are typically organized using one of these “flow-through” legal structures
(Dharan 2002; Clauss and Reed 2003; Soroosh and Ciesielski 2004), which was corroborated by the staff
of the SEC’s Office of the Chief Accountant and anecdotal evidence surrounding Enron and other
companies.3
Using a sample of 6,473 firms from 1997 to 2004, we obtain 22,604 firm-year observations for
which Exhibit 21 and other requisite data are available. During this eight-year period, we find a two-and-
a-half fold increase in the percent of observations reporting at least one SPV (from 23 percent in 1997 to
59 percent in 2004). SPV use appears highest among industry groups that tend to be leasing-activity
intensive, such as trading, real estate, and construction, traditionally viewed as one of the main activities
involving SPV use. We also find relatively high SPV use in banking and telecommunications, consistent
with these industries providing new avenues for SPV use during the 1990s, such as the securitization of
financial assets and broadband capacity (Dharan 2002).
With respect to investigating the determinants of SPV use, Tobit regression results show that SPV
activity is increasing in financial reporting incentives and economic motivations, but strong corporate
governance mitigates SPV use. Specifically, we find that SPV use is positively related to: (1) leverage, (2)
CEO bonus compensation, (3) availability of funds, and (4) demand for tax benefits, but decreasing in
board independence and independent directors’ stockholdings. These results are robust to a variety of
sensitivity tests, including the use of other model specifications besides Tobit (e.g., logit and OLS),
different sample selection criteria, and alternative definitions of the dependent and independent variables.
In terms of economic magnitude, inter-quartile increases in leverage, availability of funds, intangible
assets, and board independence result in changes in expected SPVs of 1.31, -0.36, 1.05, and -1.04,
3 Enron’s SPVs listed in its Exhibit 21 were mostly organized as limited partnerships and their number grew dramatically from 31 in 1994 to 850 in 2000 (see Appendix A). Many of these SPVs, such as Raptor, Raven, and Whitewing that were both organized as LPs and listed in Exhibit 21 of the company’s 2000 10-K, played key roles in hiding losses and concealing debt, which when disclosed contributed to Enron’s collapse. Powers (2002) details Enron’s SPV structures and transactions. See also Dharan (2002), Emshwiller and Smith (2002), Yale (2002) and Goldin (2003) for discussions of Enron’s use of SPVs.

4
respectively. These effects are quite large given that more than 70 percent of our sample observations
have zero or one SPV. Also, SPV use is increasing in firm size, consistent with larger firms having
greater technical expertise to handle the complexity of structured financing arrangements (SEC 2005).
With respect to examining SPVs’ role in earnings management, we use the Tobit regression
results to parse the number of SPVs for each firm-year into those predicted by financial reporting
motivations, those predicted by economic considerations, and those predicted by other variables. We then
investigate the relation between these predicted SPV components and two measures of earnings
management – discretionary accruals and frequency of small profits or losses. We hypothesize that SPVs
arranged for financial reporting reasons are likely to be positively associated with earnings management
measures, whereas we do not expect a similar relation for SPVs arranged for other reasons. Our evidence
based on both univariate and regression tests is consistent with this hypothesis. The economic magnitude
of this association appears to be substantial. For example, when the number of predicted SPVs for
financial reporting purposes increases by one, on average the probability that a firm reports a small gain
instead of a small loss increases by 18 percent.
Our study makes two main contributions. First, to our knowledge, we provide the first
documentation of the prevalence and determinants of SPV use in a large cross-temporal sample. Prior
studies tend to conduct focused examinations of SPV use in particular transactions, such as research and
development financing (e.g., Shevlin 1987; Beatty et al. 1995) and asset securitizations (e.g., Karaoglu
2005; Dechow et al. 2008). Although a transaction-level focus has the merit of pinpointing the
circumstances of SPV use, it also usually necessitates reliance on small samples or short time periods,
both of which limit the ability to generalize results.
Second, we contribute to the literature on the financial statement effects of SPVs. While previous
large-sample research primarily investigates SPVs’ balance sheet effects (e.g., Mills and Newberry 2005),
we document the role of SPVs in earnings management. As the SEC report (2005) highlights, by not
consolidating SPVs, sponsors are able not only to hide debt but also to manage earnings, with important
implications for both managerial compensation and stock prices (e.g., Murphy 2001; Dechow and Skinner
5
2000). In this regard, our study is similar to Dechow et al.’s (2008) study of corporate governance and
earnings management in the context of asset securitizations, although their sample is limited to 84 firms
with post-September 2000 asset securitizations.
Section II provides some institutional background leading to a conceptual model of SPV use.
Section III defines our SPV proxy and describes the sample, section IV presents the empirical model, and
sections V and VI, respectively, report the results for the determinants of SPV use and the earnings
management tests. Section VII concludes and offers suggestions for further research.
II. INSTITUTIONAL BACKGROUND AND MODEL DEVELOPMENT
SPV Formation and Basic Economic Motivations for SPV Use
SPVs have long been used in a variety of financial arrangements, although their use in leasing
and securitization transactions is most well-known (Hodge 1998; SEC 2005). Figure 1 outlines a typical
SPV formation. The steps usually occur in coordinated fashion rather than in chronological order, with
details of the steps differing depending on the sponsor’s particular needs and the SPV’s use (i.e., leasing
or asset securitization). Typically, a sponsor creates a separate legal entity (SPV) to carry out one or more
transactions of the circumscribed activities (Gorton and Souleles 2006). The SPV then obtains equity
investment from unrelated investors and borrows money. Using these funds, the SPV either purchases
asset(s) from the sponsor, or buys asset(s) from an unrelated third party and leases it (them) to the
sponsor. Either way, a sponsor using an SPV raises off-balance sheet capital that can be used for repaying
debt, funding operations or facilitating expansion.
(Insert Figure 1 here)
The sponsor typically reduces the risk of outside SPV investors (creditors and residual equity
holders), by guaranteeing the loan(s) and/or agreeing to incur a portion of the potential losses associated
with the asset(s) transferred to the SPV, as well as by providing implicit recourse (Calomiris and Mason
2004; Higgins and Mason 2004; Gorton and Souleles 2006). Thus, although the sponsor usually remains
liable, SPV assets are legally isolated from the sponsor’s bankruptcy risk. This “bankruptcy-remote”

6
characteristic insulates lenders from the sponsor’s insolvency or bankruptcy risks, with the lower credit
risk resulting in raising needed funds at lower borrowing costs. Further, assets with similar risk
characteristics are grouped together in SPVs to appeal to target investors with specific risk preferences.
Finally, SPVs are often created as flow-through entities, such as LPs or LLCs, to afford
maximum flexibility in allocating tax benefits to those investors who can best utilize them. Flow-through
entities have proliferated since the enactment of the Federal “check-the-box” rules in 1996. IRS Notice
95-14 (1995-1 CB 295) allows hybrid entities, such as LPs and LLCs, to elect to be treated as
partnerships for income tax purposes and thus be subject to only a single level of tax while enjoying the
benefits of limited liability protection. Previously, limited liability was available only to corporations that
are subject to at least two levels of taxation (corporate plus shareholder level). Apart from the federal tax
benefits, flow-through entities in general, and LLCs in particular, have been employed extensively in
multistate tax planning (Fox and Luna 2005). The principal tax planning techniques involve their use in
intangible holding companies (also known as passive investment companies) into which intangibles are
transferred. This transfer allows income to be shifted from high-tax states into low-tax states, thereby
reducing multistate firms’ state income tax liabilities.4 Consistent with tax planning through income
shifting, Gupta and Mills (2002) find that multistate corporations’ state effective tax rates decrease (and
then increase) in the number of states in which they file returns and that firms use the apportionment
formula differences to reduce their state effective tax rates. In summary, raising capital, isolating and
homogenizing business risk, and capitalizing on tax incentives together constitute the primary economic
motivations for sponsoring SPVs.
Financial Reporting and Earnings Management Motivations for SPV Use
SPVs can also offer financial reporting discretion by giving the sponsor increased control over the
timing and amount of earnings reported on its income statement, as well as the amount of debt reported 4 These planning techniques succeed because some states require combined reporting of affiliated entities, whereas others allow separate reporting. By strategically locating the intangible holding companies in separate reporting states, income from intangibles can be sheltered in low-tax jurisdictions while obtaining deductions in high-tax jurisdictions. Other state tax planning techniques involve exploiting variation among states’ income tax apportionment regimes and the throwback rule, such that sales revenues can disappear into “nowhere” and completely escape taxation (Gupta and Mills 2002).

7
on its balance sheet. Since the SPV’s (“special purpose”) activities are narrowly circumscribed by charter,
and contracts with the sponsor can be specified in advance, the sponsor can effectively control the SPV’s
actions and retain most of the SPV’s risks and rewards even without majority voting rights (Weidner
2000; Berardino 2001; Soroosh and Ciesielski 2004). Until 2003, U.S. GAAP employed a unilateral
control approach based primarily on voting rights to determine whether SPV financial statements should
be consolidated into the sponsor’s statements. The principal test for excluding an SPV from the sponsor’s
financial statements was whether third party residual equity investment at risk equaled at least three
percent of the SPV’s total capitalization.5 As a result, by obtaining a limited amount of outside equity
investment, the sponsor could avoid consolidating the SPV despite controlling the SPV through other
channels. By controlling both entities involved in the transaction, but only reporting the transactions from
the sponsor’s perspective, the sponsor gains considerable flexibility in managing its reported earnings and
debt. Since this study focuses on earnings effects, we next discuss how a sponsor typically manages
earnings using two main categories of SPVs, sale-leaseback and receivables securitization.
In a sale-leaseback transaction, the sponsor sells a fixed asset to the SPV and leases it back. The
sponsor exercises substantial control over (1) the selling price of the fixed asset, and (2) the amount and
timing of the operating lease payments. By influencing the selling price of the asset, the sponsor can
recognize a gain and thus increase its earnings, which come as either cash flows or accruals, depending on
how much of the selling price the SPV pays initially. Also, by transferring the asset to the SPV, the
sponsor can defer recognizing expenses, such as depreciation and asset impairment, potentially increasing
near-term future earnings and accruals. By controlling the schedule of lease payments, the sponsor can
also defer its cash lease payment and thus increase its near-term earnings and cash flows.
5 Starting in 2003, FIN 46(R) changed the focus for consolidating a SPV from voting control to risks and rewards, requiring that a “variable interest entity” (VIE) must be consolidated in the financial statements of the “primary beneficiary” (FASB 2003). FIN 46(R) also increased the minimum third party investment requirement from three to 10 percent. In a new Exposure Draft issued on September 15, 2008, FASB has proposed amending FIN 46(R) to further expand disclosure of VIE involvement, including disclosure even if the firm does not hold a significant interest in a VIE (FASB 2008). The new proposed rule further underscores FASB’s perceptions of on-going concerns about the timeliness, completeness, and overall representational faithfulness of VIE-related disclosures.

8
With a receivable securitization SPV, the sponsor typically sells one or more preferred interests in
a class of receivables (or a series of receivables to be transferred in the future) to an SPV, and retains a
residual interest in the remaining receivables (retained interest). In this case, the sponsor can exercise
discretion over the amount of receivables sold, and the estimated value of the retained interest (Dechow et
al. 2008). By selling more receivables or inflating the value of the retained interest, the sponsor can
manage earnings and accruals upwards.6
As an earnings management tool, SPVs have some unique advantages. First, while SPVs can
involve complex structures and coordination across multiple parties, the amounts of gains and losses that
are recognized or deferred can be relatively arbitrary and remain so until the end of an accounting period.
Consistent with the argument that this flexibility facilitates target-based earnings management, Dechow
and Shakespeare (2009) find that a disproportionately large percentage of securitization transactions occur
in the last few days of the third month of the quarter. Second, because the SPV typically borrows using
debt guaranteed by the sponsor, SPV-enabled earnings management also has the potential of generating
cash that is subject to the sponsor’s control.
Corporate Governance and SPVs
As the SEC (2005) study notes, corporate scandals involving SPVs not only exposed weaknesses
in financial reporting, but also raised questions about the role of corporate governance as a determinant of
SPVs. However, SPVs can serve both economic and financial reporting purposes. If board members
cannot determine the SPVs' main purpose, it is unclear whether they would encourage or discourage SPV
use. If board members can determine the purpose for setting up the SPVs, we would expect boards to
encourage use of SPVs arranged for economic purposes as they are likely to increase firm value. On the
other hand, if board members determine that SPVs are arranged for financial engineering, strong
governance characteristics should limit organizational commitment to earnings management and thus
mitigate SPV use.
6 The proceeds and the resulting gain or loss recognized by the sponsor can also be impacted by the value of guarantee(s) provided by the sponsor. These guarantees may have cash flow impacts to the sponsor though, prior to FIN45 (FASB 2002), GAAP generally did not require the sponsor to quantify these impacts at the time of the transfer.

9
Based on the above discussion, our conceptual model of the determinants of SPV use follows:
SPV use = f (financial reporting variables, economic variables, corporate governance variables,
and other controls).
Financial reporting variables capture contracting arguments, such as debt covenants, managerial
compensation, and external financing needs; economic variables proxy the risk clienteles, availability of
funds, and demand for tax benefits; corporate governance variables reflect board characteristics; and
controls include firm size, industry membership, and year effects. We develop empirical proxies for these
concepts in section IV.
III. MEASURE OF SPV USE, SAMPLE SELECTION, AND VALIDITY CHECKS Measure of SPV Use
We measure SPV use with a computer algorithm that counts the number of subsidiaries or
affiliates listed in Exhibit 21 (or in some cases Exhibit 22) of SEC Form 10-Ks with names that contain
the words “Limited Partnership,” “Limited Liability Partnership,” “Limited Liability Corporation” (or
their acronyms “L.P.,” “LP,” “LLP,” “L.L.P.,” “LLC,” “L.L.C.”), or “trust.” SEC regulations require that
firms list subsidiaries in the annual 10-K (SEC Regulation S-K Subpart 229.601(b)(21)(i)), where
“subsidiary” is defined as an affiliate that the firm controls directly or indirectly (SEC Regulation S-X
Part 210.1-02(x)), an “affiliate” is defined as a person who directly, or indirectly through intermediaries,
controls, is controlled by, or is under common control with the person specified (Regulation S-X Part
210.1-02(b)), and a “person” can be an individual or any type of business or not-for-profit entity
(Regulation S-X Part 210.1-02(q)).
The SEC defines “control” as “the possession, direct or indirect, of the power to direct or cause
the direction of the management and policies of a person, whether through the ownership of voting shares,
by contract, or otherwise” (Regulation S-X Part 210.1-02(g), emphasis added). Because control can occur
via contract, SPVs fall within the SEC’s definition of a subsidiary. Consistent with these requirements,

10
Enron listed in its 10-K Exhibit 21 many of the SPVs that have been identified as excluded from its
balance sheet but used to manage debt and earnings (see Appendix B).
Sample Selection and Descriptive Statistics
We begin with the 33,244 Form 10-Ks that list subsidiaries and affiliates in Exhibit 21 and were
filed with EDGAR between December 1, 1994 and December 17, 2004. After deleting observations not in
the Compustat database or lacking SIC information, 25,844 observations for 6,892 firms remain. Because
many companies did not file their 10-Ks electronically before 1997, we also exclude observations from
1994 through 1996, resulting in 22,604 observations for 6,473 firms that form the basis of our large-
sample descriptive evidence on the prevalence and extent of SPV use. Because our regression tests have
greater data requirements for calculating the financial reporting, economic, and corporate governance
variables, the sample for these tests is further reduced to 3,885, 3,660 and 2,403 firm-years, respectively.
The decrease in sample size is caused primarily by the requirement for managerial compensation data
because we obtain that data from ExecuComp which is limited to the S&P 1500 companies. Table 1
summarizes the sample selection.
(Insert Table 1 here)
In terms of the large sample descriptive data on SPV activity, Figure 2a shows that 9,470 of
22,604 firm-years (42 percent) report at least one LP, LLP, LLC, or trust. Figure 2b classifies these 9,470
observations by the number of SPVs listed in Exhibit 21. The most frequent SPV count is one (2,867
firm-years, or 13 percent). The number of observations reporting more than one SPV steadily decreases,
although approximately 1,720 firm-year observations (7 percent) disclose more than 10 SPVs. Overall,
more than 70 percent of firm-years report zero or one SPV.
(Insert Figure 2 here)
Panel A of Table 2 reports the frequency and extent of SPV use between 1997 and 2004, by year.
We winsorize the top 1% of the distribution for the number of SPVs to mitigate the effect of outliers. The
percentage of firms reporting at least one SPV increases monotonically from 23 percent in 1997 to 59
percent in 2004, with the mean (median) number of SPVs growing from 7.33 (2.0) in 1997 to 16.05 (4.0)

11
in 2004. The mean is much greater than the median because the distribution of SPVs is right-skewed. The
last three columns categorize the SPVs by type (LLC, LP/LLP, and trust), and report the number
(percentage) of firms with at least one SPV for each type. Clearly, use of each type of SPV increased
monotonically from 1997 to 2004, with a marked increase in LLCs. It is possible that after Enron (or FIN
46(R)), firms began to more fully disclose entities that had already existed. Thus, our SPV count measure
could overstate the increase in SPV formations in later years.
(Insert Table 2 here)
Panel B of Table 2 reports the sample distribution across the 48 Fama and French (1997) industry
categories, listed in descending order by the relative proportion of firms within each industry reporting at
least one SPV. SPV incidence is highest among industry groups usually considered leasing-intensive,
such as trade, real estate, and construction.7 The higher incidence of SPVs in banking and
telecommunications is consistent with the increasing use of SPVs during the 1990s for securitization of
many types of financial assets and broadband capacity (Dharan 2002). The variation in SPV use across
industry groups suggests the need to control for industry membership in the empirical tests.
Validity Checks and Measurement Error issues for the SPV Measure
We conduct four tests to validate our SPV activity measure. The first test relies upon the popular
press to identify firms using SPVs. Specifically, we search Factiva’s “Major News and Business
Publications: U.S.” category between January 1-December 31, 2002 for articles mentioning the term
“special purpose entity(ies)” at least twice. We choose 2002 because much of the discussion about SPVs
appeared in the popular press following the Enron meltdown at the end of 2001. The search resulted in 89
articles that identified 30 firms as utilizing one or more off-balance sheet SPVs. We successfully matched
24 of these 30 firms to our Exhibit 21 sample. If our SPV measure is a good proxy of SPV activity, we
should observe a higher incidence of SPVs based on our measure for these 24 firms. Consistent with our
expectation, we find that of the 24 firms, 21 (87.5%) indicate at least one SPV in Exhibit 21 and 20
7 Real estate and natural resource industries are often characterized by project financing, an approach in which SPVs (e.g., LPs and LLCs) are utilized for economic and legal reasons, are listed in Exhibit 21 and, importantly, may be consolidated for financial reporting purposes. However, inclusion of such consolidated SPVs adds noise and biases our tests against finding significant results.

12
(83.3%) indicate two or more SPVs in Exhibit 21, compared with 47.9% and 30.7%, respectively, in our
overall sample for 2002. Similarly, the median Exhibit 21 SPV count for these 21 firms is six, compared
with three in our overall sample for 2002. Both the percentage of firms with at least one SPV and median
number of SPVs for the popular press sample are significantly greater than our overall 2002 sample
(p<.01). Thus, popular press assertions of SPV use support our Exhibit 21 measure.
Second, because SPVs are often used in connection with asset securitizations, we examine the
frequency with which our SPV measure occurs in a sample of 66 publicly-reported asset securitization
transactions of at least $200 million during 2001 and 2002.8 Of the 53 observations that match our sample
during those years, 46 (86.9 percent) list at least one LP, LLP, LLC, or trust in Form 10-K Exhibit 21.
This percentage is nearly double the 46 percent of the combined 2001 and 2002 overall sample that
reports at least one SPV in Exhibit 21, suggesting that our SPV measure likely captures the asset
securitization activity for which SPVs are typically used.
Third, we search for the terms “special purpose entity(ies)” and “variable interest entity(ies)” in
the entire Form 10-Ks filed electronically with the SEC between January 1997 and December 2004.
Approximately 16 percent of the filings (4,508 of 28,245 firm-years) mention either term at least once.9
Of these, 63.6 percent (2,869 of 4,508) list at least one LP, LLP, LLC, or trust in their Exhibit 21s. This
percentage falls to 40.3 percent (9,571 of 23,737) for firms that do not mention either of the two terms.
The difference in these percentages is highly significant (p<.01), providing support for the conceptual link
between Exhibit 21 entities and SPVs.10
Fourth, since firms might deny using SPVs in their 10-K, the text search we conduct in the third
validity test may misclassify those firms as having SPVs. To classify firms more accurately, we searched 8 We thank Cathy Shakespeare for providing this data. 9 The 16% of filings mentioning either SPE or VIE is considerably smaller than the percentage of firms with SPVs according to our measure. However, prior to the Enron meltdown there was no specific requirement to disclose SPV activity, and hence many firms that had SPVs did not discuss them in the 10-Ks. As examples, Enron and Dynegy, two firms clearly asserted by the SEC to have used SPVs to meet financial reporting objectives, did not directly mention their use of SPVs prior to the SEC litigation, although in both cases Exhibit 21 indicated multiple SPVs. 10 In attempting this match, we lost 198 observations from the original set of 33,244. We repeat this validity check on 10-Ks filed after the Enron bankruptcy on December 2, 2001, when it is possible that firms began mentioning SPEs or VIEs to specifically state that they avoid using these types of off-balance sheet entities. While the percentage of firms mentioning SPEs/VIEs increases dramatically (from 11% in 2002 to 55% in 2004), about the same percentage (63.6 percent) of these firms list SPVs in Exhibit 21.

13
the 10kwizard.com database of all 10-K filings with the SEC between 1/1/97 and 12/31/02 and identified
1,232 firm-years that mentioned either “special purpose entity(ies)” or “variable interest entity(ies).” We
matched this sample with our final sample of 3,885 firm-years and found 180 matches. Based on a careful
reading of the 180 filings, we were able to classify 105 (58%) as definitively having sponsored one or
more SPVs, 52 (29%) as definitively not having sponsored any SPVs, and the remaining 23 (13%) as
firm-years for which it is unclear whether the firm had sponsored a SPV. Of the 105 firm-years that
definitively indicate SPV use, our Exhibit 21 measure correctly indicates SPV use by 80 (76%).
Conversely, of the 52 firms that explicitly deny sponsoring SPVs, our Exhibit 21 measure indicates SPV
use by 25 (48%). A potential explanation for the large false positives is that flow-through entities could
be set up for the tax incentives, as discussed earlier. However, the Pearson correlation between the 10-K
disclosures of the 157 (105+52) firm-years that explicitly indicate sponsoring or deny sponsoring SPVs
and our Exhibit 21 based measure of SPVs is positive and significant (.2811, p<.01).
Despite the validity tests that support the use of Exhibit 21 data to identify SPVs, our SPV
measure is subject to two types of measurement error: (1) inclusion of SPVs in Exhibit 21 that are
consolidated in the financial statements, and (2) exclusion of SPVs that are not LPs, LLPs, LLCs or trusts,
or that are not listed in Exhibit 21. In the first case, since consolidation removes the financial reporting
benefits described earlier, this measurement error should not bias our results toward finding an effect for
the financial reporting motivations. In the second case, there are two possibilities: (1) SPV exclusion is
random, in which case it potentially biases against finding effects for both financial reporting and
economic motivations; and (2) SPV exclusion is due to self selection, in which case it should also
generally bias against our predictions. For example, if firms are more likely to list in (omit from) Exhibit
21 SPVs set up for economic (financial reporting) reasons, then the power of the test for our financial
reporting variables would be reduced.
In addition, even an accurate count of the number of SPVs is a noisy measure of the economic
activity engaged in by these entities. To the extent that the average economic magnitude of SPVs varies
randomly across firms, this error adds noise and reduces the power of our tests. Alternatively, it seems

14
likely that firms with strong economic and financial reporting incentives would be inclined to create SPVs
with greater than average economic magnitude. In that case, the average economic magnitude of SPVs for
firms with strong (weak) financial reporting and economic incentives is large (small), and our SPV count
measure would underestimate the cross-sectional variation in the economic magnitude of SPV activity
between firms with strong and weak incentives. This underestimated variation in the dependent variable
would bias against finding significant results for the determinants of SPVs. In summary, while our SPV
measure is likely subject to measurement error, we believe the resulting noise should bias our tests against
finding results rather than in favor of finding the predicted relationships.
IV. EMPIRICAL MODEL OF SPV USE
To address our first research objective of examining the determinants of SPV use, we estimate
regression models of the number of SPVs as a function of financial reporting motivations (X), economic
motivations (Y), corporate governance variables (Z), and control variables (V). We estimate four models –
model 1 contains only the financial reporting and control variables, whereas models 2 and 3 progressively
add the economic and corporate governance variables. Model 4 includes interactions between the
financial reporting and corporate governance variables to capture the differential effects of corporate
governance on financial reporting incentives. Given that the number of SPVs cannot be less than zero, our
dependent variable is left censored, so we use the Tobit specification instead of a linear regression model
(Woolridge 2001; Greene 2003).11, 12
Our model including all three vectors of explanatory and control variables (model 3) is specified
as follows (with subscripts i and t indexing firm and year, respectively): 11 While many authors refer to settings such as ours as yielding “censored” data, Wooldridge (2001) clarifies that these are “corner solution” settings that, while different from censoring, are also appropriately analyzed using Tobit. In corner solution cases, economic agents are assumed to solve an optimization problem with a constraint that the solution is greater than or equal to zero, which results in data structures similar to censoring. Numerous studies in economics and accounting have used the Tobit model in corner solution settings. Examples include Tobin’s (1958) seminal paper that introduced the Tobit model in which he analyzed household expenditures on durable goods, and Core and Guay’s (1999) study of employee stock option grants. 12 A limitation of Tobit is that it assumes that the same set of explanatory variables explains both the decision to initiate an SPV and the number of SPVs established. However, we have no reason to believe that the explanatory variables for the two decisions would be different. As an additional sensitivity test, we estimate a logit regression with a 0/1 dependent variable for the presence/absence of SPVs and the same set of explanatory variables. The results (not tabulated) are qualitatively similar to the Tobit regression results.

15
, 1 , 1 , 1 , 1 ,
, 1 , 1 , 1 , 1 ,,
, 1 , 1 , 1 , 1 ,
' ' ' 'if ' ' ' ' 0
0 if ' ' ' ' 0
i t i t i t i t i t
i t i t i t i t i ti t
i t i t i t i t i t
X Y Z VX Y Z V
SPV
X Y Z V
β γ λ κ ε
β γ λ κ ε
β γ λ κ ε
− − − −
− − − −
− − − −
= + + + +⎧⎪ + + + + >⎪⎨⎪⎪= + + + + ≤⎩
(1)
where:
.__'
'''
10
31,1,21,11,
1,31,21,11,
1,71,61,51,41,31,21,11,
1,51,41,31,21,11,
∑=
=−−−−
−−−−
−−−−−−−−
++−−−−
++=
++=
++++++=
+++++=
j
jtijtititi
titititi
titititititititi
titititititi
DUMYEARPERCINDULnSIZEV
BUSYINDSHDIRINDZFOREIGNINTANGIBLESETRMTRCLTDFUNDSRISKY
STOCKISSDEBTISSBONUSINTCOVLEVX
κκκκ
λλλλ
γγγγγγγγ
βββββαβ
The financial reporting variables (X) include proxies for nearness to debt covenants (LEV and
INTCOV), managerial compensation (BONUS), and external financing (DEBTISS and STOCKISS). The
economic variables (Y) include proxies for firm risk (RISK), availability of funds (FUNDS and CLTD),
and tax motivations (MTR, SETR, INTANGIBLE, and FOREIGN). The corporate governance variables (Z)
include proxies for board characteristics (DIRIND, INDSH, and BUSY). Finally, the control variables (V)
include firm size (LnSIZE), industry membership (INDU_PERC), and year effects (YEAR_DUM).
The variables are measured using financial reporting and stock return data from Compustat and
CRSP for the years 1996 to 2004, managerial compensation data from ExecuComp, and corporate
governance data from the Investor Responsibility Research Center, Inc. (IRRC) for 1996 to 2003. To
mitigate endogeneity concerns, we use one-year lags for the explanatory variables (except DEBTISS and
STOCKISS, which are measured at t+1 for the reasons given later). Table 3 summarizes the variable
definitions. We discuss the motivation, definition, and predicted sign of each variable next.
(Insert Table 3 here)
Financial Reporting Determinants (X vector)
Debt covenants specify in accounting terms the minimum financial requirements necessary for a
firm to avoid technical default in lending arrangements. Dichev and Skinner (2002) document large-
sample evidence based on detailed debt terms reported in DealScan that (1) leverage is a noisy but
statistically significant proxy for the tightness of debt covenant restrictions, consistent with evidence in

16
Press and Weintrop (1990) and Duke and Hunt (1990), and (2) the interest coverage ratio is a commonly
employed covenant. We proxy the closeness of firms to debt covenant restrictions with LEV, the ratio of
total debt to total assets, and INTCOV, pre-interest operating income divided by interest expense. We
expect SPV use to be increasing in LEV and decreasing in INTCOV.
The bonus plan hypothesis argues that managers adjust reported earnings when their
compensation depends on performance contracts that are explicitly or implicitly based on reported
earnings (Healy 1985; Ittner et al. 1997; Bushman and Smith 2001). Following Matsunaga and Park
(2001) and Leone et al. (2006), we proxy earnings-based performance incentives with BONUS, defined as
the ratio of the CEO’s bonus to total cash compensation (salary plus bonus), and expect that firms’ SPV
sponsorship is increasing in BONUS. We examine the sensitivity of our results to alternate measures of
BONUS that include stock-based compensation since Core et al. (2003) document that stock-based
compensation provides a relatively large proportion of the CEO’s incentives.13
Dechow et al. (1996) find that, apart from the contracting motives, an important motivation for
earnings management is the desire to attract external financing. Consistent with this notion, Teoh, Welch
and Wong (1998) and Teoh, Welch and Rao (1998) find that firms issuing capital report unusually large
positive accruals in the year preceding capital issuances. Following Dechow et al. (1996), we include
DEBTISS, the net increase in debt, and STOCKISS, the value of net stock issuances (both deflated by
average total assets). We measure both variables in year t+1 to capture firms’ incentives to manage their
financial statements prior to raising capital externally, and expect SPV use to increase in both variables.14
Economic Determinants (Y vector)
Sponsors may use SPVs to meet demands of certain risk clienteles by transferring an asset (or
class of assets) with homogenized risks to an SPV that is legally isolated from the firm’s general
13 Our stock-based compensation measures are: (1) the ratio of CEO’s non-salary compensation to total compensation including cash and stock options, and (2) the ratio of CEO’s stock options and shares owned to total number of shares outstanding, following Cheng and Warfield (2005). The regression results (not tabulated) when including the stock-based compensation are qualitatively similar to those based on BONUS. 14 The creation of SPVs in year t may reduce the need for capital in year t+1 or make issuing debt more difficult in year t+1 since high quality assets that can be used as collateral may have been transferred to the SPVs. However, if a firm still issues debt or equity in year t+1, this suggests that the firm had a strong desire to attract external financing in year t.

17
creditors. However, while some firms may transfer more risky assets to SPVs to reduce investors’
perception of the firm’s risk, other firms may transfer less-risky assets to SPVs to raise capital from risk-
averse investors who otherwise might avoid investing in the firm (Beatty et al. 1995). Hence, without
making a directional prediction, we proxy management’s desire to shift risky assets and liabilities to
SPVs with RISK estimated by a two-step process following Beatty et al. (1995). We rank the standard
deviations of all CRSP firms’ daily stock returns into deciles (0/9 for the lowest/highest risk) and then
assign each of our sample firms a value for RISK between 0 and 9 depending on which portfolio it fits.15
As described earlier, SPVs can enable firms to raise capital. We therefore predict that firms will
employ SPVs when funds are tight and proxy fund availability with FUNDS and CLTD, following Beatty
et al. (1995). FUNDS is the supply of internally generated funds, defined as the sum of cash flow from
operations and investing activities divided by average total assets. CLTD is a measure of renegotiation
costs, defined as long term debt due within one year divided by total assets. We expect that SPV use is
decreasing in FUNDS and increasing in CLTD.
Another reason for forming SPVs, especially using flow-through entities, is to allocate tax
benefits (costs) to taxpayers who can most efficiently utilize (report) them. For example, synthetic leases,
for which SPVs are widely used, receive capital lease treatment for tax purposes but operating lease
treatment for financial reporting purposes. Because capital lease treatment results in greater tax benefits to
lessees, firms with high marginal tax rates have stronger incentives to set up SPVs for synthetic leases.
Consistent with this argument, Mills and Newberry (2005) find that firms with fewer net operating losses
(higher marginal tax rates) report larger book-tax differences in interest expense. To capture the overall
federal tax benefits, we include MTR, the marginal tax rate based on Graham’s (1996) firm-specific
simulation of the likelihood of incurring and utilizing net operating loss carryforwards. We use the before
15 As a robustness check, we also measure RISK using cash flow volatility and credit risk. Cash flow volatility is defined as the standard deviation of operating cash flows scaled by total sales (#308/#12) over the previous four years, and credit risk is measured as the log of S&P credit rating (#280). The results with the two alternative measures are qualitatively similar to those based on RISK.

18
interest expense MTR because a decision to utilize off-balance sheet debt financing is likely to involve
shifting at least some existing debt, and expect its coefficient to be positive.16
In addition, as discussed before, SPVs are employed extensively in cross-jurisdictional tax
planning, especially to garner state income tax benefits by shifting income derived from intangibles into
low-tax states. Thus, we expect that the demand for such tax planning is greater among firms with higher
state effective tax rates or with a larger proportion of intangible assets. We proxy state tax incentives with
SETR (the state effective tax rate), defined as the sum of current and deferred state income tax expense
divided by total pretax income, and INTANGIBLE, measured as intangible assets divided by total assets,
and expect positive coefficients on both variables. Because firms’ foreign activities provide alternative
mechanisms for tax planning, we expect that SPV use is decreasing in firms’ foreign presence. We
capture foreign presence with FOREIGN, defined as the foreign pretax income divided by total pretax
income, and expect its coefficient to be negative.
Corporate Governance Variables (Z vector)
Corporate governance has multiple dimensions. Larcker et al. (2007) investigate a broad set of
corporate governance variables and find that only insider power and anti-takeover provisions are
significantly associated with earnings management, measured as abnormal accruals. Since data on anti-
takeover further reduces the sample size, we focus on three board characteristics designed to counteract
insider power.
First, the Business Roundtable (2002) and others (e.g., Lipton and Lorsch 1992) advise that sound
governance necessitates that the majority of board members be independent of management because
independent directors increase board monitoring effectiveness and better align shareholder and manager
interests (e.g., Byrd and Hickman 1992; Brickley et al. 1994). We proxy board member independence
with DIRIND, defined as the percentage of independent directors. Second, the Business Roundtable
(2002) also suggests that independent directors should be “incentivized (sic) to focus on long-term 16 Prior to the Tax Reform Act of 1986, firms with low marginal tax rates had incentives to form partnerships to share their losses with high marginal tax rate investors; Shevlin (1987) found evidence of this activity. However, after the 1986 Act limited the deductibility of losses from passive investments to the extent of passive income, Beatty et al. (1995) were able to find only mixed support for the negative tax rate argument.

19
stockholder value” by including firm equity as part of their compensation. Klein (1998) finds evidence of
a positive relation between shareholder value and stock ownership by independent directors who serve on
the investment and finance committees. To proxy these incentives, we include INDSH, the percent of
voting common shares held by independent directors. Finally, directors serving on “too many” boards risk
compromising their ability to perform well for any one of the boards (Business Roundtable 2002; Lipton
and Lorsch 1992). Larcker et al. (2007) find that future performance (measured as return on assets) is
lower among firms with busy directors. Thus, we include BUSY, defined as the percentage of directors
serving on more than two other boards.
If board members can identify the purpose for setting up SPVs, we expect strong boards to
discourage SPV use for financial reporting purposes but encourage SPV use for economic purposes. On
the other hand, if board members cannot differentiate between these two purposes, it is not clear whether
they would encourage or discourage SPV use. Whether board members can identify the different purposes
for SPVs is an empirical question. Hence, we do not have directional predictions for DIRIND, INDSH and
BUSY, or for their interactions with the financial reporting variables.
Other Controls (V vector)
We also include controls for firm size, industry membership, and year effects. LnSIZE is the
natural log of the sum of the market value of common equity and the book value of preferred equity and
debt. As the SEC (2005, 2) notes, “SPEs are likely to be disproportionately concentrated in the very
largest issuers,” mainly because larger firms likely possess greater technical expertise to handle the
complexity of structured finance arrangements and, hence, are more able to utilize SPVs as a means of
raising capital. Thus, we predict a positive coefficient for LnSIZE. We control for industry membership
with the variable INDU_PERC, defined as the percentage of firms with SPVs within each Fama and
French (1997) industry category each year. To the extent SPV use is likely influenced by industry
practices, we expect a positive coefficient. Finally, we include year dummies (YEAR_DUM) for each year
in our sample to capture other systematic economy-wide effects varying over time.

20
V. RESULTS FOR THE DETERMINANTS OF SPV USE
Descriptive Statistics and Univariate Tests
Panel A of Table 4 presents univariate tests of differences in the explanatory variables between
firms with and without SPVs. To mitigate the effect of outliers, we winsorize the bottom and top 1% of
the distribution for all SPV determinant variables. Relative to firms without SPVs, firms reporting at
least one SPV indicate higher leverage, lower interest coverage, and CEO bonuses that represent a greater
portion of total cash compensation. In addition, firms with SPVs indicate lower stock return volatility, a
greater proportion of debt due in the next year, higher marginal tax rates, greater intangible assets, and a
lower proportion of foreign income than firms without SPVs. These differences are consistent with the
argument that firms arrange SPVs for both financial reporting motivations and economic reasons. Among
corporate governance variables, only the percentage of busy directors is significantly different between
firms with and without SPVs. The last three columns of the table show the distribution of the explanatory
variables by the number of SPVs for firms with SPVs. Of note, we find that LEV and BONUS (INTCOV)
are monotonically increasing (decreasing) in the number of SPVs, consistent with firms having stronger
financial reporting incentives setting up more SPVs.
(Insert Table 4 here)
Panel B of Table 4 reports Pearson (Spearman) correlation coefficients above (below) the
diagonal. The magnitude of the correlations is generally less than 0.30, except some of the correlations
between firm size and (1) RISK (-0.37), (2) LEV (0.38), and (3) BONUS (0.31). LEV and INTCOV are
correlated at -0.47. These correlations suggest that multicollinearity is not a concern in our data.
Regression Results Explaining SPV Use
Table 5 presents the results of the four Tobit regression models of the determinants of SPV use.
Each coefficient’s significance level is determined using the one-tailed chi-square statistic (two-tailed
when the sign is not predicted). We control for heteroskedasticity and serial correlation in the number of
SPVs within each firm using robust standard errors with clustering at the firm-level because Tobit models
21
are particularly sensitive to these assumptions. All models have likelihood ratios significant at p<.01,
indicating good overall explanatory power.
(Insert Table 5 here)
Model 1 examines only the variables designed to capture financial reporting incentives. The
positive coefficient on LEV and negative coefficient on INTCOV support the debt covenant hypothesis;
i.e., firms with greater leverage and lower interest coverage are more likely to use SPVs to circumvent
binding debt covenants. The positive coefficient on BONUS is consistent with firms’ SPV use increasing
in the percentage of CEO cash compensation earned as a bonus. Finally, the positive coefficient on
DEBTISS suggests increasing use of SPVs prior to raising external capital through debt, but STOCKISS is
not significant in explaining SPV activity.
In model 2 we introduce the economic variables, but the sign and significance of the financial
reporting variables do not change substantially. In terms of economic variables, RISK is not significant,
similar to Beatty et al.’s (1995) results in the context of research and development partnerships. The
coefficient on FUNDS is significantly negative, while the coefficient on CLTD is significantly positive,
indicating that SPV use is greater among firms with low internal funds availability. Consistent with tax
incentives, we observe that SPV use is increasing in MTR and INTANGIBLE, and decreasing in
FOREIGN, although SETR is not significant.17
Model 3 includes the governance measures. We find that SPV use is decreasing in board
independence (DIRIND) and independent directors’ equity ownership (INDSH). BUSY, the proportion of
directors serving on more than two other boards, is not significant in explaining SPVs. Model 4 adds the
interactions between the financial reporting and governance variables. We capture governance using IND,
a binary variable coded 1 if DIRIND is at least equal to the median value of DIRIND, and 0 otherwise.
17 A limitation of the INTANGIBLE variable is that it captures only acquired intangibles (and not self-generated intangibles). Alternatively, R&D and advertising expense may better capture this idea. However, we found that a very large number of our sample firms have missing R&D and advertising expense. Specifically, of the 3,660 observations we use in model (2), 1,717 observations (47%) have missing R&D expense, and 2,689 (73%) have missing advertising expense. By contrast, only 1 observation has missing data on INTANGIBLE. When we estimate the results with R&D expense and advertising expense (coding the missing observations as zero) instead of INTANGIBLE, we obtain negative coefficients, which is contrary to the state tax planning story. We suspect that the contrary results could be driven by the large number of missing observations for these variables that we coded as 0.

22
None of the interactions are significant.18 Overall, it appears that boards of firms with strong corporate
governance discourage the formation of SPVs, possibly because they are unable to distinguish SPVs
formed for financial reporting purposes from SPVs formed for other reasons. With respect to the financial
reporting and economic variables, the results in models 3 and 4 are generally similar to models 1 and 2,
except that DEBTISS and FUNDS become insignificant.
The control variables LnSIZE, INDU_PERC, and YEAR_DUM (YEAR_DUM not tabulated) are
positive and significant in all models (p<.01). These results indicate that SPV use is more prevalent
among larger firms, influenced by industry practices, and increasing over the 1997-2003 period.
To evaluate the economic significance of the Tobit results, we calculate the change in the
expected number of SPVs when independent variables increase from the first to the third quartile in
models 2 and 3. Specifically, when LEV and BONUS increase from the first to the third quartile in model
2 (model 3), the expected SPVs increase by 0.66 (1.31) and 0.57 (0.73), respectively. Similarly, an inter-
quartile increase in FUNDS decreases expected SPVs by 0.37 (0.36) in model 2 (model 3), while an inter-
quartile increase in INTANGIBLE increases expected SPVs by 0.83 (1.05) in model 2 (model 3). With
respect to governance, an inter-quartile increase in DIRIND results in a decrease of expected SPVs by
1.04 in model 3. The magnitude effects of these variables on the expected number of SPVs are
substantial, given that more than 70% of our sample observations have zero or one SPV.
To investigate the robustness of the Tobit model results, we conduct a battery of sensitivity tests
related to model specification, definitions of the dependent and independent variables, and sample
selection. First, given the sensitivity of the Tobit model to various assumptions, we estimate our results
using alternative model specifications, such as logit and OLS. In addition, we use maximum likelihood
estimators assuming a negative binomial or a lognormal distribution of the SPV count variable. These
estimators help mitigate concerns about violating the normality assumption of the dependent variable to
18 We also use the continuous DIRIND in the interaction with no substantive change in the results. In addition, we examine alternative specifications of the interaction using variables similarly constructed with INDSH and BUSY. These interactions are generally not significant except that the interaction of the binary version of BUSY with BONUS and DEBTISS generates positive and significant coefficients (p<.10 and p<.05, respectively, two-tail).

23
which Tobit models are sensitive. The results of these alternative model specifications (not tabulated) are
qualitatively similar to the Tobit results presented in Table 5.
Second, our descriptive statistics (Table 2, Panel A) show that the use of LLCs has increased
significantly from 1997 to 2004. Given the “check-the-box” rules discussed earlier and extant research
(e.g., Fox and Luna 2005), it is likely that LLCs are more closely tied to the tax motivation. Hence, we re-
ran the Tobit models excluding LLCs. The results for models 1 and 2 are qualitatively similar but, in
model 3, the coefficient on INDSH becomes insignificant. Similarly, there has been much discussion in
the popular press about the use of trusts, especially real estate investment trusts (REITs), in multistate tax
planning.19 Thus, like LLCs, it is likely that such entities are more closely tied to the tax motivation.
Hence, we re-estimated the Tobit models excluding REITs and our results are qualitatively unchanged.
Third, to evaluate the sensitivity of the results to various definitional choices of the independent
variables, we re-estimated the Tobit models with (1) the inclusion of stock-based compensation in the
BONUS variable, (2) the use of cash flow volatility and S&P credit rating to measure firm risk, (3) the use
of a continuous DIRIND variable instead of a 0/1 dummy (IND) to interact with financial reporting
variables, and (4) the introduction of a control for business complexity using industry and geographic
segment data following Frankel et al. (2006). The results (not tabulated) are qualitatively similar to the
Table 5 results.
Finally, because of the lack of electronic filing in the earlier years, we had deleted data from 1994
to 1996. Our results continue to hold when we change our sample selection criteria to include those years.
In summary, our Tobit regression results document that SPV activity increases with financial
reporting incentives and economic and tax motivations, but strong corporate governance tends to mitigate
their use. These results are robust to a number of sensitivity tests.
19 For example, Wal-Mart’s state tax planning strategy involves a Wal-Mart subsidiary paying rent to a captive REIT that is 99% owned by another subsidiary of the company and its employees (Drucker 2007). The rent is deducted in computing state tax expense whereas the dividend from the REIT to the other subsidiary is tax-free, thereby reducing Wal-Mart’s state income tax expense substantially.
24
VI. EARNINGS MANAGEMENT TESTS AND RESULTS
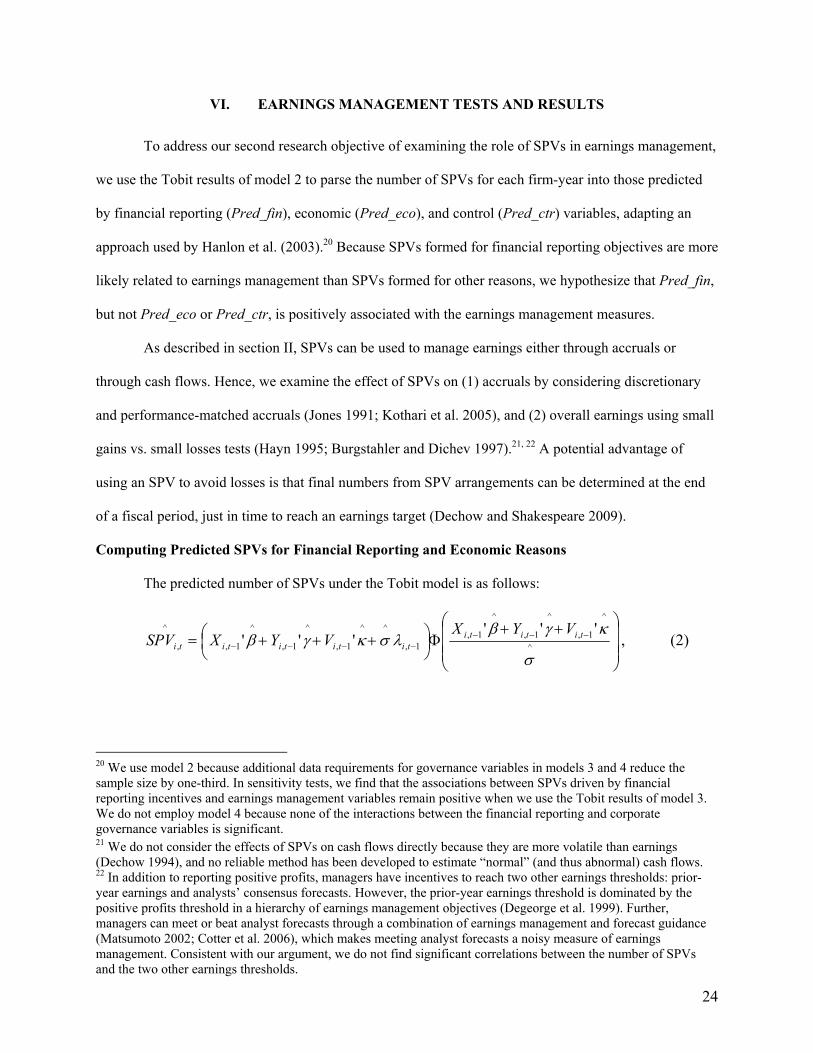
To address our second research objective of examining the role of SPVs in earnings management,
we use the Tobit results of model 2 to parse the number of SPVs for each firm-year into those predicted
by financial reporting (Pred_fin), economic (Pred_eco), and control (Pred_ctr) variables, adapting an
approach used by Hanlon et al. (2003).20 Because SPVs formed for financial reporting objectives are more
likely related to earnings management than SPVs formed for other reasons, we hypothesize that Pred_fin,
but not Pred_eco or Pred_ctr, is positively associated with the earnings management measures.
As described in section II, SPVs can be used to manage earnings either through accruals or
through cash flows. Hence, we examine the effect of SPVs on (1) accruals by considering discretionary
and performance-matched accruals (Jones 1991; Kothari et al. 2005), and (2) overall earnings using small
gains vs. small losses tests (Hayn 1995; Burgstahler and Dichev 1997).21, 22 A potential advantage of
using an SPV to avoid losses is that final numbers from SPV arrangements can be determined at the end
of a fiscal period, just in time to reach an earnings target (Dechow and Shakespeare 2009).
Computing Predicted SPVs for Financial Reporting and Economic Reasons
The predicted number of SPVs under the Tobit model is as follows:
⎟⎟⎟
⎠
⎞
⎜⎜⎜
⎝
⎛ ++Φ⎟⎠⎞
⎜⎝⎛ +++= −−−
−−−− ^
^
1,
^
1,
^
1,1,
^^
1,
^
1,
^
1,
^
,
''''''
σ
κγβλσκγβ tititi
tititititi
VYXVYXSPV , (2)
20 We use model 2 because additional data requirements for governance variables in models 3 and 4 reduce the sample size by one-third. In sensitivity tests, we find that the associations between SPVs driven by financial reporting incentives and earnings management variables remain positive when we use the Tobit results of model 3. We do not employ model 4 because none of the interactions between the financial reporting and corporate governance variables is significant. 21 We do not consider the effects of SPVs on cash flows directly because they are more volatile than earnings (Dechow 1994), and no reliable method has been developed to estimate “normal” (and thus abnormal) cash flows. 22 In addition to reporting positive profits, managers have incentives to reach two other earnings thresholds: prior-year earnings and analysts’ consensus forecasts. However, the prior-year earnings threshold is dominated by the positive profits threshold in a hierarchy of earnings management objectives (Degeorge et al. 1999). Further, managers can meet or beat analyst forecasts through a combination of earnings management and forecast guidance (Matsumoto 2002; Cotter et al. 2006), which makes meeting analyst forecasts a noisy measure of earnings management. Consistent with our argument, we do not find significant correlations between the number of SPVs and the two other earnings thresholds.

25
where β∧
, γ∧
and ^κ are the estimated coefficients from model 2 in Table 5;
^σ is the estimated standard
deviation of the error term, ε ; and λ is the ratio of the standard normal probability density,
⎟⎟⎟
⎠
⎞
⎜⎜⎜
⎝
⎛ ++ −−−^
^
1,
^
1,
^
1, '''
σ
κγβφ tititi VYX
, to the cumulative density, ⎟⎟⎟
⎠
⎞
⎜⎜⎜
⎝
⎛ ++Φ −−−
^
^
1,
^
1,
^
1, '''
σ
κγβ tititi VYX.
We decompose the predicted number of SPVs into Pred_fin, Pred_eco, Pred_ctr and Pred_err
for each firm-year as follows:
Pred_fin =⎟⎟⎟
⎠
⎞
⎜⎜⎜
⎝
⎛ ++Φ −−−
− ^
^
1,
^
1,
^
1,^
1,
''''
σ
κγββ tititi
ti
VYXX , (3)
Pred_eco =⎟⎟⎟
⎠
⎞
⎜⎜⎜
⎝
⎛ ++Φ −−−
− ^
^
1,
^
1,
^
1,^
1,'''
'σ
κγβγ tititi
tiVYX
Y , (4)
Pred_ctr =⎟⎟⎟
⎠
⎞
⎜⎜⎜
⎝
⎛ ++Φ −−−
− ^
^
1,
^
1,
^
1,^
1,'''
'σ
κγβκ tititi
tiVYX
V , and (5)
Pred_err =⎟⎟⎟
⎠
⎞
⎜⎜⎜
⎝
⎛ ++Φ −−−
− ^
^
1,
^
1,
^
1,1,
^ '''
σ
κγβλσ tititi
ti
VYX, (6)
where , 1 'i tX β∧
− , , 1 'i tY γ∧
− , and ^
1, 'κ−tiV are the non-censored predicted components of SPVs related to the
financial reporting determinants, the economic determinants, and control variables, respectively.23
Pred_err represents the expected value of the error term. Unlike OLS the expected value of the Tobit
error is positive due to data censoring.24
23 LEV (CLTD) is classified as a financial reporting (economic) motivation for forming an SPV, although it could potentially capture a(n) economic (financial) motivation. This dual nature of LEV and CLTD adds noise to both Pred_fin and Pred_eco, reducing the power of our earnings management tests. To check whether earnings management results depend on these classifications, we (1) reclassify LEV as an economic determinant, and (2) reclassify CLTD as a financial reporting determinant. Under the alternative classifications, Pred_fin continues to be significantly positively associated with all earnings management measures. On the other hand, Pred_eco and Pred_ctr are generally not significantly associated with earnings management measures. 24 We do not consider the Tobit model residual because it is not well-defined. To consider the effect of the residual on earnings management results, we use OLS regressions with the log number of SPVs as the dependent variable to decompose the number of SPVs into Pred_fin, Pred_eco, Pred_ctr, and the residual, strictly following Hanlon et al. (2003). The results of the OLS-based earnings management tests are similar to those obtained with the Tobit models.

26
Measures of Earnings Management
Accruals. We use two accrual measures – Discretionary Accruals and Performance-Matched
Discretionary Accruals. Discretionary Accruals are estimated as residuals from the following cross-
sectional modified Jones (1991) model (see DeFond and Subramanyam 1998):
TAi,t = α + β1 (∆Sales i,t - ∆REC i,t) + β2 PPEi,t + εi,t (7)
where TA is total accruals, defined as income before extraordinary items minus cash flows from operating
activities; ∆Sales is the change in sales from the previous year to the current year; ∆REC is the change in
accounts receivable from the beginning to the end of the year; and PPE is the end-of-year gross property,
plant, and equipment. All variables are scaled by the beginning-of-year total assets.
Performance-Matched Discretionary Accruals are based on a control sample approach that
mitigates problems of model misspecification and self-selection inherent in studies of earnings
management (Kothari et al. 2005), including ours. Specifically, we estimate Performance-Matched
Discretionary Accruals as the difference between a sample firm’s discretionary accruals per the modified
Jones model estimated above and the discretionary accruals of a control firm matched on industry, year,
size and performance (i.e., ROA).
The Frequency of Small Profits relative to Small Losses. “Small profits” and “small losses” are
measured based on earnings scaled by total assets at the beginning of the period (Leuz et al. 2003).
Earnings are alternatively defined as net income or income before extraordinary items. Following
Dechow et al. (2003), small losses are defined to be in the range of [-0.01, 0.00) and small profits are
defined to be in the range of [0.00, 0.01]. A dummy variable, ROAPOS1 (ROAPOS2), equals 1 if a
company reports small profits based on net income (income before extraordinary items), and zero if a
company reports small losses.

27
Empirical Results for Effects of SPVs on Accruals and Small Profits or Losses
Panel A of Table 6 provides descriptive statistics for the number of SPVs (actual and predicted)
and the earnings management measures.25 Both mean and median Pred_fin and Pred_eco are positive,
consistent with the argument that companies set up SPVs for both economic and financial reporting
reasons. The mean and median Pred_ctr and Pred_err are also positive but large, and potentially offset by
the large negative intercept in model 2. Both mean and median Total Accruals are negative, largely due to
the negative effect of depreciation on accruals. On the other hand, the mean and median of Discretionary
Accruals and Performance-Matched Discretionary Accruals are fairly close to zero, consistent with their
residual nature. The mean of both ROAPOS1 and ROAPOS2 is greater than 0.5, indicating firms have
incentives to avoid losses (Burgstahler and Dichev 1997). The last four columns compare the earnings
management measures between firms with and without SPVs. The mean and median predicted SPVs are
significantly greater for firms indicating positive SPVs than for firms reporting no SPVs. On the other
hand, there is generally no significant difference in the earnings management measures between the two
subgroups. This result is not surprising, given that only SPVs created for financial reporting reasons are
expected to be used to manage earnings.
(Insert Table 6 here)
Panel B of Table 6 reports the correlations between the number of SPVs and the accrual
measures. For all firm-year observations (columns 1 to 3), the number of SPVs is positively correlated
with Total Accruals, but not with either Discretionary Accruals or Performance-Matched Discretionary
Accruals, consistent with the results in Panel A. On the other hand, consistent with our prediction that
SPVs arranged for financial reporting purposes are used to manage earnings upwards, Pred_fin is
significantly positively correlated with Discretionary Accruals, but not with Performance-Matched
Discretionary Accruals. Finally, Pred_eco, Pred_ctr and Pred_err are not significantly correlated with
any of the accrual measures.
25 Because of potential concerns with estimating discretionary accrual models for the financial and regulated industries, we excluded those industries in the accrual tests, but included them in the small profits tests.

28
As specified, Pred_fin is a function of the firm’s leverage ratio, interest coverage ratio, CEO
bonus, and debt and stock issuances of the previous year, all of which are related to managers’ incentive
to manage earnings. Thus, the observed positive correlations of Pred_fin with the accrual measures could
be caused by conventional earnings management variables instead of by SPVs. To test for this possibility,
we subdivide the sample into two groups – one with zero SPVs and the other with positive SPVs. If SPVs
are not used to manage earnings, we should observe similar positive correlations for both groups. On the
other hand, if SPVs are used to manage earnings upwards, we should observe positive correlations
between Pred_fin and the accrual measures only for firms with positive SPVs.
Columns 4 to 9 in Panel B report our correlation results for the two groups of sample firms. For
firms without SPVs (columns 4 to 6), Pred_fin is not significantly related to either Discretionary
Accruals or Performance-Matched Discretionary Accruals. However, for firms reporting at least one SPV
(columns 7 to 9), Pred_fin is significantly positively correlated with both Discretionary Accruals and
with Performance-Matched Discretionary Accruals. In contrast, Pred_eco, Pred_ctr and Pred_err are not
significantly correlated with accrual measures in either group (with or without SPVs). These results are
consistent with the argument that only Pred_fin is used to manage accruals upwards.
Panel C of Table 6 reports the Pearson correlations between SPVs and the likelihood of small
profits. Columns 1 and 2 indicate correlations based upon all firm-year observations. While the number of
SPVs is not significantly correlated with either ROAPOS1 or ROAPOS2, the correlations of Pred_fin with
ROAPOS1 and ROAPOS2 are 0.207 and 0.174, respectively, which are both significant at p<.01. The
correlations of Pred_eco with ROAPOS1 and ROAPOS2 are not significant. The correlations of Pred_ctr
with ROAPOS1 and ROAPOS2 are also positive (0.153 and 0.142, respectively), although the magnitude
and significance are smaller than for Pred_fin. Finally, Pred_err is negatively correlated with the ROA
measures, perhaps because of the negative correlation between Pred_err and Pred_fin.
Similar to Panel B, we divide the sample of small profits and losses firm-years into two groups –
one without SPVs and the other with SPVs. For firms without SPVs (columns 3 and 4), none of the
correlations of Pred_fin, Pred_eco, Pred_ctr and Pred_err with ROAPOS1 or ROAPOS2 are significant.

29
For firms with SPVs (columns 5 and 6), Pred_fin is positively correlated with both ROAPOS1 and
ROAPOS2 (0.239, p<.01 and 0.170, p<.05, respectively). In contrast, Pred_eco is not correlated with
either measure; Pred_ctr is only marginally correlated with ROAPOS1; and Pred_err is negatively
correlated with both ROA measures.
In conclusion, we find that SPVs formed for financial reporting purposes are positively related to
earnings management measures, whereas SPVs formed for economic and other reasons do not exhibit
such consistent positive correlations. Further, the positive correlations between Pred_fin and our earnings
management measures are concentrated within firms that report SPVs. This latter observation diminishes
the potential explanation that the positive correlations we observe are mechanically driven by traditional
earnings management variables that explain Pred_fin.
As additional tests, we also estimate the marginal effect of Pred_fin, Pred_eco, Pred_ctr and
Pred_err using variations of the following regression model:
Earnings Managementi,t = α+β1Pred_fini,t+β2Pred_ecoi,t+β3Pred_ctri,t+β4Pred_erri,t+εi,t, (8)
where Earnings Management is one of the four earnings management measures: Discretionary Accruals,
Performance-Matched Discretionary Accruals, ROAPOS1 or ROAPOS2. If companies use Pred_fin to
manage earnings, we expect β1 to be significantly positive.
Table 7 reports the regression results using only firm-years with SPVs. Panel A presents the OLS
regression results of accruals. β1 is positive and significant in both the Discretionary Accruals and
Performance-Matched Discretionary Accruals models. On average, when Pred_fin increases by one,
Discretionary Accruals and Performance-Matched Discretionary Accruals increase by 0.0088 and
0.0075, respectively. This magnitude is quite large given that the mean Discretionary Accruals and
Performance-Matched Discretionary Accruals are only -0.011 and -0.008. On the other hand, β2, β3 and
β4 are not significantly associated with accruals in either model.26
(Insert Table 7 here)
26 The low adjusted R-squares are not surprising, given the potential measurement error in discretionary accruals and Pred_fin.

30
Panel B reports the logistic regression results of ROAPOS1 and ROAPOS2. As with the accrual
model results, β1 is significantly positive in both the ROAPOS1 (β1=0.7725, p<.01) and ROAPOS2
(β1=0.3713, p<.05) models, whereas β2, β3, and β4 are not significant in either model. The economic
magnitude of β1 is also substantial. For example, when Pred_fin increases by one, the probability that a
firm reports a small gain instead of a small loss measured by ROAPOS1 (ROAPOS2) increases by 18%
(10%).27 In sensitivity tests, we find that these results are robust to alternative cutoffs of small gains and
small losses from ±2% to ±5% of ROA.28
Additional Tests based on ROE Residuals
As discussed in Section II, SPVs can be employed to increase both earnings and cash flows.
Hence, accrual tests only capture part of potential earnings management. Further, the small profits or
losses tests examine only a small subsection of the firms. To capture the effect of SPVs on both accruals
and cash flows in a large-sample setting, we use the return on equity (ROE) residual, another earnings
management measure based on Feng (2007) that follows the spirit of the Jones model. Accordingly, we
model ROE as a function of explanatory variables identified by previous research and assume the residual
of the model (ROE_RES) captures the abnormal ROE associated with earnings management.29
27 Previous research argues that the discontinuity around zero can be caused by reasons other than earnings management. For example, Durtschi and Easton (2005) document that the low frequency of small losses can be caused by the deflator (total assets). Our tests are less likely subject to this alternative explanation because we compute Pred_fin and Pred_eco after controlling for size. Similarly, Beaver et al. (2007) conclude that the discontinuity around zero can be partly explained by the asymmetric effects of income taxes for profit and loss firms. Income taxes are unlikely to drive the positive correlations between the frequency of small profits and Pred_fin because the tax variables belong to economic determinants instead of financial reporting variables. If these tax variables result in the high frequency of small profits, we should observe more positive correlations of the frequency of small profits with Pred_eco than with Pred_fin. Instead, we find that the likelihood of small gains is not significantly associated with Pred_eco, but significantly positively associated with Pred_fin. 28 For example, when we use ±5% of ROA cutoff, the number of observations increases to 759 for the ROAPOS1 regression and 777 for the ROAPOS2 regression. The coefficient on Pred_fin is 0.4221 (p<.01) in a regression of ROAPOS1, and 0.3121 (p<.05) in the regression of ROAPOS2. 29 Following Feng (2007), we define ROE_RES as the firm-year residual of the following regression:
ROEi,t+1 = α + β1 ROEi,t + β2 ∆ROEi,t + β3 SALEGi,t + εi,t+1 where ROE is measured as pretax income scaled by the average of beginning- and end-of-year shareholder equity, ∆ROEi,t represents the annual change in ROE of firm i in year t, and SALEGi,t is growth in sales. ROEi,t and ∆ROEi,t control for the persistence and mean reversion properties of earnings (Brooks and Buckmaster 1976; Freeman et al. 1982; Fama and French 2000). SALEG controls for the differing patterns of mean reversion for growth and value firms observed by Penman (1991). In addition, Nissim and Penman (2001) find that extreme positive and negative ROE measures revert faster than moderate ROE measures, and Martin (1988) finds that earnings persistence is stronger among large firms. To control for the nonmonotonic effects of extreme returns and firm size, we rank all

31
Our correlation analysis (not tabulated) shows that, although neither the overall number of SPVs
nor Pred_eco is significantly correlated with ROE_RES, Pred_fin is positively correlated with ROE_RES
(correlation = 0.051, p<0.01). Further analysis indicates that the positive correlation between Pred_fin
and ROE_RES is concentrated in firms with positive SPVs. These correlations also support the view that,
controlling for known determinants of ROE, SPVs formed to meet financial reporting objectives are used
to manage earnings.
VII. CONCLUSION
This paper investigates the prevalence, determinants and earnings effects of SPVs using a large
sample of firms. We provide evidence that SPV use grew substantially and pervasively from 1997 to
2004. We find that SPV use is associated with both financial reporting and economic reasons but that
strong corporate governance tends to mitigate SPV use. In terms of economic magnitude, inter-quartile
increases in leverage, availability of funds, intangible assets, and board independence result in changes in
expected SPVs of 1.31, -0.36, 1.05, and -1.04, respectively. These effects are quite large, given that more
than 70 percent of our sample observations indicate either zero or one SPV. Moreover, we document that
SPVs sponsored for financial reporting objectives are related to earnings management, but this does not
appear to be the case for SPVs set up mainly for economic and other reasons. Further, the magnitude of
this association appears to be substantial. For example, when the number of predicted SPVs for financial
reporting purposes increases by one, on average the probability that a firm reports a small gain instead of
a small loss increases by 18 percent.
Our findings, particularly with respect to earnings management, provide large sample evidence on
potential SPV misuse under the disclosure requirements that existed prior to FIN 46(R). However, it
remains to be seen how the new disclosure regime enacted as part of the Enron backlash (i.e., negative
publicity for SPVs, the demise of Arthur Andersen, the Sarbanes-Oxley Act, etc.) shapes firms’ use of
SPVs for both financial reporting and economic reasons. The SEC’s (2005) recent descriptive study
observations in each year in Compustat into three firm size groups and five ROE groups. We then estimate the regression model for each of the 15 combinations of size and ROE groups in each sample year.

32
conducted under the mandate of the Sarbanes-Oxley legislation and the FASB’s (2008) recent exposure
draft further amending FIN 46(R) make it clear that legislators and regulators have considerable interest
in gaining this understanding. We leave this examination for future research as data becomes available
under the new regime. Further, while we have attempted to model the economic benefits of SPVs, our
understanding of these benefits is limited; future research could also explore some of the other oft-touted
benefits, such as SPVs’ effect on firms’ cost of capital.

33
REFERENCES
Batson, N. 2003. Final report of Neal Batson, court appointed examiner. In re: Enron Corp., et al., Debtors. (November 2): Retrieved March 15, 2008, from http://www.enron.com/media/Final_Report_Neal_Batson.pdf.
Beatty, A., P. Berger, and J. Magliolo. 1995. Motives for forming research & development financing
organizations. Journal of Accounting and Economics 19 (2-3): 411-442. Berardino, J. 2001. Enron: A wake-up call. Wall Street Journal (December 4). Beaver, W., M. McNichols, and K. Nelson. 2007. An alternative interpretation of the discontinuity in
earnings distributions. Review of Accounting Studies 12 (4): 525-556. Brickley, J., J. Coles, and R. Terry. 1994. Outside directors and the adoption of poison pills. Journal of
Financial Economics 35 (3): 371-390. Brooks, L., and D. Buckmaster. 1976. Further evidence on the time series properties of accounting
income. Journal of Finance 31 (5): 1359-1373. Bryan-Low, C., and K. Brown. 2002. And now, the question is: Where’s the next Enron? Wall Street
Journal (June 18). Burgstahler, D., and I. Dichev. 1997. Earnings management to avoid earnings decreases and losses.
Journal of Accounting and Economics 24 (1): 99-126. Bushman, R., and A. Smith. 2001. Financial accounting information and corporate governance. Journal
of Accounting and Economics 32 (1-3): 237-333. Business Roundtable. 2002. Principles of Corporate Governance. Washington, DC: Business Roundtable
(May). Byrd, J., and K. Hickman. 1992. Do outside directors monitor managers? Evidence from tender offer bids.
Journal of Financial Economics 32 (2): 195-207. Calomiris, C., and J. Mason. 2004. Credit card securitization and regulatory arbitrage. Journal of
Financial Services Research 26 (1): 5-27. Cheng, Q., and T. Warfield. 2005. Equity incentives and earnings management. The Accounting Review
80 (2): 441-476. Clauss, P., and M. Reed. 2003. Special purpose entities in a post-Enron world. ABA Bank Compliance 24
(7): 36. Coallier, D. 2002. Buyer beware of off-the-books funding. Mergers and Acquisitions 37 (10): 29-34. Core, J. and W. Guay. 1999. The use of equity grants to manage optimal equity incentive levels. Journal
of Accounting and Economics 28 (2): 151-184. Core, J., W. Guay, and R. Verrecchia. 2003. Price versus non-price performance measures in optimal
CEO compensation contracts. The Accounting Review 78 (4): 957-981.

34
Cotter, J., I. Tuna, and P. Wysocki. 2006. Expectations management and beatable targets: How do analysts react to explicit earnings guidance? Contemporary Accounting Research 23 (3): 593-624.
Covert, J. 2002. Questioning the books: Retailers may face heightened scrutiny over use of ‘special
purpose entities.’ Wall Street Journal (March 29). Cowan, L., and K. Talley. 2002. ‘Footnote factor’ looms large this year—As annual reports arrive, tricks
are used to find any Enron-like items. Wall Street Journal (April 8). Dechow, P. 1994. Accounting earnings and cash flows as measures of firm performance: The role of
accounting accruals. Journal of Accounting and Economics 18 (1): 3-42. Dechow, P., L. Myers, and C. Shakespeare. 2008. Fair value accounting and gains from asset
securitizations: A convenient earnings management tool with compensation side-benefits. Working paper, University of California, University of Arkansas, and University of Michigan.
Dechow, P., S. Richardson, and I. Tuna. 2003. Why are earnings kinky? An examination of the earnings
management explanation. Review of Accounting Studies 8 (2): 355-384. Dechow, P., and C. Shakespeare. 2009. Do managers time securitizations to obtain accounting benefits?
The Accounting Review (forthcoming). Dechow, P., and D. Skinner. 2000. Earnings management: Reconciling the views of accounting
academics, practitioners, and regulators. Accounting Horizons 14 (2): 235-250. Dechow, P., R. Sloan, and A. Sweeney. 1996. Causes and consequences of earnings manipulation: An
analysis of firms subject to enforcement actions by the SEC. Contemporary Accounting Research 13 (1): 1-36.
Defond, M., and K. Subramanyam. 1998. Auditor changes and discretionary accruals. Journal of
Accounting and Economics 25 (1): 35-67. Degeorge, F., J. Patel, and R. Zeckhauser. 1999. Earnings management to exceed thresholds. The Journal
of Business 72 (1): 1-33. Dharan, B. 2002. Financial engineering with special purpose entities. In Enron and Beyond. Chicago, IL:
CCH, Inc. Dichev, I., and D. Skinner. 2002. Large-sample evidence on the debt covenant hypothesis. Journal of
Accounting Research 40 (4): 1091-1123. Drucker, J. 2007. Friendly landlord: Wal-Mart cuts taxes by paying rent to itself --- Other retailers, banks
use loophole in rules to lower states' levies. Wall Street Journal (February 1, 2007): A1. Duke, J., and H. Hunt. 1990. An empirical examination of debt covenant restrictions and accounting-
related debt proxies. Journal of Accounting and Economics 12 (1-3): 45-63. Durtschi, C. and P. Easton. 2005. Earnings management? The shapes of the frequency distributions of
earnings metrics are not evidence ipso facto. Journal of Accounting Research 43 (4): 557-592. Emshwiller, J., and R. Smith. 2002. Murky waters: A primer on the Enron partnerships. Wall Street
Journal (January 21).

35
Fama, E., and K. French. 1997. Industry costs of equity. Journal of Financial Economics 43 (2): 153-193. Fama, E., and K. French. 2000. Forecasting profitability and earnings. Journal of Business 73 (2): 161-
175. Feng, M. 2007. Why do managers meet or slightly beat earnings forecasts in equilibrium? Working paper,
University of Pittsburgh, Pittsburgh, PA. Financial Accounting Standards Board. 1990. Emerging Issues Task Force 90-15: Statement of
Nonsubstantive Lessors, Residual Value Guarantees, and Other Provisions in Leasing Transactions. Norwalk, CT: FASB.
Financial Accounting Standards Board. 2002. FASB Interpretation No. 45: Guarantor’s Accounting and
Disclosure Requirements for Guarantees, Including Indirect Guarantees of Indebtedness of Others. Norwalk, CT: FASB, (November).
Financial Accounting Standards Board. 2003. FASB Interpretation No. 46: Consolidation of Variable
Interest Entities—An Interpretation of ARB No. 51. Norwalk, CT: FASB, (January, revised in December as FIN 46R).
Financial Accounting Standards Board. 2008. Exposure Draft: Proposed Statement of Financial
Accounting Standards – Amendments to FASB Interpretation No. 46(R). Norwalk, CT: FASB, (September).
Fox, W., and L. Luna. 2005. Do limited liability companies explain declining state corporate tax
revenues? Public Finance Review 33 (6): 690-720. Frankel, R., S. Kothari, and J. Weber. 2006. Determinants of the informativeness of analyst research.
Journal of Accounting and Economics 41 (1-2): 29-54. Freeman, R., J. Ohlson, and S. Penman. 1982. Book rate-of-return and prediction of earnings changes: An
empirical investigation. Journal of Accounting Research 20 (2): 639-653. Goldin, H.J. 2003. Report of Harrison J. Goldin, the court-appointed examiner in the Enron North
America Corp. bankruptcy proceeding, respecting his investigation of the role of certain entities in transactions pertaining to special purpose entities. In re: Enron Corp., et al., Debtors (November 14). Retrieved December 1, 2006, from http://www.enron.com/corp/por/pdfs/SPEReport11142003.pdf.
Gorton, G, and N. Souleles. 2006. Special purpose vehicles and securitization. Working paper, University
of Pennsylvania, Philadelphia, PA. Graham, J. 1996. Proxies for the corporate marginal tax rate. Journal of Financial Economics 42 (2): 187-
221. Greene, W. 2003. Econometric Analysis. New York, NY: Macmillan Publishing Co. Gupta, S., and L. Mills. 2002. Corporate multistate tax planning: Benefits of multiple jurisdictions.
Journal of Accounting and Economics 33 (2):117-139. Hanlon, M., S. Rajgopal, and T. Shevlin. 2003. Are executive stock options associated with future
earnings? Journal of Accounting and Economics 36: 3-43.

36
Hartgraves, A., and G. Benston. 2002. The evolving accounting standards for special purpose entities and
consolidations. Accounting Horizons 16 (3): 245-258. Hayn, C. 1995. The information content of losses. Journal of Accounting and Economics 20 (2):125-153. Healy, P. 1985. The effect of bonus schemes on accounting decisions. Journal of Accounting and
Economics 7 (1-3): 85-107. Higgins, E., and J. Mason. 2004. What is the value of recourse to asset backed securities? A clinical study
of credit card banks. Journal of Banking and Finance 28 (4): 875-899. Hodge, J. 1998. The synthetic lease: Off-balance sheet financing of the acquisition of real property.
California Real Property Journal 16:2. Ittner, C., D. Larcker, and M. Rajan. 1997. The choice of performance measures in annual bonus
contracts. The Accounting Review 72 (2): 231-255. Joint Committee on Taxation. 2003. Report of Investigation of Enron Corporation and Related Entities
Regarding Federal Tax and Compensation Issues, and Policy Recommendations. Volume I (February).
Jones, J. 1991. Earnings management during import relief investigations. Journal of Accounting Research
29 (2):193–228. Karaoglu, E. 2005. Regulatory capital and earnings management in banks: The case of loan sales and
securitizations. Working Paper 2005-05, FDIC Center for Financial Research (May). Klein, A. 1998. Firm performance and board committee structure. Journal of Law and Economics 41 (1):
275-303. Kothari, S., A. Leone, and C. Wasley. 2005. Performance matched discretionary accrual measures.
Journal of Accounting and Economics 39: 163-197. Larcker, D., S. Richardson, and I. Tuna. 2007. Corporate governance, accounting outcomes, and
organizational performance. The Accounting Review 82 (4): 963-1008. Leone, A., J. Wu, and J. Zimmerman, 2006. Aymmetric sensitivity of CEO cash compensation to stock
returns. Journal of Accounting and Economics 42 (1/2): 167-192. Leuz, C., D. Nanda, and P. Wysocki. 2003. Earnings management and investor protection: An
international comparison. Journal of Financial Economics 69: 505-527. Lipton, M. and J. Lorsch. 1992. A modest proposal for improved corporate governance. Business Lawyer
48 (1): 59-77. Martin, S. 1988. Market power and/or efficiency. The Review of Economics and Statistics 70 (2): 331-
335. Matsumoto, D. 2002. Management's incentives to avoid negative earnings surprises. The Accounting
Review 77 (3): 483-514.

37
Matsunaga, S. and C. Park. 2001. The effect of missing a quarterly earnings benchmark on the CEO’s annual bonus. The Accounting Review 76 (3): 313-332.
Mills, L., and K. Newberry. 2005. Firms’ off-balance sheet financing and hybrid debt financing: Evidence
from their book-tax reporting differences. Journal of Accounting Research 43 (2): 251-282. Murphy, K. 2001. Performance standards in incentive contracts. Journal of Accounting and Economics 30
(3): 245-278. Nissim, D., and S. Penman. 2001. Ratio analysis and equity valuation: From research to practice. Review
of Accounting Studies 6 (1): 109-154. Penman, S. 1991. An evaluation of accounting rate-of-return. Journal of Accounting, Auditing and
Finance 6 (2): 233-255. Powers, W. 2002. Report of investigation by the special investigative committee of the board of directors
of Enron Corp. (February 1) Retrieved March 17, 2008, from http://news.findlaw.com/wp/docs/enron/specinv020102rpt1.pdf.
Press, E., and J. Weintrop. 1990. Accounting-based constraints in public and private debt agreements:
Their association with leverage and importance in accounting choice. Journal of Accounting and Economics 12 (1-3): 65-95.
Securities and Exchange Commission. 2002. Accounting and auditing enforcement release no. 1597, in
the matter of The PNC Financial Services Group, Inc., respondent. (July 18). Retrieved March 15, 2008, from http://www.sec.gov/litigation/admin/33-8112.htm.
Securities and Exchange Commission. 2004a. Accounting and auditing enforcement release no. 1973, in
the matter of Conseco, Inc., respondent. (March 10). Retrieved March 15, 2008,, from http://www.sec.gov/litigation/admin/34-49392.htm.
Securities and Exchange Commission. 2004b. American International Group, Inc. agrees to pay $126
million to settle fraud charges arising out of its offer and sale of an earnings management product. (Press release 2004-163, November 30). Retrieved March 15, 2008, from http://www.sec.gov/news/press/2004-163.htm.
Securities and Exchange Commission. 2005. Report and recommendations pursuant to section 401(c) of
the Sarbanes-Oxley Act of 2002 on arrangements with off-balance sheet implications, special purpose entities, and transparency of filings by issuers. (June 15). Retrieved March 15, 2008, from http://www.sec.gov/news/studies/soxoffbalancerpt.pdf.
Shevlin, T. 1987. Taxes and off-balance-sheet financing: Research and development limited partnerships.
The Accounting Review 62 (3): 480-509. Soroosh, J., and J. Ciesielski. 2004. Accounting for special purpose entities revised: FASB Interpretation
46(R). The CPA Journal (July). Retrieved from March 15, 2008, from http://www.nysscpa.org/cpajournal/2004/704/essentials/p30.htm.
Teoh, S., I. Welch, and T. Wong. 1998. Earnings management and the underperformance of seasoned
equity offerings. Journal of Financial Economics 50 (1): 63-99.

38
Teoh, S., I. Welch, and G. Rao. 1998. Are accruals during an initial public offering opportunistic? Review of Accounting Studies 3 (1-2): 175-208.
Tobin, J. 1958. Estimation of relationships for limited dependent variables. Econometrica 26 (1): 24-36. Weidner, D. 2000. Synthetic leases: Structured finance, financial accounting and tax ownership. Journal
of Corporation Law 25 (3): 445-487. Wooldridge, J. 2001. Econometric Analysis of Cross Section and Panel Data. Cambridge, MA: The MIT
Press. Yale, G. 2002. Enron: An Accounting Analysis of How SPEs Were Used to Conceal Debt and Avoid
Losses. Florham Park, NJ: Financial Executives Institute (FEI) Research Foundation.
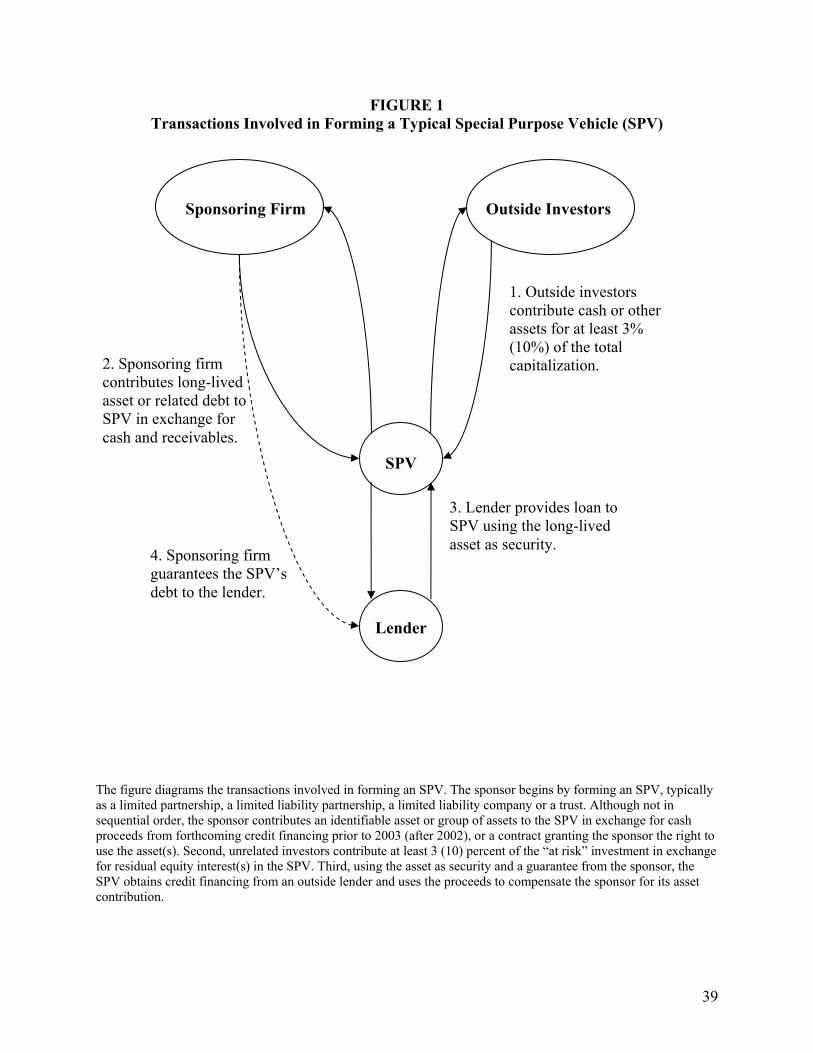
39
FIGURE 1 Transactions Involved in Forming a Typical Special Purpose Vehicle (SPV)
The figure diagrams the transactions involved in forming an SPV. The sponsor begins by forming an SPV, typically as a limited partnership, a limited liability partnership, a limited liability company or a trust. Although not in sequential order, the sponsor contributes an identifiable asset or group of assets to the SPV in exchange for cash proceeds from forthcoming credit financing prior to 2003 (after 2002), or a contract granting the sponsor the right to use the asset(s). Second, unrelated investors contribute at least 3 (10) percent of the “at risk” investment in exchange for residual equity interest(s) in the SPV. Third, using the asset as security and a guarantee from the sponsor, the SPV obtains credit financing from an outside lender and uses the proceeds to compensate the sponsor for its asset contribution.
Sponsoring Firm Outside Investors
Lender
2. Sponsoring firm contributes long-lived asset or related debt to SPV in exchange for cash and receivables.
3. Lender provides loan to SPV using the long-lived asset as security.
1. Outside investors contribute cash or other assets for at least 3% (10%) of the total capitalization.
4. Sponsoring firm guarantees the SPV’s debt to the lender.
SPV

40
FIGURE 2 Distribution of Sample Observations by Number of SPVs
Figure 2a: Number of SPVs, including observations indicating no SPVs
Figure 2b: Number of SPVs, excluding observations indicating no SPVs
0
500
1000
1500
2000
2500
3000
1 2 3 4 5 6 7 8 9 10 >10
Number of SPVs
Num
ber o
f firm
-yea
rs
Figure 2a provides a distribution of the number of SPVs based on 22,604 firm-year observations filed with EDGAR between January 1997 and December 2004 with available Exhibit 21 information and basic Compustat data on industry-membership. Figure 2b provides a distribution of the 9,470 non-zero SPV observations based on the number of SPVs reported.
>10 (1,720, 7%)
4-10 (2,238, 10%)
2-3 (2,645, 12%) 0 (13,134, 58%)
1 (2867, 13%)

41
TABLE 1 Sample Selection
Number of Firm-
year Observations Number of
Unique Firms 10-Ks with identifiable Exhibit 21 from which the number of SPVs can be determined 33,244 9,085
Less: Observations without the GVKEY identifier needed to match with Compustat data (4,823) (1,768)
Observations without SIC or fiscal year-end data on COMPUSTAT (2,577) (425)
10-K with Exhibit 21 information and basic Compustat financial data 25,844 6,892
Less: Observations from 1994 through 1996 (3,240) (419)
Observations after 1996 22,604 6,473
Less: Observations without financial reporting data (18,719) (5,217)
Observations with financial reporting data 3,885 1,256
Less: Observations without economic factor data (225) (83)
Observations with both economic and financial reporting data 3,660 1,173
Less: Observations without corporate governance data (1,257) (254)
Final sample 2,403 919 “Special purpose vehicles” (SPVs) are identified using the list of subsidiaries and affiliates in Exhibit 21 of Form 10-Ks from December 1994 to December 2004. The count of SPVs is based on entities denoted as either a “limited partnership,” “limited liability partnership,” “limited liability corporation,” “L.P.,” “LP,” “L.L.P.,” “LLP,” “L.L.C.,” “LLC,” or “trust.” The larger sample of 22,604 firm-year observations is used for the descriptive statistics and the smaller samples (i.e., 3,885, 3,660, and 2,403 firm-years) that result from additional data requirements are used in the regression tests.
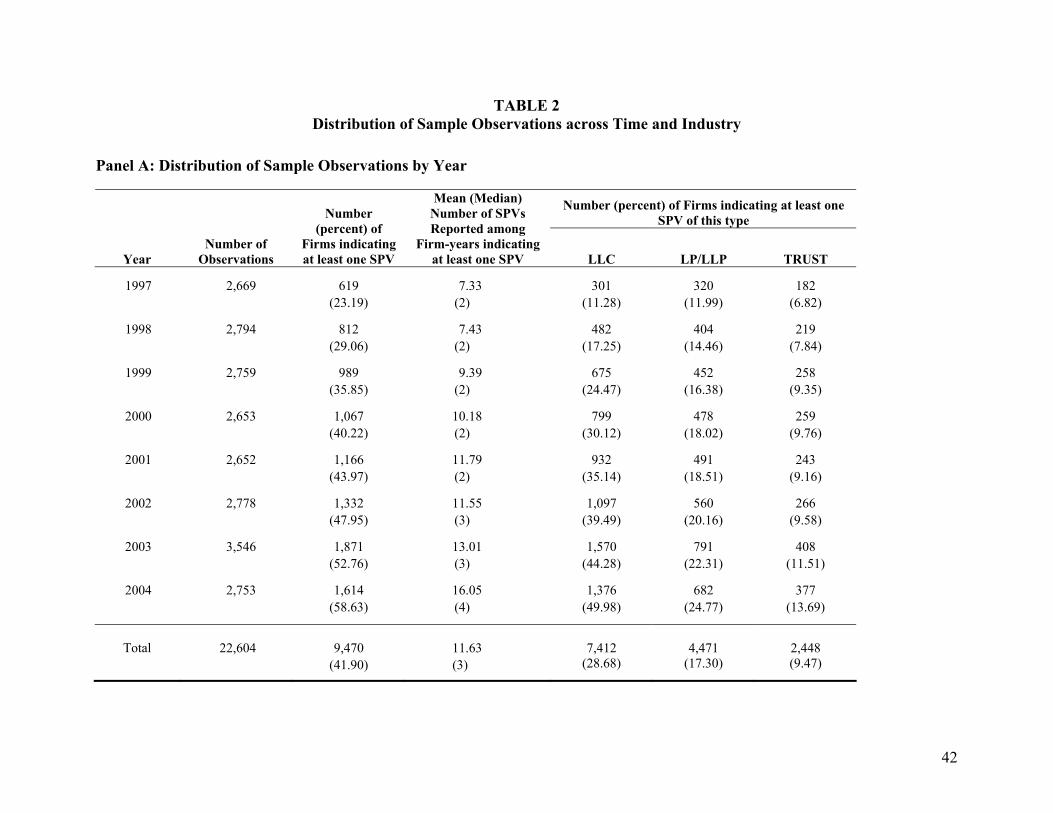
42
TABLE 2 Distribution of Sample Observations across Time and Industry
Panel A: Distribution of Sample Observations by Year
Number (percent) of Firms indicating at least one SPV of this type
Year
Number of Observations
Number
(percent) of Firms indicating at least one SPV
Mean (Median) Number of SPVs Reported among
Firm-years indicating at least one SPV LLC LP/LLP TRUST
1997 2,669 619 7.33 301 320 182 (23.19) (2) (11.28) (11.99) (6.82)
1998 2,794 812 7.43 482 404 219 (29.06) (2) (17.25) (14.46) (7.84)
1999 2,759 989 9.39 675 452 258 (35.85) (2) (24.47) (16.38) (9.35)
2000 2,653 1,067 10.18 799 478 259 (40.22) (2) (30.12) (18.02) (9.76)
2001 2,652 1,166 11.79 932 491 243 (43.97) (2) (35.14) (18.51) (9.16)
2002 2,778 1,332 11.55 1,097 560 266 (47.95) (3) (39.49) (20.16) (9.58)
2003 3,546 1,871 13.01 1,570 791 408 (52.76) (3) (44.28) (22.31) (11.51)
2004 2,753 1,614 16.05 1,376 682 377 (58.63) (4) (49.98) (24.77) (13.69)
Total 22,604 9,470 11.63 7,412 4,471 2,448
(41.90) (3) (28.68) (17.30) (9.47)
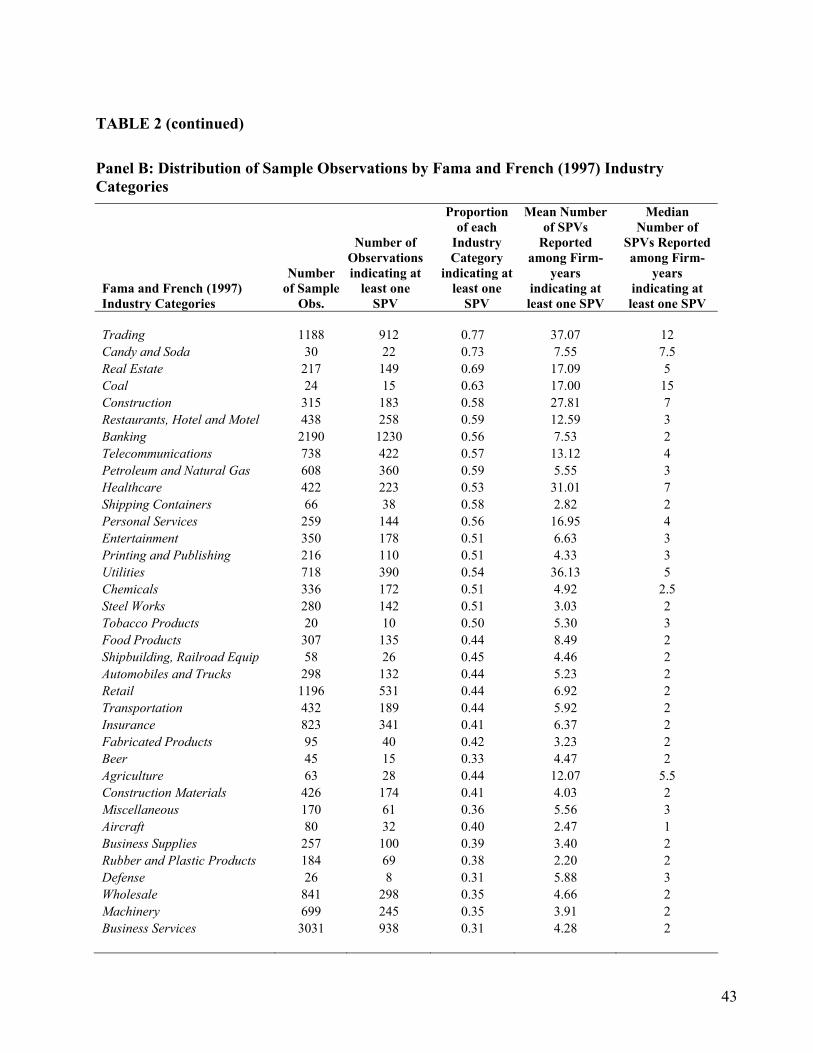
43
TABLE 2 (continued)
Panel B: Distribution of Sample Observations by Fama and French (1997) Industry Categories Fama and French (1997) Industry Categories
Number
of Sample Obs.
Number of Observations indicating at
least one SPV
Proportion of each
Industry Category
indicating at least one
SPV
Mean Number of SPVs
Reported among Firm-
years indicating at least one SPV
Median Number of
SPVs Reported among Firm-
years indicating at least one SPV
Trading 1188 912 0.77 37.07 12 Candy and Soda 30 22 0.73 7.55 7.5 Real Estate 217 149 0.69 17.09 5 Coal 24 15 0.63 17.00 15 Construction 315 183 0.58 27.81 7 Restaurants, Hotel and Motel 438 258 0.59 12.59 3 Banking 2190 1230 0.56 7.53 2 Telecommunications 738 422 0.57 13.12 4 Petroleum and Natural Gas 608 360 0.59 5.55 3 Healthcare 422 223 0.53 31.01 7 Shipping Containers 66 38 0.58 2.82 2 Personal Services 259 144 0.56 16.95 4 Entertainment 350 178 0.51 6.63 3 Printing and Publishing 216 110 0.51 4.33 3 Utilities 718 390 0.54 36.13 5 Chemicals 336 172 0.51 4.92 2.5 Steel Works 280 142 0.51 3.03 2 Tobacco Products 20 10 0.50 5.30 3 Food Products 307 135 0.44 8.49 2 Shipbuilding, Railroad Equip 58 26 0.45 4.46 2 Automobiles and Trucks 298 132 0.44 5.23 2 Retail 1196 531 0.44 6.92 2 Transportation 432 189 0.44 5.92 2 Insurance 823 341 0.41 6.37 2 Fabricated Products 95 40 0.42 3.23 2 Beer 45 15 0.33 4.47 2 Agriculture 63 28 0.44 12.07 5.5 Construction Materials 426 174 0.41 4.03 2 Miscellaneous 170 61 0.36 5.56 3 Aircraft 80 32 0.40 2.47 1 Business Supplies 257 100 0.39 3.40 2 Rubber and Plastic Products 184 69 0.38 2.20 2 Defense 26 8 0.31 5.88 3 Wholesale 841 298 0.35 4.66 2 Machinery 699 245 0.35 3.91 2 Business Services 3031 938 0.31 4.28 2

44
TABLE 2 (continued) Fama and French (1997) Industry Categories
Number
of Sample Obs.
Number of Observations indicating at
least one SPV
Proportion of Sample
Observations indicating at
least one SPV
Mean Number of SPVs
Reported among firm-
years indicating at least one SPV
Median Number of
SPVs Reported among Firm-
years indicating at least one SPV
Textiles 136 48 0.35 2.54 2 Apparel 296 93 0.31 2.75 2 Electrical Equipment 201 61 0.30 4.56 2 Nonmetallic Mining 40 13 0.33 9.54 5 Consumer Goods 380 113 0.30 2.48 2 Toys 173 47 0.27 2.91 2 Measuring and Control Equip 446 98 0.22 4.76 2 Computers 912 185 0.20 4.01 2 Electronic Equipment 1153 239 0.21 2.90 2 Pharmaceutical Products 847 155 0.18 3.73 1 Medical Equipment 517 92 0.18 5.58 2 Precious Metals
57
6
0.11
1.00
1
Total 22,604 9,470 0.42 11.63 3 Panel A reports the distribution of the 22,604 sample observations by year and, for each sample year, the percentage of firms indicating at least one SPV, the mean and the median number of SPVs, and the percentages of firms indicating at least one SPV by type. Panel B reports the distribution of the sample observations across the Fama and French (1997) industry categories listed in descending order based on the relative proportion of firms indicating at least one SPV. The top 1% of the distribution for the number of SPVs is winsorized.

45
TABLE 3 Variable Definitions
Construct Variable Definition (with Compustat Data Item in Parentheses, or other Data source) Predicted Sign
A. Financial Reporting Variables
Contracting Incentives Leverage LEV Total debt/total assets (#181/#6) + Interest coverage ratio INTCOV Operating income after depreciation (before interest) divided by interest expense (#178/#15) - Bonus relative to salary BONUS The ratio of CEO bonus to total cash compensation, sum of salary and bonus (EXECUCOMP
database) +
External Financing Needs Net issue of debt DEBTISS The difference between long-term debt issuance and reduction divided by the average of total
assets ([#111 - #114] / average #6) +
Net issue of stock STOCKISS The difference between common and preferred stock sale and purchase divided by the average of total assets ([#108 - #115] / average #6)
+
B. Economic Variables
Risk Clienteles Stock return volatility RISK The decile of the standard deviation of daily stock returns for the year (CRSP database) ? Availability of Funds Internal funds FUNDS Supply of internal funds, measured by the sum of cash flow from operating and cash flow from
investing divided by average total assets ([#311+#308]/average of #6), -
Renegotiation costs CLTD Long term debt due within one year, measured by debt in current liabilities/total assets (#34/#6) + Tax Benefits Marginal tax rate MTR Graham (1996) marginal tax rate based on simulated income before interest expense + State effective tax rate SETR The sum of current and deferred state income tax expense divided by total pretax income
((#173+#271)/#170) +
Pct. of intangible assets INTANGIBLE The ratio of intangible assets to total assets (#33/#6) + Pct. of foreign income FOREIGN The ratio of foreign pretax income to total pretax income (#273/#170) - C. Corporate Governance Variables Independent directors DIRIND % directors in the Board who are independent (IRRC database) ? Stock holdings of independent directors
INDSH The percentage of stockholdings of independent directors (IRRC database) ?
Busy directors BUSY % directors in the Board who serve on more than 2 other company boards ( IRRC database) ?
D. Control Variables Firm size LnSIZE Log sum of the market value of common shares and the book value of preferred stock and
liabilities ([#25*#199] + #130 + #181) +
% of firms reporting SPVs per industry
INDU_PERC Percent of firms reporting SPVs for each industry-year, where industry is the Fama-French (1997) industry classification
+
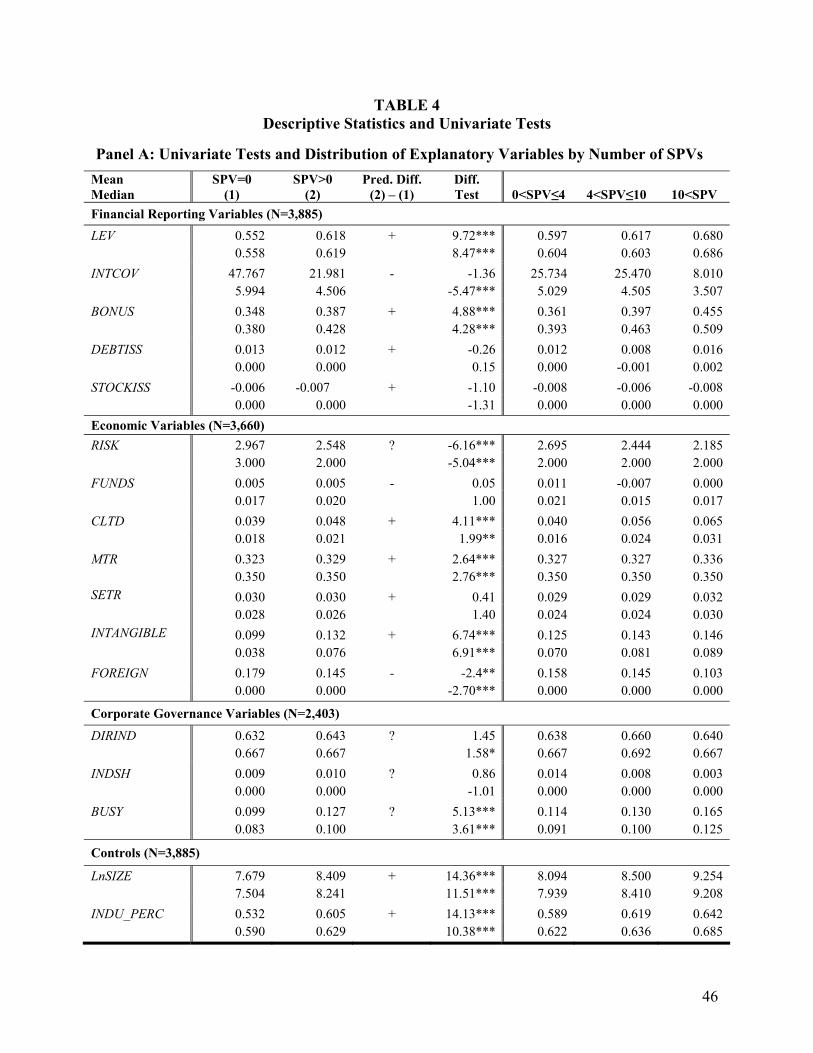
46
TABLE 4 Descriptive Statistics and Univariate Tests
Panel A: Univariate Tests and Distribution of Explanatory Variables by Number of SPVs
Mean Median
SPV=0 (1)
SPV>0 (2)
Pred. Diff.(2) – (1)
Diff. Test 0<SPV≤4 4<SPV≤10 10<SPV
Financial Reporting Variables (N=3,885) LEV 0.552 0.618 + 9.72*** 0.597 0.617 0.680 0.558 0.619 8.47*** 0.604 0.603 0.686 INTCOV 47.767 21.981 - -1.36 25.734 25.470 8.010 5.994 4.506 -5.47*** 5.029 4.505 3.507 BONUS 0.348 0.387 + 4.88*** 0.361 0.397 0.455 0.380 0.428 4.28*** 0.393 0.463 0.509 DEBTISS 0.013 0.012 + -0.26 0.012 0.008 0.016 0.000 0.000 0.15 0.000 -0.001 0.002 STOCKISS -0.006 -0.007 + -1.10 -0.008 -0.006 -0.008 0.000 0.000 -1.31 0.000 0.000 0.000 Economic Variables (N=3,660) RISK 2.967 2.548 ? -6.16*** 2.695 2.444 2.185 3.000 2.000 -5.04*** 2.000 2.000 2.000 FUNDS 0.005 0.005 - 0.05 0.011 -0.007 0.000 0.017 0.020 1.00 0.021 0.015 0.017 CLTD 0.039 0.048 + 4.11*** 0.040 0.056 0.065 0.018 0.021 1.99** 0.016 0.024 0.031 MTR 0.323 0.329 + 2.64*** 0.327 0.327 0.336 0.350 0.350 2.76*** 0.350 0.350 0.350 SETR 0.030 0.030 + 0.41 0.029 0.029 0.032 0.028 0.026 1.40 0.024 0.024 0.030 INTANGIBLE 0.099 0.132 + 6.74*** 0.125 0.143 0.146 0.038 0.076 6.91*** 0.070 0.081 0.089 FOREIGN 0.179 0.145 - -2.4** 0.158 0.145 0.103 0.000 0.000 -2.70*** 0.000 0.000 0.000
Corporate Governance Variables (N=2,403)
DIRIND 0.632 0.643 ? 1.45 0.638 0.660 0.640 0.667 0.667 1.58* 0.667 0.692 0.667 INDSH 0.009 0.010 ? 0.86 0.014 0.008 0.003 0.000 0.000 -1.01 0.000 0.000 0.000 BUSY 0.099 0.127 ? 5.13*** 0.114 0.130 0.165 0.083 0.100 3.61*** 0.091 0.100 0.125
Controls (N=3,885)
LnSIZE 7.679 8.409 + 14.36*** 8.094 8.500 9.254 7.504 8.241 11.51*** 7.939 8.410 9.208 INDU_PERC 0.532 0.605 + 14.13*** 0.589 0.619 0.642 0.590 0.629 10.38*** 0.622 0.636 0.685

47
TABLE 4 (continued) Panel B: Pearson (Spearman) Correlation Coefficients above (below) the Diagonal
SPV LEV INT
COV BON
US DEBT
-ISS STOCK-ISS RISK
FUNDS CLTD MTR SETR
INTANG.
FOREIGN
DIR IND
IND SH BUSY
Ln SIZE
INDU PERC
SPV 0.143 -0.016 0.113 0.016 -0.001 -0.085 -0.035 0.112 0.045 0.008 0.023 -0.068 -0.004 -0.049 0.101 0.216 0.185 LEV 0.200 -0.099 0.109 -0.040 0.066 -0.189 -0.082 0.277 -0.042 -0.038 -0.020 -0.006 0.192 0.014 0.209 0.335 0.254 INTCOV -0.108 -0.468 -0.016 -0.001 0.005 0.053 0.004 -0.030 0.023 0.004 -0.020 -0.011 -0.047 -0.005 -0.019 -0.012 0.014 BONUS 0.113 0.117 0.204 0.079 -0.115 -0.198 0.035 0.090 0.128 0.058 0.022 0.002 0.054 0.005 0.087 0.302 0.106 DEBT -ISS 0.025 -0.027 0.112 0.101 -0.076 -0.050 -0.060 0.047 -0.006 0.030 -0.055 -0.006 -0.026 0.015 -0.008 0.001 0.022 STOCK -ISS -0.029 0.009 -0.226 -0.136 -0.111 0.167 -0.234 0.034 -0.153 -0.062 -0.037 0.007 0.027 -0.032 -0.068 -0.157 -0.030 RISK -0.120 -0.242 -0.107 -0.184 -0.103 0.175 -0.158 -0.094 -0.282 -0.016 -0.011 -0.028 -0.133 -0.041 -0.179 -0.354 -0.243 FUNDS -0.019 -0.118 0.207 0.079 -0.045 -0.214 -0.131 -0.103 0.095 0.006 -0.078 0.031 0.029 0.032 0.045 0.030 -0.022 CLTD 0.075 0.297 -0.143 0.049 0.005 -0.002 -0.191 -0.069 0.021 0.018 -0.047 0.037 0.076 0.004 0.119 0.225 0.107 MTR 0.041 0.036 0.121 0.043 -0.025 -0.006 -0.141 0.069 0.015 0.080 0.041 0.041 0.013 0.008 0.066 0.146 0.069 SETR -0.025 -0.088 0.162 0.103 0.042 -0.080 -0.032 0.032 0.041 0.008 0.052 -0.105 -0.021 -0.026 0.008 -0.018 0.058 INTANG 0.128 0.009 0.003 0.031 -0.109 -0.036 -0.017 0.027 0.001 0.031 0.100 0.023 -0.042 0.059 0.015 -0.013 -0.044 FOR_ EIGN -0.062 -0.040 0.129 0.060 0.018 -0.030 -0.082 0.096 0.108 0.056 -0.109 0.090 0.032 0.020 0.010 0.060 -0.112 DIRIND 0.026 0.213 -0.116 0.055 -0.033 0.040 -0.143 0.019 0.108 0.063 -0.020 -0.010 0.053 0.049 0.212 0.126 -0.046 INDSH -0.042 -0.046 -0.018 -0.021 -0.054 0.005 -0.030 0.021 -0.005 -0.004 -0.030 0.029 0.024 -0.004 -0.014 -0.026 0.010 BUSY 0.115 0.232 -0.023 0.097 -0.009 -0.106 -0.194 0.038 0.131 0.061 -0.001 0.036 0.083 0.210 -0.086 0.450 0.030 LnSIZE 0.279 0.377 0.028 0.314 0.066 -0.172 -0.367 0.010 0.200 0.082 -0.036 -0.012 0.116 0.141 -0.122 0.454 0.093 INDU_ PERC 0.243 0.253 -0.181 0.104 0.058 -0.064 -0.217 -0.068 0.071 0.042 0.070 -0.099 -0.177 -0.026 0.032 -0.001 0.135
Panel A of this table reports univariate tests of differences in the means (t-tests) and medians (z-tests) of the explanatory variables between observations without any SPVs and those with at least one SPV. ***, ** and * indicate significance at the 1%, 5%, and 10% levels, respectively (two-tail). The panel also presents mean and median values for each variable classified by categories based on the number of SPVs. Panel B of this table reports pair-wise correlations between the variables; bolded correlations are significant at the 5% level based on two-tail critical values. The bottom and top 1% of the distribution for all variables are winsorized. Table 3 provides variable definitions.

48
TABLE 5 Tobit Regression Results for Determinants of SPV Use
Variables Pred. Sign
Model 1 Financial Reporting Variables (N=3,885)
Coefficient (z)
Model 2 Model 1 plus
Economic Variables (N=3,660)
Coefficient (z)
Model 3 Model 2 plus Governance
Variables (N=2,403)
Coefficient (z)
Model 4 Model 3 plus
Interactions of Fin. Reporting &
Governance Variables (N=2,403)
Coefficient (z)
INTERCEPT -62.05 (-17.71) -65.33 (-14.40) -57.33(-10.44) -56.12 (-9.66)
Financial Reporting Variables (Yi,t-1) LEV (β1) + 5.15 (3.05) *** 4.56 (2.51) *** 8.49 (3.76) *** 7.33 (2.58) *** INTCOV (β2) - -0.00 (-1.62) * -0.00 (-1.72) ** -0.00 (-2.02) ** -0.00 (-1.87) ** BONUS (β3) + 2.61 (1.55) * 2.69 (1.56) * 2.81 (1.38) * 3.42 (1.23) DEBTISS (β4) + 10.81 (2.30) ** 10.00 (2.11) ** 5.43 (0.95) -0.52 (-0.06) STOCKISS (β5) + 0.41 (0.06) -5.15 (-0.67) -11.31 (-1.14) -12.55 (-1.01)
Economic Variables (Xi,t-1) RISK (γ1) ? 0.14 (0.64) 0.24 (0.84) 0.25 (0.89) FUNDS (γ2) - -6.27 (-1.82) ** -5.83 (-1.24) -6.01 (-1.27) CLTD (γ3) + 9.47 (1.49) * 11.86 (1.56) * 11.57 (1.53) * MTR (γ4) + 12.37 (2.40) *** 10.93 (1.75) ** 11.33 (1.81) ** SETR (γ5) + -4.44 (-0.60) 5.03 (0.56) 5.27 (0.59) INTANGIBLE (γ6) + 8.40 (3.52) *** 8.84 (3.21) *** 8.86 (3.21) *** FOREIGN (γ7) - -3.71 (-4.96) *** -3.70 (-4.37) *** -3.70 (-4.36) ***
Governance Variables (Zi,t-1) DIRIND (λ1) ? -6.16 (-2.48) ** -8.25 (-2.01) ** INDSH (λ2) ? -18.83 (-3.22) *** -19.35 (-3.28) ** BUSY (λ3) ? 2.73 (0.73) 2.62 (0.70) Financial Reporting Variables (Yi,t-1) * Governance Variables LEV *IND ? 2.13 (0.69) BONUS*IND ? -1.04 (-0.28) DEBTISS*IND ? 11.72 (1.00) STOCKISS*IND ? 2.11 (0.11)
Control Variables (Vi,t-1) LnSIZE (κ1) + 3.40 (12.49) *** 3.38 (11.63) *** 3.08 (8.94) *** 3.07 (8.95) *** INDU_PERC (κ2) + 32.95(12.28) *** 31.64 (11.41) *** 29.01 (9.11) *** 28.94 (9.12) *** Number (percentage) of obs. with positive SPVs 2,152 (55.4%) 2,003 (54.7%) 1,459 (60.7%) 1,459 (60.7%) Likelihood Ratio 333.61 323.76 217.89 220.06

49
TABLE 5 (continued) Table 5 reports Tobit regression results for determinants of SPV use after controlling for heteroskedasticity and autocorrelation in variations of this model:
, 1 , 1 , 1 , 1 ,
, 1 , 1 , 1 , 1 ,,
, 1 , 1 , 1 , 1 ,
' ' ' 'if ' ' ' ' 0
0 if ' ' ' ' 0
i t i t i t i t i t
i t i t i t i t i ti t
i t i t i t i t i t
X Y Z VX Y Z V
SPV
X Y Z V
β γ λ κ ε
β γ λ κ ε
β γ λ κ ε
− − − −
− − − −
− − − −
= + + + +⎧⎪ + + + + >⎪⎨⎪⎪= + + + + ≤⎩
where X, Y, Z and V are vectors of financial reporting, economic, governance, and control variables, respectively:
∑=
=−−−−
−−−−
−−−−−−−−
++−−−−
++=
++=
++++++=
+++++=
10
31,1,21,11,
1,31,21,11,
1,71,61,51,41,31,21,11,
1,51,41,31,21,11,
__'
'''
j
jtijtititi
titititi
titititititititi
titititititi
DUMYEARPERCINDULnSIZEV
BUSYINDSHDIRINDZFOREIGNINTANGIBLESETRMTRCLTDFUNDSRISKY
STOCKISSDEBTISSBONUSINTCOVLEVX
κκκκ
λλλλ
γγγγγγγγ
βββββαβ
Model 1 includes only financial reporting variables, while models 2, 3 and 4 progressively add economic variables, corporate governance variables and interactions of financial reporting and independent director dummy variables. Variables are defined in Table 3 except that in model 4 IND is 1 if DIRIND is greater than the median DIRIND value, and 0 otherwise. The bottom and top 1% of the distribution for all variables are winsorized. Each model is estimated with all observations for which data are available to calculate the variables in that model. The model’s likelihood ratio is calculated as 2(L1 − L0), where L0 and L1 are the constant-only and full model log-likelihoods, respectively. Each coefficient’s significance level is determined using the one-tailed likelihood ratio chi-square statistic (two-tailed when the sign is not predicted) that is calculated using robust standard errors with clustering at the firm-level that control for heteroskedasticity and serial correlation in the number of SPVs within each firm. ***, ** and * indicate significance at the 1%, 5%, and 10% levels, respectively (one-tail), except when the sign is not predicted (two-tail). The intercept in all models is significantly negative at the 1% level.

50
TABLE 6 Distribution of Earnings Management Measures and their Correlations with Actual and Predicted SPVs
Panel A: Distribution of Earnings Management Measures
Firm-years where the Number of SPVs =0
Firm-years where the Number of SPVs >0
N Mean STD Median Mean Median Mean Median SPVs Number of SPVs 2,872 3.877 10.933 1 0 0 7.453*** 3*** Pred_fin 2,872 1.574 1.103 1.361 1.257 1.024 1.867*** 1.653*** Pred_eco 2,872 2.152 1.611 1.881 1.692 1.439 2.576*** 2.287*** Pred_ctr 2,872 22.441 13.242 20.335 17.556 15.218 26.946*** 25.244*** Pred_err 2,872 6.890 1.247 7.377 6.530 6.981 7.222*** 7.584*** Accruals Total Accruals 2,872 -0.069 0.092 -0.060 -0.067 -0.056 -0.071 -0.062** Disc. Accruals 2,872 -0.011 0.086 -0.006 -0.012 -0.005 -0.010 -0.006 Performance-Matched Disc. Accruals 2,566 -0.008 0.107 -0.004 -0.008 -0.004 -0.008 -0.004 Small Gains/Small Losses ROAPOS1 268 0.638 0.481 1 0.593 1 0.671 1 ROAPOS2 291 0.656 0.476 1 0.605 1 0.692 1 Panel B: Pearson Correlations between SPVs (Actual and Predicted) and Accruals. All firm-years Firm-years where the Number of SPVs =0 Firm-years where the Number of SPVs >0
Pearson Correlation (two-tail p-value)
Total Accruals
(N=2,872) (1)
Disc. Accruals
(N=2,872) (2)
Performance-Matched Disc.
Accruals (N=2,566)
(3)
Total Accruals
(N=1,378) (4)
Disc. Accruals
(N=1,378) (5)
Performance-Matched Disc.
Accruals (N=1,267)
(6)
Total Accruals
(N=1,494) (7)
Disc. Accruals
(N=1,494) (8)
Performance-Matched Disc.
Accruals (N=1,299)
(9) Number of SPVs 0.035* -0.001 0.002 NA NA NA 0.064** -0.005 0.004 (0.060) (0.975) (0.922) (0.013) (0.847) (0.897) Pred_fin 0.060*** 0.053*** 0.018 0.052* 0.044 0.006 0.082*** 0.061** 0.031* (0.001) (0.005) (0.368) (0.053) (0.102) (0.832) (0.002) (0.018) (0.070) Pred_eco 0.023 -0.026 -0.016 0.030 -0.016 -0.012 0.030 -0.041 -0.020 (0.223) (0.162) (0.424) (0.272) (0.558) (0.671) (0.240) (0.114) (0.467) Pred_ctr 0.000 0.029 0.002 0.018 0.036 0.008 -0.001 0.021 -0.002 (0.999) (0.123) (0.922) (0.494) (0.185) (0.785) (0.980) (0.418) (0.932) Pred_err -0.019 0.007 0.001 -0.010 0.004 -0.002 -0.019 0.008 0.009 (0.316) (0.694) (0.932) (0.707) (0.891) (0.950) (0.469) (0.749) (0.753)

51
TABLE 6 (continued)
Panel C: Pearson Correlations between SPVs (Actual and Predicted) and Small Gains/Small Losses. All firm-years Firm-years where the Number of SPVs =0 Firm-years where the Number of SPVs >0
Pearson Correlation (two-tail p-value)
ROAPOS1 (N=268)
(1)
ROAPOS2 (N=291)
(2)
ROAPOS1 (N=113)
(3)
ROAPOS2 (N=119)
(4)
ROAPOS1 (N=155)
(5)
ROAPOS2 (N=172)
(6) Number of SPVs 0.072 0.088 NA NA 0.060 0.079 (0.239) (0.135) (0.461) (0.303) Pred_fin 0.207*** 0.174*** 0.111 0.128 0.239*** 0.170** (0.001) (0.003) (0.243) (0.165) (0.003) (0.026) Pred_eco 0.098 0.086 0.089 0.070 0.080 0.061 (0.108) (0.143) (0.348) (0.450) (0.322) (0.424) Pred_ctr 0.153** 0.142** 0.101 0.112 0.154* 0.121 (0.012) (0.015) (0.289) (0.226) (0.055) (0.115) Pred_err -0.109* -0.142** -0.041 -0.106 -0.170** -0.175** (0.074) (0.015) (0.663) (0.252) (0.034) (0.021) This table reports distribution of the number of SPVs and earnings management measures (Panel A) and Pearson correlations between five measures of the number of SPVs and two sets of earnings management measures (Panel B and C). The two sets of earnings management measures are accruals (Discretionary Accruals and Performance-Matched Discretionary Accruals) and frequency of small gains/small losses (ROAPOS1 and ROAPOS2). Discretionary Accruals are residuals from applying the Modified Jones model coefficients for the appropriate year and industry. The Modified Jones model, TAi,t = α + β1 (∆Sales i,t - ∆REC
i,t) + β2 PPEi,t + εi,t , is estimated across all Compustat firms by year and by industry, where TA (Total Accruals) is income before extraordinary items (#123) minus cash flows from operating activities (#308), scaled by beginning total assets (#6), and sales, receivables, and PPE are Compustat items #12, #2 and #8, respectively. Performance-Matched Discretionary Accruals are estimated from out-of-sample control firms matched on year, industry, return on assets and firm size. ROAPOS1 [ROAPOS2] is 1 if a company reports small profits based on net income (#172) [income before extraordinary items (#18)], and zero if a company reports small losses. The five SPV measures are: (1) the actual number of SPVs, (2) the number of SPVs predicted by financial reporting variables [Pred_fin], (3) the number of SPVs predicted by economic variables [Pred_eco], (4) the number of SPVs predicted by control variables [Pred_ctr] and (5) the predicted value of the error [Pred_err]. In Panel A, ***, ** and * indicate significant differences between firm-years with SPVs and firm-years without SPVs at the 1%, 5%, and 10% levels, respectively (two-tail), while in Panels B and C ***, ** and * indicate correlation significance at the 1%, 5%, and 10% levels, respectively (two-tail).

52
TABLE 7 Regressions of Earnings Management Measures on Predicted SPVs
for Firms with SPVs
Panel A: OLS Regression Results of Accruals on SPVs as Predicted by Financial, Economic and Control Variables
Coefficient Estimates (t-statistic)
Pred. Sign
Total Accruals (N=1,494)
Disc. Accruals (N=1,494)
Performance-Matched Disc. Accruals
(N=1,299) Intercept ? -0.0608*** -0.0188 -0.0156 (-3.26) (-1.09) (-0.69) Pred_fin (β1) + 0.0158*** 0.0088*** 0.0075** (4.97) (2.97) (1.88) Pred_eco (β2) ? 0.0021 -0.0048*** -0.0022 (1.19) (-2.95) (-1.01) Pred_ctr (β3) ? -0.0012*** -0.0001 -0.0004 (-4.03) (-0.25) (-0.88) Pred_err (β4) ? -0.0017 0.0009 0.0013 (-0.65) (0.39) (0.39) Adjusted R-Square 0.0156 0.0086 0.0010
Panel B: Logistic Regression Results of Frequency of Small Gains/Small Losses on SPVs as Predicted by Financial, Economic and Control Variables Coefficient Estimates (χ2-statistic)
Pred. Sign
ROAPOS1 (N=155)
ROAPOS2 (N=172)
Intercept ? 1.9387 2.7958* (1.32) (2.79) Pred_fin (β1) + 0.7725*** 0.3713** (7.07) (2.87) Pred_eco (β2) ? -0.0798 -0.0641 (0.54) (0.40) Pred_ctr (β3) ? -0.0391 -0.0186 (2.19) (0.62) Pred_err (β4) ? -0.2081 -0.2922 (1.05) (2.18) Number of obs. with small gains 104 119 Likelihood Ratio 14.52*** 8.82*

53
TABLE 7 (continued) Table 7 reports regression results of earnings management on SPVs as predicted by financial reporting variables [Pred_fin], economic variables [Pred_eco], control variables [Pred_ctr] and error [Pred_err]. In Panel A the dependent variables are accruals (Discretionary Accruals and Performance-matched Discretionary Accruals), with Total Accruals used as benchmarks, and in Panel B the dependent variables are frequencies of small gains/small losses (ROAPOS1 and ROAPOS2). The marginal effects of Pred_fin, Pred_eco and Pred_ctr on accruals and the frequency of small gains are estimated with the following regression models:
Accruals i,t = α + β1 Pred_fini,t + β2 Pred_ecoi,t + β3 Pred_ctri,t + β4 Pred_erri,t + εi,t
( )titititi erredctredecoedfinedti eROAPOS
,4,3,2,1 _Pr_Pr_Pr_Pr, 11
ββββα ++++−+=
Discretionary Accruals are residuals from applying the Modified Jones model coefficients for the appropriate year and industry. The Modified Jones model, TAi,t = α + β1 (∆Sales i,t - ∆REC i,t) + β2 PPEi,t + εi,t , is estimated across all Compustat firms by year and by industry, where TA (Total Accruals) is income before extraordinary items (#123) minus cash flows from operating activities (#308), scaled by beginning total assets (#6); and sales, receivables, and PPE are Compustat items #12, #2 and #8, respectively. Performance-Matched Discretionary Accruals are estimated from out-of-sample control firms matched on year, industry, return on assets and firm size. ROAPOS1 [ROAPOS2] is 1 if a company reports small profits based on net income (#172) [income before extraordinary items (#18)], and zero if a company reports small losses. ***, ** and * indicate significance at the 1%, 5%, and 10% levels, respectively (one-tail), except when the sign is not predicted (two-tail).

54
APPENDIX A Enron’s SPVs as Reported in its Exhibit 21 of SEC Form 10-K for the years 1994 to 2000
Per Enron’s Federal Income Tax Returns
Year
Number of LPs
Number of LLCs
Total SPVs
Pretax
Book Income (Compustat #170)
(Millions)
Pretax U.S.
Book Income (Compustat #272)
(Millions)
Taxable Income
(Millions)
U.S. Federal Income Tax
Liability
(Millions)
1994 31 0 31 671 415
1995 41 0 41 881 622
1996 57 0 57 964 551 (310) 0
1997 227 75 302 164 96 (504) 0
1998 316 73 389 1,032 197 (753) 0
1999 555 24 579 1,339 357 (1,458) 0
2000 824 26 850 1,644 640 3,101 63a
This appendix reports Enron’s SPVs from 1994 to 2000 based upon a count of the limited partnerships, limited liability partnerships, limited liability companies, and trusts listed in Exhibit 21 of SEC Form 10-K. Taxable income and tax liability information is available starting with 1996 from the Joint Committee on Taxation (2003). a Includes $42 million of alternative minimum tax.

55
APPENDIX B Excerpt of Enron Corp.’s Exhibit 21 of SEC Form 10-K for 2000
Exhibit 21 ENRON CORP. AND SUBSIDIARY COMPANIES Subsidiary and Limited Partnership Interests as of 12/31/00 Subsidiary, Place of Incorporation ATLANTIC COMMERCIAL FINANCE B.V., i.l., (Cayman Islands) ATLANTIC COMMERCIAL FINANCE, INC , (Delaware) Compression Projects Finance Ltd., (Cayman Islands) EDC Atlantic Ltd., (Cayman Islands) Enron Equity Corp., (Delaware) Enron Dominican Republic Ltd., (Cayman Islands) Smith/Enron Cogeneration Limited Partnership, (Turks & Caicos Isles) Smith/Enron O&M Limited Partnership, (Turks & Caicos Isles) Enron Dominican Republic Operations Ltd., (Cayman Islands) Smith/Enron Cogeneration Limited Partnership, (Turks & Caicos Isles) Smith/Enron O&M Limited Partnership, (Turks & Caicos Isles) Enron Global Power & Pipelines LLC, (Delaware) Enron Dominicana Holding Limited, (Cayman Islands) Enron Dominicana Limited Partnership, (Cayman Islands) Smith/Enron Cogeneration Limited Partnership, (Turks & Caicos Isles) ============================================= Other entities listed on other pages of Exhibit 21 identified as off-Enron’s balance sheet in Powers (2002) and SEC (2005): SE Raptor L.P., (Delaware) … JEDI Linden GP, L.L.C., (Delaware) … Whitewing Associates LP, (Delaware) … SE Raven L.P., (Delaware) … SE Thunderbird, L.P., (Delaware) … This appendix provides a partial listing of the entities on the first of 51 pages of Exhibit 21 from Enron Corp.’s SEC Form 10-K for the year ended December 31, 2000. The appendix also includes the entities Whitewing Associates LP, JEDI Linden LLC, SE Raptor LP, SE Raven LP, and SE Thunderbird LP listed in subsequent pages of the same exhibit and that have been identified as some of Enron’s SPVs that were off balance sheet but were used to manage its debt and earnings (Powers 2002; SEC 2005). The highlighted words in bold match the search terms used to identify SPVs.