special report: education in new york€¦ · special report: education in new york industrial...
TRANSCRIPT

New York State Comptrol ler
THOMAS P. DiNAPOLI
COMPTROLLEROffice of the NEW YORK STATE
FEBRUARY 2017
Special Report: Education in New YorkNine Regional Snapshots
Outside New York City

3Industrial Development AgenciesSpecial Report: Education in New York Nine Regional Snapshots
OverviewEducating children is among the State’s most important functions—and one that accounts for a large share of public spending. For the 2014-15 school year, districts excluding New York City reported expenditures of $37.6 billion.1 State aid for school districts for that year amounted to $13.6 billion.
Given the significance of this public investment, with respect to both finances and human capital, accountability is critical. Accordingly, the State requires districts to report extensive data on their finances, student demographics and outcomes, teachers, school facilities, school climate and other factors.
This report offers a regional perspective on some of this data. Looking at the results this way highlights geographic variation in these indicators. At the same time, important sources of variation among school districts within regions exist. For example, the presence of a large city school district may cause a region to appear to have higher State aid levels than is typical for most of its other districts.
New York City is excluded from the analyses, partly because it is so large that it would heavily weight many statewide statistics, making it difficult to distinguish differences among the other regions of the State. In addition, for some of the concepts analyzed here, New York City schools' information is based on City-specific data not always consistent with that of other districts. Finally, administration of New York City's public schools is complex and distinct from that of other districts.
This regional snapshot analysis is presented in three parts:
• This report, highlighting statewide trends and variation across regions. It touches on:
• Revenue and expenditure growth;
• Declining numbers of students;
• District wealth;
• Student characteristics;
• Student outcomes;
• School safety; and
• Condition of school buildings.
• An interactive map, providing users with dashboards that compare each region with the State as a whole, available at:
www.osc.state.ny.us/localgov/pubs/research/education/regionaleducationmap.htm.
• A technical appendix, including a list of the counties in each region along with details on the data sources, available at:
www.osc.state.ny.us/localgov/pubs/research/education/pdf/technicalappendix.pdf.

4 Special Report: Education in New York Nine Regional Snapshots
School District Revenues
Major Revenue Sources
The share of district revenues from local sources, primarily property taxes, has grown modestly as a share of total revenues over the past ten years. State aid (without the STAR subsidy) accounts for over a third of district revenues. (See Figure 1.)
Local Revenue by Region
Districts vary in the extent to which they rely on property taxes. Generally, wealthy districts depend more on local revenues such as property taxes and less on State aid. In aggregate, Long Island relies most on property taxes and other local revenues: 68 percent of all school district revenues in that region are from local sources. Similarly, Mid-Hudson Valley districts rely on property taxes for nearly two-thirds of revenues. In contrast, local revenues comprise only about a third of school district revenues for the Mohawk Valley and North Country regions. (See Figure 2.)
Figure 2
Downstate Regions Depend More on Property Taxes and Other Local RevenuesProperty Taxes and Other Local Revenues as a Percentage of Total Revenues
Region 2004-05 2014-15 Percentage Point Difference
Capital District 48.8% 53.3% +4.4*Central New York 36.7% 39.1% +2.4Finger Lakes 40.3% 40.7% +0.4Long Island 65.5% 67.6% +2.1Mid-Hudson 61.7% 65.5% +3.8Mohawk Valley 30.4% 32.8% +2.4North Country 29.5% 32.2% +2.7Southern Tier 34.2% 37.8% +3.6Western New York 34.9% 36.4% +1.5New York State 51.5% 54.5% +3.0Source: New York State Education Department, Fiscal Profiles data. Excludes New York City. * Percentage point difference calculated on unrounded figures of 48.84% and 53.25%.
51.5% 54.5%
8.3% 6.5%
35.8% 36.0%
4.4% 3.0%
0%
20%
40%
60%
80%
100%
2004-05 2014-15
Federal Aid
State Aid
STAR Subsidy
Property Taxes &Other LocalRevenues
Source: New York State Education Department, Fiscal Profiles, 2004-05 and 2014-15. Figures exclude New York City. Totals may not sum to 100 percent due to rounding.
2004-05 Total Revenues: $27.4 Billion2014-15 Total Revenues: $37.7 Billion (+38%)
School Districts' Reliance on Property Taxes and Other Local Revenues Has Grown Slightly Over the Past Decade
Figure 1
5Industrial Development AgenciesSpecial Report: Education in New York Nine Regional Snapshots
School District Expenditures
Spending vs. Enrollment
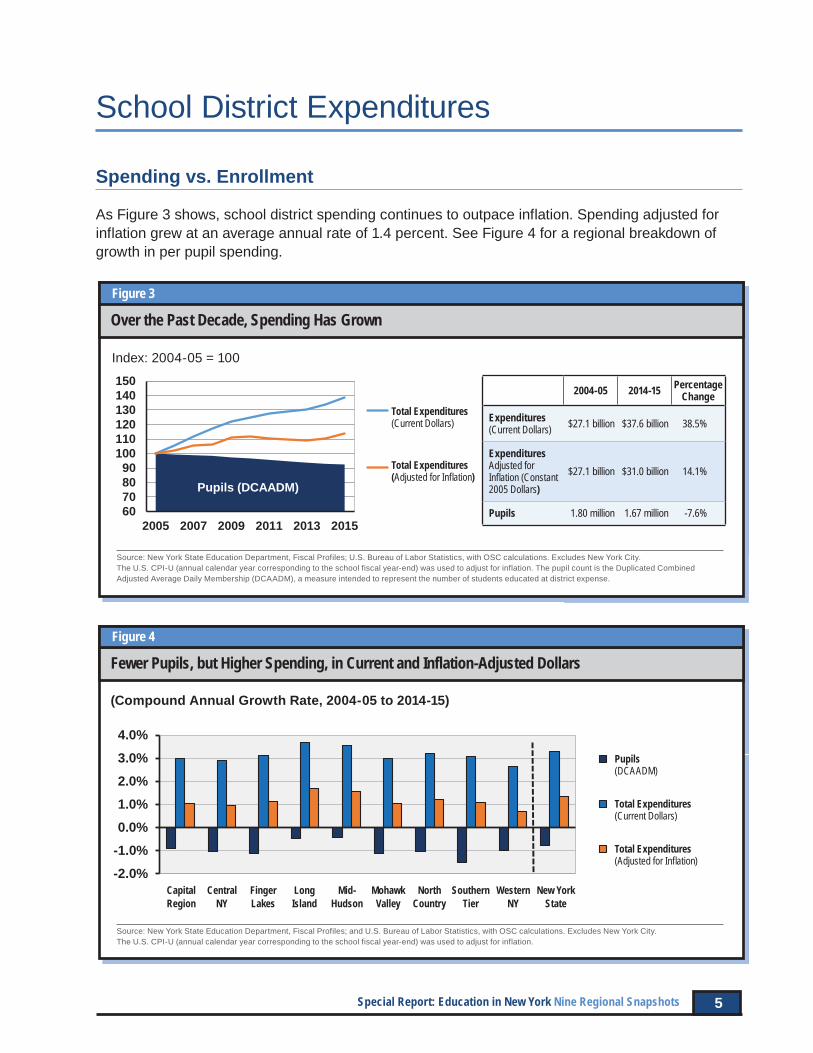
As Figure 3 shows, school district spending continues to outpace inflation. Spending adjusted for inflation grew at an average annual rate of 1.4 percent. See Figure 4 for a regional breakdown of growth in per pupil spending.
60708090
100110120130140150
2005 2007 2009 2011 2013 2015
Pupils (DCAADM)
Over the Past Decade, Spending Has GrownFigure 3
Index: 2004-05 = 100
Source: New York State Education Department, Fiscal Profiles; U.S. Bureau of Labor Statistics, with OSC calculations. Excludes New York City. The U.S. CPI-U (annual calendar year corresponding to the school fiscal year-end) was used to adjust for inflation. The pupil count is the Duplicated Combined Adjusted Average Daily Membership (DCAADM), a measure intended to represent the number of students educated at district expense.
2004-05 2014-15 Percentage Change
Expenditures (Current Dollars) $27.1 billion $37.6 billion 38.5%
ExpendituresAdjusted for Infl ation (Constant 2005 Dollars)
$27.1 billion $31.0 billion 14.1%
Pupils 1.80 million 1.67 million -7.6%
-2.0%-1.0%0.0%1.0%
2.0%
3.0%
4.0%
Fewer Pupils, but Higher Spending, in Current and Inflation-Adjusted DollarsFigure 4
(Compound Annual Growth Rate, 2004-05 to 2014-15)
Source: New York State Education Department, Fiscal Profiles; and U.S. Bureau of Labor Statistics, with OSC calculations. Excludes New York City. The U.S. CPI-U (annual calendar year corresponding to the school fiscal year-end) was used to adjust for inflation.
Capital Central Finger Long Mid- Mohawk North Southern Western New York Region NY Lakes Island Hudson Valley Country Tier NY State
Pupils (DCAADM)
Total Expenditures (Current Dollars)
Total Expenditures (Adjusted for Infl ation)
Total Expenditures (Current Dollars)
Total Expenditures (Adjusted for Infl ation)
6 Special Report: Education in New York Nine Regional Snapshots
Enrollment Trends by District
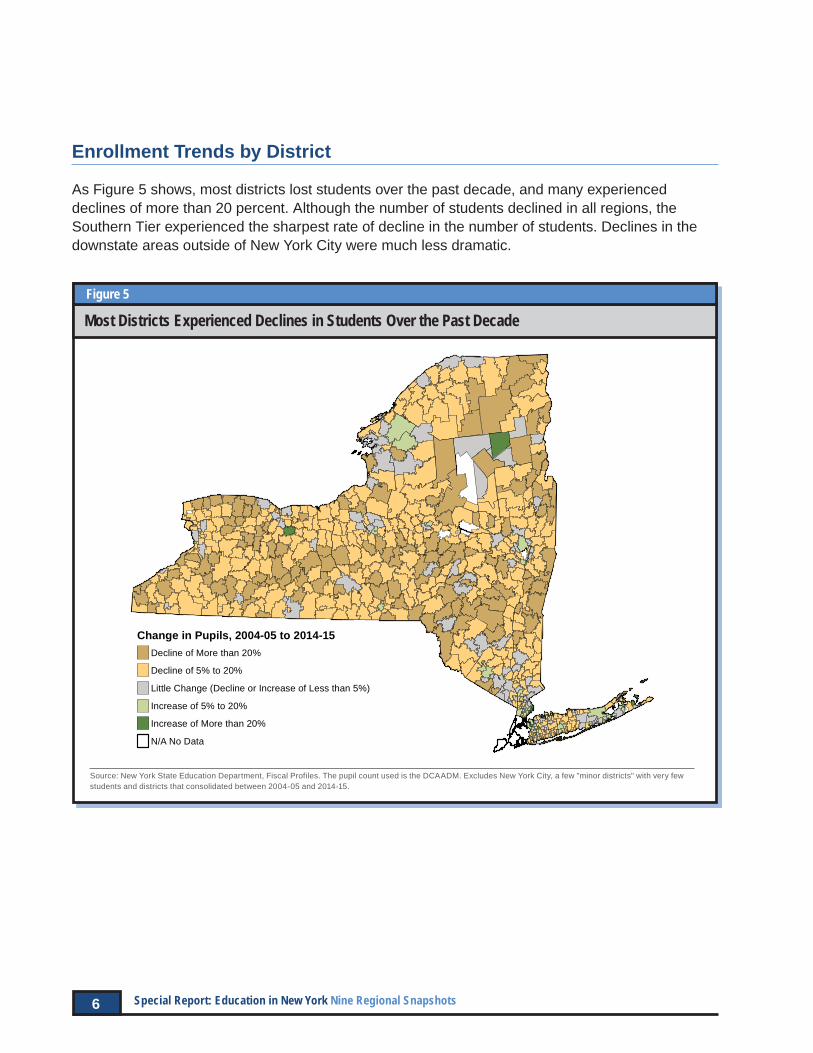
As Figure 5 shows, most districts lost students over the past decade, and many experienced declines of more than 20 percent. Although the number of students declined in all regions, the Southern Tier experienced the sharpest rate of decline in the number of students. Declines in the downstate areas outside of New York City were much less dramatic.
Change in Pupils, 2004-05 to 2014-15Decline of More than 20%
Decline of 5% to 20%
Little Change (Decline or Increase of Less than 5%)
Increase of 5% to 20%
Increase of More than 20%
N/A No Data
Source: New York State Education Department, Fiscal Profiles. The pupil count used is the DCAADM. Excludes New York City, a few "minor districts" with very few students and districts that consolidated between 2004-05 and 2014-15.
Most Districts Experienced Declines in Students Over the Past DecadeFigure 5

7Industrial Development AgenciesSpecial Report: Education in New York Nine Regional Snapshots
Spending Trends by Type
Over the past decade, instructional expenditures have decreased as a share of total spending while fringe benefits—including health insurance and pension contributions—have grown. Debt service also grew slightly as a share of expenditures over the last decade. (See Figure 6.)
Per Pupil Spending
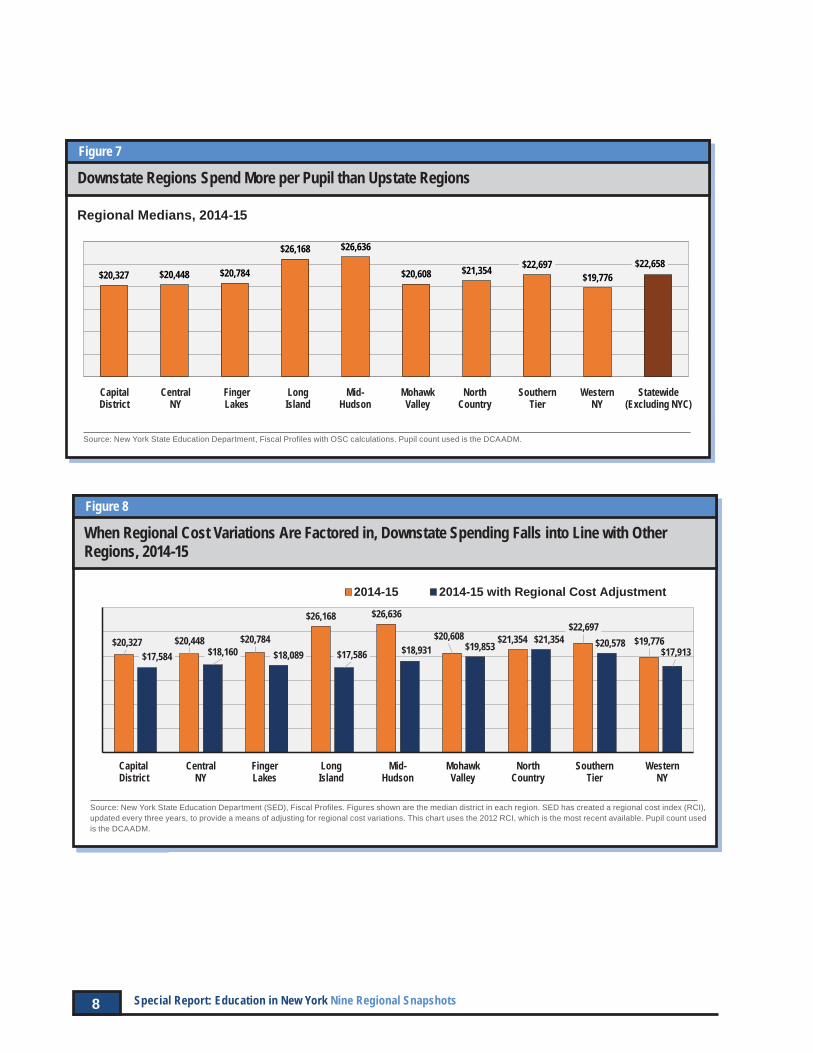
The median school district spent $22,658 per pupil in 2014-15. District spending varies greatly across regions, with Long Island and Mid-Hudson Valley districts generally spending a great deal more per pupil than districts in other regions. The difference between the highest spending and the lowest spending region is $6,860. (See Figure 7.) District spending also varies greatly within regions. These medians are the mid-points of districts' spending per pupil, but do not capture the disparities in per pupil spending within the regions. Significant variations in per pupil spending exist within each region.
Regional cost differences can explain much of the statewide variation. The State Education Department uses a regional cost index (RCI) to facilitate comparisons across regions. Using the low-cost North Country as the base, the RCI adjusts for geographical differences in labor costs. As Figure 8 shows, when adjusted using the RCI, median per pupil spending in 2014-15 ranged from $17,584 in the Capital District region to $21,354 in the North Country, a difference of $3,770.2
59% 54%
18% 24%
6% 7%
17% 16%
0%10%20%30%40%50%60%70%80%90%
100%
2004-05 2014-15
Other
Debt Service
Fringe Benefits
InstructionalExpenditures
$27.1 billion $37.6 billion
Source: New York State Education Department, Fiscal Profiles. Excludes New York City. Totals may not sum to 100 percent due to rounding.
Fringe Benefits Have Grown Faster than Instructional ExpendituresFigure 6
8 Special Report: Education in New York Nine Regional Snapshots
Downstate Regions Spend More per Pupil than Upstate RegionsFigure 7
Regional Medians, 2014-15
Source: New York State Education Department, Fiscal Profiles with OSC calculations. Pupil count used is the DCAADM.
Capital Central Finger Long Mid- Mohawk North Southern Western Statewide District NY Lakes Island Hudson Valley Country Tier NY (Excluding NYC)
$20,327 $20,448 $20,784
$26,168 $26,636
$20,608 $21,354$22,697
$19,776$17,584 $18,160 $18,089 $17,586 $18,931 $19,853
$21,354 $20,578$17,913
2014-15 2014-15 with Regional Cost Adjustment
When Regional Cost Variations Are Factored in, Downstate Spending Falls into Line with Other Regions, 2014-15
Figure 8
Source: New York State Education Department (SED), Fiscal Profiles. Figures shown are the median district in each region. SED has created a regional cost index (RCI), updated every three years, to provide a means of adjusting for regional cost variations. This chart uses the 2012 RCI, which is the most recent available. Pupil count used is the DCAADM.
Capital Central Finger Long Mid- Mohawk North Southern Western District NY Lakes Island Hudson Valley Country Tier NY
$20,327 $20,448 $20,784
$26,168 $26,636
$20,608 $21,354 $22,697$19,776
$22,658

9Industrial Development AgenciesSpecial Report: Education in New York Nine Regional Snapshots
Distribution of Wealth
By District
The map in Figure 9 shows relative district wealth based on both property and income wealth per pupil (using the State Education Department’s combined wealth ratio, or CWR). In general, districts in Long Island, the Mid-Hudson Valley and the Capital District tend to be wealthier by this measure than districts in most other parts of the State. A number of sparsely populated districts in the Catskills and the Adirondack Park also have a high CWR, possibly because of the relatively large proportion of second homes and the small number of students. In contrast, large cities are often less wealthy than their suburbs.3
Combined Wealth RatioTop 20% (Wealthiest)Second 20%Middle 20%Fourth 20%Bottom 20% (Least Wealthy)N/A No Data
Source: New York State Education Department, Fiscal Profiles. Excludes New York City.
Rural Areas Outside of the Adirondacks and Catskills Tend to Have Lower Wealth; Suburbs Tend to Be Wealthier than Cities
Figure 9
2014-15 Combined Wealth Ratio by District

10 Special Report: Education in New York Nine Regional Snapshots
By Percentage of Students Attending
Figure 10 shows how students are distributed among high- and low-wealth districts. As in the map above, the districts were divided into five groups, from least wealthy to wealthiest, based on the combined wealth ratio. Each group (quintile) includes 20 percent of districts. Then the percentage of each region’s pupils in districts in each wealth grouping were calculated and shown in a stacked bar format. So, for New York State (excluding New York City), 16 percent of students were in the wealthiest group of districts, 24 percent were in the next wealthiest group, on down to 20 percent of students in the least wealthy group. The figure reveals that this distribution varies a great deal by region: most downstate students (again, outside of New York City) are in the two wealthiest groups of districts, while most upstate students outside of the Capital District are in the bottom two (least wealthy) groups of districts.
This is largely a consequence of the type of districts in each of these regions: most Long Island and Mid-Hudson students live in suburban districts, where property values and incomes are higher. In many upstate regions, most children live in relatively low-wealth cities or rural areas and attend school in those districts. In the Mohawk Valley region, for example, 85 percent of students are in relatively low-wealth districts, even though several of the region’s geographically largest districts fall into the highest per pupil wealth category.
11%32% 32%
7%1%
57%46% 39% 47%
20%9%
30% 28%
4% 11%
28%28%
31% 11%
15%
39%
28% 26%
22% 26%
6%13% 15%
25%
24%
32%
8% 14%
36% 30%
8% 6% 12% 17%
24%
9%1% 0%
30% 33%
1%7%
2% 1%
16%
0%10%20%30%40%50%60%70%80%90%
100%
The Majority of Upstate Students (Outside of the Capital Region) Are in Low-Wealth DistrictsFigure 10
(Distribution of Pupils by District Combined Wealth Ratio Percentiles, 2014-15)
Source: New York State Education Department, Fiscal Profiles with OSC calculations. Excludes New York City. The Combined Wealth Ratio is a measure of district wealth. It combines the the property tax base and adjusted gross income per pupil, presented as an index. The pupil count is the DCAADM. Totals may not sum to 100 percent due to rounding.
Capital Central Finger Long Mid- Mohawk North Southern Western New York District NY Lakes Island Hudson Valley Country Tier NY State
Top 20% (Wealthiest Districts)
Second 20%
Middle 20%
Fourth 20%
Bottom 20%(Least Wealthy Districts)
Pupils: 149,150 119,090 175,810 456,746 343,309 64,912 59,954 97,282 201,470 1,667,723

11Industrial Development AgenciesSpecial Report: Education in New York Nine Regional Snapshots
Student Characteristics
Limited English Proficiency
The proportion of students with limited English proficiency varies by region. Excluding New York City, Long Island and the Mid-Hudson Valley have the highest rates, while the North Country has the lowest. (See Figure 11.)
Poverty Measures
Student need, as measured by the percentage eligible for free or reduced price lunch and the child poverty rate, also varies by region. As Figure 12 shows, in New York State, 39 percent of students were eligible for free or reduced price lunch in 2014-15 and 17 percent of children lived in poverty. Long Island has the lowest concentration of high-need students: 30 percent are eligible for free or reduced price lunch and only 8 percent live in poverty. The Mohawk Valley has the highest concentration of high-need students: more than half (53 percent) are eligible for free or reduced price lunch and one in four children (26 percent) in the region lives in poverty.
1.9%3.3% 3.4%
7.0%6.2%
3.2% 0.4% 0.9%3.5%
4.6%
Downstate Regions Have More Students with Limited English Proficiency, 2014-15 Figure 11
Source: New York State Education Department, School Report Card database. Excludes New York City.
Capital Central Finger Long Mid- Mohawk North Southern Western New York District NY Lakes Island Hudson Valley Country Tier NY State
37%44% 44%
30%37%
53% 49% 48% 47%39%
16%22% 21%
8%16%
26% 24% 22% 24%17%
Eligible for Free or Reduced Price Lunch, 2014-15 Children in Poverty, 2015
Long Island Has Fewer High-Need Students than Other Regions (as a Percentage of Students)Figure 12
Source: New York State Education Department, School Report Card database and U.S. Census Bureau, American Community Survey 2015 (five year). Excludes New York City.
Capital Central Finger Long Mid- Mohawk North Southern Western New York District NY Lakes Island Hudson Valley Country Tier NY State

12 Special Report: Education in New York Nine Regional Snapshots
Student Outcomes
Graduation
Excluding New York City, the statewide four-year graduation rate (all students) was 86 percent in 2014-15, with moderate regional variation (from 80 percent in the Mohawk Valley to 90 percent on Long Island).
Outside of New York City, in 2014-15, 94 percent of graduates received a Regents diploma or an advanced Regents diploma. This is up substantially from a decade earlier, when only 83 percent of graduates obtained at least a Regents diploma. (See Figure 13.) This increase is due in part to shifts in State graduation requirements made to encourage more students to earn a Regents diploma (instead of a local diploma).4
High School Dropout Rate
In aggregate, only 2.0 percent of students enrolled in grades 9 through 12 dropped out of school in 2014-15. Central New York and the Southern Tier had the highest rates, while Long Island had the lowest. (See Figure 14.)
84% 81% 86% 85% 78% 80% 81% 83% 85% 83%95% 94% 93% 96% 94% 92% 92% 92% 93% 94%
2004-05 2014-15
Over 90 Percent of Graduates Currently Receive a Regents DiplomaFigure 13
Source: New York State Education Department, School Report Card database. Excludes New York City.
Capital Central Finger Long Mid- Mohawk North Southern Western New York District NY Lakes Island Hudson Valley Country Tier NY State

13Industrial Development AgenciesSpecial Report: Education in New York Nine Regional Snapshots
2.7% 2.8%2.2%
1.2%1.8%
2.7%2.3%
2.8% 2.6%2.0%
High School Dropout Rates Are Relatively Low; Long Island Has the Lowest Dropout RateFigure 14
Student Dropout Rate by Region, 2014-15
Source: New York State Education Department, School Report Card database. Excludes New York City. Includes students enrolled in ninth through twelvth grade.
Capital Central Finger Long Mid- Mohawk North Southern Western New York District NY Lakes Island Hudson Valley Country Tier NY State
Post-Secondary Plans
As Figure 15 shows, 85 percent of students statewide say they plan to pursue post-secondary education or other vocational training. Half say they plan to attend a four-year college or university. More than half of Long Island and Mid-Hudson Valley students plan to pursue a four-year degree, while only slightly more than a third of Mohawk Valley, North Country and Southern Tier graduates say they intend to pursue a four-year college degree.
45% 45% 43%60% 57%
34% 36% 36% 44% 50%
39% 36% 38%
30% 30%
46% 37% 40%36%
34%
11% 14% 14%6% 7% 15% 23% 19% 14% 11%
5% 5% 6% 4% 6% 5% 3% 4% 6% 5%
0%10%20%30%40%50%60%70%80%90%
100%
Downstate Regions Have the Highest Percentage of Graduates Planning on Attending College, While the North Country Has the Highest Percentage of Graduates Planning to Enter the Workforce or Join the Military
Figure 15
2014-15 - Graduation Plans Survey
Source: New York State Education Department; School Report Card database. Excludes New York City. Totals may not sum to 100 percent due to rounding.
Capital Central Finger Long Mid- Mohawk North Southern Western New York District NY Lakes Island Hudson Valley Country Tier NY State
Other/Unknown
Military/ Employment
Two-Year College/Post Secondary
Four-Year College

14 Special Report: Education in New York Nine Regional Snapshots
School SafetyEach year, school districts, charter schools and Boards of Cooperative Educational Services (BOCES) report data on violent and disruptive incidents to the State Education Department.5 OSC audits of the State Education Department have found cases where incidents were unreported or misclassified and have made recommendations to improve reporting.6 The statewide uniform violent and disruptive incident reporting system (VADIR) currently collects school-level counts of incidents in 20 categories. The State Education Department uses the information to identify persistently dangerous schools. Parents of children attending schools on the list of persistently dangerous schools may transfer their children to a different school. Beginning with the 2017-18 school year, the number of categories in the VADIR data collection will be reduced from 20 to 9 and the data collection will be combined with the collection of bullying data pursuant to the Dignity for All Students Act.
Assaults with Physical Injury
For 2014-15, schools reported nearly 2,800 assaults involving injury. This amounts to 1.7 assaults per 1,000 students. In 2004-05, the statewide rate was much higher (2.6 assaults per 1,000 students). The prevalence of reported assaults with injury fell in most regions between 2004-05 and 2014-15. (See Figure 16.)
2.3 2.5
4.1
2.0 2.12.8
1.6
5.1
2.2 2.61.5
3.42.5
0.8 1.5
2.8
1.42.1 2.3
1.7
2004-05 2014-15
School Violence: Assaults with Physical Injury Have Fallen in Most Regions Over the Last DecadeFigure 16
Incidents per 1,000 Students
Source: New York State Education Department, Violent and Disruptive Incident Report (VADIR), 2004-05 and 2014-15. The analysis includes charter schools, but excludes incidents reported by Boards of Cooperative Educational Services. The assault incident counts include all four VADIR assault categories: assault with serious personal injury with a weapon, assault with serious personal injury without a weapon, assault with personal injury with a weapon and assault with personal injury without a weapon. Excludes New York City.
Capital Central Finger Long Mid- Mohawk North Southern Western New York District NY Lakes Island Hudson Valley Country Tier NY State

15Industrial Development AgenciesSpecial Report: Education in New York Nine Regional Snapshots
Weapons Possession Incidents
For 2014-15, school districts and charter schools reported 2,683 weapons possession incidents. On a per pupil basis, Long Island has lowest rate of assault and weapons possession incidents of any region in the State. Central New York has the highest rate for both of these types of incidents. (See Figure 17.)
2.1
3.42.5
1.5 1.6 1.5 0.81.5 1.8 1.81.9
3.5
2.2
0.8 1.32.1
1.52.1 2.2
1.6
2004-05 2014-15
School Violence: Central New York Has More Weapons Possession Incidents on a Per Pupil Basis than Other Regions
Figure 17
Incidents per 1,000 Students
Source: New York State Education Department, Violent and Disruptive Incident Report, 2004-05 and 2014-15. The analysis includes charter schools, but excludes incidents reported by Boards of Cooperative Educational Services. The weapons possession incidents for 2014-15 include weapons found both through screening and through other circumstances. The 2004-05 data has only one weapons possession category. The incident counts exclude incidents involving the use of weapons. Excludes New York City.
Capital Central Finger Long Mid- Mohawk North Southern Western New York District NY Lakes Island Hudson Valley Country Tier NY State

16 Special Report: Education in New York Nine Regional Snapshots
School FacilitiesEvery five years, school districts report detailed information on the condition of their school facilities to the State Education Department. For each building, the data includes ratings of major building systems as well as environmental conditions that could affect student safety or learning (e.g., ventilation, space adequacy, lighting and pest management practices). Districts use the information for capital planning.7 The inspections are done by a facilities professional (architect or engineer); however, the district’s board of education determines the overall building rating. The ratings categories are “excellent,” “satisfactory,” “unsatisfactory” and “poor.” Typically only new buildings receive an overall rating of “excellent,” and very few receive an overall rating of “poor.” Only one building used for instructional purposes was rated “poor” in 2010; only three were rated “poor” in 2015. The analysis here includes only buildings used for instructional purposes.
As Figure 18 shows, the building condition survey data suggests that school districts have made substantial improvements to their facilities over the past five years. In 2010, nearly a third of buildings (32 percent) had an overall rating of “unsatisfactory” or “poor.” By 2015, that figure had dropped by more than half to just 14 percent. All regions had a substantial drop in the percentage of buildings rated below satisfactory.
27%
47%
22%18%
38%43%
37%
27%
47%
32%
11%
21%4% 2%
25%
11% 6% 7%
33%
14%
2010 2015
Statewide, the Percentage of School Buildings in Poor or Unsatisfactory Condition Dropped by Half from 2010 to 2015
Figure 18
Percentage of Buildings with an Overall Rating of Poor or Unsatisfactory, 2010 and 2015 (Includes only Buildings Used for Instructional Purposes)
Source: New York State Education Department; Building Condition Survey, 2010 and 2015. Includes only buildings used for instructional purposes. In 2010, only one building was rated "poor," and in 2015, only three buildings were rated "poor." Includes portables and small buildings. Excludes New York City and excludes facilities belonging to Boards of Cooperative Educational Services.
Capital Central Finger Long Mid- Mohawk North Southern Western New York District NY Lakes Island Hudson Valley Country Tier NY State

17Industrial Development AgenciesSpecial Report: Education in New York Nine Regional Snapshots
1 The financial data in this report come from the Fiscal Profiles published by the New York State Education Department (SED). The per pupil revenue and expenditure figures used throughout the report include charter school students. The Fiscal Profiles data is available for downloading at: www.oms.nysed.gov/faru/Profiles/profiles_cover.html. The most recent data available for the Fiscal Profiles is for the 2014-15 school year. Most of the data on student characteristics and outcomes in this report comes from SED’s School Report Card Database. The most recent School Report Card data is for the 2015-16 school year. However, for this report, 2014-15 School Report Card data was used in order to present analyses using comparable time periods to the extent possible.
2 The regional cost index (RCI) is based on professional salaries for occupations excluding education. Educators' salaries are excluded from the calculation in order to ensure that the index reflects variations in labor market costs rather than in costs controlled by school districts. The State Education Department periodically updates the RCI to reflect changes in labor costs. The analysis presented here uses the 2012 RCI, the most recent available at the time of the analysis. The index uses the low-cost North Country region as a base (RCI=I). For details on the construction of the RCI, see the New York State Board of Regents, Proposal on State Aid to School Districts for School Year 2012-13 (pp. 53-59), available at: www.p12.nysed.gov/stateaidworkgroup/2012-13RSAP/RSAP1213final.pdf. The regions used in the RCI differ slightly from those used in this report: for the RCI, Hamilton County is in the North Country region instead of the Mohawk Valley, and Madison County is in the Mohawk Valley instead of the Central New York region.
3 For a fuller description of the combined wealth ratio, see the State Education Department, “Appendix” to the School District Fiscal Profiles, available at: www.oms.nysed.gov/faru/PDFDocuments/FARUWEBSITEFISCALAPPENDIX.pdf.
4 Part 100.5 of the Regulations of the Commissioner of Education specify the requirements for graduation from secondary school programs in New York State. The regulations are posted on the State Education Department website at: www.p12.nysed.gov/part100/pages/1005.html.
5 For a brief overview of violent incident reporting in schools, see the State Education Department, Regents Item, “Proposed Amendment of Section 100.2(gg) of the Commissioner’s Regulations, Relating to the Uniform Violent and Disruptive Incident Reporting System (VADIR)” (December 1, 2016). P-12 Education Committee. VADIR data is available on the State Education Department's website at: www.p12.nysed.gov/irs/school_safety/school_safety_data_reporting.html. The figures reported here exclude incidents reported by Boards of Cooperative Educational Services.
6 OSC, State Education Department: Compliance with the Safe Schools Against Violence in Education Act (2013-S-71), (January 13, 2015); State Education Department: Reporting of Violent and Disruptive Incidents by Public Schools (2007-F-13); State Education Department: Reporting of Violent and Disruptive Incidents by Public Schools (2005-S-38).
7 Details on the Building Condition Survey are available at: www.p12.nysed.gov/facplan/BldgCondSurv.htm.
Notes
18 Special Report: Education in New York Nine Regional Snapshots
Mailing Address
for all of the above:
Office of the New York State Comptroller,
110 State Street, Albany, New York 12236
email: [email protected]
DirectoryCentral OfficeDivision of Local Government and School Accountability
Andrew A. SanFilippo, Executive Deputy Comptroller
Executive ..................................................................................................................................................................474-4037 Gabriel F. Deyo, Deputy Comptroller Tracey Hitchen Boyd, Assistant Comptroller
Audits, Local Government Services and Professional Standards ................................................ 474-5404 (Audits, Technical Assistance, Accounting and Audit Standards)
Local Government and School Accountability Help Line .............................(866) 321-8503 or 408-4934 (Electronic Filing, Financial Reporting, Justice Courts, Training)
New York State & Local Retirement SystemRetirement Information Services
Inquiries on Employee Benefits and Programs .................................................................474-7736
Bureau of Member and Employer Services ............................................ (866) 805-0990 or 474-1101Monthly Reporting Inquiries ...................................................................................................474-1080Audits and Plan Changes ..........................................................................................................474-0167All Other Employer Inquiries....................................................................................................474-6535
Division of Legal ServicesMunicipal Law Section ........................................................................................................................474-5586
Other OSC OfficesBureau of State Expenditures .........................................................................................................486-3017
Bureau of State Contracts .................................................................................................................. 474-4622
(Area code for the following is 518 unless otherwise specified)

19Industrial Development AgenciesSpecial Report: Education in New York Nine Regional Snapshots
DirectoryRegional OfficeDivision of Local Government and School Accountability
Andrew A. SanFilippo, Executive Deputy Comptroller
Gabriel F. Deyo, Deputy Comptroller (518) 474-4037Tracey Hitchen Boyd, Assistant Comptroller
Cole H. Hickland, Director • Jack Dougherty, Director Direct Services (518) 474-5480
BINGHAMTON REGIONAL OFFICE - H. Todd Eames, Chief ExaminerState Office Building, Suite 1702 • 44 Hawley Street • Binghamton, New York 13901-4417Tel (607) 721-8306 • Fax (607) 721-8313 • Email: [email protected]: Broome, Chenango, Cortland, Delaware, Otsego, Schoharie, Sullivan, Tioga, Tompkins counties
BUFFALO REGIONAL OFFICE – Jeffrey D. Mazula, Chief Examiner295 Main Street, Suite 1032 • Buffalo, New York 14203-2510Tel (716) 847-3647 • Fax (716) 847-3643 • Email: [email protected]: Allegany, Cattaraugus, Chautauqua, Erie, Genesee, Niagara, Orleans, Wyoming counties
GLENS FALLS REGIONAL OFFICE - Jeffrey P. Leonard, Chief ExaminerOne Broad Street Plaza • Glens Falls, New York 12801-4396Tel (518) 793-0057 • Fax (518) 793-5797 • Email: [email protected]: Albany, Clinton, Essex, Franklin, Fulton, Hamilton, Montgomery, Rensselaer, Saratoga, Schenectady, Warren, Washington counties
HAUPPAUGE REGIONAL OFFICE – Ira McCracken, Chief ExaminerNYS Office Building, Room 3A10 • 250 Veterans Memorial Highway • Hauppauge, New York 11788-5533Tel (631) 952-6534 • Fax (631) 952-6530 • Email: [email protected]: Nassau, Suffolk counties
NEWBURGH REGIONAL OFFICE – Tenneh Blamah, Chief Examiner33 Airport Center Drive, Suite 103 • New Windsor, New York 12553-4725Tel (845) 567-0858 • Fax (845) 567-0080 • Email: [email protected]: Columbia, Dutchess, Greene, Orange, Putnam, Rockland, Ulster, Westchester counties
ROCHESTER REGIONAL OFFICE – Edward V. Grant Jr., Chief ExaminerThe Powers Building • 16 West Main Street – Suite 522 • Rochester, New York 14614-1608Tel (585) 454-2460 • Fax (585) 454-3545 • Email: [email protected]: Cayuga, Chemung, Livingston, Monroe, Ontario, Schuyler, Seneca, Steuben, Wayne, Yates counties
SYRACUSE REGIONAL OFFICE – Rebecca Wilcox, Chief ExaminerState Office Building, Room 409 • 333 E. Washington Street • Syracuse, New York 13202-1428Tel (315) 428-4192 • Fax (315) 426-2119 • Email: [email protected]: Herkimer, Jefferson, Lewis, Madison, Oneida, Onondaga, Oswego, St. Lawrence counties
STATEWIDE AUDIT - Ann C. Singer, Chief ExaminerState Office Building, Suite 1702 • 44 Hawley Street • Binghamton, New York 13901-4417Tel (607) 721-8306 • Fax (607) 721-8313

Like us on Facebook at facebook.com/nyscomptrollerFollow us on Twitter @nyscomptroller
ContactOffice of the New York State ComptrollerDivision of Local Government and School Accountability
110 State Street, 12th floorAlbany, NY 12236 Tel: (518) 474-4037Fax: (518) 486-6479or email us: [email protected]
www.osc.state.ny.us/localgov/index.htm