special section on drug metabolism and the...
TRANSCRIPT

1521-009X/43/10/1544–1556$25.00 http://dx.doi.org/10.1124/dmd.115.065276DRUG METABOLISM AND DISPOSITION Drug Metab Dispos 43:1544–1556, October 2015Copyright ª 2015 by The American Society for Pharmacology and Experimental Therapeutics
Special Section on Drug Metabolism and the Microbiome
Importance of Large Intestine in Regulating Bile Acids andGlucagon-Like Peptide-1 in Germ-Free Mice s
Felcy Pavithra Selwyn, Iván L. Csanaky,1 Youcai Zhang,2 and Curtis D. Klaassen3
Departments of Pharmacology, Toxicology, and Therapeutics (F.P.S., Y.Z.) and Internal Medicine (I.L.C., C.D.K.), University of KansasMedical Center, Kansas City, Kansas.
Received May 4, 2015; accepted July 20, 2015
ABSTRACT
It is known that 1) elevated serum bile acids (BAs) are associatedwith decreased body weight, 2) elevated glucagon-like peptide-1(GLP-1) levels can decrease bodyweight, and 3) germ-free (GF)miceare resistant to diet-induced obesity. The purpose of this study wasto test the hypothesis that a lack of intestinal microbiota results inmore BAs in the body, resulting in increased BA-mediated trans-membrane G protein–coupled receptor 5 (TGR5) signaling andincreased serum GLP-1 as a mechanism of resistance of GF miceto diet-induced obesity. GFmice had 2- to 4-fold increased total BAsin the serum, liver, bile, and ileum. Fecal excretion of BAs was 63%less in GF mice. GF mice had decreased secondary BAs andincreased taurine-conjugated BAs, as anticipated. Surprisingly,there was an increase in non–12a-OH BAs, namely, b-muricholicacid, ursodeoxycholic acid (UDCA), and their taurine conjugates, inGFmice. Further, invitroexperimentsconfirmed thatUDCA isaprimary
BA in mice. There were minimal changes in the mRNA of farnesoidX receptor target genes in the ileum (Fibroblast growth factor 15,small heterodimer protein, and ileal bile acid–binding protein), inthe liver (small heterodimer protein, liver receptor homolog-1, andcytochrome P450 7a1), and BA transporters (apical sodium de-pendent bile acid transporter, organic solute transporter a, andorganic solute transporter b) in the ileum of GF mice. Surprisingly,there were marked increases in BA transporters in the largeintestine. Increased GLP-1 levels and gallbladder size wereobserved in GF mice, suggesting activation of TGR5 signaling. Insummary, the GF condition results in increased expression of BAtransporters in the colon, resulting in 1) an increase in total BAconcentrations in tissues, 2) a change in BA composition to favoran increase in non–12a-OH BAs, and 3) activation of TGR5signaling with increased gallbladder size and GLP-1.
Introduction
Bile acids (BAs) are amphipathic cholesterol metabolites that aid inthe absorption of fats and fat-soluble vitamins from the diet. PrimaryBAs are synthesized in the liver, secreted into bile, and furthermetabolized
by intestinal bacteria to produce secondary BAs. Most of the BAs areactively reabsorbed by the ileum and enter the portal vein. Therefore,the diversity of BAs in the circulation is influenced by their metabolismby the liver as well as intestinal bacteria.The BA profile is important because BAs also regulate host
physiology. Individual BAs have physicochemical properties basedon their structure. An increase in BAs that have a –OH group in the12 position, such as cholic acid (CA) and deoxycholic acid (DCA)(Supplemental Fig. 1), increases cholesterol absorption across theintestine (Li-Hawkins et al., 2002). Taurine conjugation lowers the pKa
of BAs, increases their aqueous solubility, and promotes a highintraluminal BA concentration, leading to efficient solubilization oflipids and lipid-soluble vitamins (Setchell et al., 2013). BAs synthe-sized by the host modify the intestinal bacterial composition, andintestinal bacteria modify the circulating BA composition in the host.Thus, BAs are one of the host factors that help shape the intestinalbacterial community, and thus feeding BAs can alter intestinal microbialcomposition (Islam et al., 2011).BAs act as hormones, binding to and activating their receptors:
farnesoid X receptor (FXR) and transmembrane G protein–coupledreceptor 5 (TGR5) (official name is GPBAR). BAs regulate their ownsynthesis and transport by binding to and activating FXR (Makishimaet al., 1999; Parks et al., 1999; Wang et al., 1999). BAs also activate themembrane-bound G protein–coupled receptor TGR5, leading to anincrease in intracellular cAMP production (Maruyama et al., 2002).
This research was supported by the National Institutes of Health [GrantsES09649, ES019487, and GM111381].
This research is part of the thesis of Dr. Felcy Pavithra Selwyn titled “Alterationsin bile acid homeostasis and drug metabolism in germ-free mice.” A portion of thisresearch has been presented at the following meetings: Selwyn F and KlaassenCD (2012) Characterization of bile acid homeostasis in germ-free mice Selwyn FP,Zhang Y and Klaassen CD. Experimental Biology 2012; 2012 Apr 21–25; SanDiego, CA. American Society of Pharmacotherapy and Experimental Therapeu-tics, Bethesda, MD; (2012) Characterization of bile acid homeostasis in germ-freemice. Bile Acid-Mediated Integration of Metabolism and Liver Disease: A ResearchWorkshop; 2012 Jun 8; Bethesda, MD. National Institute of Diabetes andDigestive and Kidney Diseases, Bethesda, MD.
1Current affiliation: Division of Clinical Pharmacology, Toxicology andTherapeutic Innovation, Children’s Mercy Hospital & Clinics, Kansas City,Missouri.
2Current affiliation: School of Pharmaceutical Science and Technology, TianjinUniversity, Tianjin, China.
3Current affiliation: Department of Environmental and Occupational HealthSciences, University of Washington, Seattle, Washington.
dx.doi.org/10.1124/dmd.115.065276.s This article has supplemental material available at dmd.aspetjournals.org.
1544
http://dmd.aspetjournals.org/content/suppl/2015/07/20/dmd.115.065276.DC1Supplemental material to this article can be found at:
at ASPE
T Journals on June 25, 2018
dmd.aspetjournals.org
Dow
nloaded from
TGR5 activation in brown adipose tissue increases type 2 iodothyroninedeiodinase, which converts T4 to the active T3, which increases energyexpenditure (Watanabe et al., 2006). TGR5 activation in the enter-oendocrine cells of the intestine increases glucagon-like peptide-1 (GLP-1)secretion (Katsuma et al., 2005; Thomas et al., 2009). Patients treatedwith a BA-binding resin to reduce cholesterol levels also have improvedglycemic control, and these BA-binding resins also improved hyper-glycemia in rodent models of obesity (Kobayashi et al., 2007; Chenet al., 2010). TGR5 agonists, such as 6a-ethyl-23(S)-methyl-cholic acid(EMSA or INT-777), are promising drug candidates to treat metabolicdisorders, such as type 2 diabetes, obesity, and steatohepatitis, as theyimprove glucose tolerance and reduce inflammation and steatosis inmice (Keitel and Haussinger, 2012).Intestinal bacteria contain enzymes that metabolize BAs and change
the BA composition in the intestinal content and thus also in thecirculation of the host (Narushima et al., 2000, 2006). The capacity ofintestinal microbiota to metabolize BAs not only provides intestinalbacteria cellular carbon, nitrogen, and sulfur, but also enables them tobe bile resistant and grow in the presence of BAs. Intestinal bacteriaperform the following modifications of BAs in the gut lumen: deconju-gation of taurine or glycine-conjugated BAs (by bile acid hydrolase),oxidation and epimerization of the 3-, 7-, and 12-hydroxy groups ofBAs (by hydroxysteroid dehydrogenases), and 7-dehydroxylation (by7-dehydratase). Bile acid hydrolase and hydroxysteroid dehydroge-nase are present in a broad spectrum of intestinal bacteria, whereasenzymes for 7-dehydratase required to produce DCA and lithocholicacid are restricted to a small number of intestinal anaerobes, such asClostridium (Ridlon et al., 2006).Germ-free (GF) mice, which lack intestinal bacteria, are resistant to
high-fat diet-induced obesity (Backhed et al., 2007; Rabot et al., 2010),and, in contrast, colonization of GF mice with intestinal bacteria resultsin increased body fat content and insulin resistance (Backhed et al.,2004). Surgical therapies to treat obesity, such as vertical sleevegastrectomy, result in weight loss and are associated with elevatedcirculating BAs (Myronovych et al., 2014; Ryan et al., 2014). It isunderstood that intestinal bacteria regulate BAs in circulation (Zhanget al., 2014), and elevated BAs in circulation are associated with weightloss. BAs activate TGR5, increase secretion of GLP-1, and improveinsulin resistance and weight loss. Thus, it might be possible that GFmice have increased concentrations of bile acids that activate TGR5 andincrease GLP-1 levels, which might add in the resistance of GF mice todiet-induced obesity. Therefore, in this study, alterations in BAcomposition and BA signaling in GF mice were examined to test thishypothesis.
Materials and Methods
Animals. All mice were housed in an Association for Assessment andAccreditation of Laboratory Animal Care International–accredited facility at theUniversity of KansasMedical Center, with a 14-hour light/10-hour dark cycle, ina temperature- and humidity-controlled environment with ad libitum access to
feed and water. The initial breeding colony of GF C57BL/6J/UNC mice wasestablished with mice obtained from the National Gnotobiotic Rodent ResourceCenter (University of North Carolina, Chapel Hill, NC). GF mice were housed invinyl flexible film isolators (Class Biologically Clean Ltd., Madison, WI), withautoclaved, irradiated Harlan Sani chips (#7990.BG Irradiated Teklad SaniChips; Harlan Teklad, Madison, WI) as bedding and autoclaved paper towels orautoclaved nestlets as enrichment. All conventional (CV) C57BL/6J mice werepurchased from Jackson Laboratories (Bar Harbor,ME). All mice had free accessto the autoclaved rodent diet #5K67 (Labdiet, St. Louis, MO) and autoclavedwater. The sterility of the isolator was tested routinely by culturing andperforming wet mounts and gram stains of feces. All animal experiments wereapproved by the Institutional Animal Care and Use Committee at the Universityof Kansas Medical Center.
Chemicals and Reagents. The sources of individual BA standards andinternal standards were described previously (Zhang and Klaassen, 2010; Zhanget al., 2011a). A GLP-1 total enzyme-linked immunosorbent assay kit waspurchased from EMD Millipore (St. Charles, MO). Oasis–HLB SPE cartridgesfor BA extraction were purchased from Waters (Milford, MA). All otherchemicals and reagents, unless indicated otherwise, were purchased from Sigma-Aldrich (St. Louis, MO).
Bile Collection. The protocol for bile-duct cannulation and bile collection hasbeen described previously (Csanaky et al., 2011). Briefly, mice were anesthe-tized intraperitoneally with a ketamine/midazolam mixture (100 and 5 mg/kg,respectively), and the common bile duct of each mouse was cannulated througha high-abdominal incision with the shaft of a 30-gauge needle attached to PE-10tubing. Bile was collected in the dark for 40 minutes into preweighedmicrocentrifuge tubes on ice. The volume of bile was determined gravimetricallyusing the value 1 for specific gravity.
Tissue and Feces Collection. Mice were sacrificed with an overdose ofpentobarbital and opening the abdominal cavity. Blood was collected fromsuborbital veins into Microtainer plasma-separating tubes (BD Biosciences, SanJose, CA). Tissues were collected, frozen in liquid nitrogen, and stored at280�Cuntil further analysis. The small intestine contents were removed, and the tissuewas divided into three equal segments, namely, the duodenum, jejunum, andileum. In this study, the large intestine indicates only the colon and not thececum. All animal sacrifices and tissue collections were performed between9:00 AM and noon to minimize variations in BA metabolism due to circadianrhythm (Zhang et al., 2009, 2011b). CV and GF mice were housed individuallyin metabolic cages, and feces were collected over 24 hours.
Bile Acid Extraction and Quantification by Ultra-Performance LiquidChromatography–Tandem Mass Spectrometry. Internal standards (40mg/mld4-G-CDCA and 20 mg/ml d4-CDCA inMeOH) were added to the samples, andBAs were extracted from the serum, gallbladder bile, livers, biliary bile, ileum,and feces using methods reported previously by our laboratory (Alnouti et al.,2008; Zhang andKlaassen, 2010; Zhang et al., 2011a, 2012). The BAs quantifiedinclude taurine-conjugated cholic acid (TCA), taurine-conjugated deoxycholicacid (TDCA), taurine-conjugated chenodeoxycholic acid (TCDCA), taurine-conjugated lithocholic acid (TLCA), taurine-conjugated ursodeoxycholic acid(TUDCA), taurine-conjugated a-muricholic acid, (TaMCA), TMDCA taurine-conjugated b-muricholic acid (TbMCA), taurine-conjugated v-muricholic acid(TvMCA), cholic acid (CA), deoxycholic acid (DCA) chenodeoxycholic acid(CDCA), lithocholic acid (LCA), ursodeoxycholic acid (UDCA), a muricholicacid bMCA, and vMCA. TaMCA and TbMCA were summed together andexpressed as Ta+bMCA due to a peak separation issue. The concentrations ofindividual BAs were summed to derive the concentrations of total conjugated,total unconjugated, and total BAs in each tissue compartment.
ABBREVIATIONS: Abc, ATP-binding cassette; Abcg5/8, ATP-binding cassette sub-family G member 5/8; Asbt, apical sodium dependent bile acidtransporter; BA, bile acid; BAAT, Bile acid-CoA:amino acid N-acyltransferase; BAL, bile acid–coenzyme A ligase; Bsep, Bile salt export pump; CA,cholic acid; CDCA, chenodeoxycholic acid; CV, conventional; Cyp, cytochrome P450; DCA, deoxycholic acid; FFAR, free fatty acid receptor; Fgf15,Fibroblast growth factor 15; Fgfr4, Fibroblast growth factor receptor 4; Ibabp, Ileal bile acid binding protein; FXR, farnesoid X receptor; GF, germfree; GLP, glucagon-like peptide; LCA, Lithocholic acid; L.Int, Large intestine (Colon); Lrh-1, Liver receptor homolog-1; MCA, muricholic acid; Mrp,multidrug resistance–associated protein; Ntcp, sodium taurocholate cotransporting polypeptide; Oatp, organic anion transporting polypeptide; Ost,organic solute transporter; PCR, polymerase chain reaction; SCFA, short-chain fatty acid; SHP, small heterodimer protein; TaMCA, Taurine-conjugated a-muricholic acid; TCA, taurine-conjugated cholic acid; TCDCA, taurine-conjugated chenodeoxycholic acid; TDCA, Taurine-conjugateddeoxycholic acid; TGR5, transmembrane G protein–coupled receptor 5; TbMCA, taurine-conjugated b-muricholic acid; TvMCA, Taurine-conjugated v-muricholic acid; TLCA, Taurine-conjugated lithocholic acid; TUDCA, taurine-conjugated ursodeoxycholic acid; UDCA,ursodeoxycholic acid.
Bile Acids in Germ-Free Mice 1545
at ASPE
T Journals on June 25, 2018
dmd.aspetjournals.org
Dow
nloaded from

Preparation of Hepatic Microsomal Fractions. Hepatic microsomes wereprepared following a previously published protocol (MacGeoch et al., 1984).Briefly, livers were homogenized in a buffer (sucrose 250mM, Tris-HCl 50mM,pH 7.4, EDTA 1 mM, and Phenylmethanesulfonyl flouride (PMSF) 0.2 mM)with a glass-dounce homogenizer on ice and centrifuged at 10,000g for25 minutes at 4�C. The supernatant was decanted and centrifuged at 100,000gfor 60 minutes at 4�C. The pellet was rinsed with a KCl buffer (KCl 150 mM,Tris-HCl 10 mM, pH 7.4, and EDTA 1 mM) and centrifuged at 100,000g for60minutes at 4�C. Themicrosomeswere resuspended in glycerol buffer (Tris-HCl10 mM, pH 7.4, EDTA 1 mM, phenylmethylsulfonyl flouride (PMSF) 0.2 mM,and glycerol 20% w/v). Protein concentrations were determined by a BCA assayaccording to themanufacturer’s instructions (Pierce Biotechnology, Rockford, IL).
Microsomal Biotransformation Assay. Final reaction mixtures containedCDCA (200 mM), 0.5 mg of liver microsomal protein, 100 mM potassiumphosphate buffer, pH 7.4, and 2 mM NADPH in a final volume of 250 ml. Afterpreincubation of the microsomal protein and CDCA for 10 minutes at roomtemperature, reactions were initiated with NADPH and incubated for 60 minutesat 37�C. Reactions were terminated by adding 1 ml of ice-cold acetonitrile, driedunder a vacuum, and resuspended in 80 ml of 50% methanol. Contents weremixed and then centrifuged at 20,000g for 10minutes. The bile acids were quantifiedas mentioned above.
GLP-1 Quantification. Total serum GLP-1 was quantified using an enzyme-linked immunosorbent assay kit (EZGLP1T-36K) from EMD Millipore (Bill-erica, MA) following the manufacturer’s protocol.
RNA Isolation. Total RNAwas isolated from tissues using RNABee reagent(Tel-Test Inc., Friendswood, TX) following the manufacturer’s protocol. Theconcentration of total RNA in each sample was quantified spectrophotometri-cally at 260 nm. The quality of RNA was assessed by running the sample ona denaturing agarose gel and visualizing two discrete 18S and 28S ribosomalRNA bands, with the intensity of the 28S band double that of the 18S band.
Multiplex Suspension Assay. The mRNAs of BA biosynthetic enzymes andBA transporters in the liver and ileum were quantified using Panomics 2.0QuantiGene Plex technology (Panomics/Affymetrix Inc., Fremont, CA) follow-ing the manufacturer’s protocol. Individual gene information can be found on thePanomics web site (http://www.panomics.com), with panel numbers 21330 and21383. Fluorescence was analyzed using a Bio-Plex 200 system array readerwith Luminex 100 X-MAP technology (Bio-Rad, Hercules, CA), and data wereacquired using Bio-Plex data manager software 5.0 (Bio-Rad). The mRNAs ofthe target genes were normalized to the housekeeping gene Rpl13a.
Quantitative Polymerase Chain Reaction Analysis. Total RNA wastranscribed to single-stranded cDNA using the High Capacity cDNA ReverseTranscription Kit 1001073 (Applied Biosystems, Foster City, CA). The resultingcDNA products were amplified by polymerase chain reaction (PCR) usingPower SYBR Green PCRMaster Mix in a 7900HT Fast Real-Time PCR System(Applied Biosystems). The primers for all real-time PCR reactions weresynthesized by Integrated DNA Technologies (Coralville, IA).
cDNA Library Preparation and RNA Sequencing. The cDNA librarypreparation and sequencing of the transcriptome were performed with the help ofthe Kansas University Medical Center Genome Sequencing Facility as describedpreviously (Cui et al., 2012). The cDNA libraries from total RNA samples (n = 3per group) were prepared using an Illumina TruSeq RNA sample prep kit(Illumina, San Diego, CA). The average size of the cDNAs was approximately160 bp (excluding the adapters). The cDNA libraries were validated for RNAintegrity and quantity using an Agilent 2100 Bioanalyzer (Agilent TechnologiesInc., Santa Clara, CA) before sequencing. The cDNA libraries were clusteredonto a TruSeq paired-end flow cell and sequenced (2 � 50 bp) using a TruSeqSBS kit (Illumina) on the Illumina HiSeq2000 sequencer (Genome SequencingFacility, Kansas University Medical Center), with a multiplex strategy of foursamples per lane.
RNA-Seq Data Analysis. After the sequencing platform generated thesequencing images, the pixel-level raw data collection, image analysis, and basecalling were performed by Illumina’s real-time analysis software on a personalcomputer attached to a HiSeq2000 sequencer. The base call files (*.BCL) wereconverted to qseq files by Illumina’s BCL converter, and the qseq files weresubsequently converted to FASTQ files for downstream analysis. The RNA-Seqreads from the FASTQ files were mapped to the mouse mm10 reference genome,and the splice junctions were identified by TopHat. The output files in the binarysequence alignment format were analyzed by Cufflinks to estimate the transcript
abundance and differential expression (Cuffdiff, False discovery rate (BenjaminiHochberg) , 0.05). The mRNA abundance was expressed in fragments perkilobase of exon per million reads mapped.
Statistical Analysis. Data are presented as mean 6 S.E.M. Asterisks (*)represent significant differences between CV and GF mice determined byStudent’s t test (P , 0.05).
Results
General Characterization of GF Mice
The body weights of adult (3 months old) GF male mice werecomparable to the body weights of adult CV mice. However, adult GFfemale mice were 18% heavier than CV mice at the same age (Fig. 1).Both male and female GF mice had similar liver weights as CV mice(Fig. 1). The liver weight to body weight percentage was similar in maleCV and GF mice, but was lower in female GF mice compared with CVmice (5.1% in CV and 4.6% in GF female mice) (data not shown).
BAs in Serum, Liver, Bile, and Ileum of CV and GF Mice
Serum. GF male and female mice had a 4-fold increase in total BAsin the serum compared with CV mice (Fig. 2A). The increase in totalBAs in the serum of GF mice was due to an increase in primary BAs(11-fold increase in male GF mice and 7-fold increase in female GFmice). Secondary BAs were not detected in GF mice, confirming thatintestinal bacteria were absent in these mice. Male and female GF micehad a 3-fold increase in total 12a-OH BAs (CA, DCA, and their taurineconjugates; Fig. 2A) and a 4-fold increase in non–12a-OH BAs (BAsother than CA, DCA, and their taurine conjugates; Fig. 2A) comparedwith their respective CV mice. Taurine-conjugated BAs increased 15-and 12-fold in GF male and female mice, respectively, compared withCV mice, whereas unconjugated BAs were almost absent in male andfemale GF mice. This increase in taurine-conjugated BAs wasanticipated because of the absence of intestinal bacteria, which areknown to deconjugate taurine-conjugated BAs (Fig. 2A).Among individual BAs, taurine-conjugated a+b muricholic acid
(Ta+bMCA ) Ta+bMCA increased 45- and 14-fold, respectively, inmale and female GF mice compared with CV mice (Fig. 2B). Concen-trations of TCA were also 7- and 4-fold higher in the serum of male andfemale GF mice compared with CVmice (Fig. 2B). Female GF mice alsohad a 13-fold increased concentration of TCDCA and a 68-fold increasedconcentration of TUDCA compared with CV mice. The concentrations
Fig. 1. Body and liver weight of GF mice. Data are presented as mean 6 S.E.M.,n = 10 per group. Asterisks (*) represent a statistically significant difference betweenCV and GF mice (P , 0.05) by Student’s t test. Dark blue and light blue barsrepresent CV and GF male mice, respectively, and red and pink bars represent CVand GF female mice, respectively. F, female; M, male.
1546 Selwyn et al.
at ASPE
T Journals on June 25, 2018
dmd.aspetjournals.org
Dow
nloaded from

of all unconjugated BAs were lower in the serum of both male and femaleGF mice compared with CV mice (Fig. 2C).The proportions of individual BAs in the serum of mice were altered
markedly in the GF condition (Fig. 2D). Ta+bMCA made up 7% ofBAs in the serum of CV male mice but constituted 77% of BAs in theserum of GF male mice. Similarly, in females, Ta+b MCAs made up19% of BAs in the serum in CV mice but 71% of BAs in the serum ofGF mice.Liver. The BA concentrations in the liver are known to increase in
pathologic states, such as cholestasis. Interestingly, the absence ofintestinal bacteria resulted in a 2-fold increase in total BAs in the liversof male and female mice (Fig. 3A), with no liver damage (data notshown). The increase in total BAs was due to a 3-fold increase inprimary BAs and a 3-fold increase in non–12a-OH BAs in both maleand female GF mice compared with CV mice. As expected, there wasa decrease in secondary BAs in both male and female GF mice. Bothtaurine-conjugated and unconjugated BAs were 2-fold higher in thelivers of GF male and female mice compared with their respective CVmice (Fig. 3A).
Among conjugated BAs (Fig. 3B), Ta+bMCA increased 6-fold inGF male and female mice compared with CV mice (Fig. 3B). Inaddition, the livers of GF mice have a 1.7- and 1.4-fold increasedTCDCA (although not significant) compared with CV male and femalemice, respectively. In contrast, the concentrations of TCA, the othermajor primary BA in mice, are similar in the livers of GF and CV mice(Fig. 3B).Interestingly, the concentration of TUDCA, a known therapeutic BA,
was increased 3-fold in the livers of both male and female GF micecompared with CV mice (Fig. 3B). This suggests that in mice, TUDCAcan be synthesized by the liver and therefore is a primary BA, which isin agreement with a recent report (Sayin et al., 2013). Incubating CDCAwith hepatic microsomal protein from GF mice resulted in theappearance of a detectable peak, with the same retention time andmass as the UDCA standard (Supplemental Fig. 2).Among unconjugated BAs (Fig. 3C), bMCAwas increased 5-fold in
the livers of male and female GF mice compared with CV mice. Incontrast, other unconjugated primary BAs (CA, CDCA, and aMCA)are at similar concentrations in the livers of CV and GF mice.
Fig. 2. Concentrations of BAs in the serum ofCV and GF mice. (A) Concentrations of totalBAs (+), total 1� (primary) and 2� (secondary)BAs, total 12a-OH BAs [CA, TCA, DCA, andtaurine-conjugated deoxycholic acid (TDCA)]and non–12a-OH BAs (all other BAs), andtotal taurine-conjugated (T-Conj) and unconju-gated (Unconj) BAs. (B) Concentrations ofindividual T-conj BAs. (C) Concentrations ofindividual Unconj BAs. Data are presented asmean 6 S.E.M., n = 7–10 mice/group. (D)Proportion of individual BAs in the serum of CVand GF mice. Asterisks (*) represent statisticallysignificant differences between CV and GF mice(P , 0.05) by Student’s t test. Dark blue andlight blue bars represent CV and GF male mice,respectively, and red and pink bars represent CVand GF female mice, respectively. F, female; M,male.
Bile Acids in Germ-Free Mice 1547
at ASPE
T Journals on June 25, 2018
dmd.aspetjournals.org
Dow
nloaded from

The proportions of individual BAs were altered in the livers of GFmice (Fig. 3D). Ta+bMCA, which was the predominant BA in thelivers of GF mice, was 24% of the total BAs in CV male mice but 71%in GF male mice. Similarly Ta+bMCA were 29% of the total BAs infemale CV mice but 69% in female GF mice.
Bile. Biliary excretion of total BAs was 3-fold higher in male GFmiceand 2-fold higher in female GF mice compared with their respective CVmice (Fig. 4A). The increase in total BAs in the bile of GF mice was dueto a 3-fold increase in primary BAs inmale GFmice and a 2-fold increasein female GF mice, respectively. Secondary BAs were almost absent in
Fig. 3. Concentrations of BAs in the livers of CV and GF mice. (A) Concentrations of total BAs (+), total 1� (primary) and 2� (secondary) BAs, total 12a-OH BAs [CA,TCA, DCA, and taurine-conjugated deoxycholic acid (TDCA)] and non–12a-OH BAs (all other BAs), and total taurine-conjugated (T-Conj) and unconjugated (Unconj)BAs. (B) Concentrations of individual T-conj BAs. (C) Concentrations of individual Unconj BAs. Data are presented as mean 6 S.E.M., n = 7–10 mice/group. (D)Proportion of individual BAs in the livers of CV and GF mice. Asterisks (*) represent statistically significant differences between CV and GF mice (P , 0.05) byStudent’s t test. Dark blue and light blue bars represent CV and GF male mice, respectively, and red and pink bars represent CV and GF female mice, respectively. F,female; M, male.
1548 Selwyn et al.
at ASPE
T Journals on June 25, 2018
dmd.aspetjournals.org
Dow
nloaded from

the bile of GFmice. Total non–12a-OHBAs increased 5-fold inmale GFmice and 3-fold in female GF mice compared with CV mice. Taurine-conjugated BAs were increased 3- and 2-fold in the bile of male andfemale GF mice compared with their respective CV mice (Fig. 4A).Ta+bMCA increased 8-fold in male GF mice and 5-fold in
female GF mice, although the other major primary BA, TCA, was
similar in the bile of GF and CV mice. The concentration ofTUDCA increased 2-fold in the bile of male and female GF micecompared with CV mice (Fig. 4B). bMCA increased 9- and 2-fold inthe bile of male and female GF mice, respectively, compared withtheir respective CV mice. CA was minimal in the bile of GF mice(Fig. 4C)
Fig. 4. Biliary excretion of BAs in CV and GF mice. BAs in bile are expressed as nmol/kg body weight per min. (A) Concentrations of total BAs (+), total 1� (primary) and2� (secondary) BAs, total 12a-OH BAs [CA, TCA, DCA, and taurine-conjugated deoxycholic acid (TDCA)] and non–12a-OH BAs (all other BAs), and total taurine-conjugated (T-Conj) and unconjugated (Unconj) BAs. (B) Concentrations of individual T-conj BAs. (C) Concentrations of individual Unconj BAs. Bile was collected for40 minutes from each mouse. Data are presented as mean 6 S.E.M., n = 3–6 mice/group. (D) Proportion of individual BAs in the bile of CV and GF mice. Asterisks (*)represent statistically significant differences between CV and GF mice (P , 0.05) by Student’s t test. Dark blue and light blue bars represent CV and GF male mice,respectively, and red and pink bars represent CV and GF female mice, respectively. F, female; M, male.
Bile Acids in Germ-Free Mice 1549
at ASPE
T Journals on June 25, 2018
dmd.aspetjournals.org
Dow
nloaded from

Ta+bMCA constituted 29% of total BAs in the bile of CVmale micebut increased to 83% of total BAs in GFmale mice (Fig. 4D). Similarly,in females, Ta+bMCA constituted 29% of total BAs in CV mice butincreased to 78% of total BAs in GFmice. In contrast, TCAwas 47% oftotal BAs in the bile of male CV mice but decreased to 14% in male GF
mice. Similarly, in female mice, TCA was 44% of total BAs in the bileof CV mice but decreased to 18% in GF mice (Fig. 4D).Ileal Tissue. Total BA concentrations in ileal tissue were 3-fold
higher in male GF mice and 2-fold higher in female GF mice comparedwith their respective CV controls (Fig. 5A). This is probably due to
Fig. 5. Concentrations of BAs in the ileal tissue of CV and GF mice. (A) Concentrations of total BAs (+), total 1� (primary) and 2� (secondary) BAs, total 12a-OH BAs [CA,TCA, DCA, and taurine-conjugated deoxycholic acid (TDCA)] and non–12a-OH BAs (all other BAs), and total taurine-conjugated (T-Conj) and unconjugated (Unconj)BAs. (B) Concentrations of individual T-conj BAs. (C) Concentrations of individual Unconj BAs. Ileal tissue refers to the last one-third of the small intestine. Data arepresented as mean 6 S.E.M., n = 7–10 mice/group. (D) Proportion of individual BAs in the ileal tissue of CV and GF mice. Asterisks (*) represent statistically significantdifferences between CV and GF mice (P , 0.05) by Student’s t test. Dark blue and light blue bars represent CV and GF male mice, respectively, and red and pink barsrepresent CV and GF female mice, respectively. F, female; M, male.
1550 Selwyn et al.
at ASPE
T Journals on June 25, 2018
dmd.aspetjournals.org
Dow
nloaded from
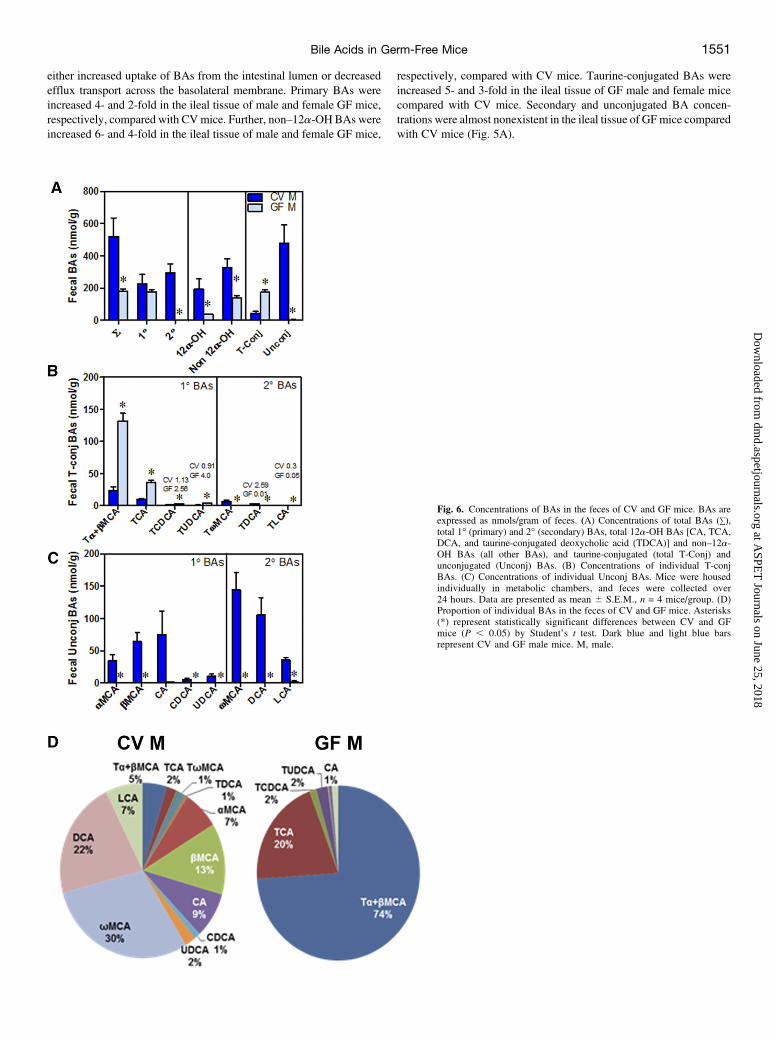
either increased uptake of BAs from the intestinal lumen or decreasedefflux transport across the basolateral membrane. Primary BAs wereincreased 4- and 2-fold in the ileal tissue of male and female GF mice,respectively, compared with CVmice. Further, non–12a-OH BAs wereincreased 6- and 4-fold in the ileal tissue of male and female GF mice,
respectively, compared with CV mice. Taurine-conjugated BAs wereincreased 5- and 3-fold in the ileal tissue of GF male and female micecompared with CV mice. Secondary and unconjugated BA concen-trations were almost nonexistent in the ileal tissue of GFmice comparedwith CV mice (Fig. 5A).
Fig. 6. Concentrations of BAs in the feces of CV and GF mice. BAs areexpressed as nmols/gram of feces. (A) Concentrations of total BAs (+),total 1� (primary) and 2� (secondary) BAs, total 12a-OH BAs [CA, TCA,DCA, and taurine-conjugated deoxycholic acid (TDCA)] and non–12a-OH BAs (all other BAs), and taurine-conjugated (total T-Conj) andunconjugated (Unconj) BAs. (B) Concentrations of individual T-conjBAs. (C) Concentrations of individual Unconj BAs. Mice were housedindividually in metabolic chambers, and feces were collected over24 hours. Data are presented as mean 6 S.E.M., n = 4 mice/group. (D)Proportion of individual BAs in the feces of CV and GF mice. Asterisks(*) represent statistically significant differences between CV and GFmice (P , 0.05) by Student’s t test. Dark blue and light blue barsrepresent CV and GF male mice. M, male.
Bile Acids in Germ-Free Mice 1551
at ASPE
T Journals on June 25, 2018
dmd.aspetjournals.org
Dow
nloaded from

Concentrations of Ta+bMCA increased in the ileal tissue of male GFmice (10-fold) and female GF mice (5-fold) compared with CV mice.TCA concentration increased 3-fold in the ileal tissue of male GF miceand 1.5-fold in the ileal tissue of female GF mice compared with CVmice (Fig. 5B). TUDCA concentration in the ileal tissue was increased6- and 3-fold in male and female GF mice, respectively, compared withtheir respective CV mice. In contrast, primary unconjugated BAs werealmost absent in the ileal tissue of both male and female GF mice(Fig. 5C).The proportions of individual BAs in the ileal tissues were altered in
GFmice compared with CVmice (Fig. 5D), but were similar to changesin other tissues of GF mice. Ta+bMCA constituted 28% of the totalBAs in the ileal tissue of male CVmice but increased to 78% inmale GFmice. Similarly, in females, Ta+bMCA constituted 38% of the totalBAs in the ileal tissue of CV mice but increased to 75% in GF mice.
Fecal Excretion of BAs in GF Mice
Male CV and GF mice were housed in individual metabolic cages,and feces were collected over a 24-hour period. Due to space restrictionsinside the GF isolator, feces were collected only from male GF mice,and we expect the trend of changes in BAs to be similar in male andfemale GF mice. Generally, more than 90% of BAs in the intestinallumen are reabsorbed and the remaining BAs are excreted in the feces.
There was a 63% decrease in the amount of total BAs in the feces of GFmice compared with CV mice, (Fig. 6A). This suggests an increasedintestinal uptake of BAs in the absence of intestinal bacteria in GF mice.Total fecal excretion of 12a-OH BAs in GF mice decreased 75% andnon–12a-OH BAs decreased 57% compared with CV mice. Further-more, the absence of intestinal bacteria that deconjugate BAs leads toa 4-fold increase in total conjugated BAs and a 99% decrease in totalunconjugated BAs in the feces of GF mice (Fig. 6A).Fecal excretion of primary taurine-conjugated BAs increased in GF
mice compared with CVmice, more specifically, Ta+bMCA increased6-fold, TCA increased 4-fold, TCDCA increased 2-fold, and TUDCAincreased 4-fold (Fig. 6B). Unconjugated BAs were essentially absentin the feces of GF mice compared with CV mice (Fig. 6C).The proportions of the various BAs in the feces of GFmice were very
different than those in CV mice. Ta+bMCA were 5% of the total BAsin the feces of CV mice but increased to 74% of the total BAs in thefeces of GF mice (Fig. 6D).
Gene Expression in the Liver
BA Enzymes. Major enzymes involved in BA biosynthesis includecytochrome P450 (Cyp) 7a1, Cyp7b1, Cyp8b1, Cyp27a1, and the BAconjugation enzymes bile acid–coenzyme A ligase (BAL) and bile acid–coenzymeA:amino acidN-acyltransferase (BAT). Surprisingly, themRNA
Fig. 7. Gene expression in livers of CV and GF mice. (A) mRNAexpression of genes involved in BA synthesis; (B) mRNA expressionof genes involved in BA transport; and (C) mRNA expression ofgenes involved in FXR feedback regulation in the livers of male andfemale CV and GF mice. mRNA was quantified by beadplex assay;n = 6 per group. Data are presented as mean 6 S.E.M. Asterisks (*)represent statistically significant differences between CV and GF mice(P , 0.05) by Student’s t test. Dark blue and light blue bars representCV and GF male mice, respectively. Red and pink bars represent CVand GF females, respectively. F, female; M, male.
1552 Selwyn et al.
at ASPE
T Journals on June 25, 2018
dmd.aspetjournals.org
Dow
nloaded from

of Cyp7a1, the rate-limiting enzyme in BA synthesis, was similar in thelivers of CV and GF male mice (Fig. 7A). However, in female GFmice,Cyp7a1 mRNA decreased to about 50% of that in CV mice (Fig. 7A).The mRNA of Cyp27a1 was similar in the livers of male GF and CVmice, but decreased 15% in female GF mice (Fig. 7A). The mRNA ofCyp7b1 was decreased by 30% in the livers of male GF mice and 52%in the livers of female GF mice, respectively, compared with CV mice(Fig. 7A). This may be an attempt to decrease the alternate pathway ofBA synthesis to ultimately decrease concentrations of BAs in the liversof GF mice.Cyp8b1, the sterol 12a-hydroxylase, is essential for the synthesis of
CA. The mRNA of Cyp8b1 was decreased 32% in the livers of male GFmice and 73% in female GF mice compared with their CV controls (Fig.7A). This correlates with the decrease in concentration of 12a-OH BAs(TCA and CA) and the decrease in the proportion of TCA to Ta+bMCAin the livers of GF mice (Fig. 3, A, B, and D).Although taurine-conjugated BAs increased in the tissues of GF
mice, the mRNA of enzymes involved in the conjugation of BAs,namely, BAL and BAT, were similar in the livers of male GF and CVmice. In the livers of female GF mice, BAL mRNA was decreased by15% and the mRNA of BAT was decreased by 19% (Fig. 7A).BA Transporters. The two BA uptake transporters in the livers are
sodium taurocholate cotransporting polypeptide (Ntcp) and organicanion transporting polypeptide (Oatp) 1b2, where Ntcp transportsconjugated BAs and Oatp1b2 transports unconjugated BAs. The GFcondition increased the mRNA of Ntcp by 42% and Oatp1b2 by 48%in male mice compared with CV male mice (Fig. 7B). This increase inthe mRNA of hepatic BA uptake transporters may enable the liver toremove more BAs from the circulation, given that total BAs are higherin the serum of both male and female GFmice. However, in female GFmice, the mRNA of Ntcp and Oatp1b2 is similar to that in female CVmice (Fig. 7B). The mRNA of the major hepatic BA efflux transporterbile salt export pump (Bsep) decreased somewhat (11%) in male GFmice but did not change in female GF mice compared with CV mice(Fig. 7B). The gene expression of multidrug resistance–associatedprotein (Mrp) 2 increased 25% in the livers of male GF mice but didnot change in female GF mice compared with their respective controls(Fig. 7B).BA Feedback Regulation. The mRNA of FXR and liver receptor
homolog-1 increased minimally (16 and 13%, respectively) in the liversof male GF mice compared with their CV controls (Fig. 7C). However,these small increases may not be biologically significant as there was nosubsequent increase in small heterodimer protein (SHP) mRNA ordecrease in Cyp7a1 mRNA in the livers of male GF mice comparedwith CVmice (Fig. 7A). The mRNAs of other important genes involvedin BA feedback regulation through FXR activation were similarlyexpressed in the livers of GF and CV mice (Fig. 7C).
Gene Expression in the Ileum
Transporters. Apical sodium dependent bile acid transporter (Asbt)is the only known apical BA uptake transporter in the ileum. AsbtmRNA increased 154% in the ileum of male GF mice compared withCV mice (Fig. 8A). This correlates with increased total BA concen-trations in the ileal tissue and decreased total BA content in the fecesobserved in GF mice compared with CV mice. However, there was nodifference in the expression of Asbt in female CV and GF mice (Fig.8A). The mRNA of Osta increased 46% in the ileal tissue of male GFmice compared with CV mice, but there was no change in OstamRNAin female GF mice compared with CV mice. The mRNA of Mrp3 wassimilar in the ileal tissue of male GF and CV mice but decreasedminimally in the ileal tissue of female GFmice compared with CVmice.ATP-binding cassette (Abc) subfamily G member 5 mRNA remained
similar in male GF and CV mice, but decreased 35% in the ileum offemale GF mice compared with female CV mice. However, the mRNAof Abc subfamily G member 8, which is the heterodimer partner of Abcsubfamily G member 5, decreased 20% in male GF mice and 40% infemale GF mice. The mRNA of the organic solute transporter (Ost) band Mrp2 were similar in the ileal tissue of male and female GF micecompared with their respective controls (Fig. 8A).Although the mRNAs of genes involved in BA-FXR signaling in
the ileal tissue were similar in GF and CV mice (Fig. 8B), the mRNAof the cholesterol sensor Liver X receptor alpha (LXRa) wasminimally induced in both male and female GF mice compared withCV mice (Fig. 8B).
Targets of TGR5 Signaling in CV and GF Mice
The major effects of TGR5 activation include increased bile flow andgallbladder size (Li et al., 2011) as well as increased GLP-1 secretionfrom the ileum (Katsuma et al., 2005). The gallbladders in GF micewere approximately 5-fold larger than those in CV mice (Fig. 9A). Inaddition, bile flow was 44% higher in GF male mice compared withtheir CV controls (Fig. 9B). GLP-1 was not detectable in the serum ofCVmice, but was 78 and 62 rMinmale and female GFmice, respectively(Fig. 9C).
Gene Expression in Various Parts of the Intestine
Because there was a decrease in fecal excretion of BAs in the feces ofGF mice but no consistent increase in the BA transporters in the ileum,the expression of BA transporters in various sections of the intestine ofmale CV and GF mice were examined by RNA-Seq. The mRNA of theBA uptake transporter Asbt decreased 93% in the jejunum, butincreased 69% in the ileum and 96% in the colon of GF mice comparedwith CV mice (Fig. 10). The mRNA of the BA efflux transporters Osta
Fig. 8. Gene expression in ileum of CV and GF mice. (A) mRNA expression of BAtransporters in the ileal tissue of male and female CV and GF mice. (B) mRNAexpression of genes involved in BA signaling in the ileum of male and female CVand GF mice. mRNA was quantified by beadplex assay; n = 6 per group. Data arepresented as mean6 S.E.M. Asterisks (*) represent statistically significant differencesbetween CV and GF mice (P, 0.05) by Student’s t test. Dark blue and light blue barsrepresent CV and GF male mice, respectively. Red and pink bars represent CV andGF females, respectively. F, female; M, male.
Bile Acids in Germ-Free Mice 1553
at ASPE
T Journals on June 25, 2018
dmd.aspetjournals.org
Dow
nloaded from

and Ostb increased 94 and 67% in the colon of GF mice compared withCV mice (Fig. 10). The mRNA of FXR increased in the large intestineof GF mice compared with CV mice (Supplemental Fig. 3).
UDCA Synthesis by Enzymes in Mouse Hepatic Microsomes
A striking finding of this study was that GF mice had elevatedconcentrations of TUDCA. TUDCA in serum was not detectable in maleCV mice, but could be quantified in GF mice (Fig. 2B). Comparedwith CV mice, GF mice had a 3-fold increase in TUDCA in the liver,a 2-fold increase in bile (Fig. 3B; Fig. 4B), a 6-fold increase in ilealtissue, and a 4-fold increase in feces (Fig. 5B; Fig. 6B). Using a traditional
biotransformation assay, we found that incubating CDCA with hepaticmicrosomal protein from GF mice resulted in the appearance ofa detectable peak, with the same retention time and mass as the UDCAstandard (Supplemental Fig. 2). No UDCA peak was detected when theassaymixture did not contain CDCA or if CAwas used instead of CDCA(data not shown), further suggesting that UDCA is a primary BA.
Discussion
The BA profiles of GF mice differ markedly from those of CV mice.In the absence of intestinal bacteria, GFmice have increased conjugatedBAs and decreased secondary BAs. GF mice only have a few types ofBAs (primary BAs and mainly taurine-conjugated BAs), which indicatesthat intestinal bacteria play a major role in the diversity of BAs.Somewhat surprisingly, there was an increase in UDCA.UDCA is an oral drug used to dissolve cholesterol gallstones and
treat liver diseases. In the present study, UDCA, which was thought tobe a secondary BA made by intestinal bacteria, increased in the tissuesof GF mice, similar to a recent report (Sayin et al., 2013). Results fromprevious studies in our laboratory demonstrate that feeding mice CDCAincreases the hepatic concentration of UDCA and TUDCA, suggestingthat UDCA is synthesized from CDCA (Zhang and Klaassen, 2010;Song et al., 2011). Indeed, in vitro experiments confirmed that UDCAcan be synthesized from CDCA by enzymes in mouse liver microsomes(Supplemental Fig. 2).The amount of BAs is much higher in GF mice than in CV mice.
Total BAs increased 4-fold in the serum (Fig. 2A), 2-fold in the liver(Fig. 3A), 3-fold in the bile (Fig. 4A), and 3-fold in the ileum (Fig. 5A)but decreased 63% in the feces (Fig. 6A) of male GF mice comparedwith CV mice. These changes are likely due to an increase in thereabsorption of BAs. The ileal BA uptake transporter (Asbt) is thoughtto be responsible for the reabsorption of most of the BAs from theintestine (Dawson et al., 2003). It is known that antibiotics decreasethe number of intestinal bacteria, increase intestinal BA absorption(Miyata et al., 2015), decrease fecal BA excretion, and increasehepatic BA concentrations (Hu et al., 2014; Zhang et al., 2014), withan increase in ileal Asbt expression. On the contrary, Asbt-null micehave limited enterohepatic circulation of BAs, increased fecal BAexcretion, and decreased BA pool size (Dawson et al., 2003), which isjust the opposite of what is observed in GF mice. GF mice also havedecreased gut motility (Kashyap et al., 2013), and thus BAs remain inthe intestine longer, providing more time for BAs to enter theenterohepatic circulation. This would also explain the increasedhalf-life of CA in GF rats reported by others (Gustafsson et al., 1957).Although BAs are thought to be primarily reabsorbed by transportersin the ileum, surprisingly, data in the present manuscript (Fig. 10)indicate that the mRNA of the BA transporters Asbt, Osta, and Ostbincrease mainly in the large intestine of GF mice (Fig. 10). ThemRNA of Asbt increases by 96%, Osta increases by 94%, and Ostbincreases by 67% compared with CV mice (Fig. 10). This suggeststhat in GF mice, BAs are taken up by transporters in the colon inaddition to the small intestine to enter the enterohepatic circulation.Thus, the increase in BA transporters in the large intestine appears tobe responsible for the increase in BAs in the tissues and the decreaseof BAs in the feces.The GF condition, as expected, led to an increase in taurine-
conjugated BAs: 15-fold in the serum, 2-fold in the liver, 3-fold inthe bile, 5-fold in the ileum, and 4-fold in the feces of male GF micecompared with CV mice. Taurine conjugation lowers the pKa of BAsand increases their water solubility. In contrast, unconjugated BAs weredecreased in all tissues, except in the liver, where they were 2-foldhigher than in CV mice.
Fig. 9. Targets of TGR5 signaling. (A) Gallbladder weights of CV and GF miceand (inset) representative pictures. (B) Bile flow in CV and GF mice. (C) SerumGLP-1 quantification by enzyme-linked immunosorbent assay. Data are presentedas mean 6 S.E.M.; n = 3–6 per group. Asterisks (*) represent statisticallysignificant differences between CV and GF mice (P , 0.05) by Student’s t test.Dark blue and light blue bars represent CV and GF male mice, respectively. Redand pink bars represent CV and GF females, respectively. F, female; M, male.
1554 Selwyn et al.
at ASPE
T Journals on June 25, 2018
dmd.aspetjournals.org
Dow
nloaded from

BA composition is similar in male and female GF mice, but differsmarkedly from their respective CV mice. For example, male GF micehave increased total non–12a-OH BAs (MCAs, UDCA, and theirtaurine conjugates): 4-fold in the serum, 3-fold in the liver, 5-fold inbile, and 6-fold in the ileum. In contrast, there are similar concentrationsof 12a-OH BAs (CA, DCA, and their taurine conjugates) in each tissue,except the serum, where they were 3-fold higher in male GF mice thanin CV mice.Ta+bMCA become the major BAs in GF mice as they increase
6-fold in the livers of male and female GF mice; 8-fold in the bile ofmale GF mice and 5-fold in the bile of female GF mice; 10-fold in theileum of male GF mice and 5-fold in the ileum of female GF mice; and6-fold in the feces of male GF mice compared with CV mice. Similarly,TUDCA increased 3-fold in the livers of male and female GF mice;2-fold in the bile of male and female GF mice; 6-fold in the ileum ofmale GF mice and 3-fold in the ileum of female GF mice; and 4-fold inthe feces of GF male mice compared with CV mice. Increasedconcentrations of MCA and UDCA make the GF BA pool morehydrophilic, which can protect against cell damage induced byhydrophobic bile acids (Heuman et al., 1991; Rodrigues et al., 1998).Under normal conditions, FXR regulates hepatic BA synthesis through
BA-mediated feedback mechanisms. Increased BAs in the liver activateFXR, which acts via SHP–liver receptor homolog-1 to decreasetranscription of Cyp7a1. In addition, increased BAs in the ileum activateFXR, induce the secretion of Fgf15 into the portal circulation, whichtravels to the liver and via Fibroblast growth factor 4 (Fgfr4)/b-klothosignaling, and down-regulate the transcription of Cyp7a1 (Chiang, 2004;Chiang et al., 2000; Inagaki et al., 2005; Kim et al., 2007). With theincrease in total BAs in the liver and intestine of GF mice, one wouldexpect an increase in FXR signaling in the liver and intestine andsubsequent down-regulation of Cyp7a1 in the liver. However, themRNAof Cyp7a1 was not lower in the livers of GF mice, and there was neitheran increase in SHP or Fgf15 mRNA in the ileum of GF mice comparedwith CVmice. TbMCA is an FXR antagonist that decreases the feedbacksecretion of intestinal fibroblast growth factor 15 (Fgf15) and thusincreases hepatic Cyp7a1 mRNA (Li et al., 2013; Sayin et al., 2013; Huet al., 2014). In the present study, there was an increase in TbMCA (FXRantagonist) but also an increase in other BAs, which are likely FXRagonists in vivo, and thus the mRNA of FXR-target genes in the intestine(Fgf15, SHP, or ileal bile acid–binding protein) and liver (SHP) aresimilar in GF and CVmice (Fig. 7, A and C; Fig. 8B). As a result, there isno alteration in Cyp7a1.TGR5 activation by BAs in the intestine induces the secretion of
GLP-1, which in turn stimulates insulin secretion and improves insulinsensitivity (Thomas et al., 2009). TGR5 receptor agonists and long-acting GLP-1 receptor agonists improve glucose tolerance and arepromising drug candidates to treat metabolic disorders, such as type 2
diabetes and obesity (Nauck, 2011; Keitel and Haussinger, 2012).Although there are minimal changes in FXR signaling in either theliver or intestine of GF mice (Fig. 7, A and C; Fig. 8B), there was anincrease in TGR5 signaling. GF mice displayed an increased gallblad-der size and increased GLP-1 in the serum (Fig. 9), both of which areendpoints of TGR5 activation (Katsuma et al., 2005; Thomas et al.,2009; Li et al., 2011; Harach et al., 2012). It is interesting to note that theBA composition in TGR5-null mice is hydrophobic (Pean et al., 2013),which is in contrast to the phenotype of GF mice, in which TGR5 isactivated.Increasing GLP-1 is a therapeutic strategy for treating diabetes and
obesity. Similar to the GF condition, reducing the number of bacteria inthe intestine by antibiotics also alters the BA composition (Zhang et al.,2014) and increases GLP-1 (Hwang et al., 2015). Anionic resins thatconcentrate BAs in the intestinal lumen also increase GLP-1 secretionvia TGR5 (Harach et al., 2012). Further, rectal administration of TCA inhumans increases GLP-1 levels in plasma (Wu et al., 2013). The alteredBA profile in GF mice might point to a BA that is a potent TGR5agonist, and thus BAs could be used to increase TGR5 signaling andincrease serum GLP-1 concentration. A recent study demonstrated thatoral administration of the antioxidant tempol to mice decreasesLactobacillus species in the intestinal lumen, leading to accumulationof TbMCA, inhibition of FXR signaling, and resistance to obesity (Liet al., 2013). Although humans do not make TbMCA, appropriatestudies might lead to the establishment of TbMCA as a drug.Apart from BAs, other intestinal bacterial metabolites, such as short-
chain fatty acids (SCFAs) also regulate GLP-1 secretion by activatingthe SCFA receptors, free fatty acid receptor 2 (FFAR 2) and FFAR3(Tolhurst et al., 2012). Altering intestinal bacterial composition bydietary fiber administration also induces GLP-1 levels (Reimer andMcBurney, 1996; Massimino et al., 1998; Tolhurst et al., 2012). Futureexperiments utilizing TGR5-null mice would help establish the relativeimportance of BAs (via TGR5) and SCFA (via FFAR2 or FFAR3) inregulating the secretion of GLP-1 from the intestine.In conclusion, this study describes changes in BA homeostasis in
male and female GF mice. The most notable changes in GF mice are1) increases in total BAs in the serum, liver, bile, and ileal tissue; 2) ashift in BA composition toward an increase in Ta+bMCA; and 3) alarge increase in GLP-1. It appears that these effects are secondary to anincrease in BA transporters in the colon.
Acknowledgments
The authors thank the National Gnotobiotic Rodent Resource Center at theUniversity of North Carolina for providing the GF C57BL/6J/UNC mice.The authors also thank Dr. Matthew Pratt-Hyatt for his valuable assistance withthe ultra-performance liquid chromatography/mass spectrometry and for his helpwith the microsomal biotransformation assay to study UDCA synthesis; Dr. JuliaYue Cui, Clark Bloomer, and Byunggil Yoo for their technical assistance in
Fig. 10. Gene expression of BA-related genes across the intestinal sections. Total RNA was isolated from livers of adult male CV and GF C57BL/6 mice (n = 3 per group).The mRNA quantified by RNA-Seq as described in Materials and Methods. Asterisk (*) indicates differential expression determined using Cuffdiff (FDR-BH , 0.05). Darkblue and light blue bars represent CV and GF male mice, respectively. L.Int, large intestine (colon); M, male.
Bile Acids in Germ-Free Mice 1555
at ASPE
T Journals on June 25, 2018
dmd.aspetjournals.org
Dow
nloaded from

RNA-Seq; the members of the Klaassen laboratory for their help in tissuecollection; and Dr. Bruno Hagenbuch and Dr. Thomas Pazdernik for carefulrevision of parts of the manuscript presented in the dissertation.
Authorship ContributionsParticipated in research design: Selwyn, Csanaky, Zhang, Klaassen.Conducted experiments: Selwyn, Csanaky, Zhang, Klaassen.Performed data analysis: Selwyn, Csanaky, Zhang, Klaassen.Wrote or contributed to the writing of the manuscript: Selwyn, Csanaky,
Zhang, Klaassen.
References
Alnouti Y, Csanaky IL, and Klaassen CD (2008) Quantitative-profiling of bile acids and theirconjugates in mouse liver, bile, plasma, and urine using LC-MS/MS. J Chromatogr B AnalytTechnol Biomed Life Sci 873:209–217.
Bäckhed F, Ding H, Wang T, Hooper LV, Koh GY, Nagy A, Semenkovich CF, and Gordon JI(2004) The gut microbiota as an environmental factor that regulates fat storage. Proc Natl AcadSci USA 101:15718–15723.
Bäckhed F, Manchester JK, Semenkovich CF, and Gordon JI (2007) Mechanisms underlying theresistance to diet-induced obesity in germ-free mice. Proc Natl Acad Sci USA 104:979–984.
Chen L, McNulty J, Anderson D, Liu Y, Nystrom C, Bullard S, Collins J, Handlon AL, Klein R,and Grimes A, et al. (2010) Cholestyramine reverses hyperglycemia and enhances glucose-stimulated glucagon-like peptide 1 release in Zucker diabetic fatty rats. J Pharmacol Exp Ther334:164–170.
Chiang JY (2004) Regulation of bile acid synthesis: pathways, nuclear receptors, and mecha-nisms. J Hepatol 40:539–551.
Chiang JY, Kimmel R, Weinberger C, and Stroup D (2000) Farnesoid X receptor responds to bileacids and represses cholesterol 7alpha-hydroxylase gene (CYP7A1) transcription. J Biol Chem275:10918–10924.
Csanaky IL, Lu H, Zhang Y, Ogura K, Choudhuri S, and Klaassen CD (2011) Organic anion-transporting polypeptide 1b2 (Oatp1b2) is important for the hepatic uptake of unconjugatedbile acids: studies in Oatp1b2-null mice. Hepatology 53:272–281.
Cui JY, Gunewardena SS, Yoo B, Liu J, Renaud HJ, Lu H, Zhong XB, and Klaassen CD (2012)RNA-Seq reveals different mRNA abundance of transporters and their alternative transcriptisoforms during liver development. Toxicol Sci 127:592–608.
Dawson PA, Haywood J, Craddock AL, Wilson M, Tietjen M, Kluckman K, Maeda N, and ParksJS (2003) Targeted deletion of the ileal bile acid transporter eliminates enterohepatic cycling ofbile acids in mice. J Biol Chem 278:33920–33927.
Gustafsson BE, Bergstrom S, Lindstedt S, and Norman A (1957) Turnover and nature of fecal bileacids in germfree and infected rats fed cholic acid-24-14C; bile acids and steroids 41. Proc SocExp Biol Med 94:467–471.
Harach T, Pols TW, Nomura M, Maida A, Watanabe M, Auwerx J, and Schoonjans K (2012)TGR5 potentiates GLP-1 secretion in response to anionic exchange resins. Sci Rep 2:430.
Heuman DM, Mills AS, McCall J, Hylemon PB, Pandak WM, and Vlahcevic ZR (1991) Con-jugates of ursodeoxycholate protect against cholestasis and hepatocellular necrosis caused bymore hydrophobic bile salts. In vivo studies in the rat. Gastroenterology 100:203–211.
Hu X, Bonde Y, Eggertsen G, and Rudling M (2014) Muricholic bile acids are potent regulatorsof bile acid synthesis via a positive feedback mechanism. J Intern Med 275:27–38.
Hwang I, Park YJ, Kim YR, Kim YN, Ka S, Lee HY, Seong JK, Seok YJ, and Kim JB (2015)Alteration of gut microbiota by vancomycin and bacitracin improves insulin resistance viaglucagon-like peptide 1 in diet-induced obesity. FASEB J 29:2397–2411.
Inagaki T, Choi M, Moschetta A, Peng L, Cummins CL, McDonald JG, Luo G, Jones SA,Goodwin B, and Richardson JA, et al. (2005) Fibroblast growth factor 15 functions as anenterohepatic signal to regulate bile acid homeostasis. Cell Metab 2:217–225.
Islam KB, Fukiya S, Hagio M, Fujii N, Ishizuka S, Ooka T, Ogura Y, Hayashi T, and Yokota A(2011) Bile acid is a host factor that regulates the composition of the cecal microbiota in rats.Gastroenterology 141:1773–1781.
Kashyap PC, Marcobal A, Ursell LK, Larauche M, Duboc H, Earle KA, Sonnenburg ED,Ferreyra JA, Higginbottom SK, and Million M, et al. (2013) Complex interactions among diet,gastrointestinal transit, and gut microbiota in humanized mice. Gastroenterology 144:967–977.
Katsuma S, Hirasawa A, and Tsujimoto G (2005) Bile acids promote glucagon-like peptide-1secretion through TGR5 in a murine enteroendocrine cell line STC-1. Biochem Biophys ResCommun 329:386–390.
Keitel V and Häussinger D (2012) Perspective: TGR5 (Gpbar-1) in liver physiology and disease.Clin Res Hepatol Gastroenterol 36:412–419.
Kim I, Ahn SH, Inagaki T, Choi M, Ito S, Guo GL, Kliewer SA, and Gonzalez FJ (2007)Differential regulation of bile acid homeostasis by the farnesoid X receptor in liver and in-testine. J Lipid Res 48:2664–2672.
Kobayashi M, Ikegami H, Fujisawa T, Nojima K, Kawabata Y, Noso S, Babaya N, Itoi-BabayaM, Yamaji K, and Hiromine Y, et al. (2007) Prevention and treatment of obesity, insulinresistance, and diabetes by bile acid-binding resin. Diabetes 56:239–247.
Li F, Jiang C, Krausz KW, Li Y, Albert I, Hao H, Fabre KM, Mitchell JB, Patterson AD,and Gonzalez FJ (2013) Microbiome remodelling leads to inhibition of intestinal farnesoid Xreceptor signalling and decreased obesity. Nat Commun 4:2384.
Li T, Holmstrom SR, Kir S, Umetani M, Schmidt DR, Kliewer SA, and Mangelsdorf DJ (2011)The G protein-coupled bile acid receptor, TGR5, stimulates gallbladder filling. Mol Endocrinol25:1066–1071.
Li-Hawkins J, Gåfvels M, Olin M, Lund EG, Andersson U, Schuster G, Björkhem I, Russell DW,and Eggertsen G (2002) Cholic acid mediates negative feedback regulation of bile acid syn-thesis in mice. J Clin Invest 110:1191–1200.
MacGeoch C, Morgan ET, Halpert J, and Gustafsson JA (1984) Purification, characterization, andpituitary regulation of the sex-specific cytochrome P-450 15 beta-hydroxylase from livermicrosomes of untreated female rats. J Biol Chem 259:15433–15439.
Makishima M, Okamoto AY, Repa JJ, Tu H, Learned RM, Luk A, Hull MV, Lustig KD,Mangelsdorf DJ, and Shan B (1999) Identification of a nuclear receptor for bile acids. Science284:1362–1365.
Maruyama T, Miyamoto Y, Nakamura T, Tamai Y, Okada H, Sugiyama E, Nakamura T, ItadaniH, and Tanaka K (2002) Identification of membrane-type receptor for bile acids (M-BAR).Biochem Biophys Res Commun 298:714–719.
Massimino SP, McBurney MI, Field CJ, Thomson AB, Keelan M, Hayek MG, and Sunvold GD(1998) Fermentable dietary fiber increases GLP-1 secretion and improves glucose homeostasisdespite increased intestinal glucose transport capacity in healthy dogs. J Nutr 128:1786–1793.
Miyata M, Hayashi K, Yamakawa H, Yamazoe Y, and Yoshinari K (2015) Antibacterial drugtreatment increases intestinal bile acid absorption via elevated levels of ileal apical sodium-dependent bile acid transporter but not organic solute transporter a protein. Biol Pharm Bull 38:493–496.
Myronovych A, Kirby M, Ryan KK, Zhang W, Jha P, Setchell KD, Dexheimer PJ, Aronow B,Seeley RJ, and Kohli R (2014) Vertical sleeve gastrectomy reduces hepatic steatosis whileincreasing serum bile acids in a weight-loss-independent manner. Obesity (Silver Spring) 22:390–400.
Narushima S, Ito K, Kuruma K, and Uchida K (2000) Composition of cecal bile acids in ex-germfree mice inoculated with human intestinal bacteria. Lipids 35:639–644.
Narushima S, Itoha K, Miyamoto Y, Park SH, Nagata K, Kuruma K, and Uchida K (2006)Deoxycholic acid formation in gnotobiotic mice associated with human intestinal bacteria.Lipids 41:835–843.
Nauck MA (2011) Incretin-based therapies for type 2 diabetes mellitus: properties, functions, andclinical implications. Am J Med 124 (Suppl)S3–S18.
Parks DJ, Blanchard SG, Bledsoe RK, Chandra G, Consler TG, Kliewer SA, Stimmel JB, WillsonTM, Zavacki AM, and Moore DD, et al. (1999) Bile acids: natural ligands for an orphannuclear receptor. Science 284:1365–1368.
Péan N, Doignon I, Garcin I, Besnard A, Julien B, Liu B, Branchereau S, Spraul A, Guettier C,and Humbert L, et al. (2013) The receptor TGR5 protects the liver from bile acid overloadduring liver regeneration in mice. Hepatology 58:1451–1460.
Rabot S, Membrez M, Bruneau A, Gérard P, Harach T, Moser M, Raymond F, Mansourian R,and Chou CJ (2010) Germ-free C57BL/6J mice are resistant to high-fat-diet-induced insulinresistance and have altered cholesterol metabolism. FASEB J 24:4948–4959.
Reimer RA and McBurney MI (1996) Dietary fiber modulates intestinal proglucagon messengerribonucleic acid and postprandial secretion of glucagon-like peptide-1 and insulin in rats.Endocrinology 137:3948–3956.
Ridlon JM, Kang DJ, and Hylemon PB (2006) Bile salt biotransformations by human intestinalbacteria. J Lipid Res 47:241–259.
Rodrigues CMP, Fan G, Ma X, Kren BT, and Steer CJ (1998) A novel role for ursodeoxycholicacid in inhibiting apoptosis by modulating mitochondrial membrane perturbation. J Clin Invest101:2790–2799.
Ryan KK, Tremaroli V, Clemmensen C, Kovatcheva-Datchary P, Myronovych A, Karns R,Wilson-Pérez HE, Sandoval DA, Kohli R, and Bäckhed F, et al. (2014) FXR is a moleculartarget for the effects of vertical sleeve gastrectomy. Nature 509:183–188.
Sayin SI, Wahlström A, Felin J, Jäntti S, Marschall HU, Bamberg K, Angelin B, Hyötyläinen T,Ore�si�c M, and Bäckhed F (2013) Gut microbiota regulates bile acid metabolism by reducing thelevels of tauro-beta-muricholic acid, a naturally occurring FXR antagonist. Cell Metab 17:225–235.
Setchell KD, Heubi JE, Shah S, Lavine JE, Suskind D, Al-Edreesi M, Potter C, Russell DW,O’Connell NC, Wolfe B, Jha P, Zhang W, Bove KE, Knisely AS, Hofmann AF, Rosenthal P,and Bull LN (2013) Genetic defects in bile acid conjugation cause fat-soluble vitamin de-ficiency. Gastroenterology 144:945–955.e6.
Song P, Zhang Y, and Klaassen CD (2011) Dose-response of five bile acids on serum and liverbile acid concentrations and hepatotoxicty in mice. Toxicol Sci 123:359–367.
Thomas C, Gioiello A, Noriega L, Strehle A, Oury J, Rizzo G, Macchiarulo A, Yamamoto H,Mataki C, and Pruzanski M, et al. (2009) TGR5-mediated bile acid sensing controls glucosehomeostasis. Cell Metab 10:167–177.
Tolhurst G, Heffron H, Lam YS, Parker HE, Habib AM, Diakogiannaki E, Cameron J, Grosse J,Reimann F, and Gribble FM (2012) Short-chain fatty acids stimulate glucagon-like peptide-1secretion via the G-protein-coupled receptor FFAR2. Diabetes 61:364–371.
Wang H, Chen J, Hollister K, Sowers LC, and Forman BM (1999) Endogenous bile acids areligands for the nuclear receptor FXR/BAR. Mol Cell 3:543–553.
Watanabe M, Houten SM, Mataki C, Christoffolete MA, Kim BW, Sato H, Messaddeq N, HarneyJW, Ezaki O, and Kodama T, et al. (2006) Bile acids induce energy expenditure by promotingintracellular thyroid hormone activation. Nature 439:484–489.
Wu T, Bound MJ, Standfield SD, Gedulin B, Jones KL, Horowitz M, and Rayner CK (2013)Effects of rectal administration of taurocholic acid on glucagon-like peptide-1 and peptide YYsecretion in healthy humans. Diabetes Obes Metab 15:474–477.
Zhang Y, Csanaky IL, Lehman-McKeeman LD, and Klaassen CD (2011a) Loss of organic aniontransporting polypeptide 1a1 increases deoxycholic acid absorption in mice by increasingintestinal permeability. Toxicol Sci 124:251–260.
Zhang Y and Klaassen CD (2010) Effects of feeding bile acids and a bile acid sequestrant onhepatic bile acid composition in mice. J Lipid Res 51:3230–3242.
Zhang Y, Limaye PB, Lehman-McKeeman LD, and Klaassen CD (2012) Dysfunction of organicanion transporting polypeptide 1a1 alters intestinal bacteria and bile acid metabolism in mice.PLoS One 7:e34522.
Zhang Y, Limaye PB, Renaud HJ, and Klaassen CD (2014) Effect of various antibiotics onmodulation of intestinal microbiota and bile acid profile in mice. Toxicol Appl Pharmacol 277:138–145.
Zhang YK, Guo GL, and Klaassen CD (2011b) Diurnal variations of mouse plasma and hepaticbile acid concentrations as well as expression of biosynthetic enzymes and transporters. PLoSOne 6:e16683.
Zhang YK, Yeager RL, and Klaassen CD (2009) Circadian expression profiles of drug-processinggenes and transcription factors in mouse liver. Drug Metab Dispos 37:106–115.
Address correspondence to: Dr. Curtis D. Klaassen, 2617 W 112 Street,Leawood, KS 66211. E-mail: [email protected]
1556 Selwyn et al.
at ASPE
T Journals on June 25, 2018
dmd.aspetjournals.org
Dow
nloaded from