special-topic lecture bioinformatics: mathematics of biological networks leistungspunkte/credit...
TRANSCRIPT

Special-topic lecture bioinformatics: Mathematics of Biological Networks
Leistungspunkte/Credit points: 5 (V2/Ü1)
This course is taught in English language.
The material (from books and original literature) are provided online at the
course website: http://gepard.bioinformatik.uni-saarland.de/teaching/ss-2014/stl-bioinformatics-mathcellnet-ss14
Topics to be covered:
This course will enter into details of selected topics on the topology of
biological networks.
SS 2014 - lecture 1 Mathematics of Biological Networks1

Tutorial
We will handout 6 bi-weekly assignments.
Groups of up to two students can hand in a solved assignment.
Send your solutions by e-mail to the responsible tutors :
Maryam Nazarieh (#1 - #3) and Thorsten Will (#4 - #6)
until the time+date indicated on the assignment sheet.
The weekly tutorial on Tuesday 12.45 am – 1.30 pm (same room) will discuss
the assignment solutions.
On demand, the tutors may also give some advice for solving the new assignments.
2SS 2014 - lecture 1 Mathematics of Biological Networks

Schein / certification conditions
The successful participation in the lecture course („Schein“)
will be certified upon fulfilling
- Schein condition 1 (> 50% of the points for the assignments)
- and upon passing the final written exam at the end of the semester
The grade on your „Schein“ equals that of your final exam.
Everybody who took the final exam (and passed it or did not pass it)
and those who have missed the final exam
can take the re-exam at the beginning of WS14/15.
The better grade counts! But there will no second re-exam.
3SS 2014 - lecture 1 Mathematics of Biological Networks

Lecture material
Lectures 1-6 follow this book by Mark Newman / Oxford Univ Press
- Chapter 7: measures and metrics- Chapter 11: matrix algorithms and graph partitioning- Chapter 17: epidemics on networks
Chapter 7-10/12 follow this book by Daphne Koller & Nir Friedman /MIT Press
- Chapter X:- Chapter Y:- Chapter Z:
You can find both books in the CS library.
Lectures 11/13-15 introduce modern methods
to reconstruct gene-regulatory networks
4SS 2014 - lecture 1 Mathematics of Biological Networks

Some Graph Basics
Network <=> Graph
Formal definition:
A graph G is an ordered pair (V, E) of a set V of vertices and a set E of edges.
undirected graph directed graph
If E = V(2) => fully connected graph
G = (V, E)
5SS 2014 - lecture 1 Mathematics of Biological Networks

Graph Basics II
Subgraph:
G' = (V', E') is a subset of G = (V, E)
Weighted graph:
Weights assigned to the edges
6SS 2014 - lecture 1 Mathematics of Biological Networks

Walk the Graph
Path = sequence of connected verticesstart vertex => internal vertices => end vertex
Vertices u and v are connected, if there exists a path from u to v.otherwise they are disconnected
Two paths are independent (internally vertex-disjoint), if they have no internal vertices in common.
There is an infinite number of paths connecting the green to the red vertex.
The shortest paths have length = 2.
Four trails go from the green to the red vertex.
Two of them are independent.
Length of a path = number of vertices || sum of the edge weights
Trail = path, in which all edges are distinct
7SS 2014 - lecture 1 Mathematics of Biological Networks

Local Connectivity: Degree
Degree k of a vertex = number of edges at this vertexDirected graph => distinguish kin and kout
Degree distribution P(k) = fraction of nodes with k connections
k 0 1 2 3 4
P(k) 0 3/7 1/7 1/7 2/7
k 0 1 2 3
P(kin) 1/7 5/7 0 1/7
P(kout) 2/7 3/7 1/7 1/7
8SS 2014 - lecture 1 Mathematics of Biological Networks

Graph Representation: e.g. by adjacency matrix
Adjacency matrix is a N x N matrix with entries Muv
Muv = weight when edge between u and v exists, 0 otherwise
1 2 3 4 5 6 7
1 – 0 1 0 0 0 0
2 0 – 1 0 0 0 0
3 1 1 – 1 1 0 0
4 0 0 1 – 1 1 0
5 0 0 1 1 – 1 1
6 0 0 0 1 1 – 0
7 0 0 0 0 1 0 –
symmetric for undirected graphs
+ fast O(1) lookup of edges– large memory requirements– adding or removing nodes is expensive
Note: very convenient in programming languages that support sparse multi-dimensional arrays=> Perl
9SS 2014 - lecture 1 Mathematics of Biological Networks

Measures and Metrics
“ Which are the most important or central vertices in a network? “
10SS 2014 - lecture 1 Mathematics of Biological Networks
Examples of A) Degreecentrality,
C) Betweenness centrality,
E) Katz centrality,
B) Closeness centrality,
D) Eigenvector centrality,
F) Alpha centrality of the same graph.
www.wikipedia.org

Degree centrality
Perhaps the simplest centrality measure in a network is the degree centrality that is simply equal to the degree of each vertex.
E.g. in a social network, individuals that have many connections to others might have - more influence, - more access to information, - or more prestige than those individuals who have fewer connections.
A natural extension of the simple degree centrality is eigenvector centrality.
11SS 2014 - lecture 1 Mathematics of Biological Networks

Towards Eigenvector Centrality
Let us start by defining the centrality of vertex xi as the sum of the centralities
of all its neighbors:
where Aij is an element of the adjacency matrix.
(This equation system must be solved recursively until convergence.)
We can also write this expression in matrix notation as
x’ = A x where x is the vector with elements xi .
Repeating this process to make better estimates gives after t steps the following vector of centralities:
x(t) = At x(0)
12SS 2014 - lecture 1 Mathematics of Biological Networks

Eigenvector Centrality
Now let us write x(0) as a linear combination of the eigenvectors vi of the
(quadratic) adjacency matrix1
with suitable constants ci
Then =
where the ki are the eigenvalues of A and k1 is the largest of them.
(remember A x = x from linear algebra for each eigenvector x)
Since ki / k1 < 1 for all i j , all terms in the sum decay exponentially as t
becomes large.
In the limit t → , we get x(t) = c1 k1t v1
1 Remember from linear algebra that a quadratic matrix with full rank can be diagonalized.
13SS 2014 - lecture 1 Mathematics of Biological Networks

Eigenvector Centrality
This limiting vector of the eigenvector centralities is simply proportional to the leading eigenvector of the adjacency matrix.
Equivalently, we could say that the centrality x satisfies
A x = k1 x
This is the eigenvector centrality first proposed by Bonacich (1987).
The centrality xi of vertex i is proportional to the sum of the centralities of
its neighbors:
This has the nice property that the centrality can be large either because a vertexhas many neighbors or because it has important neighbors (or both).
14SS 2014 - lecture 1 Mathematics of Biological Networks

Problems of the Eigenvector Centrality
The eigenvector centrality works best for undirected networks.
For directed networks, certain complications can arise.
In the figure on the right, vertex A will have eigenvector centrality zero.Hence, vertex B will also have centrality zero.
15SS 2014 - lecture 1 Mathematics of Biological Networks

Katz Centrality
One solution to the issues of the Eigenvector Centrality is the following:
We simply give each vertex a small amount of centrality “for free”,regardless of its position in the network or the centrality of its neighbors.
→ we define where and are positive constants.
In matrix terms, this can be written as x = Ax + 1
where 1 is the vector (1,1,1,…) T . By rearranging for x we find
I x - A x = 1 (where we used I x = x)
(I - A) x = 1(I - A )-1 (I - A) x = (I - A )-1 1x = (I - A )-1 1
When setting =1, we get the Katz centrality (1953) x = (I - A )-1 1
16SS 2014 - lecture 1 Mathematics of Biological Networks

Computing the Katz Centrality
The Katz centrality differs from the ordinary eigenvector centrality by having a free parameter , which governs the balance between the eigenvector term and the constant term.
However, inverting a matrix on a computer has a complexity of O(n3) for a graph with n vertices.
This becomes prohibitively expensive for networks with more than 1000 nodes or so.
It is more efficient to make an initial guess of x and then repeat
x' = Ax + 1
many times. This will converge to a value close to the correct centrality.
A good test for convergence is to make two different initial guesses and run this until the resulting centrality vectors agree within some small threshold.
17SS 2014 - lecture 1 Mathematics of Biological Networks

Towards PageRank
The Katz centrality also has one feature that can be undesirable.
If a vertex with high Katz centrality has edges pointing to many other vertices,then all those vertices also get high centrality.
E.g. if a Wikipedia page points to my webpage, my webpage will get a centrality comparable to Wikipedia!
But Wikipedia of course also points to many other websites, so that its contribution to my webpage “should” be relatively small because my page is only one of millions of others.
-> we will define a variation of the Katz centrality in which the centrality I derive from my network neighbors is proportional to their centrality divided by their out-degree.
18SS 2014 - lecture 1 Mathematics of Biological Networks

PageRank
This centrality is defined by
At first, this seems problematic if the network contains vertices with zero outdegree.
However, this can easily be fixed by setting kjout = 1 for all such vertices.
In matrix terms, this equation becomes
x = A D-1 x + 1
where 1 is the vector (1,1,1,…)T and D the diagonal matrix with Dij = max(kjout , 1)
19SS 2014 - lecture 1 Mathematics of Biological Networks

PageRank
By rearranging we find that
x = (I - A D-1 )-1 1
Because plays the same unimportant role as before, we will set = 1.
Then we get x = (I - A D-1 )-1 1 = D (D - A )-1 1
This centrality measure is commonly known as PageRank, using the term used by Google.
PageRank is one of the ingredients used by Google to determine the ranking of the answers to your queries.
is a free parameter and should be chosen less than 1. (Google uses 0.85).
20SS 2014 - lecture 1 Mathematics of Biological Networks
Hubs and Authorities
So far we have considered measures that assign high centrality to a vertex if those vertices that point to it have high centrality too.
However, in some networks it is appropriate also to accord a vertex high centrality if it points to others with high centrality.
E.g. a review article pointing at many important papers in one research field may be a useful source of information.
Authorities are nodes that contain useful information on a topic of interest.
Hubs are nodes that tell us where the best authorities can be found.
An authority may also be a hub, and vice versa.
21SS 2014 - lecture 1 Mathematics of Biological Networks

Hubs and Authorities
Kleinberg developed this into a centrality algorithm calledHyperlink-induced topic search (HITS).
The HITS algorithm gives each vertex i in a network an authority centrality xi and a hub centrality yi .
A vertex with high authority centrality is pointed to by many hubs, i.e. by many other vertices with high hub centrality.
A vertex with high hub centrality points to many vertices with high authority centrality.
Thus, an important scientific paper (in the authority sense) would be one that is cited in many important reviews (in the hub sense).
An important review is one that cites many important papers.
22SS 2014 - lecture 1 Mathematics of Biological Networks
Authority and Hub Centralities
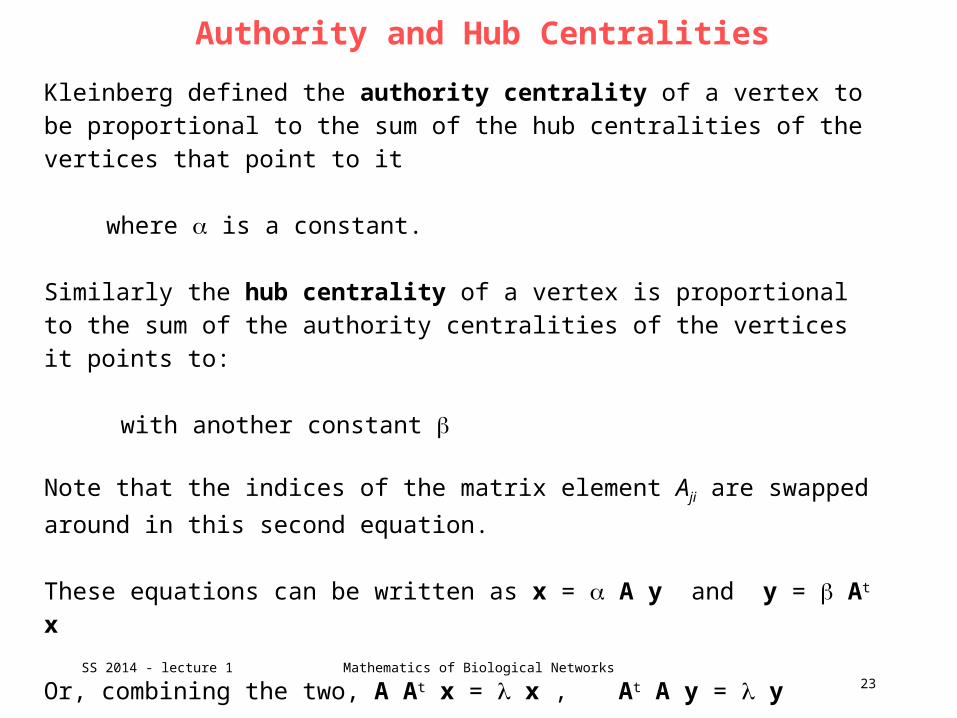
Kleinberg defined the authority centrality of a vertex to be proportional to the sum of the hub centralities of the vertices that point to it
where is a constant.
Similarly the hub centrality of a vertex is proportional to the sum of the authority centralities of the vertices it points to:
with another constant
Note that the indices of the matrix element Aji are swapped around in this
second equation.
These equations can be written as x = A y and y = At x
Or, combining the two, A At x = x , At A y = y
23SS 2014 - lecture 1 Mathematics of Biological Networks

Closeness centrality
An entirely different measure of centrality is provided by the closeness centrality.
Suppose dij is the length of a geodesic path (i.e. the shortest path) from a
vertex i to another vertex j. Here, length means the number of edges along the path.
Then, the mean geodesic distance from i, averaged over all vertices j in the network is
The mean distance li is not a centrality measure in the same sense as the other
centrality measures.
It gives low values for more central vertices and high values for less central ones.
24SS 2014 - lecture 1 Mathematics of Biological Networks

Closeness centrality
The inverse of li is called the closeness centrality Ci
It has become popular in recent years to rank film actors according to their closeness centrality in the network of who has appeared in films with who else.
Using data from www.imdb.com the largest component of the network includes more than 98 % of about half a million actors.
25SS 2014 - lecture 1 Mathematics of Biological Networks
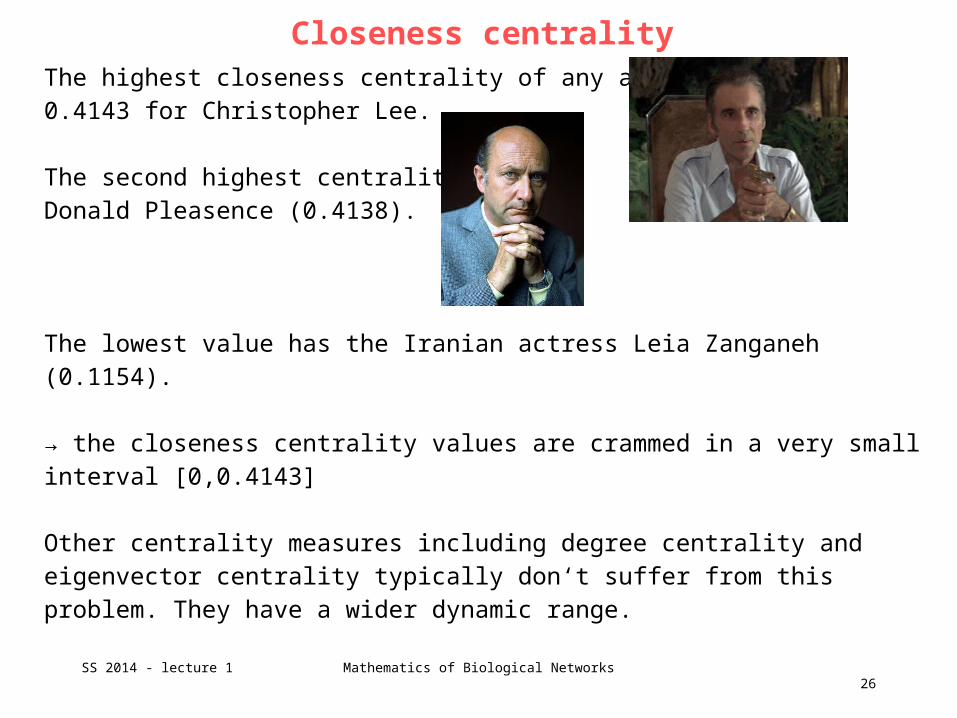
Closeness centralityThe highest closeness centrality of any actor is 0.4143 for Christopher Lee.
The second highest centrality has Donald Pleasence (0.4138).
The lowest value has the Iranian actress Leia Zanganeh (0.1154).
→ the closeness centrality values are crammed in a very small interval [0,0.4143]
Other centrality measures including degree centrality and eigenvector centrality typically don‘t suffer from this problem. They have a wider dynamic range.
Pictures from wikipedia
26SS 2014 - lecture 1 Mathematics of Biological Networks

27
Gene-regulatory networks (GRNs)
Biological regulationvia proteins and metabolites
Projected gene-regulatory network
Remember: genes do not interact directly
<=>
<=>

Centrality of Genes in Gene Regulatory Networks
28SS 2014 - lecture 1 Mathematics of Biological Networks
Authors analyzed centralities within the gene regulatory network (GRN) of Escherichia coli. Falk Schreiber
The GRN network was constructed based on the transcriptional regulatory interactions of genes in RegulonDB, Version 5.5 (Salgado et al. (2006)).
Genes are represented by vertices and transcriptional regulatory interactions between genes are modelled as edges, a common approach to model GRNs.
The interactions between genes represent transcriptional control of transcriptionfactors on the transcription of regulated genes.
The resulting network consisted of 1250 vertices and 2515 edges.

Subgraph motifs in biological networks
Several motifs (overrepresented subgraphs) have been identified in all kinds of biological networks.
The best studied motif is the feed-forward loop (FFL) motif. Its functional properties have been analyzed in detail theoretically and experimentally especially in gene regulatory networks (Shen-Orr et al. (2002).
Different motifs occurring in a human cellular signalling network were analysed by Awan et al. (2007). They discovered that genes which are related to cancer are enriched in the target vertices of several motifs and that cell mobility genes are enriched in the source vertices of motifs.
29SS 2014 - lecture 1 Mathematics of Biological Networks

Motif-based centrality
30SS 2014 - lecture 1 Mathematics of Biological Networks
Given: a graph G, a motif M and the corresponding motif match set MSG.
Define the motif-based centrality Cmb that assigns
to every vertex v the number of matches the vertex v occurs in.
E.g. the vertex v01 in the graph shown in Fig. 2occurs in 2 matches of the FFL motif shown in Fig. 3. Therefore Cmb(v01) = 2.

Motif-based centralities
Two extensions of this motif-based centrality exist: - motif-based centrality with roles and - motif-based centrality with classes.
Vertices of motifs may represent different functions.
E.g. in the gene regulatory network context 3 different functions of the vertices of the feed forward loop (FFL) motif can be identified:
(1)the vertex at the top is the master regulator, this vertex regulates the other two vertices;
(2) the vertex on the right side is the intermediate regulator, it is regulated by the master regulator and itself regulates together with the master regulator the vertex at the bottom
31SS 2014 - lecture 1 Mathematics of Biological Networks

Motif-based centralities
(3) the vertex at the bottom of the drawing is regulated by both other vertices and is therefore called the regulated vertex.
Such different functions of vertices within motifs are called roles and 3 roles can be assigned to the vertices of the FFL motif.
The motif-based centrality with roles Cmbr restricts the number of
counted matches to those matches where the vertex occurs in the match with the role under consideration.
32SS 2014 - lecture 1 Mathematics of Biological Networks

Chain of motifs
Using the previously introduced concepts we can extend the motif-based centrality method further.
By assigning the same role to similar vertices of a group of similar motifs we can establish a centrality based on a class (or group) of motifs.
Consider, for example, a group of chains (see Fig. 4), where all vertices at the start of such chains have a similar characteristic (no incoming edges) and all vertices at the end have another similar characteristic (no outgoing edges).
33SS 2014 - lecture 1 Mathematics of Biological Networks

Motif classes
For gene regulatory networks several motif classes are known.
For example, the regulatory chain motif class, as in the example above, consists of a set of chains of 3 or more regulators in which one regulator regulates another regulator, which in turn regulates a third one and so forth.
In the motif class single input motif (SIM) a set of vertices is exclusively regulated by a single vertex.
The motif-based centrality with classes Cmbc therefore is the sum of motif-based centralities with roles Cmbr for the same role in similar or
related motifs.
34SS 2014 - lecture 1 Mathematics of Biological Networks

Radiality and integration centralitiesThese two centrality measures are related to the closeness centrality.
Given the distance matrix D = (dist(i,j)) between all vertices,one can define the reverse distance matrix
RDij = diameter(G) + 1 – Dij where diameter(G) is the highest
distance value of the graph.
On the basis of this, the radiality is defined as
and integration is defined as
A vertex with high radiality value can easily reach other vertices.A vertex with a high integration value is easily reachable from other vertices.Both measures are shortest-pathway based measures.
35SS 2014 - lecture 1 Mathematics of Biological Networks

Comparison of centrality measures
36SS 2014 - lecture 1 Mathematics of Biological Networks
ideg: in-degree kat: Katz status index, katR: reversed g.odeg: out-degree spb: shortest-path betweennesspar: PageRank int: integrationparR: PageRank for the reversed graph rad: radiality
chains: motif-based centrality for the chain classfflA, fflB, fflC: motif-based centralities for the FFL motif with roles

37
Background: Hierarchical GRN of E.coli
Network with all regulatory edges pointing downwards
→
→ a few global regulators (•) control all the details
Largest WCC: 325 operons (3/4 of the complete network)WCC = weakly connected component (ignore directions of regulation)
Ma et al., BMC Bioinformatics 5 (2004) 199
Lowest level: operons that code for TFs with only auto-regulation, or no TFsNext layer: delete nodes of lower layer, identify TFs that do not regulate other operons in this layer (only lower layers)Continue …

Most central genes in E. coli GRN
38SS 2014 - lecture 1 Mathematics of Biological Networks

Correlation between results for different centralities
39SS 2014 - lecture 1 Mathematics of Biological Networks
Some centralities correlate with values above 0.9 to other centralities (out-degree, PageRank, Katz status index, radiality, motif-based centrality with chain classes (chains)).
These high coefficients can be easily explained:
1101 out of 1250 vertices have an out-degree of zero. All these vertices are assigned the same centrality of nearly zero for Katz, PageRank, and the value zero for the radiality and chains.

Centralities of vertices with non-zero outdegree
Table 4 shows the pairwise correlation coefficients for the centrality values of the vertices which have a non-zero out-degree.
These coefficients show a different picture: all 5 centralities rank the remaining149 genes differently. Only the centrality radiality and Katz status index achieve a considerable high correlation to each other and to chains.
In conclusion, the centralities applied to the GRN rank the genes quite differently.
The motif-based centrality with chain classes is able to rank the highest number (15) of interesting genes (18 global regulators identified by Martínez-Antonio and Collado-Vides (2003)) within the top 2% of all genes.
40SS 2014 - lecture 1 Mathematics of Biological Networks

SummaryThe analysis of network topology is of interest in many different disciplines, e.g. social networks.
There exist different sorts of networks for biological cells:Protein-protein interaction networks, gene-regulatory networks, metabolic networks, …
For the gene regulatory network of E. coli motif-based centrality outperforms other methods in terms of identifying the key regulatory genes.
41SS 2014 - lecture 1 Mathematics of Biological Networks