specialty cheese market...specialty, and farmstead cheesemakers producing handmade, natural...
TRANSCRIPT
RESEARCH REPORT
Specialty Cheese Market July 2019
Research Report
Specialty Cheese Market
Prepared For:
Vermont Agency of Agriculture, Food & Markets
August 2019
Table of Contents
Executive Summary ....................................................................................................................................... 3
Market Conditions ........................................................................................................................................ 3
Overview ................................................................................................................................................... 3
Opportunities ............................................................................................................................................ 3
Production ................................................................................................................................................. 4
Consumption ............................................................................................................................................. 6
Consumer Trends and Distribution Channels ............................................................................................... 8
Overview ................................................................................................................................................... 8
Product and Sales ...................................................................................................................................... 8
Distribution Channels .............................................................................................................................. 10
Innovative Applications ........................................................................................................................... 11
Consumer Insights Survey ........................................................................................................................... 12
Methodology ........................................................................................................................................... 12
Findings ................................................................................................................................................... 13
Conclusions ............................................................................................................................................. 28
Business to Business Survey ........................................................................................................................ 29
Introduction ............................................................................................................................................ 29
Methods .................................................................................................................................................. 29
Findings ................................................................................................................................................... 29
Conclusions ............................................................................................................................................. 35
Recommended Engagement Strategy ........................................................................................................ 35
Citations ...................................................................................................................................................... 37
Appendix A: B2B Survey Interview Questions ........................................................................................... 39
Contacts ...................................................................................................................................................... 40
3
Executive Summary In response to a work request issued by the Vermont Agency of Agriculture Food and Markets, Atlantic Corporation (Atlantic) performed extensive market research on specialty, artisan, and farmstead cheese to determine market conditions, trends in consumer demand, and current distribution channels and to outline the most advantageous strategies for cheesemakers to be competitive in a global market. This research summation report consists of results of the following tasks that are described in detail in the subsequent sections:
❖ Conduct a detailed global review of existing industry and trade research to determine the precise
sizing of the international artisanal cheese industry, including market statistics, economic insights,
a breakdown of industry product segments, key market and industry trends, and analyses shaping
the direction of the market.
❖ Administer a survey across five northeastern states to assess consumer attitudes and preferences
about specialty cheese, including willingness to pay and optimal price points, where they purchase
specialty cheese, and the type of packaging that appeals most to them.
❖ Conduct a qualitative business to business assessment to describe products, pricing, and
packaging among Vermont and Massachusetts specialty cheese producers and retailers, and to
identify areas of additional research needed to determine the most successful sales channels and
marketing strategies.
Market Conditions
Overview Cheese is the single largest category of specialty foods in the U.S. and market value continues to grow
each year.1 Currently, the U.S. has 600 varieties of cheeses and there are over 1,000 licensed artisan,
specialty, and farmstead cheesemakers producing handmade, natural flavored, or fresh-from-the-farm
cheeses,2 which are becoming increasingly popular among Americans. In this section, we describe the
current market conditions for conventional and specialty cheeses, the world’s top importers and
exporters, production, trends in consumption, and provide a trade gap analysis.
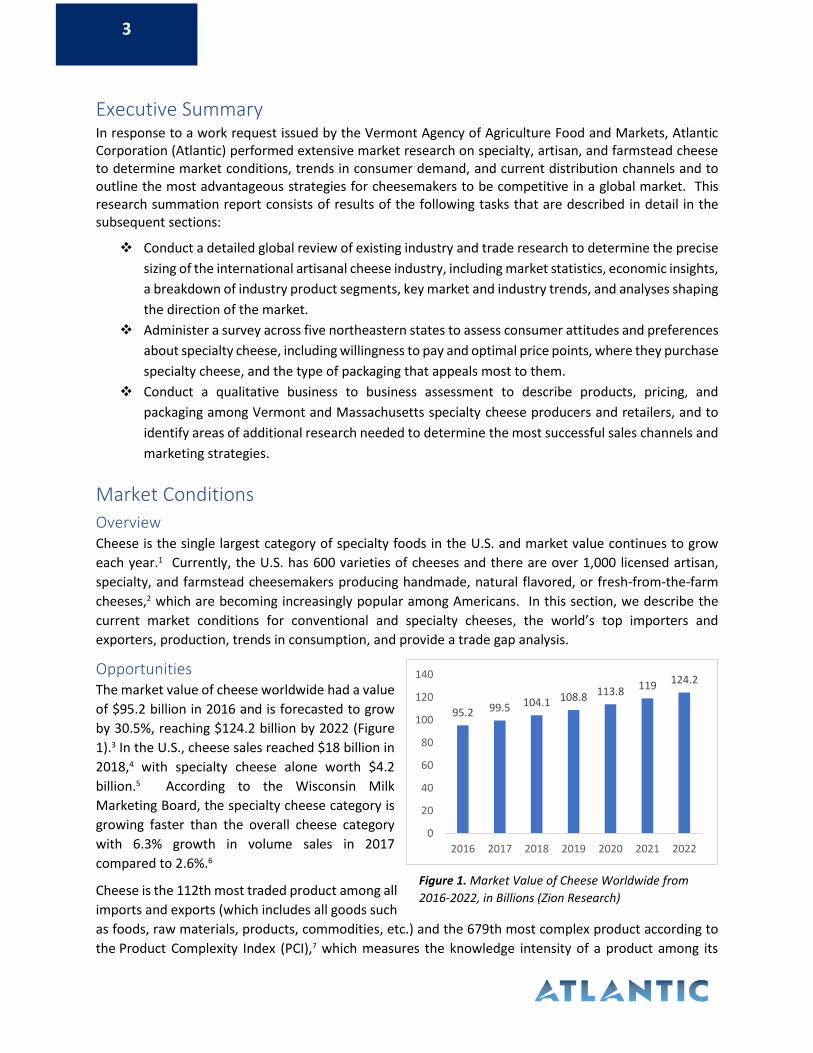
Opportunities The market value of cheese worldwide had a value
of $95.2 billion in 2016 and is forecasted to grow
by 30.5%, reaching $124.2 billion by 2022 (Figure
1).3 In the U.S., cheese sales reached $18 billion in
2018,4 with specialty cheese alone worth $4.2
billion.5 According to the Wisconsin Milk
Marketing Board, the specialty cheese category is
growing faster than the overall cheese category
with 6.3% growth in volume sales in 2017
compared to 2.6%.6
Cheese is the 112th most traded product among all
imports and exports (which includes all goods such
as foods, raw materials, products, commodities, etc.) and the 679th most complex product according to
the Product Complexity Index (PCI),7 which measures the knowledge intensity of a product among its
95.2 99.5 104.1 108.8 113.8 119 124.2
0
20
40
60
80
100
120
140
2016 2017 2018 2019 2020 2021 2022
Figure 1. Market Value of Cheese Worldwide from
2016-2022, in Billions (Zion Research)
4
exporters. The top five exporters and importers of cheese are all located in the European Union, where
cheese is a key dairy commodity. The U.S. is one of the top ten countries for cheese exports and imports,
though the U.S. industry is concentrated in a few key states. The U.S. exported 5% of the world’s value in
cheese and imported 4.2% (Table 1).
Table 1. Top 5 of the World’s Importers and Exporters of Cheese and the United States
Top Exporters of Cheese Top Importers of Cheese
Country and Ranking % of World’s Export Value
Export Value Country and Ranking
% of World’s Import Value
Import Value
1. Germany 15% $4.3 billion 1. Germany 14% $4.2 billion
2. The Netherlands 13% $3.8 billion 2. The UK 6.9% $2.0 billion
3. France 12% $3.5 billion 3. Italy 6.6% $1.9 billion
4. Italy 9.8% $2.9 billion 4. France 5.8% $1.7 billion
5. Denmark 5.7% $1.7 billion 5. Belgium 5.6% $1.7 billion
6. United States 5.0% $1.5 billion 7. United States 4.2% $1.2 billion
Production More than 600 varieties of cheese are produced in the U.S.,8 the majority of which is produced from cow’s
milk. The cheese industry has grown considerably from 2013 to 2018, having increased 18% from 5.04
million metric tons in 2013 to 5.88 in 2018. In 2012, the number of specialty cheesemakers reached 825,
having doubled in six years.9 Today, there are over 1,000 specialty cheesemakers in the U.S.2 and the
nation is on track to produce at least 5.99 million metric tons in 2019,10 accounting for another 1.9%
increase in one year. Wisconsin and California lead the nation’s cheese industry having produced 3.37 and
2.51 billion pounds of cheese respectively in 2017. Both states hold large proportions of the country’s
dairy cows, offering an abundant supply of fresh milk for cheese manufacturers. Other key states in the
cheese industry include Idaho, New York, New Mexico, and Minnesota.10 For comparison, Vermont
cheese production has been steadily increasing since 2010 when production was around 110 million
pounds, with upwards of 147 million pounds of cheese produced in 2018. Of all Vermont cheese
produced, 69% is cheddar cheese.11 Massachusetts produces 600,000 pounds of farmstead cheese
annually, half of which is goat cheese.12
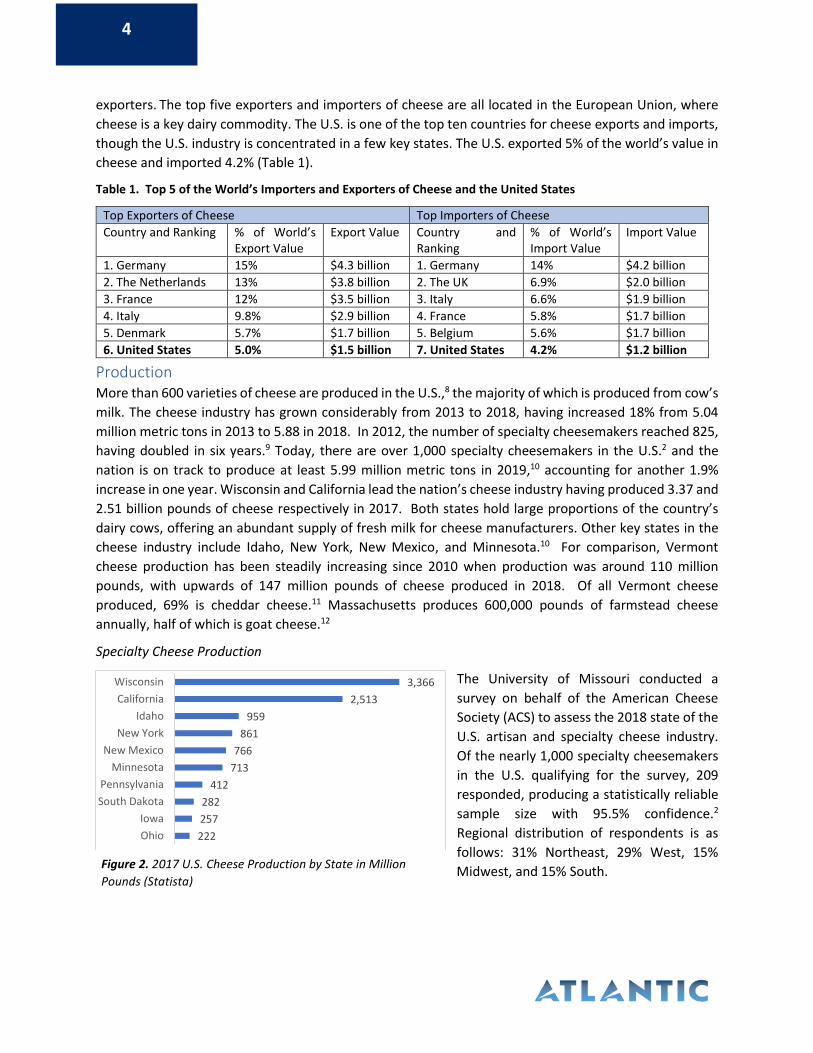
Specialty Cheese Production
The University of Missouri conducted a
survey on behalf of the American Cheese
Society (ACS) to assess the 2018 state of the
U.S. artisan and specialty cheese industry.
Of the nearly 1,000 specialty cheesemakers
in the U.S. qualifying for the survey, 209
responded, producing a statistically reliable
sample size with 95.5% confidence.2
Regional distribution of respondents is as
follows: 31% Northeast, 29% West, 15%
Midwest, and 15% South.
222
257
282
412
713
766
861
959
2,513
3,366
Ohio
Iowa
South Dakota
Pennsylvania
Minnesota
New Mexico
New York
Idaho
California
Wisconsin
Figure 2. 2017 U.S. Cheese Production by State in Million
Pounds (Statista)
5
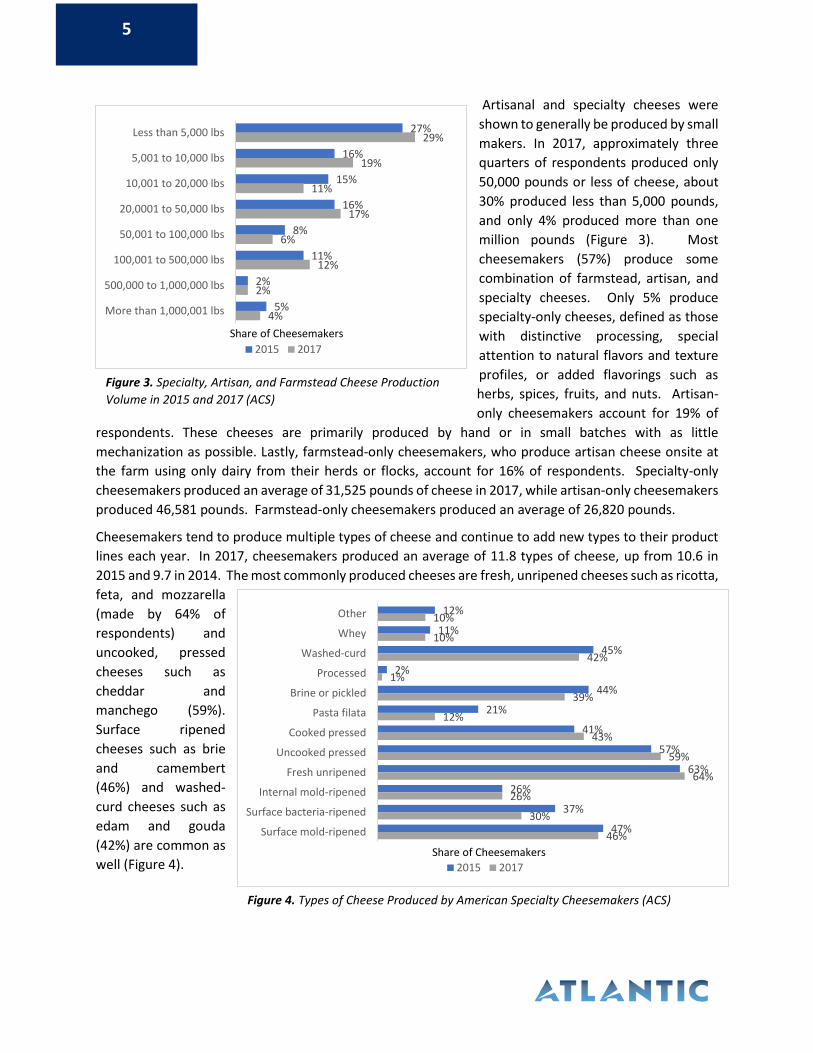
Artisanal and specialty cheeses were
shown to generally be produced by small
makers. In 2017, approximately three
quarters of respondents produced only
50,000 pounds or less of cheese, about
30% produced less than 5,000 pounds,
and only 4% produced more than one
million pounds (Figure 3). Most
cheesemakers (57%) produce some
combination of farmstead, artisan, and
specialty cheeses. Only 5% produce
specialty-only cheeses, defined as those
with distinctive processing, special
attention to natural flavors and texture
profiles, or added flavorings such as
herbs, spices, fruits, and nuts. Artisan-
only cheesemakers account for 19% of
respondents. These cheeses are primarily produced by hand or in small batches with as little
mechanization as possible. Lastly, farmstead-only cheesemakers, who produce artisan cheese onsite at
the farm using only dairy from their herds or flocks, account for 16% of respondents. Specialty-only
cheesemakers produced an average of 31,525 pounds of cheese in 2017, while artisan-only cheesemakers
produced 46,581 pounds. Farmstead-only cheesemakers produced an average of 26,820 pounds.
Cheesemakers tend to produce multiple types of cheese and continue to add new types to their product
lines each year. In 2017, cheesemakers produced an average of 11.8 types of cheese, up from 10.6 in
2015 and 9.7 in 2014. The most commonly produced cheeses are fresh, unripened cheeses such as ricotta,
feta, and mozzarella
(made by 64% of
respondents) and
uncooked, pressed
cheeses such as
cheddar and
manchego (59%).
Surface ripened
cheeses such as brie
and camembert
(46%) and washed-
curd cheeses such as
edam and gouda
(42%) are common as
well (Figure 4).
Figure 3. Specialty, Artisan, and Farmstead Cheese Production
Volume in 2015 and 2017 (ACS)
Figure 4. Types of Cheese Produced by American Specialty Cheesemakers (ACS)
27%
16%
15%
16%
8%
11%
2%
5%
29%
19%
11%
17%
6%
12%
2%
4%
Less than 5,000 lbs
5,001 to 10,000 lbs
10,001 to 20,000 lbs
20,0001 to 50,000 lbs
50,001 to 100,000 lbs
100,001 to 500,000 lbs
500,000 to 1,000,000 lbs
More than 1,000,001 lbs
2015 2017
Share of Cheesemakers
12%
11%
45%
2%
44%
21%
41%
57%
63%
26%
37%
47%
10%
10%
42%
1%
39%
12%
43%
59%
64%
26%
30%
46%
Other
Whey
Washed-curd
Processed
Brine or pickled
Pasta filata
Cooked pressed
Uncooked pressed
Fresh unripened
Internal mold-ripened
Surface bacteria-ripened
Surface mold-ripened
2015 2017
Share of Cheesemakers
6
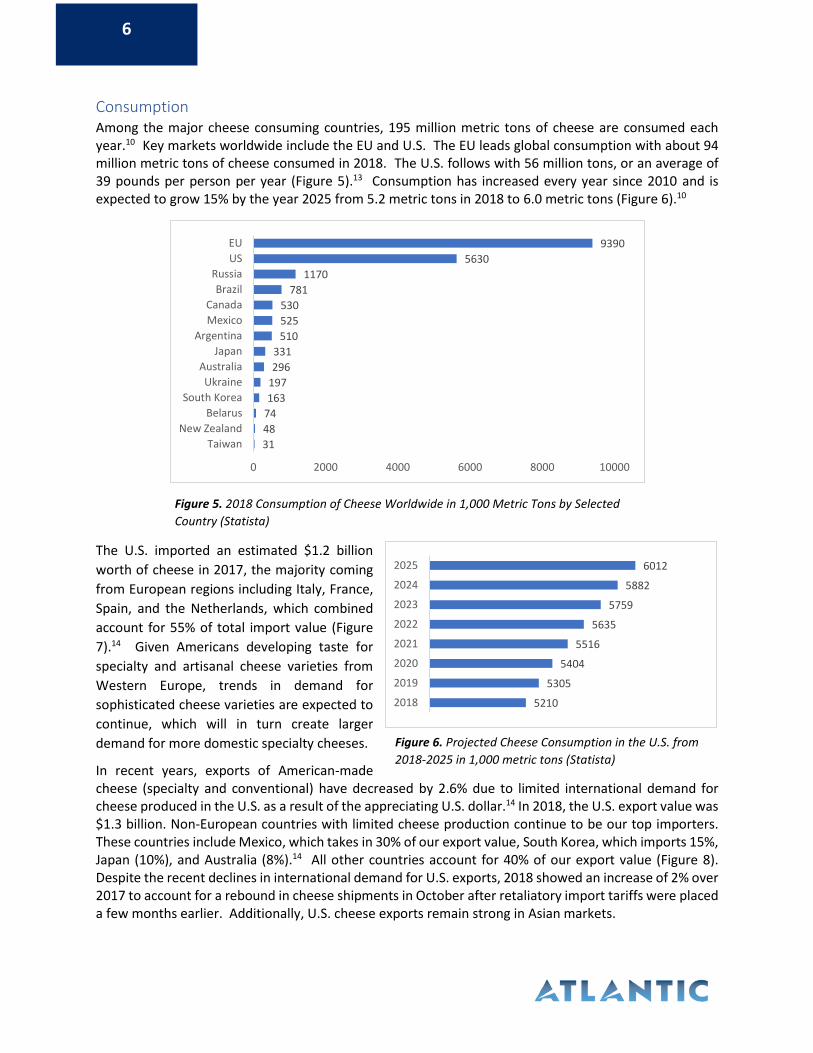
Consumption Among the major cheese consuming countries, 195 million metric tons of cheese are consumed each year.10 Key markets worldwide include the EU and U.S. The EU leads global consumption with about 94 million metric tons of cheese consumed in 2018. The U.S. follows with 56 million tons, or an average of 39 pounds per person per year (Figure 5).13 Consumption has increased every year since 2010 and is expected to grow 15% by the year 2025 from 5.2 metric tons in 2018 to 6.0 metric tons (Figure 6).10
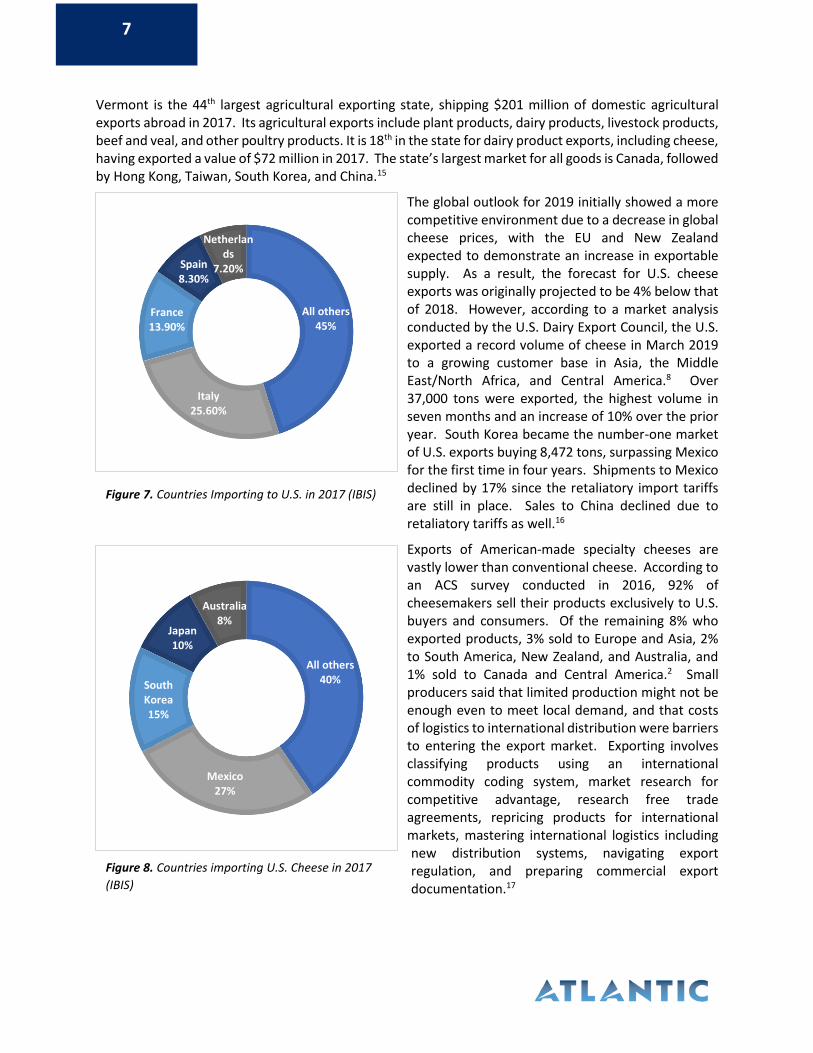
The U.S. imported an estimated $1.2 billion
worth of cheese in 2017, the majority coming
from European regions including Italy, France,
Spain, and the Netherlands, which combined
account for 55% of total import value (Figure
7).14 Given Americans developing taste for
specialty and artisanal cheese varieties from
Western Europe, trends in demand for
sophisticated cheese varieties are expected to
continue, which will in turn create larger
demand for more domestic specialty cheeses.
In recent years, exports of American-made cheese (specialty and conventional) have decreased by 2.6% due to limited international demand for cheese produced in the U.S. as a result of the appreciating U.S. dollar.14 In 2018, the U.S. export value was $1.3 billion. Non-European countries with limited cheese production continue to be our top importers. These countries include Mexico, which takes in 30% of our export value, South Korea, which imports 15%, Japan (10%), and Australia (8%).14 All other countries account for 40% of our export value (Figure 8). Despite the recent declines in international demand for U.S. exports, 2018 showed an increase of 2% over 2017 to account for a rebound in cheese shipments in October after retaliatory import tariffs were placed a few months earlier. Additionally, U.S. cheese exports remain strong in Asian markets.
31
48
74
163
197
296
331
510
525
530
781
1170
5630
9390
0 2000 4000 6000 8000 10000
Taiwan
New Zealand
Belarus
South Korea
Ukraine
Australia
Japan
Argentina
Mexico
Canada
Brazil
Russia
US
EU
Figure 6. Projected Cheese Consumption in the U.S. from
2018-2025 in 1,000 metric tons (Statista)
Figure 5. 2018 Consumption of Cheese Worldwide in 1,000 Metric Tons by Selected
Country (Statista)
5210
5305
5404
5516
5635
5759
5882
6012
2018
2019
2020
2021
2022
2023
2024
2025
7
Vermont is the 44th largest agricultural exporting state, shipping $201 million of domestic agricultural exports abroad in 2017. Its agricultural exports include plant products, dairy products, livestock products, beef and veal, and other poultry products. It is 18th in the state for dairy product exports, including cheese, having exported a value of $72 million in 2017. The state’s largest market for all goods is Canada, followed by Hong Kong, Taiwan, South Korea, and China.15
The global outlook for 2019 initially showed a more competitive environment due to a decrease in global cheese prices, with the EU and New Zealand expected to demonstrate an increase in exportable supply. As a result, the forecast for U.S. cheese exports was originally projected to be 4% below that of 2018. However, according to a market analysis conducted by the U.S. Dairy Export Council, the U.S. exported a record volume of cheese in March 2019 to a growing customer base in Asia, the Middle East/North Africa, and Central America.8 Over 37,000 tons were exported, the highest volume in seven months and an increase of 10% over the prior year. South Korea became the number-one market of U.S. exports buying 8,472 tons, surpassing Mexico for the first time in four years. Shipments to Mexico declined by 17% since the retaliatory import tariffs are still in place. Sales to China declined due to retaliatory tariffs as well.16
Exports of American-made specialty cheeses are vastly lower than conventional cheese. According to an ACS survey conducted in 2016, 92% of cheesemakers sell their products exclusively to U.S. buyers and consumers. Of the remaining 8% who exported products, 3% sold to Europe and Asia, 2% to South America, New Zealand, and Australia, and 1% sold to Canada and Central America.2 Small producers said that limited production might not be enough even to meet local demand, and that costs of logistics to international distribution were barriers to entering the export market. Exporting involves classifying products using an international commodity coding system, market research for competitive advantage, research free trade agreements, repricing products for international markets, mastering international logistics including new distribution systems, navigating export regulation, and preparing commercial export documentation.17
Figure 8. Countries importing U.S. Cheese in 2017
(IBIS)
Figure 7. Countries Importing to U.S. in 2017 (IBIS)
All others45%
Italy25.60%
France13.90%
Spain8.30%
Netherlands
7.20%
All others40%
Mexico27%
South Korea15%
Japan10%
Australia8%
8
Consumer Trends and Distribution Channels
Overview The U.S. cheese industry was valued at $18 billion in 2018 with specialty cheeses accounting for $4.2
billion. Currently, the specialty cheese industry is growing faster than conventional cheeses. As a result
of the industry’s growth, trends in consumer demand continue to be well studied. This section outlines
products and sales, trends in consumer demand, most frequently used and successful distribution
channels, and product innovations.
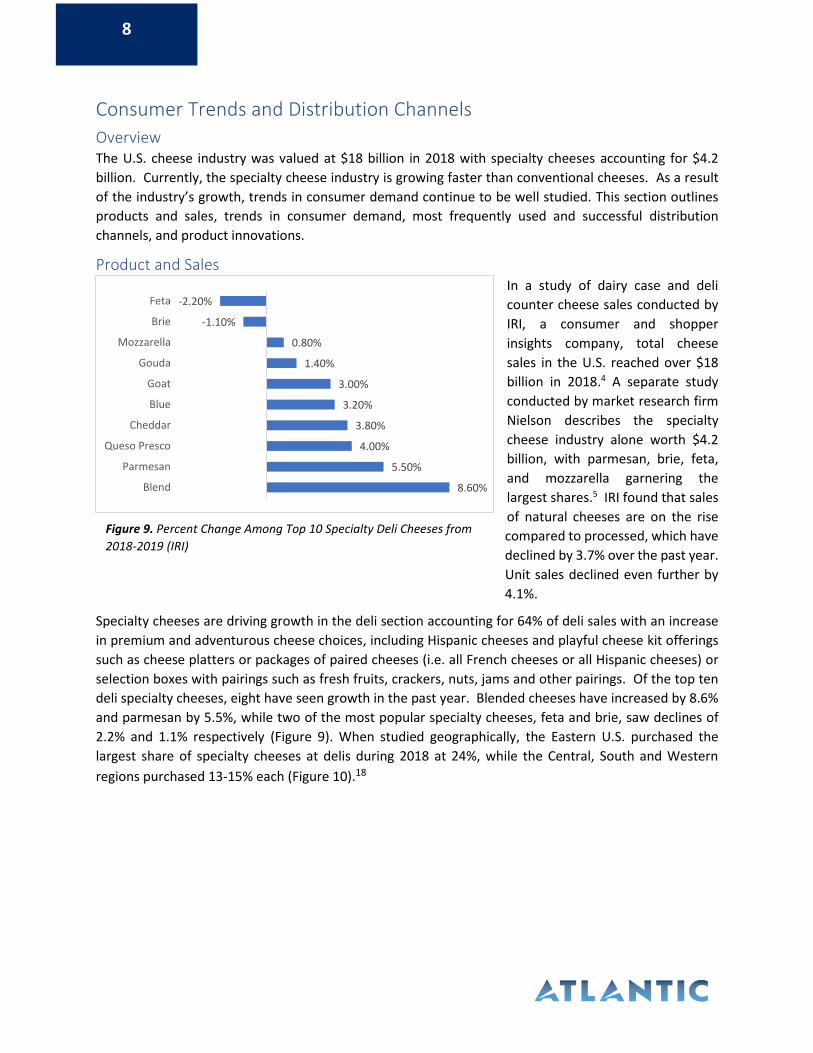
Product and Sales In a study of dairy case and deli
counter cheese sales conducted by
IRI, a consumer and shopper
insights company, total cheese
sales in the U.S. reached over $18
billion in 2018.4 A separate study
conducted by market research firm
Nielson describes the specialty
cheese industry alone worth $4.2
billion, with parmesan, brie, feta,
and mozzarella garnering the
largest shares.5 IRI found that sales
of natural cheeses are on the rise
compared to processed, which have
declined by 3.7% over the past year.
Unit sales declined even further by
4.1%.
Specialty cheeses are driving growth in the deli section accounting for 64% of deli sales with an increase
in premium and adventurous cheese choices, including Hispanic cheeses and playful cheese kit offerings
such as cheese platters or packages of paired cheeses (i.e. all French cheeses or all Hispanic cheeses) or
selection boxes with pairings such as fresh fruits, crackers, nuts, jams and other pairings. Of the top ten
deli specialty cheeses, eight have seen growth in the past year. Blended cheeses have increased by 8.6%
and parmesan by 5.5%, while two of the most popular specialty cheeses, feta and brie, saw declines of
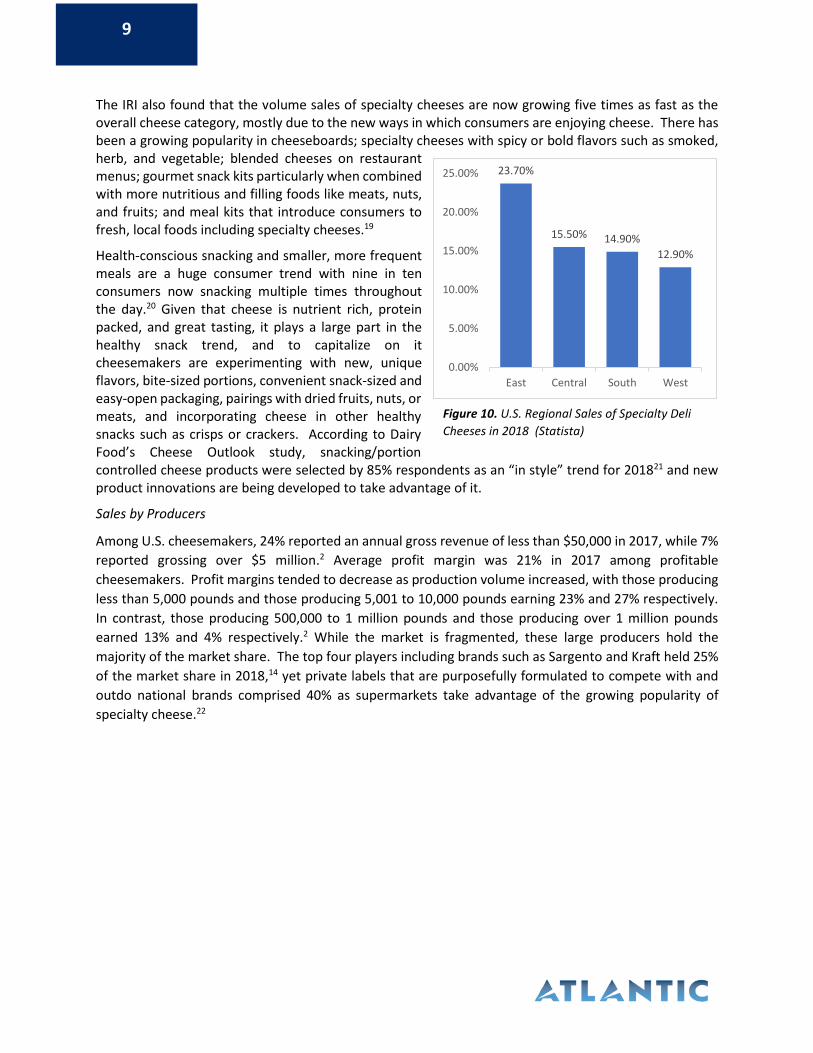
2.2% and 1.1% respectively (Figure 9). When studied geographically, the Eastern U.S. purchased the
largest share of specialty cheeses at delis during 2018 at 24%, while the Central, South and Western
regions purchased 13-15% each (Figure 10).18
Figure 9. Percent Change Among Top 10 Specialty Deli Cheeses from
2018-2019 (IRI)
-2.20%
-1.10%
0.80%
1.40%
3.00%
3.20%
3.80%
4.00%
5.50%
8.60%
Feta
Brie
Mozzarella
Gouda
Goat
Blue
Cheddar
Queso Presco
Parmesan
Blend
9
The IRI also found that the volume sales of specialty cheeses are now growing five times as fast as the overall cheese category, mostly due to the new ways in which consumers are enjoying cheese. There has been a growing popularity in cheeseboards; specialty cheeses with spicy or bold flavors such as smoked, herb, and vegetable; blended cheeses on restaurant menus; gourmet snack kits particularly when combined with more nutritious and filling foods like meats, nuts, and fruits; and meal kits that introduce consumers to fresh, local foods including specialty cheeses.19
Health-conscious snacking and smaller, more frequent meals are a huge consumer trend with nine in ten consumers now snacking multiple times throughout the day.20 Given that cheese is nutrient rich, protein packed, and great tasting, it plays a large part in the healthy snack trend, and to capitalize on it cheesemakers are experimenting with new, unique flavors, bite-sized portions, convenient snack-sized and easy-open packaging, pairings with dried fruits, nuts, or meats, and incorporating cheese in other healthy snacks such as crisps or crackers. According to Dairy Food’s Cheese Outlook study, snacking/portion controlled cheese products were selected by 85% respondents as an “in style” trend for 201821 and new product innovations are being developed to take advantage of it.
Sales by Producers
Among U.S. cheesemakers, 24% reported an annual gross revenue of less than $50,000 in 2017, while 7%
reported grossing over $5 million.2 Average profit margin was 21% in 2017 among profitable
cheesemakers. Profit margins tended to decrease as production volume increased, with those producing
less than 5,000 pounds and those producing 5,001 to 10,000 pounds earning 23% and 27% respectively.
In contrast, those producing 500,000 to 1 million pounds and those producing over 1 million pounds
earned 13% and 4% respectively.2 While the market is fragmented, these large producers hold the
majority of the market share. The top four players including brands such as Sargento and Kraft held 25%
of the market share in 2018,14 yet private labels that are purposefully formulated to compete with and
outdo national brands comprised 40% as supermarkets take advantage of the growing popularity of
specialty cheese.22
23.70%
15.50% 14.90%
12.90%
0.00%
5.00%
10.00%
15.00%
20.00%
25.00%
East Central South West
Figure 10. U.S. Regional Sales of Specialty Deli
Cheeses in 2018 (Statista)
10
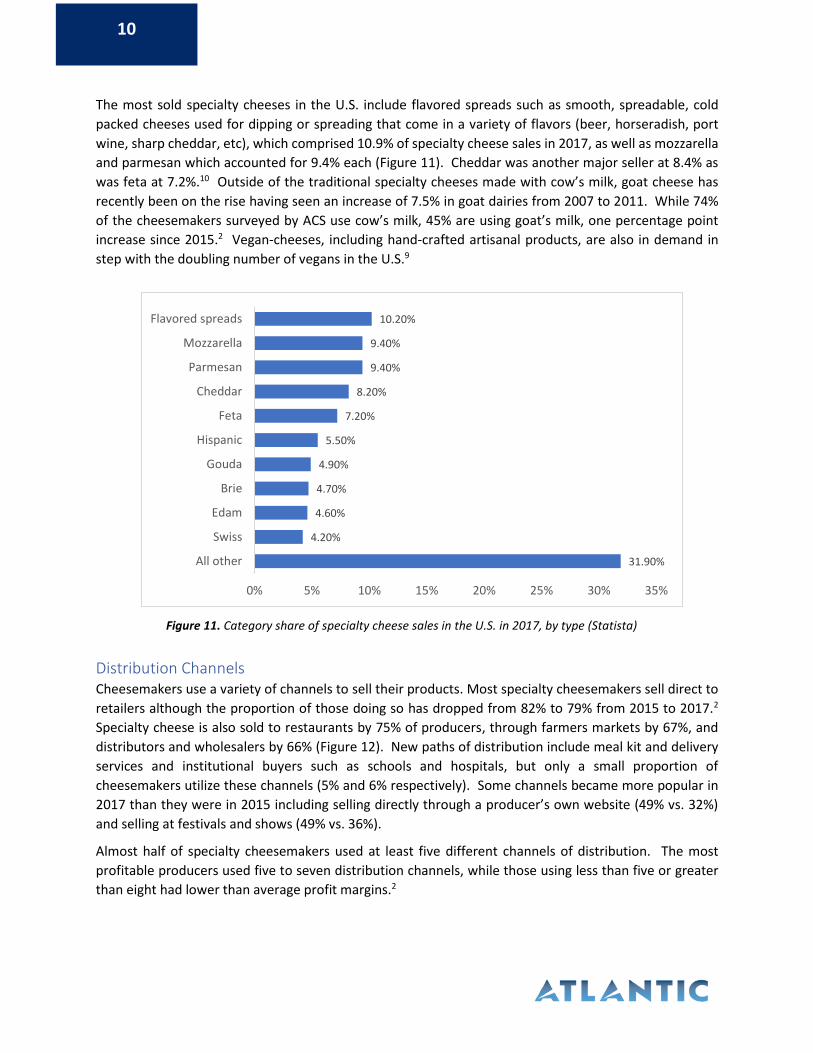
The most sold specialty cheeses in the U.S. include flavored spreads such as smooth, spreadable, cold
packed cheeses used for dipping or spreading that come in a variety of flavors (beer, horseradish, port
wine, sharp cheddar, etc), which comprised 10.9% of specialty cheese sales in 2017, as well as mozzarella
and parmesan which accounted for 9.4% each (Figure 11). Cheddar was another major seller at 8.4% as
was feta at 7.2%.10 Outside of the traditional specialty cheeses made with cow’s milk, goat cheese has
recently been on the rise having seen an increase of 7.5% in goat dairies from 2007 to 2011. While 74%
of the cheesemakers surveyed by ACS use cow’s milk, 45% are using goat’s milk, one percentage point
increase since 2015.2 Vegan-cheeses, including hand-crafted artisanal products, are also in demand in
step with the doubling number of vegans in the U.S.9
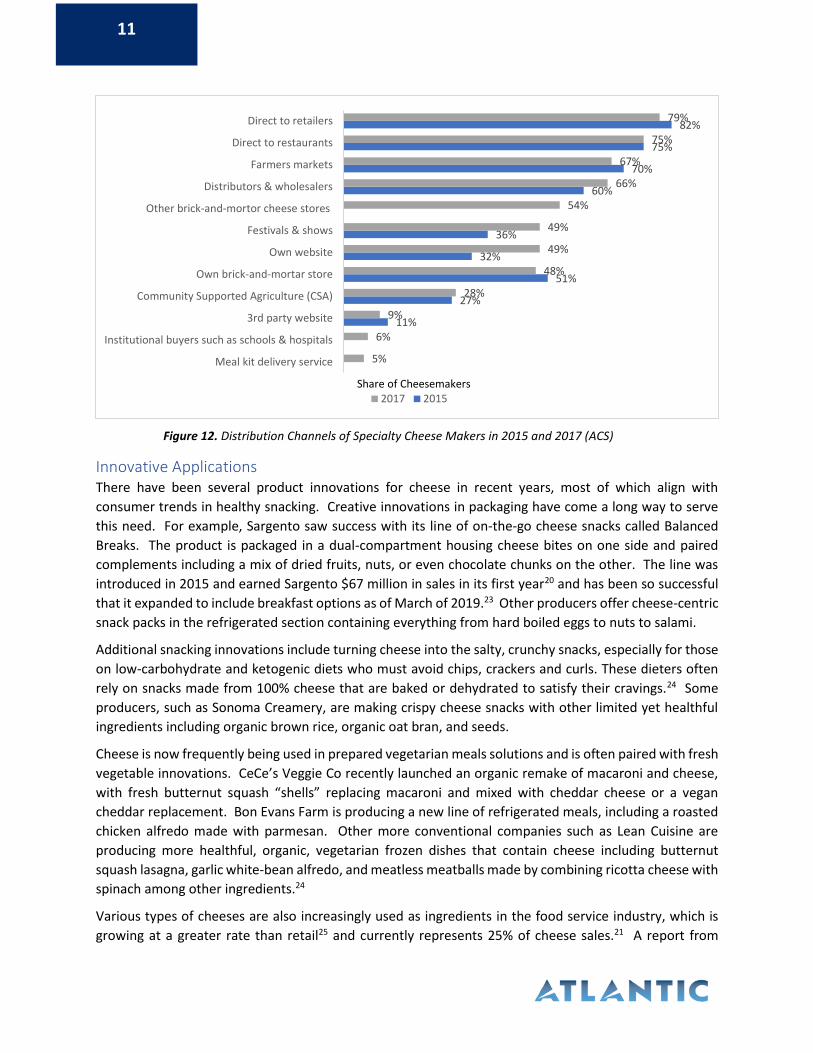
Distribution Channels Cheesemakers use a variety of channels to sell their products. Most specialty cheesemakers sell direct to
retailers although the proportion of those doing so has dropped from 82% to 79% from 2015 to 2017.2
Specialty cheese is also sold to restaurants by 75% of producers, through farmers markets by 67%, and
distributors and wholesalers by 66% (Figure 12). New paths of distribution include meal kit and delivery
services and institutional buyers such as schools and hospitals, but only a small proportion of
cheesemakers utilize these channels (5% and 6% respectively). Some channels became more popular in
2017 than they were in 2015 including selling directly through a producer’s own website (49% vs. 32%)
and selling at festivals and shows (49% vs. 36%).
Almost half of specialty cheesemakers used at least five different channels of distribution. The most
profitable producers used five to seven distribution channels, while those using less than five or greater
than eight had lower than average profit margins.2
31.90%
4.20%
4.60%
4.70%
4.90%
5.50%
7.20%
8.20%
9.40%
9.40%
10.20%
0% 5% 10% 15% 20% 25% 30% 35%
All other
Swiss
Edam
Brie
Gouda
Hispanic
Feta
Cheddar
Parmesan
Mozzarella
Flavored spreads
Figure 11. Category share of specialty cheese sales in the U.S. in 2017, by type (Statista)
11
Innovative Applications There have been several product innovations for cheese in recent years, most of which align with
consumer trends in healthy snacking. Creative innovations in packaging have come a long way to serve
this need. For example, Sargento saw success with its line of on-the-go cheese snacks called Balanced
Breaks. The product is packaged in a dual-compartment housing cheese bites on one side and paired
complements including a mix of dried fruits, nuts, or even chocolate chunks on the other. The line was
introduced in 2015 and earned Sargento $67 million in sales in its first year20 and has been so successful
that it expanded to include breakfast options as of March of 2019.23 Other producers offer cheese-centric
snack packs in the refrigerated section containing everything from hard boiled eggs to nuts to salami.
Additional snacking innovations include turning cheese into the salty, crunchy snacks, especially for those
on low-carbohydrate and ketogenic diets who must avoid chips, crackers and curls. These dieters often
rely on snacks made from 100% cheese that are baked or dehydrated to satisfy their cravings.24 Some
producers, such as Sonoma Creamery, are making crispy cheese snacks with other limited yet healthful
ingredients including organic brown rice, organic oat bran, and seeds.
Cheese is now frequently being used in prepared vegetarian meals solutions and is often paired with fresh
vegetable innovations. CeCe’s Veggie Co recently launched an organic remake of macaroni and cheese,
with fresh butternut squash “shells” replacing macaroni and mixed with cheddar cheese or a vegan
cheddar replacement. Bon Evans Farm is producing a new line of refrigerated meals, including a roasted
chicken alfredo made with parmesan. Other more conventional companies such as Lean Cuisine are
producing more healthful, organic, vegetarian frozen dishes that contain cheese including butternut
squash lasagna, garlic white-bean alfredo, and meatless meatballs made by combining ricotta cheese with
spinach among other ingredients.24
Various types of cheeses are also increasingly used as ingredients in the food service industry, which is
growing at a greater rate than retail25 and currently represents 25% of cheese sales.21 A report from
11%
27%
51%
32%
36%
60%
70%
75%
82%
5%
6%
9%
28%
48%
49%
49%
54%
66%
67%
75%
79%
Meal kit delivery service
Institutional buyers such as schools & hospitals
3rd party website
Community Supported Agriculture (CSA)
Own brick-and-mortar store
Own website
Festivals & shows
Other brick-and-mortor cheese stores
Distributors & wholesalers
Farmers markets
Direct to restaurants
Direct to retailers
2017 2015Share of Cheesemakers
Figure 12. Distribution Channels of Specialty Cheese Makers in 2015 and 2017 (ACS)
12
Market Research Future indicated a growing demand for Italian and Mexican foods, a boon for the U.S.
industry given that cheese is a major component to these cuisines. However, two different segments of
the food service industry are emerging when it comes to cheese - one focused on cost savings utilizing
processed and packaged foods to reduce prep work, and the other focused more on quality and local
status to appeal to the consumer. To further capitalize on the latter segment, cheesemakers should focus
on collaboration with restaurants and chefs to understand the cheeses they are looking for and ensure
they can supply demand without restauranteurs purchasing imported international products. According
to Marshall Reece, senior vice president of sales and marketing for Associated Milk Producers Inc.,
“[Chefs] are on the front lines serving customers and have insight into potentially successful cheese
pairings or cheese varieties that would complement emerging ethnic food trends, for example.”25
Collaboration has also been important among artisanal cheesemakers who are combining forces to
produce new, unique cheeses. For example, Wisconsin’s Red Barn Family Farms recently partnered with
Master Cheesemaker Jon Metzig from Willow Creek Creamery on a new washed-rind alpine-style cheese
called Le Rouge. Another product born of a recent collaboration is the juniper berry blue cheese, the
brain child of Carr Valley Cheese Co and the Artisan Cheese Exchange, which also partnered with Henning
Wisconsin Cheese to create The Stag, an aged cheddar and best in class winner of the 2017 American
Cheese Society competition.26
Although many of the trends and innovations described here are being set by large, conventional
cheesemakers, they can be extended to small, specialty producers as well. As noted in the B2B survey we
conducted, several specialty cheesemakers already sell additional goods to supplement income including
fruits and other snacks. With innovative packaging, these products can be combined with their cheeses
to further improve sales. Specialty cheesemakers can also partner with other local producers and
combine ingredients to make snacks or even prepared meal solutions like CeCe’s butternut squash shells.
Lastly, they can reach out to area restaurants to gage their interest in quality, local products and try to
tailor their product lines to one of the fastest growing categories of cheese sales.
Consumer Insights Survey To best understand domestic consumer attitudes and preferences about specialty cheese, Atlantic
partnered with Portland Research Group to conduct a survey assessing cheese preferences and purchase
behavior among consumers in five target states. Specific learning objectives include: 1) measuring
awareness and knowledge of dairy farms, dairy processing (milk and cheese) and local availability of local
cheese products; 2) determining cheese purchase expenditures and types of retailers used for cheese
purchases; 3) understanding preferences for different types of cheese, like specialty versus conventional
cheese and cheese type based on firmness and presence of mold; 4) gauging preferences for cheese
packaging; and 5) a high level assessment of cheese shopping habits.
Methodology Utilizing a nation-wide online panel, 750 respondents from five northeast states (Connecticut,
Massachusetts, New Jersey, New York, and Vermont) were randomly selected to participate in the survey.
An equal distribution of 150 respondents from each state were targeted and ultimately completed the
survey. Given the sample size of 750, a maximum sampling error of +/- 3.6 percentage points was
obtained at the 95% confidence level. That is, if the reported percentage is 50%, one can be 95% confident
that the percentage for the entire population would fall within the range of 46.4% and 53.6%.
13
Respondent criteria included those 25 years of age or older who are involved in food shopping for their
household and whose household consumes cheese at least once per month. The assessment was
administered online via a web survey tool from May 23 to June 12, 2019. There were 42 survey questions
in total, including screeners to qualify respondents. The remaining questions covered the following topics:
▪ Role in household consumption of dairy products
▪ Awareness of local dairy operations and knowledge of milk and cheese processing
▪ Monthly and/or yearly expenditures on food, cheese and specialty cheese and seasonal
purchasing habits
▪ Cheese preferences
▪ Perceptions of locally available specialty cheese types with respect to overall quality, taste,
appearance, and nutritional value
▪ Willingness to spend more for specific characteristics of cheese
▪ Cheese packaging preferences
▪ Interest in knowing geographic origin of cheese
▪ Familiarity with dairy farms that produce cheese
▪ Cheese sampling habits and tendency to seek more information, and
▪ Consumer demographics
Findings Participants were split between three age groups, with 229 (30.5%) ages 25-44, 268 (35.7%) ages 45-64,
and 253 (33.7%) age 65 or greater. Respondents were more likely to be in the $35k-$100k income bracket
(41.5%) than the <$35k bracket (21.6%) or the >$100k bracket (27.9%), and respondents were most likely
to live in households without children (78.8%) and be female (69.5%).
Knowledge of Local Availability and Dairy Operations
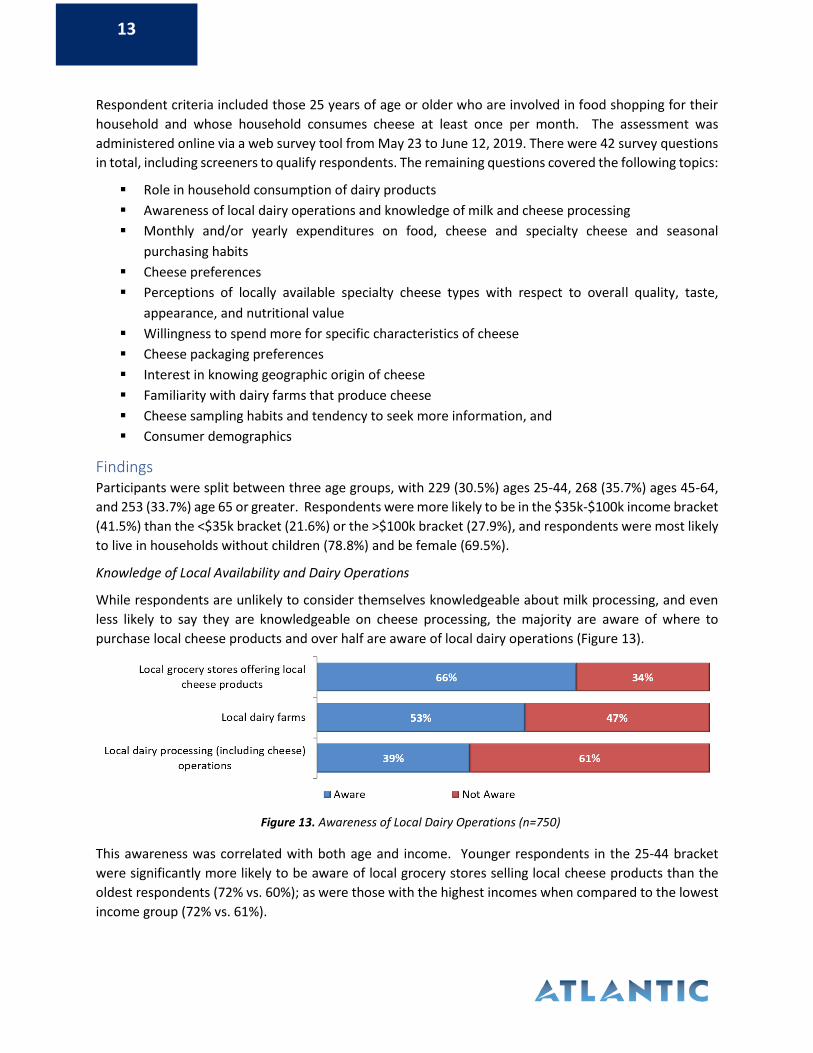
While respondents are unlikely to consider themselves knowledgeable about milk processing, and even
less likely to say they are knowledgeable on cheese processing, the majority are aware of where to
purchase local cheese products and over half are aware of local dairy operations (Figure 13).
This awareness was correlated with both age and income. Younger respondents in the 25-44 bracket
were significantly more likely to be aware of local grocery stores selling local cheese products than the
oldest respondents (72% vs. 60%); as were those with the highest incomes when compared to the lowest
income group (72% vs. 61%).
Figure 13. Awareness of Local Dairy Operations (n=750)
14
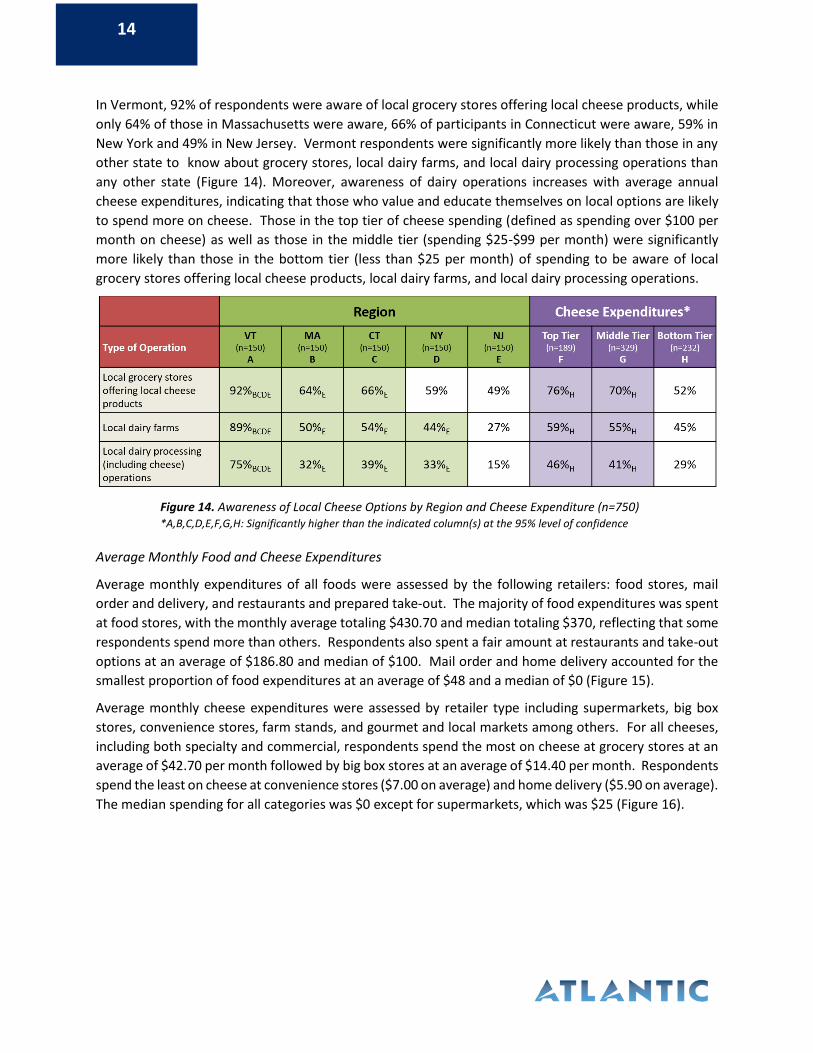
In Vermont, 92% of respondents were aware of local grocery stores offering local cheese products, while
only 64% of those in Massachusetts were aware, 66% of participants in Connecticut were aware, 59% in
New York and 49% in New Jersey. Vermont respondents were significantly more likely than those in any
other state to know about grocery stores, local dairy farms, and local dairy processing operations than
any other state (Figure 14). Moreover, awareness of dairy operations increases with average annual
cheese expenditures, indicating that those who value and educate themselves on local options are likely
to spend more on cheese. Those in the top tier of cheese spending (defined as spending over $100 per
month on cheese) as well as those in the middle tier (spending $25-$99 per month) were significantly
more likely than those in the bottom tier (less than $25 per month) of spending to be aware of local
grocery stores offering local cheese products, local dairy farms, and local dairy processing operations.
Average Monthly Food and Cheese Expenditures
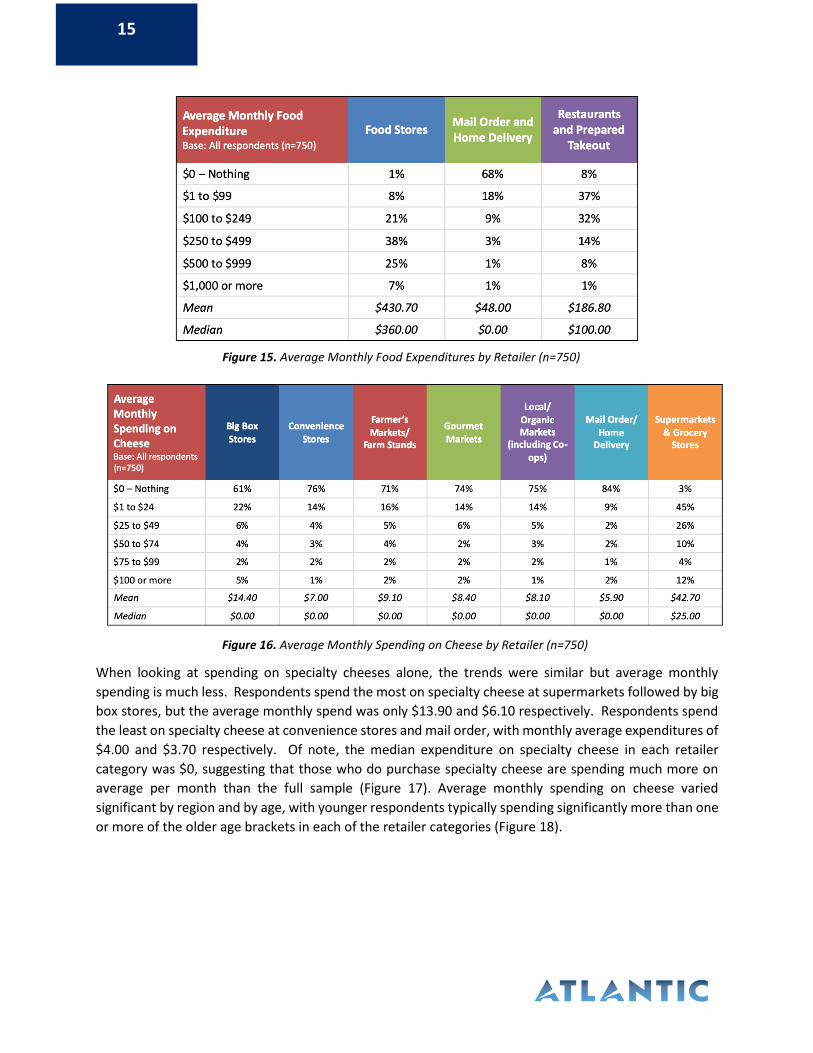
Average monthly expenditures of all foods were assessed by the following retailers: food stores, mail
order and delivery, and restaurants and prepared take-out. The majority of food expenditures was spent
at food stores, with the monthly average totaling $430.70 and median totaling $370, reflecting that some
respondents spend more than others. Respondents also spent a fair amount at restaurants and take-out
options at an average of $186.80 and median of $100. Mail order and home delivery accounted for the
smallest proportion of food expenditures at an average of $48 and a median of $0 (Figure 15).
Average monthly cheese expenditures were assessed by retailer type including supermarkets, big box
stores, convenience stores, farm stands, and gourmet and local markets among others. For all cheeses,
including both specialty and commercial, respondents spend the most on cheese at grocery stores at an
average of $42.70 per month followed by big box stores at an average of $14.40 per month. Respondents
spend the least on cheese at convenience stores ($7.00 on average) and home delivery ($5.90 on average).
The median spending for all categories was $0 except for supermarkets, which was $25 (Figure 16).
Figure 14. Awareness of Local Cheese Options by Region and Cheese Expenditure (n=750) *A,B,C,D,E,F,G,H: Significantly higher than the indicated column(s) at the 95% level of confidence
15
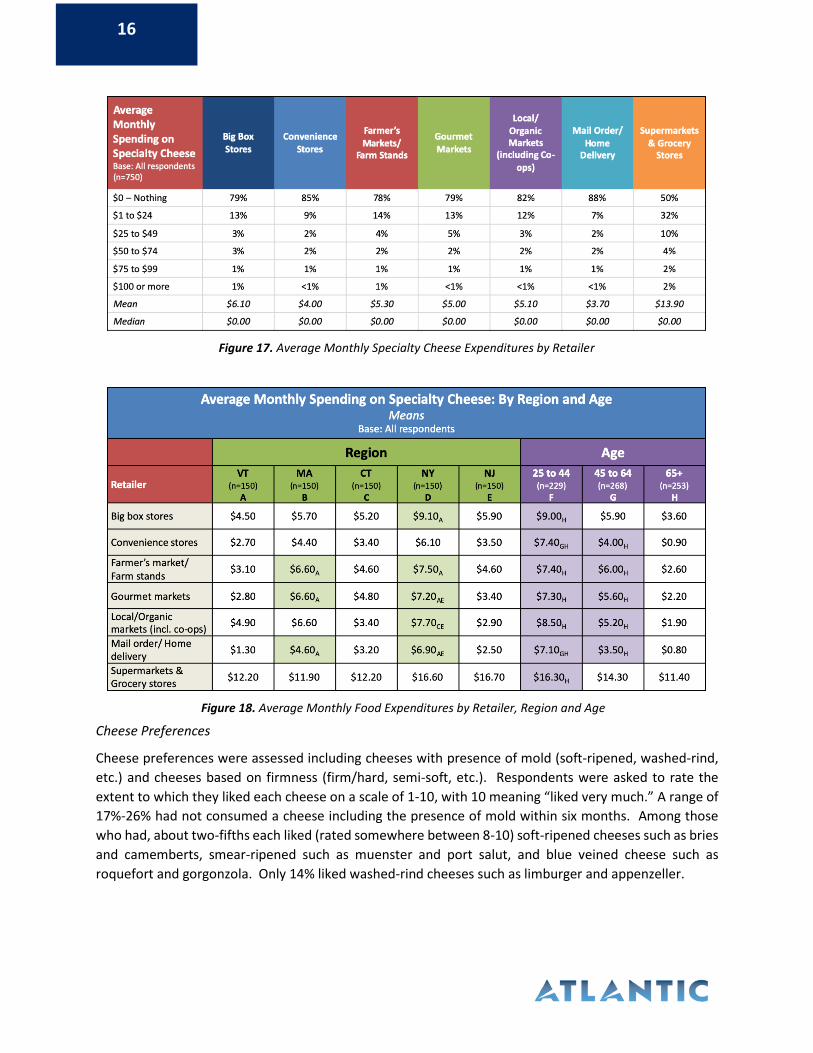
When looking at spending on specialty cheeses alone, the trends were similar but average monthly
spending is much less. Respondents spend the most on specialty cheese at supermarkets followed by big
box stores, but the average monthly spend was only $13.90 and $6.10 respectively. Respondents spend
the least on specialty cheese at convenience stores and mail order, with monthly average expenditures of
$4.00 and $3.70 respectively. Of note, the median expenditure on specialty cheese in each retailer
category was $0, suggesting that those who do purchase specialty cheese are spending much more on
average per month than the full sample (Figure 17). Average monthly spending on cheese varied
significant by region and by age, with younger respondents typically spending significantly more than one
or more of the older age brackets in each of the retailer categories (Figure 18).
Figure 15. Average Monthly Food Expenditures by Retailer (n=750)
Figure 16. Average Monthly Spending on Cheese by Retailer (n=750)
16
Cheese Preferences
Cheese preferences were assessed including cheeses with presence of mold (soft-ripened, washed-rind,
etc.) and cheeses based on firmness (firm/hard, semi-soft, etc.). Respondents were asked to rate the
extent to which they liked each cheese on a scale of 1-10, with 10 meaning “liked very much.” A range of
17%-26% had not consumed a cheese including the presence of mold within six months. Among those
who had, about two-fifths each liked (rated somewhere between 8-10) soft-ripened cheeses such as bries
and camemberts, smear-ripened such as muenster and port salut, and blue veined cheese such as
roquefort and gorgonzola. Only 14% liked washed-rind cheeses such as limburger and appenzeller.
Figure 17. Average Monthly Specialty Cheese Expenditures by Retailer
(n=750)
Figure 18. Average Monthly Food Expenditures by Retailer, Region and Age
(n=750)
17
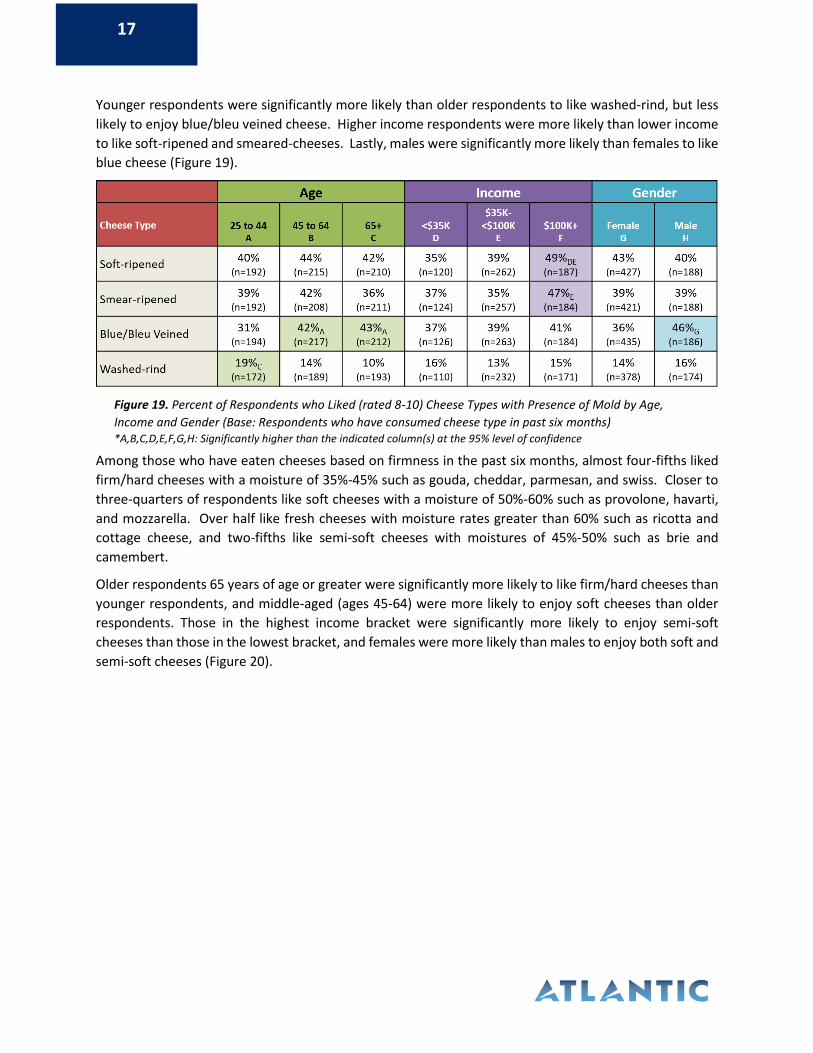
Younger respondents were significantly more likely than older respondents to like washed-rind, but less
likely to enjoy blue/bleu veined cheese. Higher income respondents were more likely than lower income
to like soft-ripened and smeared-cheeses. Lastly, males were significantly more likely than females to like
blue cheese (Figure 19).
Among those who have eaten cheeses based on firmness in the past six months, almost four-fifths liked
firm/hard cheeses with a moisture of 35%-45% such as gouda, cheddar, parmesan, and swiss. Closer to
three-quarters of respondents like soft cheeses with a moisture of 50%-60% such as provolone, havarti,
and mozzarella. Over half like fresh cheeses with moisture rates greater than 60% such as ricotta and
cottage cheese, and two-fifths like semi-soft cheeses with moistures of 45%-50% such as brie and
camembert.
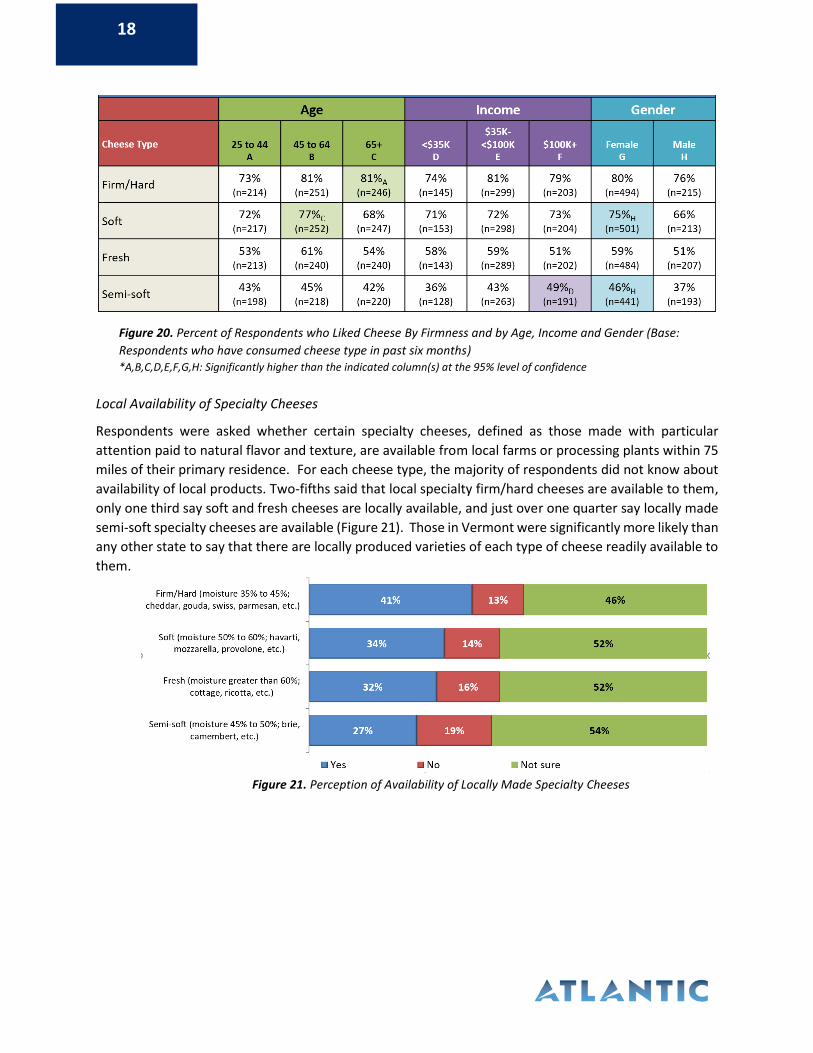
Older respondents 65 years of age or greater were significantly more likely to like firm/hard cheeses than
younger respondents, and middle-aged (ages 45-64) were more likely to enjoy soft cheeses than older
respondents. Those in the highest income bracket were significantly more likely to enjoy semi-soft
cheeses than those in the lowest bracket, and females were more likely than males to enjoy both soft and
semi-soft cheeses (Figure 20).
Figure 19. Percent of Respondents who Liked (rated 8-10) Cheese Types with Presence of Mold by Age,
Income and Gender (Base: Respondents who have consumed cheese type in past six months) *A,B,C,D,E,F,G,H: Significantly higher than the indicated column(s) at the 95% level of confidence
18
Local Availability of Specialty Cheeses
Respondents were asked whether certain specialty cheeses, defined as those made with particular
attention paid to natural flavor and texture, are available from local farms or processing plants within 75
miles of their primary residence. For each cheese type, the majority of respondents did not know about
availability of local products. Two-fifths said that local specialty firm/hard cheeses are available to them,
only one third say soft and fresh cheeses are locally available, and just over one quarter say locally made
semi-soft specialty cheeses are available (Figure 21). Those in Vermont were significantly more likely than
any other state to say that there are locally produced varieties of each type of cheese readily available to
them.
Figure 20. Percent of Respondents who Liked Cheese By Firmness and by Age, Income and Gender (Base:
Respondents who have consumed cheese type in past six months) *A,B,C,D,E,F,G,H: Significantly higher than the indicated column(s) at the 95% level of confidence
Figure 21. Perception of Availability of Locally Made Specialty Cheeses
19
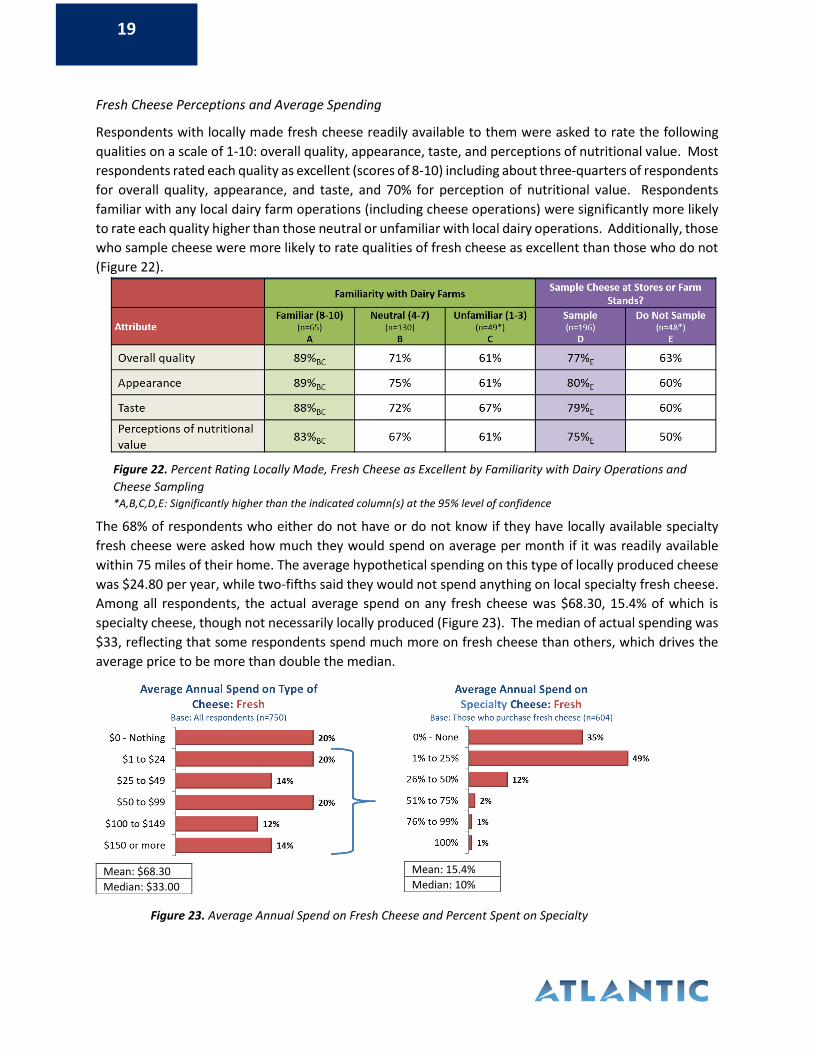
Fresh Cheese Perceptions and Average Spending
Respondents with locally made fresh cheese readily available to them were asked to rate the following
qualities on a scale of 1-10: overall quality, appearance, taste, and perceptions of nutritional value. Most
respondents rated each quality as excellent (scores of 8-10) including about three-quarters of respondents
for overall quality, appearance, and taste, and 70% for perception of nutritional value. Respondents
familiar with any local dairy farm operations (including cheese operations) were significantly more likely
to rate each quality higher than those neutral or unfamiliar with local dairy operations. Additionally, those
who sample cheese were more likely to rate qualities of fresh cheese as excellent than those who do not
(Figure 22).
The 68% of respondents who either do not have or do not know if they have locally available specialty
fresh cheese were asked how much they would spend on average per month if it was readily available
within 75 miles of their home. The average hypothetical spending on this type of locally produced cheese
was $24.80 per year, while two-fifths said they would not spend anything on local specialty fresh cheese.
Among all respondents, the actual average spend on any fresh cheese was $68.30, 15.4% of which is
specialty cheese, though not necessarily locally produced (Figure 23). The median of actual spending was
$33, reflecting that some respondents spend much more on fresh cheese than others, which drives the
average price to be more than double the median.
Mean: $68.30
Median: $33.00
Mean: 15.4%
Median: 10%
Figure 23. Average Annual Spend on Fresh Cheese and Percent Spent on Specialty
Figure 22. Percent Rating Locally Made, Fresh Cheese as Excellent by Familiarity with Dairy Operations and
Cheese Sampling *A,B,C,D,E: Significantly higher than the indicated column(s) at the 95% level of confidence
20
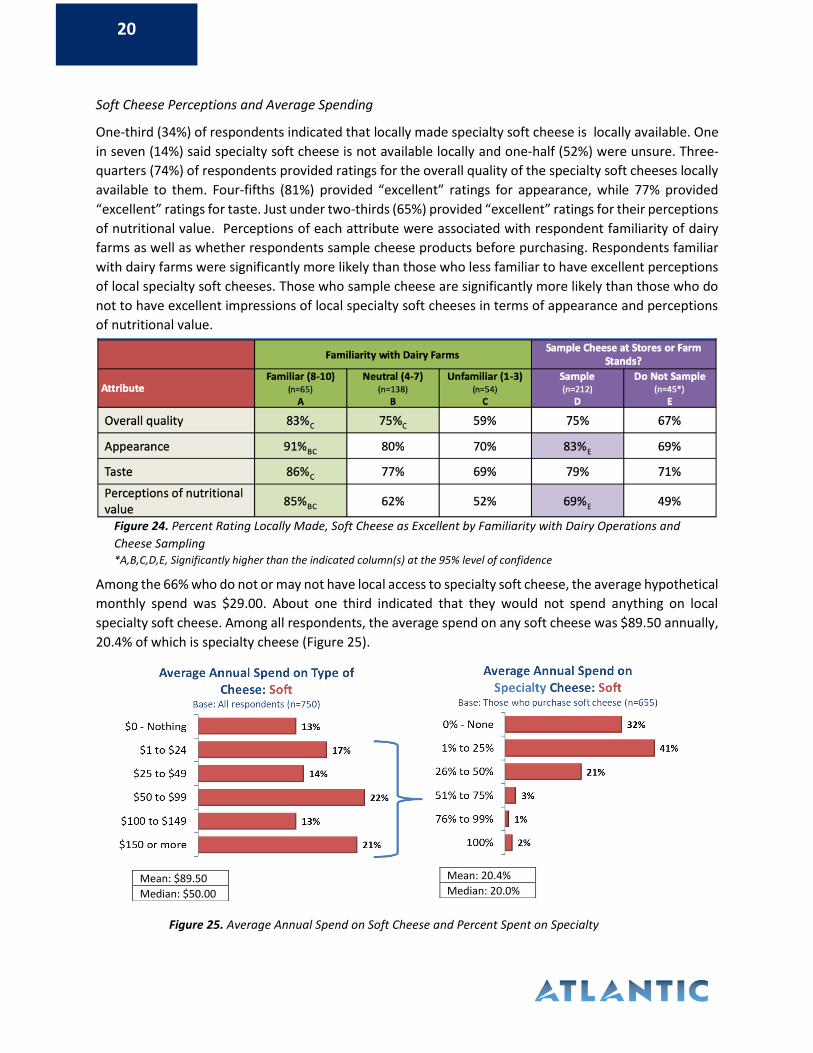
Soft Cheese Perceptions and Average Spending
One-third (34%) of respondents indicated that locally made specialty soft cheese is locally available. One
in seven (14%) said specialty soft cheese is not available locally and one-half (52%) were unsure. Three-
quarters (74%) of respondents provided ratings for the overall quality of the specialty soft cheeses locally
available to them. Four-fifths (81%) provided “excellent” ratings for appearance, while 77% provided
“excellent” ratings for taste. Just under two-thirds (65%) provided “excellent” ratings for their perceptions
of nutritional value. Perceptions of each attribute were associated with respondent familiarity of dairy
farms as well as whether respondents sample cheese products before purchasing. Respondents familiar
with dairy farms were significantly more likely than those who less familiar to have excellent perceptions
of local specialty soft cheeses. Those who sample cheese are significantly more likely than those who do
not to have excellent impressions of local specialty soft cheeses in terms of appearance and perceptions
of nutritional value.
Among the 66% who do not or may not have local access to specialty soft cheese, the average hypothetical
monthly spend was $29.00. About one third indicated that they would not spend anything on local
specialty soft cheese. Among all respondents, the average spend on any soft cheese was $89.50 annually,
20.4% of which is specialty cheese (Figure 25).
Mean: $89.50
Median: $50.00
Mean: 20.4%
Median: 20.0%
Figure 25. Average Annual Spend on Soft Cheese and Percent Spent on Specialty
Figure 24. Percent Rating Locally Made, Soft Cheese as Excellent by Familiarity with Dairy Operations and
Cheese Sampling *A,B,C,D,E, Significantly higher than the indicated column(s) at the 95% level of confidence
21
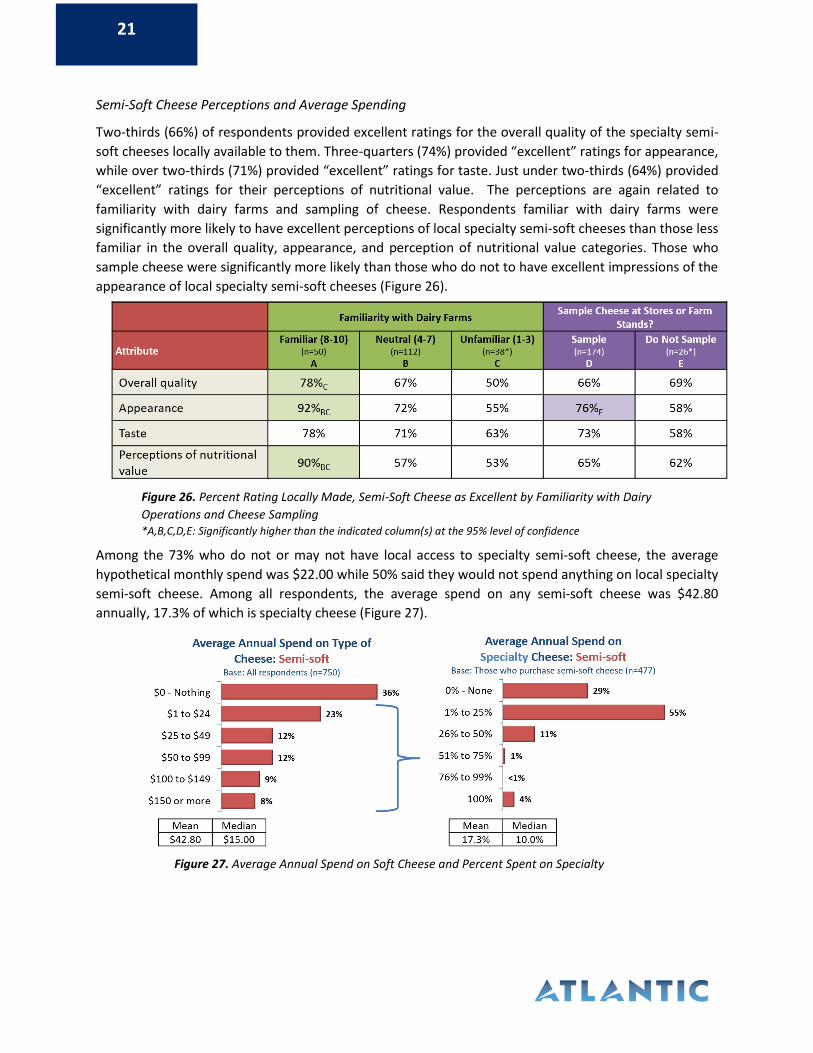
Semi-Soft Cheese Perceptions and Average Spending
Two-thirds (66%) of respondents provided excellent ratings for the overall quality of the specialty semi-
soft cheeses locally available to them. Three-quarters (74%) provided “excellent” ratings for appearance,
while over two-thirds (71%) provided “excellent” ratings for taste. Just under two-thirds (64%) provided
“excellent” ratings for their perceptions of nutritional value. The perceptions are again related to
familiarity with dairy farms and sampling of cheese. Respondents familiar with dairy farms were
significantly more likely to have excellent perceptions of local specialty semi-soft cheeses than those less
familiar in the overall quality, appearance, and perception of nutritional value categories. Those who
sample cheese were significantly more likely than those who do not to have excellent impressions of the
appearance of local specialty semi-soft cheeses (Figure 26).
Among the 73% who do not or may not have local access to specialty semi-soft cheese, the average
hypothetical monthly spend was $22.00 while 50% said they would not spend anything on local specialty
semi-soft cheese. Among all respondents, the average spend on any semi-soft cheese was $42.80
annually, 17.3% of which is specialty cheese (Figure 27).
Figure 26. Percent Rating Locally Made, Semi-Soft Cheese as Excellent by Familiarity with Dairy
Operations and Cheese Sampling *A,B,C,D,E: Significantly higher than the indicated column(s) at the 95% level of confidence
Figure 27. Average Annual Spend on Soft Cheese and Percent Spent on Specialty
22
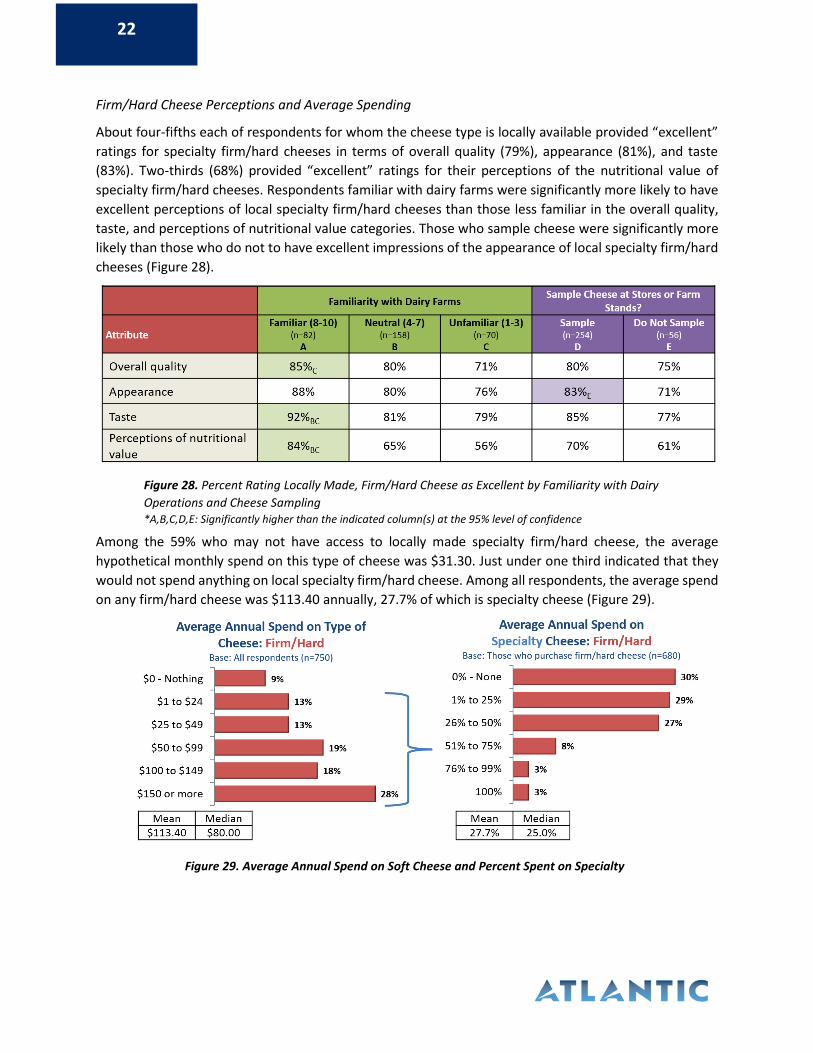
Firm/Hard Cheese Perceptions and Average Spending
About four-fifths each of respondents for whom the cheese type is locally available provided “excellent”
ratings for specialty firm/hard cheeses in terms of overall quality (79%), appearance (81%), and taste
(83%). Two-thirds (68%) provided “excellent” ratings for their perceptions of the nutritional value of
specialty firm/hard cheeses. Respondents familiar with dairy farms were significantly more likely to have
excellent perceptions of local specialty firm/hard cheeses than those less familiar in the overall quality,
taste, and perceptions of nutritional value categories. Those who sample cheese were significantly more
likely than those who do not to have excellent impressions of the appearance of local specialty firm/hard
cheeses (Figure 28).
Among the 59% who may not have access to locally made specialty firm/hard cheese, the average
hypothetical monthly spend on this type of cheese was $31.30. Just under one third indicated that they
would not spend anything on local specialty firm/hard cheese. Among all respondents, the average spend
on any firm/hard cheese was $113.40 annually, 27.7% of which is specialty cheese (Figure 29).
Figure 28. Percent Rating Locally Made, Firm/Hard Cheese as Excellent by Familiarity with Dairy
Operations and Cheese Sampling *A,B,C,D,E: Significantly higher than the indicated column(s) at the 95% level of confidence
Figure 29. Average Annual Spend on Soft Cheese and Percent Spent on Specialty
23
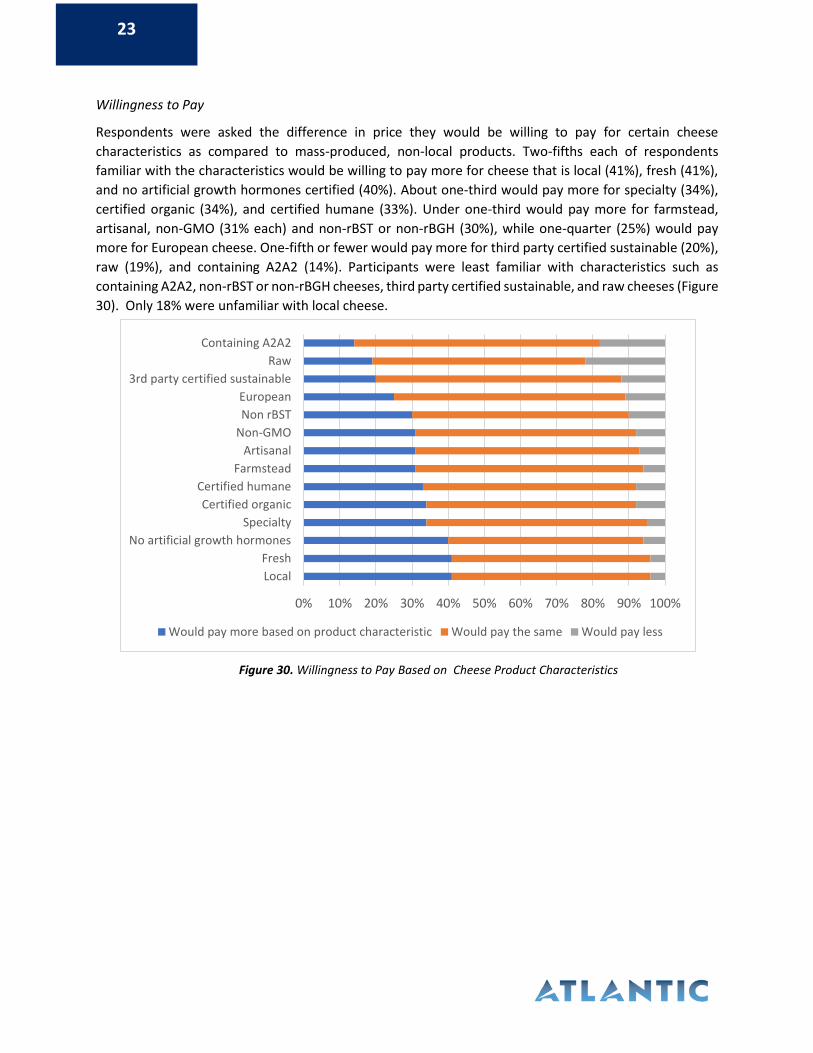
Willingness to Pay
Respondents were asked the difference in price they would be willing to pay for certain cheese
characteristics as compared to mass-produced, non-local products. Two-fifths each of respondents
familiar with the characteristics would be willing to pay more for cheese that is local (41%), fresh (41%),
and no artificial growth hormones certified (40%). About one-third would pay more for specialty (34%),
certified organic (34%), and certified humane (33%). Under one-third would pay more for farmstead,
artisanal, non-GMO (31% each) and non-rBST or non-rBGH (30%), while one-quarter (25%) would pay
more for European cheese. One-fifth or fewer would pay more for third party certified sustainable (20%),
raw (19%), and containing A2A2 (14%). Participants were least familiar with characteristics such as
containing A2A2, non-rBST or non-rBGH cheeses, third party certified sustainable, and raw cheeses (Figure
30). Only 18% were unfamiliar with local cheese.
Figure 30. Willingness to Pay Based on Cheese Product Characteristics
0% 10% 20% 30% 40% 50% 60% 70% 80% 90% 100%
Local
Fresh
No artificial growth hormones
Specialty
Certified organic
Certified humane
Farmstead
Artisanal
Non-GMO
Non rBST
European
3rd party certified sustainable
Raw
Containing A2A2
Would pay more based on product characteristic Would pay the same Would pay less
24
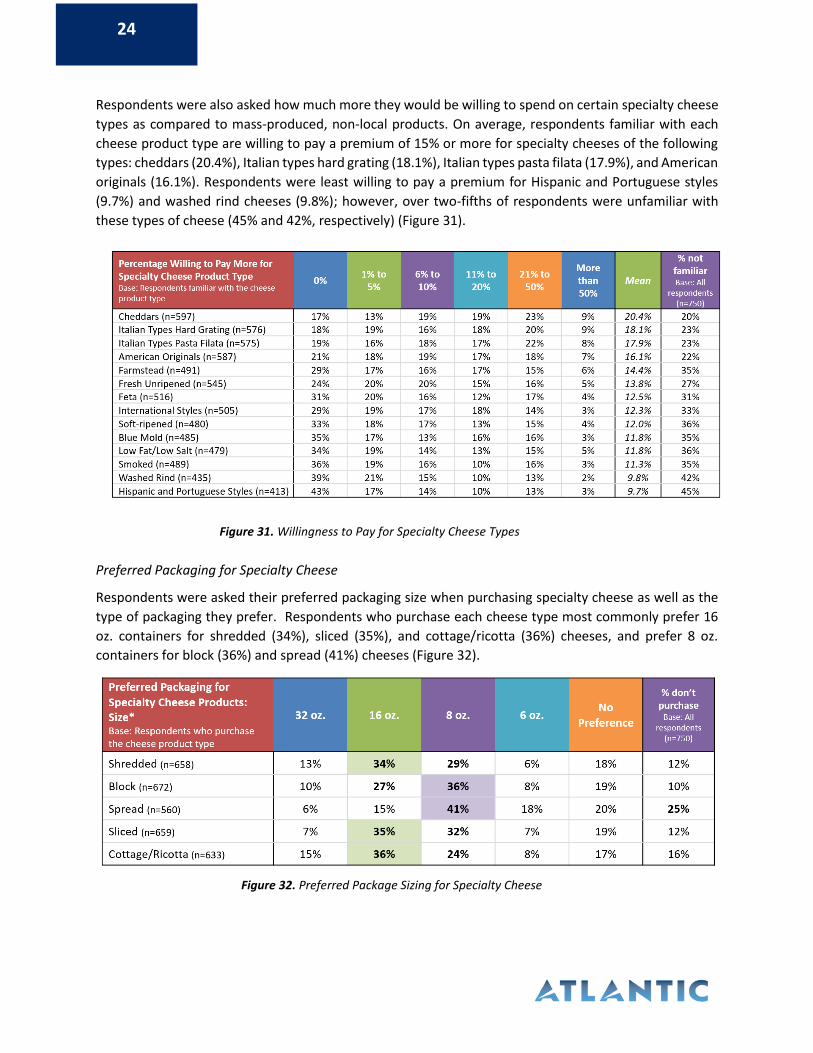
Respondents were also asked how much more they would be willing to spend on certain specialty cheese
types as compared to mass-produced, non-local products. On average, respondents familiar with each
cheese product type are willing to pay a premium of 15% or more for specialty cheeses of the following
types: cheddars (20.4%), Italian types hard grating (18.1%), Italian types pasta filata (17.9%), and American
originals (16.1%). Respondents were least willing to pay a premium for Hispanic and Portuguese styles
(9.7%) and washed rind cheeses (9.8%); however, over two-fifths of respondents were unfamiliar with
these types of cheese (45% and 42%, respectively) (Figure 31).
Preferred Packaging for Specialty Cheese
Respondents were asked their preferred packaging size when purchasing specialty cheese as well as the
type of packaging they prefer. Respondents who purchase each cheese type most commonly prefer 16
oz. containers for shredded (34%), sliced (35%), and cottage/ricotta (36%) cheeses, and prefer 8 oz.
containers for block (36%) and spread (41%) cheeses (Figure 32).
Figure 31. Willingness to Pay for Specialty Cheese Type
Figure 32. Preferred Package Sizing for Specialty Cheese
Figure 31. Willingness to Pay for Specialty Cheese Types
25
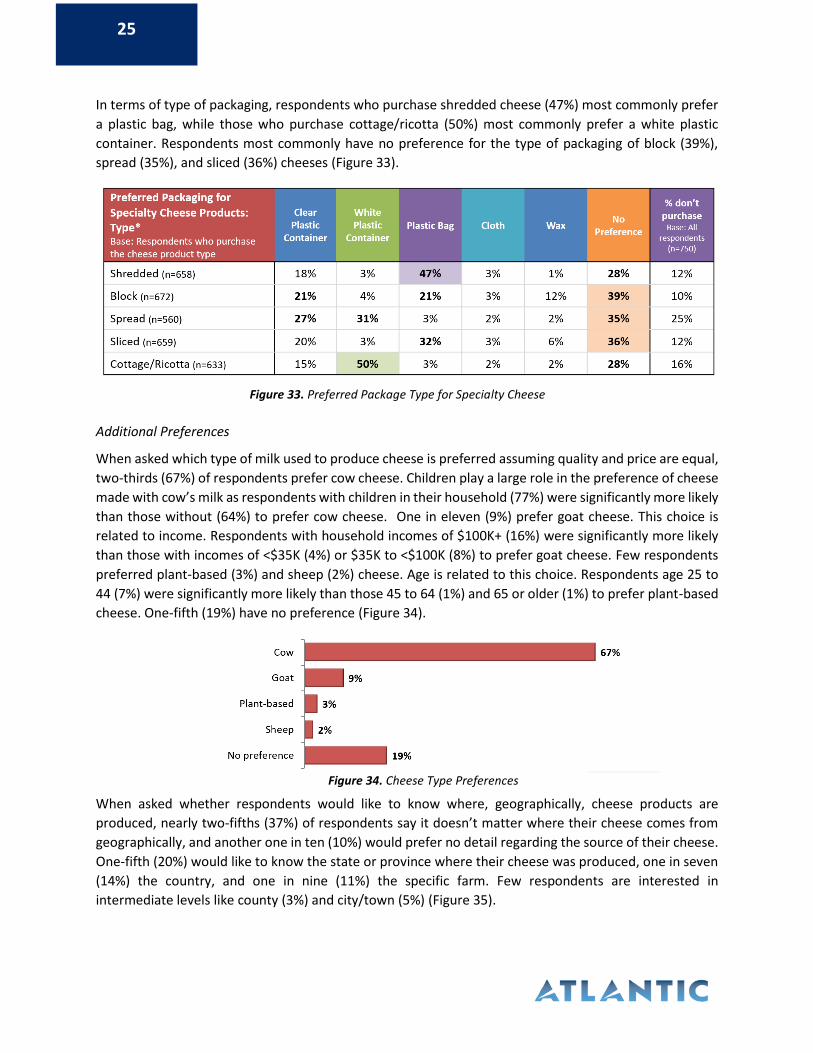
In terms of type of packaging, respondents who purchase shredded cheese (47%) most commonly prefer
a plastic bag, while those who purchase cottage/ricotta (50%) most commonly prefer a white plastic
container. Respondents most commonly have no preference for the type of packaging of block (39%),
spread (35%), and sliced (36%) cheeses (Figure 33).
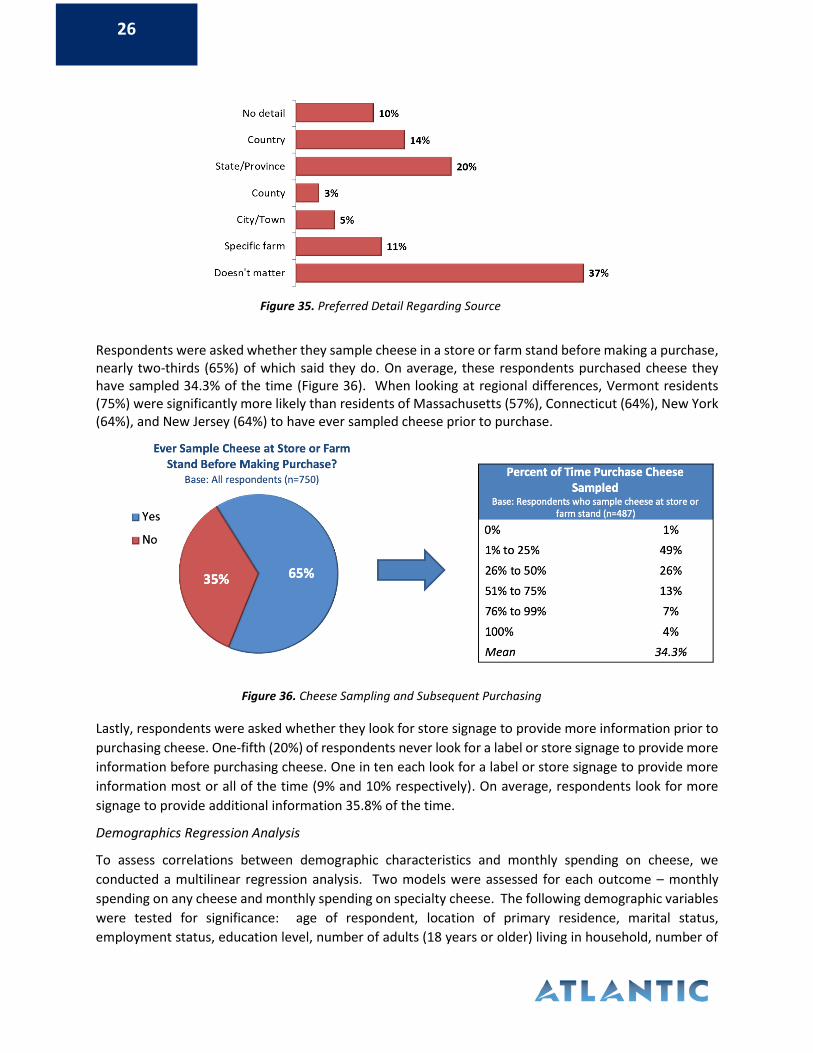
Additional Preferences
When asked which type of milk used to produce cheese is preferred assuming quality and price are equal,
two-thirds (67%) of respondents prefer cow cheese. Children play a large role in the preference of cheese
made with cow’s milk as respondents with children in their household (77%) were significantly more likely
than those without (64%) to prefer cow cheese. One in eleven (9%) prefer goat cheese. This choice is
related to income. Respondents with household incomes of $100K+ (16%) were significantly more likely
than those with incomes of <$35K (4%) or $35K to <$100K (8%) to prefer goat cheese. Few respondents
preferred plant-based (3%) and sheep (2%) cheese. Age is related to this choice. Respondents age 25 to
44 (7%) were significantly more likely than those 45 to 64 (1%) and 65 or older (1%) to prefer plant-based
cheese. One-fifth (19%) have no preference (Figure 34).
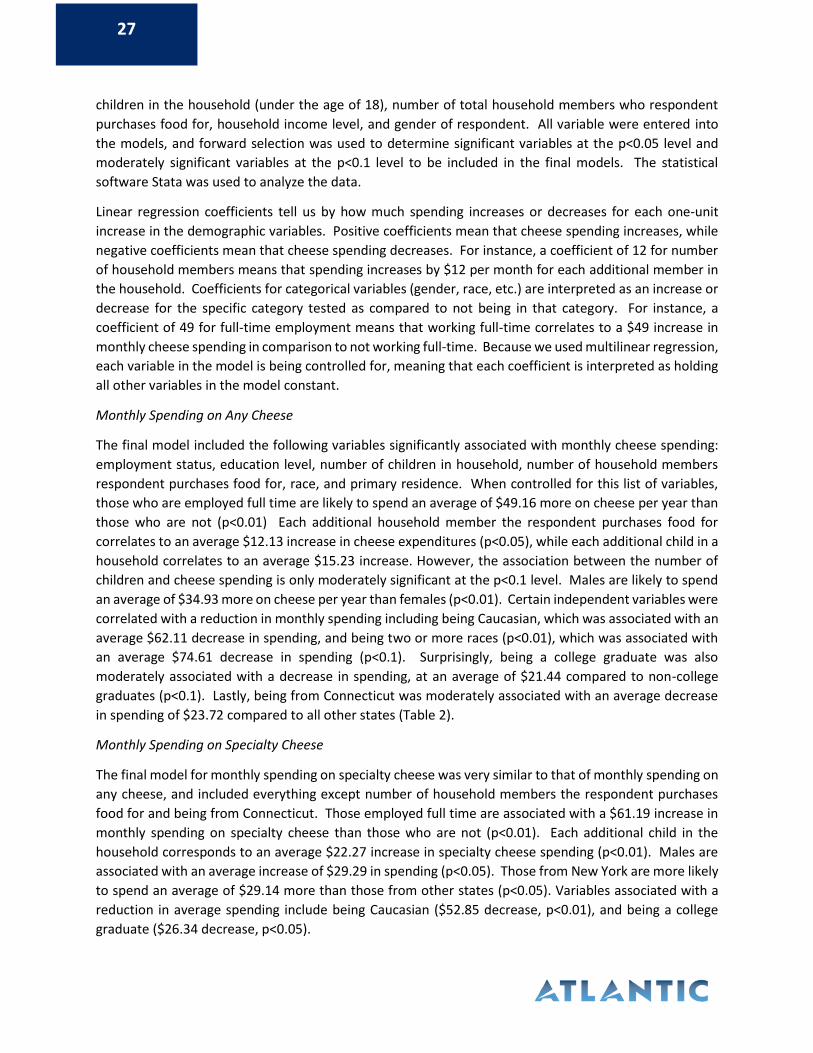
When asked whether respondents would like to know where, geographically, cheese products are
produced, nearly two-fifths (37%) of respondents say it doesn’t matter where their cheese comes from
geographically, and another one in ten (10%) would prefer no detail regarding the source of their cheese.
One-fifth (20%) would like to know the state or province where their cheese was produced, one in seven
(14%) the country, and one in nine (11%) the specific farm. Few respondents are interested in
intermediate levels like county (3%) and city/town (5%) (Figure 35).
Figure 33. Preferred Package Type for Specialty Cheese
Figure 34. Cheese Type Preferences
26
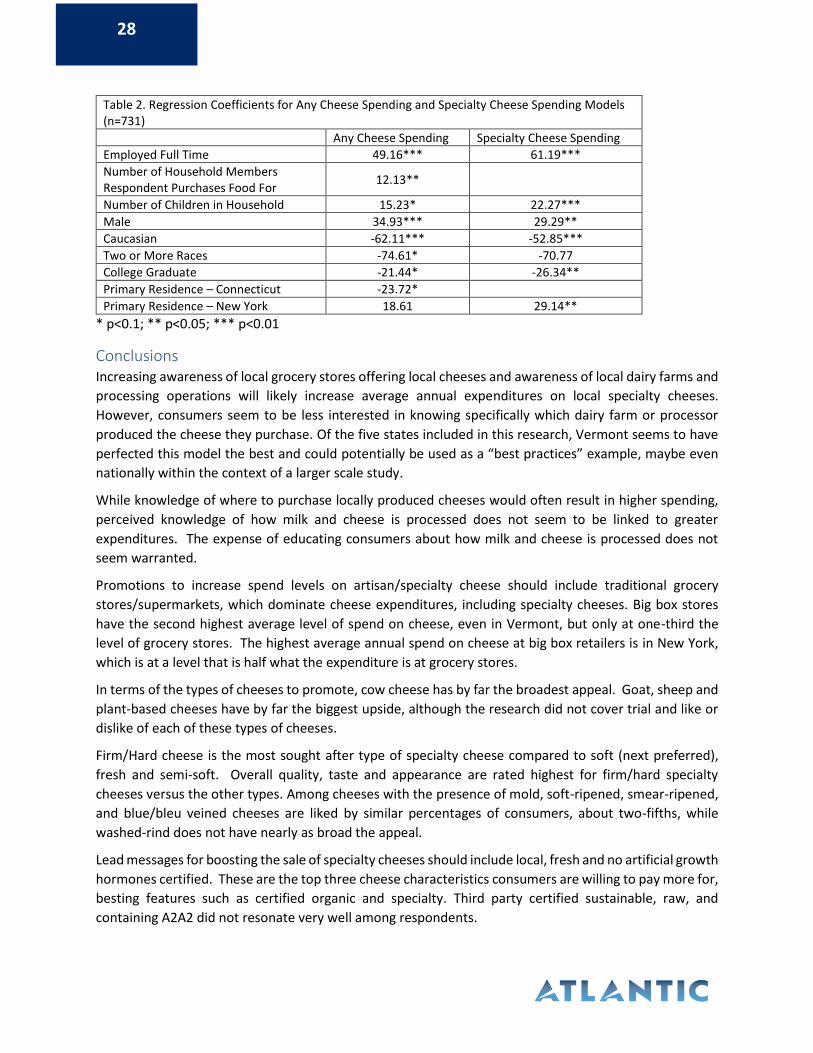
Respondents were asked whether they sample cheese in a store or farm stand before making a purchase, nearly two-thirds (65%) of which said they do. On average, these respondents purchased cheese they have sampled 34.3% of the time (Figure 36). When looking at regional differences, Vermont residents (75%) were significantly more likely than residents of Massachusetts (57%), Connecticut (64%), New York (64%), and New Jersey (64%) to have ever sampled cheese prior to purchase.
Lastly, respondents were asked whether they look for store signage to provide more information prior to
purchasing cheese. One-fifth (20%) of respondents never look for a label or store signage to provide more
information before purchasing cheese. One in ten each look for a label or store signage to provide more
information most or all of the time (9% and 10% respectively). On average, respondents look for more
signage to provide additional information 35.8% of the time.
Demographics Regression Analysis
To assess correlations between demographic characteristics and monthly spending on cheese, we
conducted a multilinear regression analysis. Two models were assessed for each outcome – monthly
spending on any cheese and monthly spending on specialty cheese. The following demographic variables
were tested for significance: age of respondent, location of primary residence, marital status,
employment status, education level, number of adults (18 years or older) living in household, number of
Figure 35. Preferred Detail Regarding Source
Figure 36. Cheese Sampling and Subsequent Purchasing
27
children in the household (under the age of 18), number of total household members who respondent
purchases food for, household income level, and gender of respondent. All variable were entered into
the models, and forward selection was used to determine significant variables at the p<0.05 level and
moderately significant variables at the p<0.1 level to be included in the final models. The statistical
software Stata was used to analyze the data.
Linear regression coefficients tell us by how much spending increases or decreases for each one-unit
increase in the demographic variables. Positive coefficients mean that cheese spending increases, while
negative coefficients mean that cheese spending decreases. For instance, a coefficient of 12 for number
of household members means that spending increases by $12 per month for each additional member in
the household. Coefficients for categorical variables (gender, race, etc.) are interpreted as an increase or
decrease for the specific category tested as compared to not being in that category. For instance, a
coefficient of 49 for full-time employment means that working full-time correlates to a $49 increase in
monthly cheese spending in comparison to not working full-time. Because we used multilinear regression,
each variable in the model is being controlled for, meaning that each coefficient is interpreted as holding
all other variables in the model constant.
Monthly Spending on Any Cheese
The final model included the following variables significantly associated with monthly cheese spending:
employment status, education level, number of children in household, number of household members
respondent purchases food for, race, and primary residence. When controlled for this list of variables,
those who are employed full time are likely to spend an average of $49.16 more on cheese per year than
those who are not (p<0.01) Each additional household member the respondent purchases food for
correlates to an average $12.13 increase in cheese expenditures (p<0.05), while each additional child in a
household correlates to an average $15.23 increase. However, the association between the number of
children and cheese spending is only moderately significant at the p<0.1 level. Males are likely to spend
an average of $34.93 more on cheese per year than females (p<0.01). Certain independent variables were
correlated with a reduction in monthly spending including being Caucasian, which was associated with an
average $62.11 decrease in spending, and being two or more races (p<0.01), which was associated with
an average $74.61 decrease in spending (p<0.1). Surprisingly, being a college graduate was also
moderately associated with a decrease in spending, at an average of $21.44 compared to non-college
graduates (p<0.1). Lastly, being from Connecticut was moderately associated with an average decrease
in spending of $23.72 compared to all other states (Table 2).
Monthly Spending on Specialty Cheese
The final model for monthly spending on specialty cheese was very similar to that of monthly spending on
any cheese, and included everything except number of household members the respondent purchases
food for and being from Connecticut. Those employed full time are associated with a $61.19 increase in
monthly spending on specialty cheese than those who are not (p<0.01). Each additional child in the
household corresponds to an average $22.27 increase in specialty cheese spending (p<0.01). Males are
associated with an average increase of $29.29 in spending (p<0.05). Those from New York are more likely
to spend an average of $29.14 more than those from other states (p<0.05). Variables associated with a
reduction in average spending include being Caucasian ($52.85 decrease, p<0.01), and being a college
graduate ($26.34 decrease, p<0.05).
28
Table 2. Regression Coefficients for Any Cheese Spending and Specialty Cheese Spending Models (n=731)
Any Cheese Spending Specialty Cheese Spending
Employed Full Time 49.16*** 61.19***
Number of Household Members Respondent Purchases Food For
12.13**
Number of Children in Household 15.23* 22.27***
Male 34.93*** 29.29**
Caucasian -62.11*** -52.85***
Two or More Races -74.61* -70.77
College Graduate -21.44* -26.34**
Primary Residence – Connecticut -23.72*
Primary Residence – New York 18.61 29.14**
* p<0.1; ** p<0.05; *** p<0.01
Conclusions Increasing awareness of local grocery stores offering local cheeses and awareness of local dairy farms and
processing operations will likely increase average annual expenditures on local specialty cheeses.
However, consumers seem to be less interested in knowing specifically which dairy farm or processor
produced the cheese they purchase. Of the five states included in this research, Vermont seems to have
perfected this model the best and could potentially be used as a “best practices” example, maybe even
nationally within the context of a larger scale study.
While knowledge of where to purchase locally produced cheeses would often result in higher spending,
perceived knowledge of how milk and cheese is processed does not seem to be linked to greater
expenditures. The expense of educating consumers about how milk and cheese is processed does not
seem warranted.
Promotions to increase spend levels on artisan/specialty cheese should include traditional grocery
stores/supermarkets, which dominate cheese expenditures, including specialty cheeses. Big box stores
have the second highest average level of spend on cheese, even in Vermont, but only at one-third the
level of grocery stores. The highest average annual spend on cheese at big box retailers is in New York,
which is at a level that is half what the expenditure is at grocery stores.
In terms of the types of cheeses to promote, cow cheese has by far the broadest appeal. Goat, sheep and
plant-based cheeses have by far the biggest upside, although the research did not cover trial and like or
dislike of each of these types of cheeses.
Firm/Hard cheese is the most sought after type of specialty cheese compared to soft (next preferred),
fresh and semi-soft. Overall quality, taste and appearance are rated highest for firm/hard specialty
cheeses versus the other types. Among cheeses with the presence of mold, soft-ripened, smear-ripened,
and blue/bleu veined cheeses are liked by similar percentages of consumers, about two-fifths, while
washed-rind does not have nearly as broad the appeal.
Lead messages for boosting the sale of specialty cheeses should include local, fresh and no artificial growth
hormones certified. These are the top three cheese characteristics consumers are willing to pay more for,
besting features such as certified organic and specialty. Third party certified sustainable, raw, and
containing A2A2 did not resonate very well among respondents.
29
Sixteen- and eight-ounce packages are preferred for all types of specialty cheeses. White plastic containers are preferred for spreads and cottage/ricotta, plastic bags for shredded and sliced are preferred while there is no preference for block cheeses.
Business to Business Survey
Introduction To discover the most effective sales channels for Vermont and Massachusetts, Atlantic conducted a series of informal interviews with key stakeholders such as specialty cheese makers, distributors, and retailers among others. This information may provide insight into additional research that could be conducted to more formally assess market barriers faced by specialty cheesemaker and retailers as well as ways to increase sales and supplement income, packaging, and challenges in distribution.
Methods Participants for this survey were selected due to their backgrounds in specialty cheese production or as a result of Internet searches for specialty cheese production and related terms in VT and MA. Methods for selection included a google search for the following key terms: artisan cheese VT/MA, artisan cheese distributor VT/MA, small specialty cheese producers in VT/MA, cheese guilds of VT/MA, and artisan cheese associations in VT/MA.
A spreadsheet was created containing company name, company type (producer, distributor, association), contact name, phone number, and email. Outreach efforts began following successful completion of the database, which was expanded to include findings of product sales, production numbers, and generalized feeling about the industry. A full list of interview questions can be found in Appendix A.
A total of 66 specialty cheese producers/retailers were contacted via phone/email to participate in the specialty cheese survey. Potential participants were contacted a maximum of four times over four weeks beginning June 10, 2019 and concluding July 5, 2019. A list of all respondents is included in Appendix B.
Findings Of the 66 producers and retailers initially solicited for interviews, 45 resulted in a contact and invitation to communicate. A total of 41 interviews were completed; 11 via phone and 30 via email. The final response rate was 62.1%.
On average, the producers who responded have been producing cheese for 48.26 years and retailers have been selling cheese for 41.25 years. Of all respondents, producers had an average of 6.76 employees and retailers 22.18 employees. On a scale of 1-7, 1 being extremely dissatisfied and 7 being extremely satisfied, producers rated business quality an average of 5.14 and retailers 5.81.
30
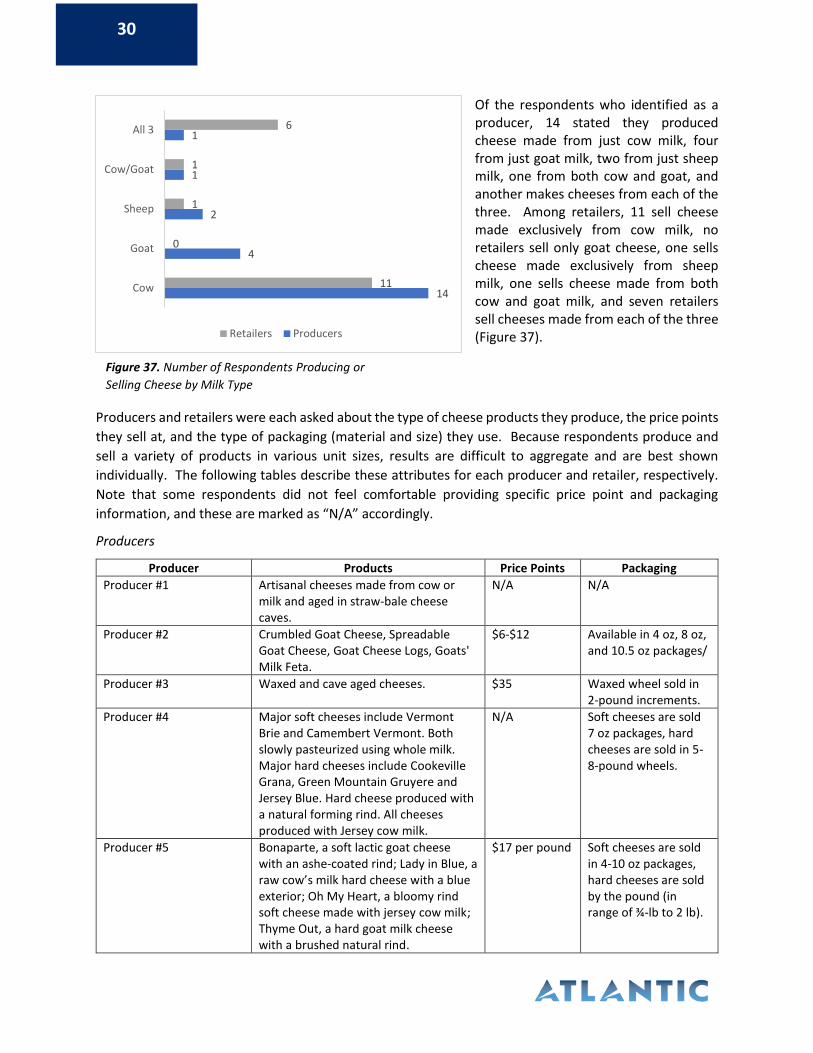
Of the respondents who identified as a producer, 14 stated they produced cheese made from just cow milk, four from just goat milk, two from just sheep milk, one from both cow and goat, and another makes cheeses from each of the three. Among retailers, 11 sell cheese made exclusively from cow milk, no retailers sell only goat cheese, one sells cheese made exclusively from sheep milk, one sells cheese made from both cow and goat milk, and seven retailers sell cheeses made from each of the three (Figure 37).
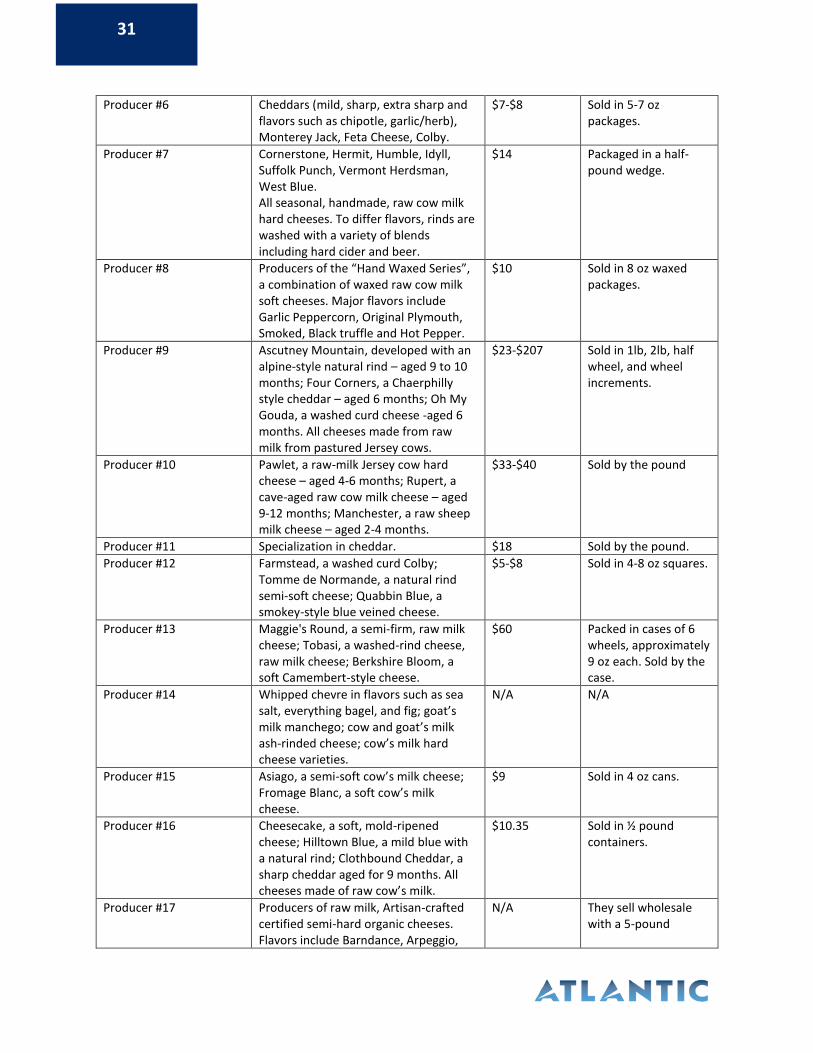
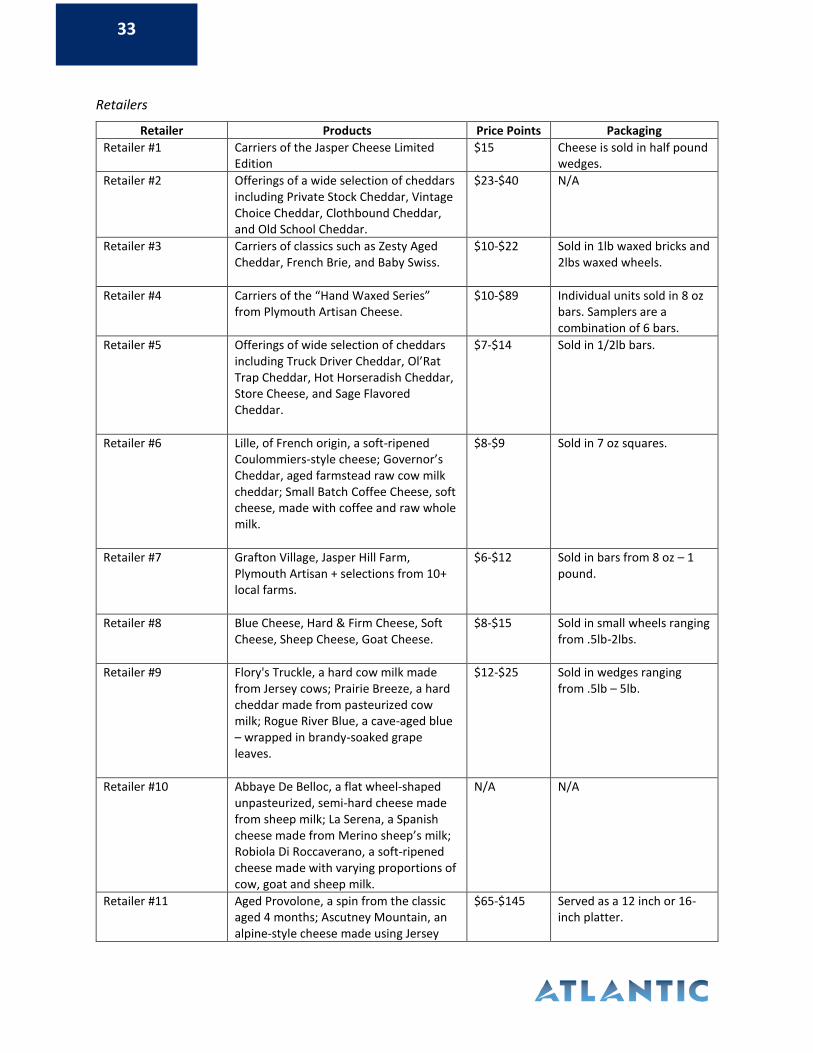
Producers and retailers were each asked about the type of cheese products they produce, the price points
they sell at, and the type of packaging (material and size) they use. Because respondents produce and
sell a variety of products in various unit sizes, results are difficult to aggregate and are best shown
individually. The following tables describe these attributes for each producer and retailer, respectively.
Note that some respondents did not feel comfortable providing specific price point and packaging
information, and these are marked as “N/A” accordingly.
Producers
Producer Products Price Points Packaging
Producer #1 Artisanal cheeses made from cow or milk and aged in straw-bale cheese caves.
N/A N/A
Producer #2 Crumbled Goat Cheese, Spreadable Goat Cheese, Goat Cheese Logs, Goats' Milk Feta.
$6-$12 Available in 4 oz, 8 oz, and 10.5 oz packages/
Producer #3 Waxed and cave aged cheeses. $35 Waxed wheel sold in 2-pound increments.
Producer #4 Major soft cheeses include Vermont Brie and Camembert Vermont. Both slowly pasteurized using whole milk. Major hard cheeses include Cookeville Grana, Green Mountain Gruyere and Jersey Blue. Hard cheese produced with a natural forming rind. All cheeses produced with Jersey cow milk.
N/A Soft cheeses are sold 7 oz packages, hard cheeses are sold in 5-8-pound wheels.
Producer #5 Bonaparte, a soft lactic goat cheese with an ashe-coated rind; Lady in Blue, a raw cow’s milk hard cheese with a blue exterior; Oh My Heart, a bloomy rind soft cheese made with jersey cow milk; Thyme Out, a hard goat milk cheese with a brushed natural rind.
$17 per pound Soft cheeses are sold in 4-10 oz packages, hard cheeses are sold by the pound (in range of ¾-lb to 2 lb).
Figure 37. Number of Respondents Producing or
Selling Cheese by Milk Type
14
4
2
1
1
11
0
1
1
6
Cow
Goat
Sheep
Cow/Goat
All 3
Retailers Producers
31
Producer #6 Cheddars (mild, sharp, extra sharp and flavors such as chipotle, garlic/herb), Monterey Jack, Feta Cheese, Colby.
$7-$8 Sold in 5-7 oz packages.
Producer #7 Cornerstone, Hermit, Humble, Idyll, Suffolk Punch, Vermont Herdsman, West Blue. All seasonal, handmade, raw cow milk hard cheeses. To differ flavors, rinds are washed with a variety of blends including hard cider and beer.
$14 Packaged in a half-pound wedge.
Producer #8 Producers of the “Hand Waxed Series”, a combination of waxed raw cow milk soft cheeses. Major flavors include Garlic Peppercorn, Original Plymouth, Smoked, Black truffle and Hot Pepper.
$10 Sold in 8 oz waxed packages.
Producer #9 Ascutney Mountain, developed with an alpine-style natural rind – aged 9 to 10 months; Four Corners, a Chaerphilly style cheddar – aged 6 months; Oh My Gouda, a washed curd cheese -aged 6 months. All cheeses made from raw milk from pastured Jersey cows.
$23-$207 Sold in 1lb, 2lb, half wheel, and wheel increments.
Producer #10 Pawlet, a raw-milk Jersey cow hard cheese – aged 4-6 months; Rupert, a cave-aged raw cow milk cheese – aged 9-12 months; Manchester, a raw sheep milk cheese – aged 2-4 months.
$33-$40 Sold by the pound
Producer #11 Specialization in cheddar. $18 Sold by the pound.
Producer #12 Farmstead, a washed curd Colby; Tomme de Normande, a natural rind semi-soft cheese; Quabbin Blue, a smokey-style blue veined cheese.
$5-$8 Sold in 4-8 oz squares.
Producer #13 Maggie's Round, a semi-firm, raw milk cheese; Tobasi, a washed-rind cheese, raw milk cheese; Berkshire Bloom, a soft Camembert-style cheese.
$60 Packed in cases of 6 wheels, approximately 9 oz each. Sold by the case.
Producer #14 Whipped chevre in flavors such as sea salt, everything bagel, and fig; goat’s milk manchego; cow and goat’s milk ash-rinded cheese; cow’s milk hard cheese varieties.
N/A N/A
Producer #15 Asiago, a semi-soft cow’s milk cheese; Fromage Blanc, a soft cow’s milk cheese.
$9 Sold in 4 oz cans.
Producer #16 Cheesecake, a soft, mold-ripened cheese; Hilltown Blue, a mild blue with a natural rind; Clothbound Cheddar, a sharp cheddar aged for 9 months. All cheeses made of raw cow’s milk.
$10.35 Sold in ½ pound containers.
Producer #17 Producers of raw milk, Artisan-crafted certified semi-hard organic cheeses. Flavors include Barndance, Arpeggio,
N/A They sell wholesale with a 5-pound
32
Hardwick Stone, Prescott, Robinson and Family Swiss.
minimum. Sold by the wheel.
Producer #18 Adelisca, a cow milk spread; Evelina, a sheep milk tome; Helene, a cow milk button
$11-$24 Sold in quarter wheel, half wheel, and full wheel increments.
Producer #19 Chevre, Goat Milk Feta, New Meadows Camembert. All soft, spreadable, creamy goat cheeses.
$6 for 4 oz. logs Up to $125 for partial and full wheels
Chevre sold in 4 oz logs. Solid cheeses sold in partial and full wheels.
Producer #20 Specialists in Mozzarella. Product offerings include Cloumage, Mozzarella Curd, and Hannahbells.
$39-$96 Sold in barquets and 5 oz containers (combination of the two for larger packages).
Producer #21 Bon Anniversaire, certified organic, raw milk, washed-rind cheese; Bluebird Reserve, certified organic blue cheese – aged 6 months; Eidolon, certified organic hard cheese, made from raw cow milk.
N/A N/A
Producer #22 Invierno, a winter cheese comprised of both sheep and cow milk. An additional applewood flavor is offered as well.
$34-$77 Sold by the pound and by the 6-8 lb wheel.
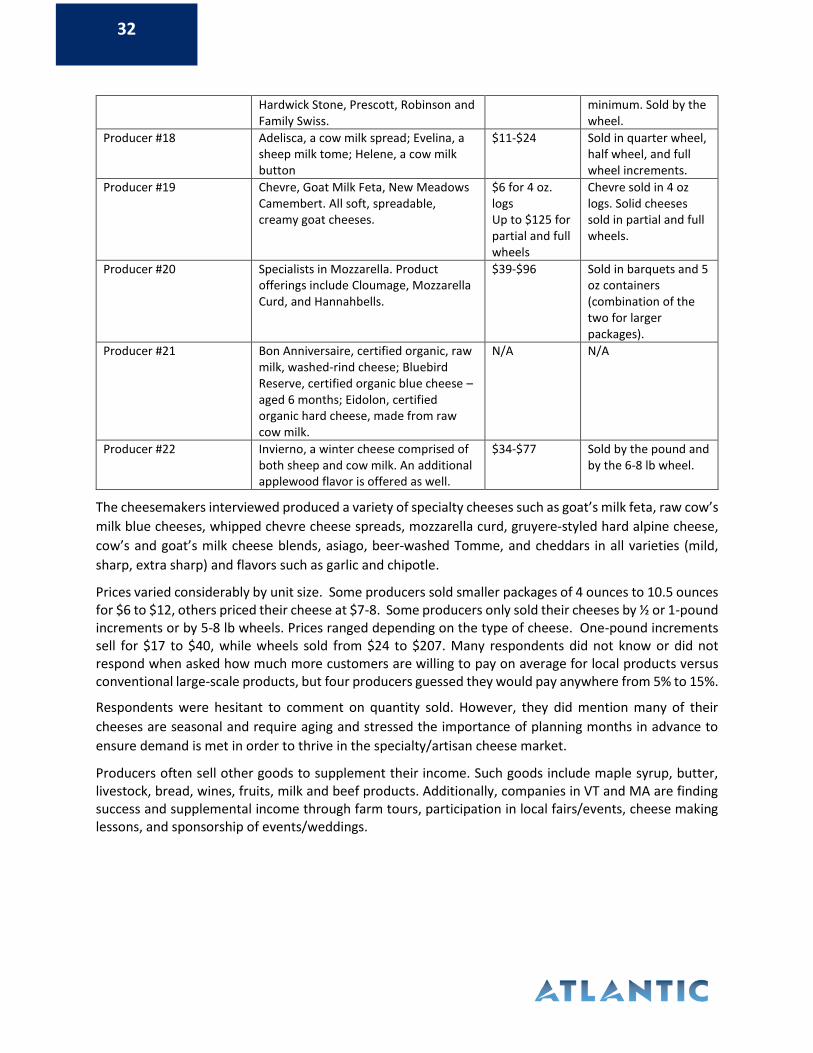
The cheesemakers interviewed produced a variety of specialty cheeses such as goat’s milk feta, raw cow’s
milk blue cheeses, whipped chevre cheese spreads, mozzarella curd, gruyere-styled hard alpine cheese,
cow’s and goat’s milk cheese blends, asiago, beer-washed Tomme, and cheddars in all varieties (mild,
sharp, extra sharp) and flavors such as garlic and chipotle.
Prices varied considerably by unit size. Some producers sold smaller packages of 4 ounces to 10.5 ounces for $6 to $12, others priced their cheese at $7-8. Some producers only sold their cheeses by ½ or 1-pound increments or by 5-8 lb wheels. Prices ranged depending on the type of cheese. One-pound increments sell for $17 to $40, while wheels sold from $24 to $207. Many respondents did not know or did not respond when asked how much more customers are willing to pay on average for local products versus conventional large-scale products, but four producers guessed they would pay anywhere from 5% to 15%.
Respondents were hesitant to comment on quantity sold. However, they did mention many of their
cheeses are seasonal and require aging and stressed the importance of planning months in advance to
ensure demand is met in order to thrive in the specialty/artisan cheese market.
Producers often sell other goods to supplement their income. Such goods include maple syrup, butter, livestock, bread, wines, fruits, milk and beef products. Additionally, companies in VT and MA are finding success and supplemental income through farm tours, participation in local fairs/events, cheese making lessons, and sponsorship of events/weddings.
33
Retailers
Retailer Products Price Points Packaging
Retailer #1 Carriers of the Jasper Cheese Limited Edition
$15 Cheese is sold in half pound wedges.
Retailer #2 Offerings of a wide selection of cheddars including Private Stock Cheddar, Vintage Choice Cheddar, Clothbound Cheddar, and Old School Cheddar.
$23-$40 N/A
Retailer #3 Carriers of classics such as Zesty Aged Cheddar, French Brie, and Baby Swiss.
$10-$22 Sold in 1lb waxed bricks and 2lbs waxed wheels.
Retailer #4 Carriers of the “Hand Waxed Series” from Plymouth Artisan Cheese.
$10-$89 Individual units sold in 8 oz bars. Samplers are a combination of 6 bars.
Retailer #5 Offerings of wide selection of cheddars including Truck Driver Cheddar, Ol’Rat Trap Cheddar, Hot Horseradish Cheddar, Store Cheese, and Sage Flavored Cheddar.
$7-$14 Sold in 1/2lb bars.
Retailer #6 Lille, of French origin, a soft-ripened Coulommiers-style cheese; Governor’s Cheddar, aged farmstead raw cow milk cheddar; Small Batch Coffee Cheese, soft cheese, made with coffee and raw whole milk.
$8-$9 Sold in 7 oz squares.
Retailer #7 Grafton Village, Jasper Hill Farm, Plymouth Artisan + selections from 10+ local farms.
$6-$12 Sold in bars from 8 oz – 1 pound.
Retailer #8 Blue Cheese, Hard & Firm Cheese, Soft Cheese, Sheep Cheese, Goat Cheese.
$8-$15 Sold in small wheels ranging from .5lb-2lbs.
Retailer #9 Flory's Truckle, a hard cow milk made from Jersey cows; Prairie Breeze, a hard cheddar made from pasteurized cow milk; Rogue River Blue, a cave-aged blue – wrapped in brandy-soaked grape leaves.
$12-$25 Sold in wedges ranging from .5lb – 5lb.
Retailer #10 Abbaye De Belloc, a flat wheel-shaped unpasteurized, semi-hard cheese made from sheep milk; La Serena, a Spanish cheese made from Merino sheep’s milk; Robiola Di Roccaverano, a soft-ripened cheese made with varying proportions of cow, goat and sheep milk.
N/A N/A
Retailer #11 Aged Provolone, a spin from the classic aged 4 months; Ascutney Mountain, an alpine-style cheese made using Jersey
$65-$145 Served as a 12 inch or 16-inch platter.
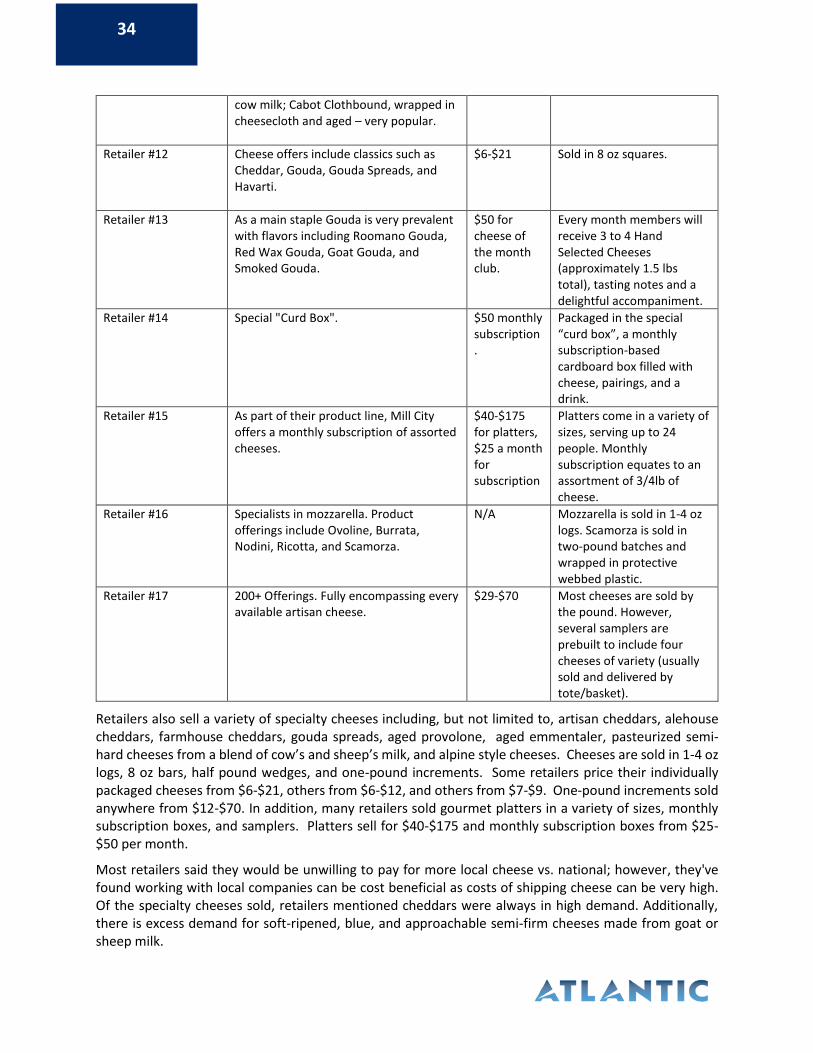
34
cow milk; Cabot Clothbound, wrapped in cheesecloth and aged – very popular.
Retailer #12 Cheese offers include classics such as Cheddar, Gouda, Gouda Spreads, and Havarti.
$6-$21 Sold in 8 oz squares.
Retailer #13 As a main staple Gouda is very prevalent with flavors including Roomano Gouda, Red Wax Gouda, Goat Gouda, and Smoked Gouda.
$50 for cheese of the month club.
Every month members will receive 3 to 4 Hand Selected Cheeses (approximately 1.5 lbs total), tasting notes and a delightful accompaniment.
Retailer #14 Special "Curd Box".
$50 monthly subscription.
Packaged in the special “curd box”, a monthly subscription-based cardboard box filled with cheese, pairings, and a drink.
Retailer #15 As part of their product line, Mill City offers a monthly subscription of assorted cheeses.
$40-$175 for platters, $25 a month for subscription
Platters come in a variety of sizes, serving up to 24 people. Monthly subscription equates to an assortment of 3/4lb of cheese.
Retailer #16 Specialists in mozzarella. Product offerings include Ovoline, Burrata, Nodini, Ricotta, and Scamorza.
N/A Mozzarella is sold in 1-4 oz logs. Scamorza is sold in two-pound batches and wrapped in protective webbed plastic.
Retailer #17 200+ Offerings. Fully encompassing every available artisan cheese.
$29-$70 Most cheeses are sold by the pound. However, several samplers are prebuilt to include four cheeses of variety (usually sold and delivered by tote/basket).
Retailers also sell a variety of specialty cheeses including, but not limited to, artisan cheddars, alehouse cheddars, farmhouse cheddars, gouda spreads, aged provolone, aged emmentaler, pasteurized semi-hard cheeses from a blend of cow’s and sheep’s milk, and alpine style cheeses. Cheeses are sold in 1-4 oz logs, 8 oz bars, half pound wedges, and one-pound increments. Some retailers price their individually packaged cheeses from $6-$21, others from $6-$12, and others from $7-$9. One-pound increments sold anywhere from $12-$70. In addition, many retailers sold gourmet platters in a variety of sizes, monthly subscription boxes, and samplers. Platters sell for $40-$175 and monthly subscription boxes from $25-$50 per month.
Most retailers said they would be unwilling to pay for more local cheese vs. national; however, they've found working with local companies can be cost beneficial as costs of shipping cheese can be very high. Of the specialty cheeses sold, retailers mentioned cheddars were always in high demand. Additionally, there is excess demand for soft-ripened, blue, and approachable semi-firm cheeses made from goat or sheep milk.
35
Conclusions Based on our research, we can conclude that cheese sales alone often do not sustain farms, but there are several ways to boost revenues by selling other products such as maple syrup, butter, livestock, bread, wines, fruits, milk, and meat products. Additional companies are finding success through farm tours, participation in local events and fairs, offering cheese making lessons, and hosting events/weddings. Retailers are having great success in selling gourmet platters, sampler boxes, and monthly subscriptions.
Specialty cheese producers and retailers sell a variety of products at different price points, reflecting the wide range of consumer demand and willingness to pay for specialty cheeses. More research is needed to understand profitability of certain cheese types, cheeses with excess demand and ideal price points, distribution channels among both producers and retailers, missed opportunities, barriers to entering sought after markets.
Recommended Engagement Strategy The specialty cheese industry is growing, and Vermont and Massachusetts cheesemakers have
opportunities for continued expansion through market penetration in the local, heavily populated five-
state region (VT, MA, CT, NJ, NY) as well as in other domestic and global markets. In global markets, U.S.
cheesemakers interested in exporting specialty cheeses should further capitalize on Asian markets
without retaliatory tariffs in places such as Japan and South Korea, which are becoming ever larger
importers of U.S. cheese. For those interested in exporting, additional studies on specialty cheese
preferences and consumer demographics in Asian markets is needed to anticipate demand and base
production on market-driven data.
Domestic opportunities are much broader, especially for the many small, independent cheesemakers of
Vermont and Massachusetts. First, producers should utilize the most successful distribution channels as
described by the ACS including direct retail, direct to restaurant, direct to farm stand, and recently
successful channels such as festivals and events as well as producer’s own websites. The most successful
cheesemakers utilize a wide range of distribution channels, with the most profitable using at least five to
seven different channels. Those using fewer should consider looking into new distribution options. For
those interested in online sales via a website, the high costs of building and maintaining a website must
be factored in. For those looking to expand into or increase wholesale delivery, the cost of purchasing and
maintaining refrigerated trucks as well as changes to operations must be considered. An extensive
feasibility study and infrastructure analysis would be needed for cheesemakers interested in these and
other options that require significant operational shifts to ensure they have the required capital and would
earn a sufficient return on investment. Cheesemakers who are currently selling or interested in selling
direct to restaurants can explore partnerships with chefs and restauranteurs who value quality and locally
sourced ingredients to identify cheeses of interest to better anticipate demand or to suggest pairings of
their current offerings that complement the menu. The food service industry is one of the most rapidly
growing categories of cheese sales, and is not restricted by retaliatory tariffs, so expanding into this
channel is a great idea for cheesemakers.
Specialty cheesemakers can also take advantage of new trends by developing partnerships with meal
delivery kit companies, offering gourmet cheese boards with higher profit margins, developing trendy
specialty flavors, and catering to the growing number of healthy snackers and dieters. To develop new
flavors, cheesemakers may want to focus on trending zesty or spicy flavors or learn from other
cheesemakers who have had previous success collaborating with one another to create new and unique
36
offerings. To capitalize on snacking, producers should explore the feasibility and potential profitability of
making bite-sized, pre-packaged portions as well as convenient, snack-sized packaging that has allowed
large players in the industry to successfully enter this segment, gaining large earnings in the snacking
aisles. Cheesemakers can also partner with other local good producers to create new snack products and
prepared meals.
Education may be one of the easiest and most fruitful ways to improve visibility and sales. Most shoppers
do not know where to purchase locally made specialty cheeses or whether these products are even readily
available. Shoppers should be better educated about their local dairy farms, cheese processing
operations, and where they can purchase locally made cheeses within 75 miles of their homes. Educated
shoppers are more likely to favorably rate locally-made cheeses in overall quality, taste, appearance,
perception of nutritional value than non-educated shoppers. If the non-educated shoppers had products
available, or knew where to purchase them, they would spend an average of $28-40 per year depending
on the type of cheese.
One way to educate shoppers is to incorporate sampling in retail or grocery stores where the cheese is
sold and at farmer’s markets, local festivals/events, and farm stands. Sampling offers the opportunity for
company representatives to educate consumers on their operations and products, distribute recipes and
other product information such as cheese pairings. Among the 65% of people who sample cheese prior
to purchasing it, sampling was shown to improve shoppers’ views on quality, appearance, taste, and
perception of nutritional value of all types of local specialty cheese.
37
Citations 1. Specialty cheesemakers face different challenges than Big Dairy. Dairyreporter.com.
https://www.dairyreporter.com/Article/2019/02/07/Specialty-cheesemakers-face-different-challenges-than-Big-Dairy. Accessed July 5, 2019.
2. State of the U.S. Artisan/Specialty Cheese Industry Report of Key Findings. American Cheese Society; 2018.
3. Cheese: Global market value 2016-2022. Statista. https://www.statista.com/statistics/602542/cheese-market-value-worldwide/. Accessed July 10, 2019.
4. Mar. 28 JS on, 2019. Cheese Sales Top $18 Billion. Winsight Grocery Business. https://www.winsightgrocerybusiness.com/fresh-food/cheese-sales-top-18-billion. Accessed July 10, 2019.
5. Creative Ways to Chase the Cheese. https://www.winsightgrocerybusiness.com/fresh-food/creative-ways-chase-cheese. Accessed July 10, 2019.
6. Fanning S. Specialty Cheeses Playing a Key Role in Driving Sales Growth. https://www.cheesemarketnews.com/guestcolumn/2017/21jul17_01.html. Accessed July 10, 2019.
7. OEC - Cheese Product Trade, Exporters and Importers. https://atlas.media.mit.edu/en/profile/hs92/0406/. Accessed July 10, 2019.
8. U.S. Cheese. U.S. Dairy Export Council - Think USA Dairy; 2015.
9. Kiesel L. How Real Cheese Made Its Comeback. https://www.theatlantic.com/technology/archive/2016/07/real-cheese-is-back/491402/. Published July 15, 2016. Accessed July 10, 2019.
10. Cheese Market in the U.S. Dossier. Statista; 2018.
11. USDA/NASS QuickStats Ad-hoc Query Tool. https://quickstats.nass.usda.gov/results/CC2A39B3-0296-3660-AB90-D8DEB326186E. Accessed July 31, 2019.
12. Cheese Producers. Mass.gov. https://www.mass.gov/service-details/cheese-producers. Accessed July 31, 2019.
13. Cheese Industry Profile | Agricultural Marketing Resource Center. https://www.agmrc.org/commodities-products/livestock/dairy/cheese-industry-profile. Accessed July 10, 2019.
14. Madigan J. IBIS World Industry Report: Cheese Production in the US. IBISWorld Industry; 2018.
15. Vermont. /map/state-benefits/vt. Accessed July 31, 2019.
38
16. U.S. Cheese Exports Hit Highs in March. https://blog.usdec.org/usdairyexporter/us-cheese-exports-hit-highs-in-march-0. Accessed July 10, 2019.
17. Export Essentials Online. https://www.foodexport.org/programs-services/export-education/export-essentials-online/. Accessed July 31, 2019.
18. Instore: Pershiables Group. United States: Perishables Group; 2017.
19. Top 5 Ways Consumers Will Eat Specialty Cheese in 2018 | Dairy Herd Management. https://www.dairyherd.com/article/top-5-ways-consumers-will-eat-specialty-cheese-2018. Accessed July 10, 2019.
20. Slideshow: Cheese snack innovations on the rise. https://www.foodbusinessnews.net/articles/7118-slideshow-cheese-snack-innovations-on-the-rise?v=preview. Accessed July 8, 2019.
21. Exclusive cheese study: Investing in trends with traction. https://www.dairyfoods.com/articles/92780-exclusive-cheese-study-investing-in-trends-with-traction. Accessed July 10, 2019.
22. US specialty and natural cheese market booming, hitting $17.4bn in 2015. Dairyreporter.com. https://www.dairyreporter.com/Article/2016/05/19/US-specialty-and-natural-cheese-market-booming-hits-17.4bn-in-2015. Accessed July 10, 2019.
23. Sargento Foods Announces New Sunrise Balanced Breaks®. https://www.prnewswire.com/news-releases/sargento-foods-announces-new-sunrise-balanced-breaks-300857024.html. Accessed July 8, 2019.
24. Plant-forward, cheese-centric new product innovation. https://www.foodbusinessnews.net/articles/12558-plant-forward-cheese-centric-new-product-innovation?v=preview. Accessed July 8, 2019.
25. 2018 State of the Industry report: Cheese is a standout on the gridiron. https://www.dairyfoods.com/articles/93261-state-of-the-industry-report-cheese-is-a-standout. Accessed July 8, 2019.
26. Three key trends shape the specialty and artisan cheese market | 2017-10-05 | Dairy Foods. https://www.dairyfoods.com/articles/92485-three-key-trends-shape-the-specialty-and-artisan-cheese-market?v=preview. Accessed July 10, 2019.
39
Appendix A: B2B Survey Interview Questions
The producer interview questions included the following:
1. Which type of milk do you make cheese from: cow, goat, and/or sheep? 2. How many employees do you have? 3. Estimate the percentage of sales to rural consumers vs urban consumers. 4. Which specialty cheeses do you produce and in what quantity per month? 5. In addition to specialty cheeses do you produce any other specific products? 6. What are your retail and wholesale price points for each product? 7. What percentage more are your retail customers willing to pay for your local products vs
conventional large-scale products? 8. How long have you been producing cheese? 9. Estimate the percentage of your income from the following sales channels: retail/wholesale?
farmers market? local grocery stores? institutions? 10. What kind of packaging do your retail accounts prefer compared to your wholesale? 11. Have you used any new or innovative approaches to processing, packaging or sales? If yes, please
describe. 12. On a scale of 1-7, 1 being extremely dissatisfied and 7 being extremely satisfied, how satisfied are
you with the current performance of your business?
The retail interview questions included the following:
1. Which type of milk is in the cheese you sell: cow, goat, and/or sheep? 2. How many employees do you have? 3. Estimate the percentage of sales to rural consumers vs urban consumers. 4. Which local specialty cheeses do you sell? Can you approximate the quantity of each type sold
per month? 5. Which local specialty cheeses could you sell more of? 6. What are your price points for each product? 7. What percentage more are your retail customers willing to pay for your local products vs
conventional large-scale products? 8. How long have you been distributing cheese? 9. Have you used any new or innovative approaches to increase sales? If yes, please describe. 10. How much more, if at all, are you willing to pay for local cheese vs. national? 11. On a scale of 1-7, 1 being extremely dissatisfied and 7 being extremely satisfied, how satisfied are
you with the current performance of your business?
40
Contacts Ray Bernier, Project Director
Randy Labbe, Co-Project Director
www.AtlanticCorp.us