species diversity and pedological characteristics in selected
TRANSCRIPT

Journal of Environment and Ecology ISSN 2157-6092
2013, Vol. 4, No. 1
www.macrothink.org/jee 111
Species Diversity and Pedological Characteristics in
Selected Sites of Senchal Wildlife Sanctuary, West
Bengal, India
Debnath Palit (Corresponding author)
Assistant Professor in Botany and Head, PG Department of Conservation Biology, The University of Burdwan
Durgapur Government College, J.N.Avenue,Durgapur-713214 , West Bengal, India
Tel: 91-983-217-5737 E-mail: [email protected]
Arnab Banerjee
Assistant Professor, PG Department of Conservation Biology, The University of Burdwan
Durgapur Government College, J.N.Avenue,Durgapur-713214 , West Bengal, India
Tel: 91-943-350-1162 E-mail: arnabenvsc @yahoo.com
Received: November 11, 2012 Accepted: November 26, 2012 Published: June 26, 2013
doi:10.5296/jee.v4i1.2666 URL: http://dx.doi.org/10.5296/jee.v4i1.2666
Abstract
The aim of the investigation was to analyze phytosociological characteristics and diversity pattern of subalpine evergreen forest of Senchal wildlife Sanctuary , Darjeeling, West Bengal,India. The results reflect dominancy of dicotyledons over monocotyledons in the four studied sites . Rangiroom beat shows higher diversity of species among the four studied sites. Maximum IVI value were recorded by Viola surpense ( 47.17) in Rambhi forest beat, Fragaria nubicola ( 63.87) in Rangiroom forest beat , Viola betonicifolia (25.99) in Gaddikhana forest range and Pilea umbrosa (35.93) in 6th mile beat respectively. The Berger parker index and evenness index were found to be highest for Viola surpense , Fragaria nubicola, Pilea umbrosa in site I, II, III and IV respectively. The soil characteristics of the four study sites revealed alkaline nature of soil in Rambhi and Rangiroom beat and acidic nature of soil in Gadhikhana and 6th mile beat. The organic carbon % were found to be higher

Journal of Environment and Ecology ISSN 2157-6092
2013, Vol. 4, No. 1
www.macrothink.org/jee 112
in the first two studied sites than the next two sites. Therefore ,proper management and conservative measures needs to be implemented for conservation of bioresources in Senchel wildlife Sanctuary of West Bengal, India.
Keywords: Phytodiversity, Importance value index, Species distribution, Senchal

Journal of Environment and Ecology ISSN 2157-6092
2013, Vol. 4, No. 1
www.macrothink.org/jee 113
1. Introduction
Wildlife Protected Areas (PAs) in India have had a relatively long history of forest management and exploitation as majority of the PAs were originally reserved or other categories of government owned forests where focus of management was mainly on timber production, meeting the biomass demands of local communities or soil and water conservation (Rodgers & Sawarkar 1988).Several reserved forests having high abundance of wildlife were notified as National Parks (where legally all exploitation of forest resources is prohibited) or Wildlife Sanctuaries (where some exploitation and development may be allowed) during 1970’s and 1980’s. However, impacts of past management practices on vegetation and wildlife habitats were quite long lasting in many PAs.Such impacts have rarely been documented.
The habitat is of immense value to mankind because the modern material civilization is entirely based on the exploitation and utilization of the existing resources drawn from the environment and created through human efforts. In mountain areas this is more pronounced; terrain inaccessibility, climate in hospitability, soil infertility, and transport availability, scarcity of basic amenities and facilities make life nature oriented. The controlling mechanisms of biodiversity in different ecosystems are mentioned by the theory of species richness which considers resource availability and disturbance as factors for structuring plant communities.
Darjeeling is one of the biodiversity hotspot within Himalayas. It is floristically akin to other parts of the Eastern Himalayas in general and Sikkim Himalaya in particular. Darjeeling hill appears as the matrix encompassing some features of boreal and temperate flora of the eastern and western hemispheres together with certain unique features of Asia in addition to its own unique features.
The patterns and role of species richness in ecosystem function are important in terms of land-use and climate change concerns (Chapin & Korner 1995; Reynolds & Tenhunen 1996; Oechel et al. 1997). While there is still debate on the role of species diversity and ecosystem function (Hooper & Vitousek 1997; Patrick 1997), species richness is a frequently measured ecosystem attributes (Magurran 1988) because it characterizes the biodiversity of an area at any scale. Species richness is controlled by a variety of biotic and abiotic parameters (Rannie 1986; Cornell & Lawton 1992; Huston 1994; Pollock et al. 1998).
The plant diversity at any site is influenced by species distribution and abundance patterns. A number of factors have been shown to affect the distribution and abundance of plant species, including site conditions, i.e., moisture and nutrient gradients (Day and Monk 1974, Whittaker and Niering 1975, Marks and Harcombe 1981, Host and Pregitzer 1992) and canopy coverage, i.e., light availability (Kull and Zobel l991). However the investigations concerning different types of forests or similar forests located in different areas have given no concrete conclusion for pinpointing the vegetation effect since site condition are changed and it is often impossible to separate the cause from the effect .However, diversity of trees in the Darjeeling foot hill region of Eastern Himalaya was recently studied by (Rai and Das, 2008), Chanda and Palit 2009) revealed the ecological Study on plant diversity and pedological

Journal of Environment and Ecology ISSN 2157-6092
2013, Vol. 4, No. 1
www.macrothink.org/jee 114
characteristics in Rangiroom forest beat, Senchal West Zone Forest Range, Darjeeling.
Studies on soils in the Himalayan region are rather scanty (Dhir 1967; Pal et al 1984). Available studies on the physical and chemical characteristics and nutrient status of soils under different vegetation in different altitudes of the eastern and north–eastern Himalayas is mainly with reference to Darjeeling Himalayan region (Banerjee et al 1985, 1986; Nath et al 1983, Das et al 1986; Chandran et al 1987).A noteworthy contribution in the field of phytosociology was received from Das and Lahiri (1997) which dealt with the ground covering flora in different types of vegetation in Tiger Hill, Darjeeling District. This paper deals with the plant species diversity, structure and composition across various strata within natural forests within the SWS. Distribution of selected indicator taxa and their abundance have been compared. Results are discussed along with the management implications.
2. Material and Methods
2.1 Study Area
Darjeeling Himalaya forms a part of the Eastern Himalayan Ranges and is bounded by Sikkim, Nepal and Bhutan on the north, west and east respectively. The study sites are located in the district of Darjeeling.
The study were conducted in selected sites of SWS viz., The Rambi Beat (26°N and 27°N and 88°E and 88°20´E longitude at an elevation of 2600m);The Rangiroom Beat (26°N and 27°N and 88°E and 88°20´E longitude at an elevation of 2600m); Gaddikhana Forest (26°N and 27°N and 88°E and 88°20´E longitude at an elevation of 2600m); 6th Mile Beat 27o55’ to 28o25’ N latitudes and 81o to 81o25’E longitudes). The Rambi Beat has the status of reserve forests and under the supervision of The Forest Department of Government of West Bengal. The Rangiroom Beat is a part of the Senchel Wildlife Sanctuary, Darjeeling, West Bengal. Administration of this beat is controlled by the Head Quarters at 3rd mile. Gaddikhana Forest is a part of Senchal Wildlife Sanctuary, situated near to Darjeeling, West Bengal The forest is having the sufficient tree cover and wherever required an artificial stocking is done annually. The forest is important for Black bear, Panther, Lesser cat, Goral, Red Legged Falcon. The 6th Mile Beat is a part of the Senchal Wildlife Sanctuary, Darjeeling, West Bengal. The forest has the status of reserve forests and under the supervision of The Forest Department of Government of West Bengal.
2.2 Quadrat and Phytosociological Studies
A total of 4 sites representing various categories of natural forests and plantations were selected for vegetation sampling. At each site 20 quadrats (1 m x 1 m) were laid to quantify various layers. The size of the quadrat used in this study was decided based on the species area curve method following Misra (1968). Individuals of shrubs, climbers and tree seedlings were enumerated within each quadrat. The structure and composition of vegetation across vegetation types have been compared in terms of frequency, density, abundance, and basal area of major species. Importance Value Index (IVI =relative frequency + relative density + relative dominance) and species diversity index (H' = pi ln pi; where, pi= ni/N; and ni = abundance of each species, N= total abundance of all species) were derived from the primary
Journal of Environment and Ecology ISSN 2157-6092
2013, Vol. 4, No. 1
www.macrothink.org/jee 115
data separately for each layer following Misra (1968) and Shannon & Weaver (1963) respectively. Berger and Parker Index (DBP = Nmax / N Where Nmax = is the number of individuals in the most species and N= is the total number of all individuals in all species) were weighted toward the abundance of the commonest species. For any information-statistics index, the maximum diversity of a community is found when all species are equally abundant. Community’s actual diversity is measured by the formula: Evenness (E) = H / Hmax. Rank Abundance diagrams visually describe the allocation of individuals to species in communities. We ranked and represented 34 species in that forest community in a standard rank abundance diagram. Next, each species were given a number. We then grouped the species in abundance classes of log10.
2.3 Soil Sampling and Analysis
Soil samples were collected from upper surface layers (top 15cm).The samples were properly packed, air-dried, cleaned, crushed and then strained through 2 mm mesh sieves and analyzed. The soil pH were estimated by standard paste technique using pH meter (Rhodes,1982). The organic carbon percentage was measured using potassium dichromate method (Black, 1965). Specific conductance was measured by following the method of Black (1965). Total nitrogen was measured by the standard Kjeldahl procedure (Bremner and Mulvaney, 1982).Extractable phosphorus were determined by using sodium bicarbonate extracts (Olsen et al, 1954).
3. Results
3.1 Phytosociology and Species Diversity and Abundance
The predominant forest types in the selected sites of Senchal wildlife sanctuary are subalpine evergreen type. The number of species in a particular forest type varies markedly along the altitudinal range of its growth, which depends on the complex suit of factors that characterize the habitat of individual species. Ecological function of the species involves all kinds of processes, which are inevitably associated with some changes over space, composition and structure are affected at species level. The fundamental capability of ecosystems to evolve, change and recognize themselves is a prerequisite for the sustainability of viable system (Ashby, 1974). The species in a community grow together in a particular environment because they have a similar requirement for existence in terms of environmental factors (Ter Baak, 1987).
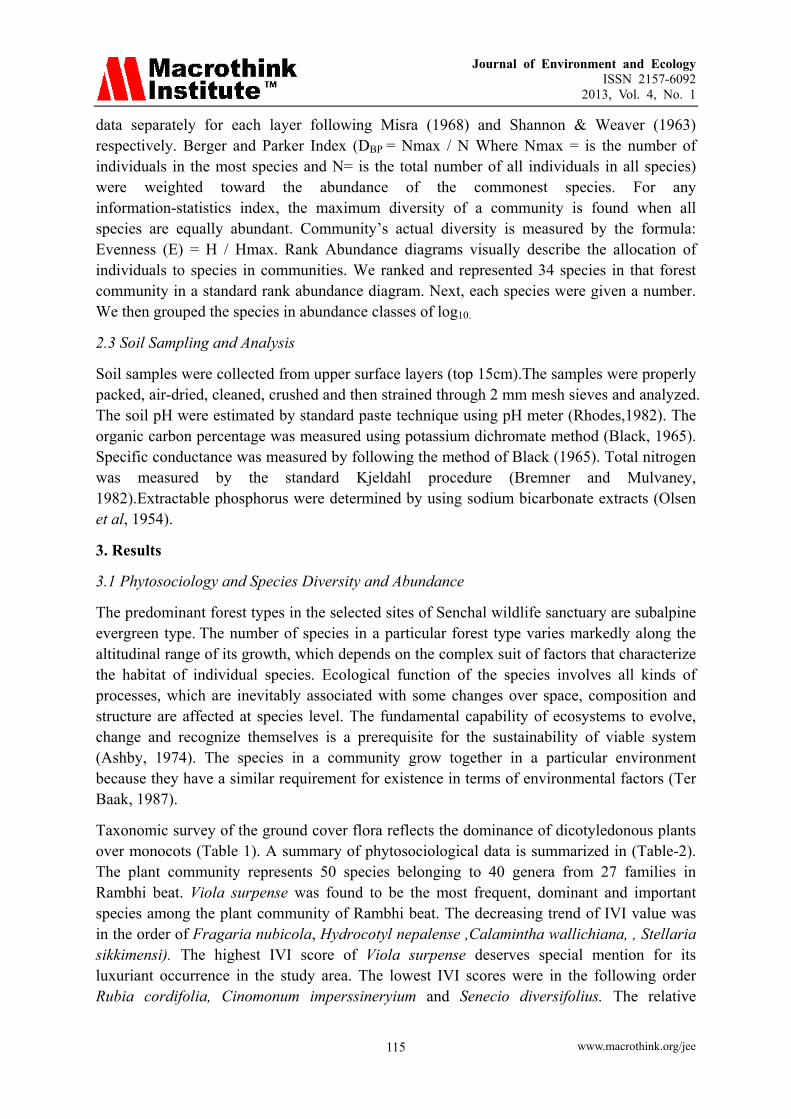
Taxonomic survey of the ground cover flora reflects the dominance of dicotyledonous plants over monocots (Table 1). A summary of phytosociological data is summarized in (Table-2). The plant community represents 50 species belonging to 40 genera from 27 families in Rambhi beat. Viola surpense was found to be the most frequent, dominant and important species among the plant community of Rambhi beat. The decreasing trend of IVI value was in the order of Fragaria nubicola, Hydrocotyl nepalense ,Calamintha wallichiana, , Stellaria sikkimensi). The highest IVI score of Viola surpense deserves special mention for its luxuriant occurrence in the study area. The lowest IVI scores were in the following order Rubia cordifolia, Cinomonum imperssineryium and Senecio diversifolius. The relative

Journal of Environment and Ecology ISSN 2157-6092
2013, Vol. 4, No. 1
www.macrothink.org/jee 116
abundance of plants species (n=50) represented in Fig: 1 reveals highest value for Fragaria nubicola and Nasturtium montanum, Viola betonicifolia, Rubia manjith, Rubia cordifolia, Senecio scandens, Vitex negundo, Leucoseptum cannum, Polygonum runcinatum, Cinomonum imperssineryium, Trifolium repens, Berberis insignis representing lower values. Hierarchial cluster analysis of the species data revealed close association of species by forming numerous small clusters except Hemipharagma heterophylla and Pilea microflora , Oxalis corniculata and Viola surpense forming distant cluster (fig 14)
Diversity is the index of the ratio between the number of species and the important value of an individual. Shanon index value is highest in Viola surpense followed by Calamintha wallichiana and Fragaria nubicola and being lowest in Cinnomonum imperssineryium, Rubia cordifolia and Berberis insignis etc. (Table 3). Viola surpense is the most dominant species of the study area. All information-statistics indices are affected by both the number of species and their equitability or evenness. A higher number of species and a more even distribution both increase diversity. The evenness index value is maximum in case of Viola surpense followed by Hydrocotyle nepalense ,and Fragaria nubicola . The minimum value was observed in Cinomonum imperssineryium , Rubia cordifolia and Berberis insignis etc.
Table 1. A general synoptic account of forest flora of four selected sites of Senchal Wildlife Sanctuary, Darjeeling, West Bengal, India
Rambhi Rangiroom beat Gaddikhana 6th mile
D % M % D % M % D % M % D % M %
Families 24 88.88 3 11.12 23 82.14 5 17.85 23 88.88 3 11.12 20 83.33 4 16.67
Genera 35 87.5 5 12.5 42 91.30 4 8.69 33 87.5 3 12.5 29 91.31 4 8.69
Species 44 88 6 12 46 92.00 4 8.00 37 88 3 12 30 88.24 4 11.76
D= Dicotyledones ; M=Monocotyledons
Table 2. Phytosociological attributes of different species of Rambhi beat of Senchal Wildlife sanctuary
Plant Name D A F FC A:F RF RD RA IVI
Nasturtium montanum 0.26 2.00 13.30 A 0.15 1.45 0.43 0.74 2.62
Stellaria sikkimensis 2.30 17.25 13.33 A 1.29 1.45 3.80 6.42 11.67
Stellaria media 1.43 10.75 13.33 A 0.80 1.45 2.36 4.00 7.81
Cardamine hirsuta 0.70 7.00 10.00 A 0.70 1.09 1.15 2.60 4.84
Viola betonicifolia 0.33 2.00 16.66 A 0.12 1.81 0.54 0.74 3.09
Viola surpense 18.13 23.65 76.66 D 0.31 8.36 30.01 8.80 47.17
Fragaria nubicola 3.13 31.3 10.00 A 3.13 1.09 5.18 11.65 11.92
Geranium nepalense 2.30 4.31 53.33 C 0.08 5.81 3.80 1.60 11.21
Dichroa febrifuga 0.16 5.00 3.33 B 1.5 0.36 0.26 1.86 2.48
Rubus ellipticus 0.46 2.8 16.66 A 0.16 1.81 0.76 1.04 3.61
Gallium mollugo 1.80 6.00 30.00 B 0.2 3.27 2.20 2.23 8.48
Rubia manjith 0.73 2.44 30.00 B 0.08 3.27 1.20 0.90 5.37
Rubia cordifolia 0.03 1.00 3.33 A 0.30 0.36 0.04 0.37 0.77
Gnaphalium luetoalbum 1.30 9.75 13.33 A 0.73 1.45 2.15 3.63 7.23
Journal of Environment and Ecology ISSN 2157-6092
2013, Vol. 4, No. 1
www.macrothink.org/jee 117
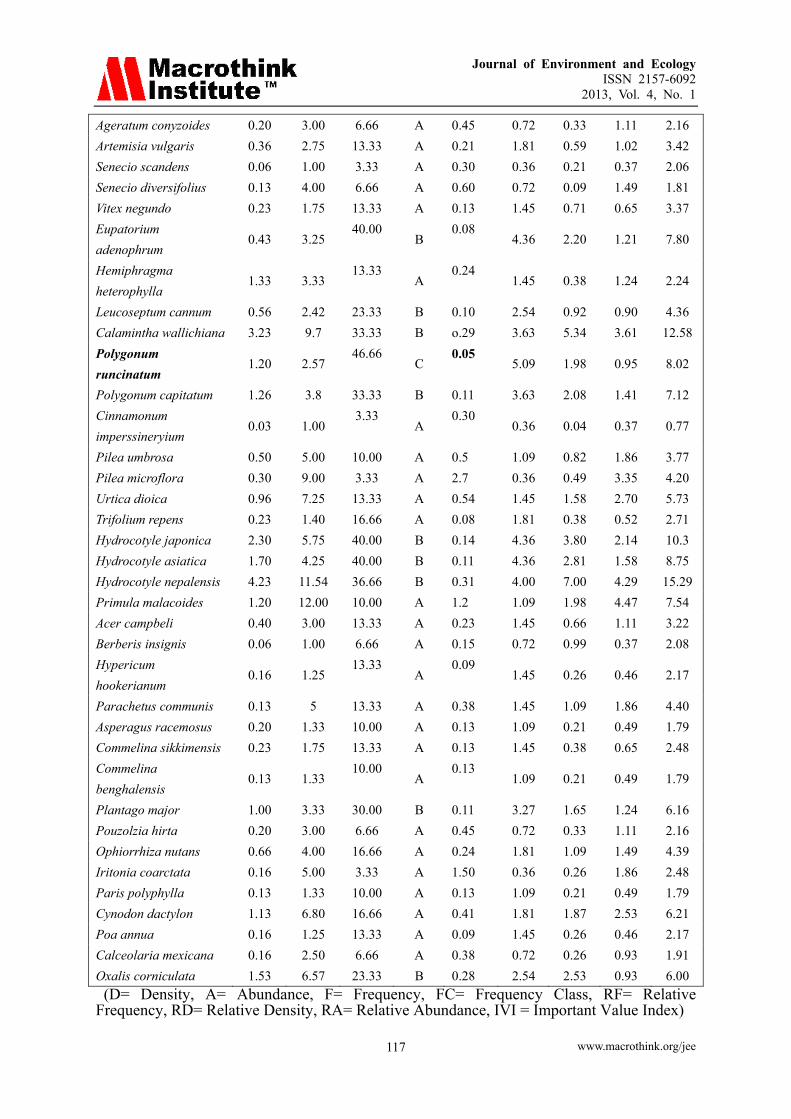
Ageratum conyzoides 0.20 3.00 6.66 A 0.45 0.72 0.33 1.11 2.16
Artemisia vulgaris 0.36 2.75 13.33 A 0.21 1.81 0.59 1.02 3.42
Senecio scandens 0.06 1.00 3.33 A 0.30 0.36 0.21 0.37 2.06
Senecio diversifolius 0.13 4.00 6.66 A 0.60 0.72 0.09 1.49 1.81
Vitex negundo 0.23 1.75 13.33 A 0.13 1.45 0.71 0.65 3.37
Eupatorium
adenophrum 0.43 3.25
40.00 B
0.08 4.36 2.20 1.21 7.80
Hemiphragma
heterophylla 1.33 3.33
13.33 A
0.24 1.45 0.38 1.24 2.24
Leucoseptum cannum 0.56 2.42 23.33 B 0.10 2.54 0.92 0.90 4.36
Calamintha wallichiana 3.23 9.7 33.33 B o.29 3.63 5.34 3.61 12.58
Polygonum
runcinatum 1.20 2.57
46.66 C
0.05 5.09 1.98 0.95 8.02
Polygonum capitatum 1.26 3.8 33.33 B 0.11 3.63 2.08 1.41 7.12
Cinnamonum
imperssineryium 0.03 1.00
3.33 A
0.30 0.36 0.04 0.37 0.77
Pilea umbrosa 0.50 5.00 10.00 A 0.5 1.09 0.82 1.86 3.77
Pilea microflora 0.30 9.00 3.33 A 2.7 0.36 0.49 3.35 4.20
Urtica dioica 0.96 7.25 13.33 A 0.54 1.45 1.58 2.70 5.73
Trifolium repens 0.23 1.40 16.66 A 0.08 1.81 0.38 0.52 2.71
Hydrocotyle japonica 2.30 5.75 40.00 B 0.14 4.36 3.80 2.14 10.3
Hydrocotyle asiatica 1.70 4.25 40.00 B 0.11 4.36 2.81 1.58 8.75
Hydrocotyle nepalensis 4.23 11.54 36.66 B 0.31 4.00 7.00 4.29 15.29
Primula malacoides 1.20 12.00 10.00 A 1.2 1.09 1.98 4.47 7.54
Acer campbeli 0.40 3.00 13.33 A 0.23 1.45 0.66 1.11 3.22
Berberis insignis 0.06 1.00 6.66 A 0.15 0.72 0.99 0.37 2.08
Hypericum
hookerianum 0.16 1.25
13.33 A
0.09 1.45 0.26 0.46 2.17
Parachetus communis 0.13 5 13.33 A 0.38 1.45 1.09 1.86 4.40
Asperagus racemosus 0.20 1.33 10.00 A 0.13 1.09 0.21 0.49 1.79
Commelina sikkimensis 0.23 1.75 13.33 A 0.13 1.45 0.38 0.65 2.48
Commelina
benghalensis 0.13 1.33
10.00 A
0.13 1.09 0.21 0.49 1.79
Plantago major 1.00 3.33 30.00 B 0.11 3.27 1.65 1.24 6.16
Pouzolzia hirta 0.20 3.00 6.66 A 0.45 0.72 0.33 1.11 2.16
Ophiorrhiza nutans 0.66 4.00 16.66 A 0.24 1.81 1.09 1.49 4.39
Iritonia coarctata 0.16 5.00 3.33 A 1.50 0.36 0.26 1.86 2.48
Paris polyphylla 0.13 1.33 10.00 A 0.13 1.09 0.21 0.49 1.79
Cynodon dactylon 1.13 6.80 16.66 A 0.41 1.81 1.87 2.53 6.21
Poa annua 0.16 1.25 13.33 A 0.09 1.45 0.26 0.46 2.17
Calceolaria mexicana 0.16 2.50 6.66 A 0.38 0.72 0.26 0.93 1.91
Oxalis corniculata 1.53 6.57 23.33 B 0.28 2.54 2.53 0.93 6.00
(D= Density, A= Abundance, F= Frequency, FC= Frequency Class, RF= Relative Frequency, RD= Relative Density, RA= Relative Abundance, IVI = Important Value Index)

Journal of Environment and Ecology ISSN 2157-6092
2013, Vol. 4, No. 1
www.macrothink.org/jee 118
Table 3. Diversity Indices of different species of Rambhi beat of Senchal Wildlife sanctuary
Sl. No. Name of the Plants Shanon Index Barger Parker Evenness
1. Nasturtium montanum -0.022 0.004 7.33
2. Stellaria sikkimensis -0.120 0.037 40
3. Stellaria media -0.086 0.023 28.66
4. Cardamine hirsuta -0.049 0.011 16.33
5. Viola betonicifolia -0.026 0.005 8.66
6. Viola surpense -0.360 0.299 120
7. Fragaria nubicola -0.150 0.051 50
8. Geranium nepalense -0.120 0.037 40
9. Dichroa febrifuga -0.015 0.0027 5
10 Rubus ellipticus -0.030 0.007 10
11 Galium mollugo -0.100 0.029 33.33
12 Rubia manjith -0.053 0.012 17.66
13 Rubia cordifolia -0.003 0.0005 1
14 Gnaphalium luetoalbum -0.081 0.021 27
15. Ageratum conyzoides -0.017 0.003 3.33
16. Artemisia vulgaris -0.030 0.006 10
17. Senecio scandens -0.012 0.002 4
18. Senecio diversifolius -0.006 0.001 2
19. Vitex negundo -0.035 0.0071 11.66
20. Eupatorium adenophrum -0.022 0.022 27.66
21. Hemiphragma heterophylla -0.021 0.0038 7
22. Leucoseptum cannum -0.042 0.0093 14
23. Calamintha wallichiana -0.155 0.053 51.66
24. Polygonum runcinatum -0.075 0.019 25
25. Polygonum capitatum -0.078 0.020 26
26. Cinnamonum imperssineryium -0.003 0.0005 1
27. Pilea umbrosa -0.038 0.008 12.66
28. Pilea microflora -0.026 0.0049 8.66
29. Urtica dioica -0.062 0.015 20.66
30. Trifolium repens -0.021 0.0038 7
31. Hydrocotyle japonica -0.120 0.037 40
32. Hydrocotyle asiatica -0.100 0.037 33.33
33. Hydrocotyle nepalensis -0.180 0.069 60
34. Primula malacoides -0.070 0.019 23.33
35. Acer campbeli -0.030 0.0066 10
36. Berberis insignis -0.007 0.0011 2.33
37. Hypericum hookerianum -0.015 0.0027 5
38. Parachetus communis -0.049 0.011 16.33
39. Asperagus racemosus -0.013 0.0022 4.33
40. Commelina sikkimensis -0.022 0.004 7.33
41. Commelina benghalensis -0.012 0.002 4
42. Plantago major -0.066 0.016 22
43. Pouzolzia hirta -0.017 0.003 5.66
44. Ophiorrhiza nutans -0.049 0.011 16.33

Journal of Environment and Ecology ISSN 2157-6092
2013, Vol. 4, No. 1
www.macrothink.org/jee 119
45. Iritonia coarctata -0.017 0.003 5.66
46. Paris polyphylla -0.013 0.0022 4.33
47. Cynodon dactylon -0.072 0.018 24
48. Poa annua -0.017 0.003 5.66
49. Calceolaria mexicana -0.017 0.003 5.66
50. Oxalis corniculata -0.092 0.025 30.66
0
2
4
6
8
10
12
14
Nas
turt
ium
mon
tanu
mS
tella
ria s
kkim
ensi
s S
tella
ria m
edia
Car
dam
ine
hirs
uta
Vio
la b
eton
icifo
lia
Vio
la s
urpe
nse
Fra
garia
nub
icol
aG
eran
ium
nep
alia
nsis
Dic
hroa
febr
ifuga
Rub
us e
lliptic
usG
alliu
m m
ollu
goR
ubia
man
jith
Rub
ia c
ordi
folia
Gna
phal
ium
luet
oalb
umA
gera
tum
con
yzoi
des
Art
emis
ia v
ulga
risS
enec
io s
cand
enS
enec
io d
iver
sifo
lius
Vite
x ne
gund
oE
upat
oriu
m a
deno
phru
mH
emip
hara
gma
hete
roph
ylla
Leuc
osep
tum
can
num
Cal
amin
tha
wal
lichi
ana
Pol
ygon
um r
unci
natu
mP
olyg
onum
cap
itatu
mC
inom
onum
Pile
a um
bros
aP
ilea
mic
roflo
raU
rtic
a di
oica
Trif
oliu
m r
epen
sC
ente
lla a
siat
ica
Hyd
roco
tyle
asi
atic
aH
ydro
coty
e l n
epal
ians
isP
rimul
a m
alac
oide
sA
cer
cam
pbal
iB
erbe
ris in
sign
isH
yper
icum
hoo
keria
num
Par
ache
tus
com
mun
isA
sper
agus
rac
emos
usC
omm
elin
a si
kkim
ensi
sC
omm
elin
a be
ngha
lens
isP
lant
ago
maj
orP
ouzo
lzia
hirt
aO
phio
rrhi
za n
utan
sIr
itoni
a co
arta
taP
aris
pol
yphy
llaC
ynod
on d
acty
lon
Poa
ann
uaC
alce
olar
ia m
exic
ana
Oxa
lis c
orni
cula
ta
Name of Plant sp.
Rel
ativ
e A
bu
nd
ance
Figure 1. Relative abundance of the plant species (n=50) of Rambi Beat
The vegetation of studied areas showed the presence of evergreen plant species. A summary of phytosociological data is summarized in (Table-4).Among all the listed fifty plant species Fragaria nubicola was found leading dominant in most of the stands. Tritonia crocata, Rubus elipticus were found in scarce. The IVI values (Table- 4) revealed that the highest value belongs to the species Fragaria nubicola. The decreasing trend of IVI value was in the order of – Cynodon dactylon, Calamintha walichiana, Gentiana ornate. The highest IVI value of Fragaria nubicola reveals that the species was most dominant in that community and the lowest IVI values of Impatiens urticifolia, Nepeta lamiopsis, Dioscorea bulbifera represent that they are the rare species of that community. The relative abundance of plants species (n=50) were represented in Fig: 2. Higher Shanon index value were recorded in Berberis insignis, Dioscorea bulbifera, Impatiens urticifolia and lowest in Fragaria nubicola, Gentiana ornate, Hemiphragma heterophylla etc.(Table 5) Rangiroom beat revealed close association between the different species with Anaphalis triplinervis and Clinopodium umbrosum and Dichroa febrifuga and Fragaria nubicola forming distant clusters (Fig 15).

Journal of Environment and Ecology ISSN 2157-6092
2013, Vol. 4, No. 1
www.macrothink.org/jee 120
Table 4. Phytosociological attributes of different species of Rangiroom beat of Senchal Wildlife sanctuary
Plant Name D A A:F ratio F C R F R D R A IVI Fragaria nubicola 31.9 34.18 3.35 E 10.20 40.31 13.36 63.87 Gentiana ornata 5.3 14.45 3.61 B 4 6.69 5.65 16.34 Hemiphargma heterophylla 0.23 2.33 2.14 A 1.09 0.29 0.91 2.29 Clinopodium umbrosum 6.5 11.47 1.85 C 6.2 8.21 4.48 18.89 Cynodon dactylon 7.1 14.2 2.60 C 5.46 8.97 5.55 19.98 Galium mollugo 1.76 5.88 1.79 B 3.28 2.22 2.29 7.79 Rubus elipticus 0.1 1 0.92 A 1.09 0.12 0.39 1.6 Gnaphalium luteo-album 2.1 5.72 1.43 B 4 2.65 2.23 8.88 Geranium nepalense 0.46 3.5 2.41 A 1.45 0.58 1.36 3.39 Stellaria sikimensis 2.46 6.72 1.68 B 4 3.10 2.62 9.72 Oxalis corniculata 1.66 6.25 2.15 B 2.91 2.09 2.44 7.44 Hydrocotyle nepalensis 0.2 3 4.17 A 0.72 0.25 1.17 2.14 Rumex nepalensis 2.1 12.6 6.92 A 1.82 2.65 4.92 9.39 Polygonum capitatum 2.53 7.6 2.09 B 3.64 3.19 2.19 9.8 Swertia chiralita 0.2 2 1.83 A 1.09 0.25 0.78 2.12 Trifolium repens 1.56 15.66 14.37 A 1.09 1.97 6.12 9.18 Onaenthe thomsonii 0.83 5 2.75 A 1.82 1.04 1.95 4.81 Viola betonicifolia 1.03 3.44 1.05 B 3.28 1.30 1.34 5.92 Osbeckia stellta 1.43 4.3 1.18 B 3.64 1.80 1.68 7.12 Capsella bursapastoris 0.23 2.33 2.14 A 1.09 0.29 0.91 2.29 Hydrocotyl asiatica 0.6 2.25 0.78 B 2.91 0.75 0.87 4.53 Eupatorium adenophrum 0.1 1.5 2.08 A 0.72 0.12 0.58 1.42 Rubia cordifolia 0.46 4.66 4.28 A 1.09 0.58 1.82 3.49 Stellaria media 1.73 7.42 2.91 B 2.55 2.18 2.90 7.63 Polygonum runcinatum 03 4.5 6.25 A 0.72 0.37 1.75 2.84 Pilea umbrosa 0.53 8 11.11 A 0.72 0.66 3.12 4.5 Urtica dioica 0.23 3.5 4.86 A 0.72 0.29 1.36 2.37 Impatiens urticifolia 0.03 1 2.78 A 0.36 0.03 0.39 0.78 Elsholtzia flava 0.66 3.33 1.53 A 2.18 0.83 1.30 4.31 Hydrocotyle himalaica 1.16 5 1.96 B 2.55 1.46 1.95 5.96 Commelina sikkimensis 0.13 2 A 0.72 0.16 0.78 1.66 Hypericum hookerinum 0.06 1 A 0.72 0.07 0.39 1.18 Ophiorrhiza nutans 0.06 2 A 0.36 0.75 0.78 1.89 Anaphalis triplinervis 0.33 5 A 0.72 041 1.95 3.08 Berberis insignis 0.03 1 A 0.36 0.03 0.39 0.78 Dichroa febrifuga 0.46 7 A 0.72 0.58 2.73 4.03 Acer campbelli 0.1 1.5 A 0.72 0.12 0.58 1.42 Plantago erosa 0.16 5 A 0.36 0.20 1.95 3.51 Pouzolzia hirta 0.33 5 A 0.72 0.41 1.95 3.08 Dioscorea bulbifera 0.03 1 A 0.36 0.03 0.39 0.70 Paris polyphylla 0.03 1 A 0.36 0.03 0.39 0.78 Ocimum sanctum 0.5 5 A 1.09 0.63 1.95 3.67 Nepeta cataria 0.03 1 A 0.36 0.03 0.39 0.78 Sonchus arvensis 0.06 1 A 0.72 0.07 0.39 1.18 Lindenbergia grandifilora 0.26 2 A 1.45 0.32 0.78 2.55 Artemisia vulgaris 0.43 3.25 A 1.45 0.54 1.27 3.26 Drymaria diandra 0.1 1.5 A 0.72 0.12 0.58 1.42 Gaultheria fragrantissima 0.26 4 A 0.72 0.32 1.56 2.6 Calceolaria mexicana 0.16 1.66 A 1.09 0.20 0.64 1.93 Iritonia coarctata 0.13 2 A 0.72 0.16 0.78 1.66
(D= Density, A= Abundance, F= Frequency, FC= Frequency Class, RF= Relative Frequency, RD= Relative Density, RA= Relative Abundance, IVI = Important Value Index)

Journal of Environment and Ecology ISSN 2157-6092
2013, Vol. 4, No. 1
www.macrothink.org/jee 121
Table 5. Diversity Indices of different species of Rangiroom beat of Senchal Wildlife sanctuary
Name of the Plants Shanon Index(Hs)
Bergar and Parker(DBP)
Evenness: (E)
Fragaria nubicola -0.36 0.4022 120 Gentiana ornata -0.18 0.0668 60 Hemiphargma heterophylla -0.016 0.0029 5.33 Clinopodium umbrosum -0.20 0.0819 66.66 Cynodon dactylon -0.216 0.0895 72 Galium mollugo -0.084 0.0222 28 Rubus elipticus -0.008 0.0012 2.66 Gnaphalium luteo-album -0.095 0.0264 31.66 Geranium nepalense -0.025 0.0058 9.66 Stellaria sikimensis -0.107 0.0311 35.66 Oxalis corniculata -0.08 0.0210 26.66 Hydrocotyle nepalensis -0.014 0.0025 4.66 Rumex nepalensis -0.09 0.0264 30 Polygonum capitatum -0.10 0.0319 33.33 Swertia chiralita -0.014 0.0025 4.66 Trifolium repens -0.07 0.0197 23.33 Onaenthe thomsonii -0.04 0.0105 13.33 Viola betonicifolia -0.056 0.0130 18.66 Osbeckia stellta -0.072 0.0180 24 Capsella bursapastoris -0.016 0.0029 5.33 Hydrocotyle asiatica -0.036 0.0075 12 Eupatorium adenophrum -0.008 0.0012 2.66 Rubia cordifolia -0.029 0.0058 9.66 Stellaria media -0.08 0.0218 26.66 Polygonum runcinatum -0.020 0.0037 6.66 Pilea umbrosa -0.033 0.0067 11 Urtica dioica -0.010 0.0029 3.33 Impatiens urticifolia -0.003 0.0004 1 Elsholtzia flava -0.04 0.0084 13.33 Hydrocotyle himalaica -0.06 0.0147 20 Commelina sikkimensis -0.01 0.0016 3.33 Hypericum hookerinum -0.005 0.0008 1.66 Ophiorrhiza nutans -0.005 0.0008 1.66 Anaphalis triplinervis -0.022 0.0042 7.33 Berberis insignis -0.003 0.0004 1 Dichroa febrifuga -0.02 0.0058 6.66 Acer campbelli -0.008 0.0012 2.66 Plantago erosa -0.01 0.0021 3.33 Pouzolzia hirta -0.02 0.0042 6.66 Dioscorea bulbifera -0.003 0.0004 1 Paris polyphylla -0.003 0.0004 1 Ocimum sanctum -0.03 0.0063 10 Nepeta cataria -0.003 0.0004 1 Sonchus arvensis -0.005 0.0008 1.66 Lindenbergia grandifilora -0.018 0.0033 6 Artemisia vulgaris -0.028 0.0054 9.33 Drymaria diandra -0.008 0.0012 2.66 Gaultheria fragrantissima -0.0018 0.0033 6 Calceolaria mexicana -0.012 0.0021 4 Iritonia coarctata -0.01 0.0016 3.33

Journal of Environment and Ecology ISSN 2157-6092
2013, Vol. 4, No. 1
www.macrothink.org/jee 122
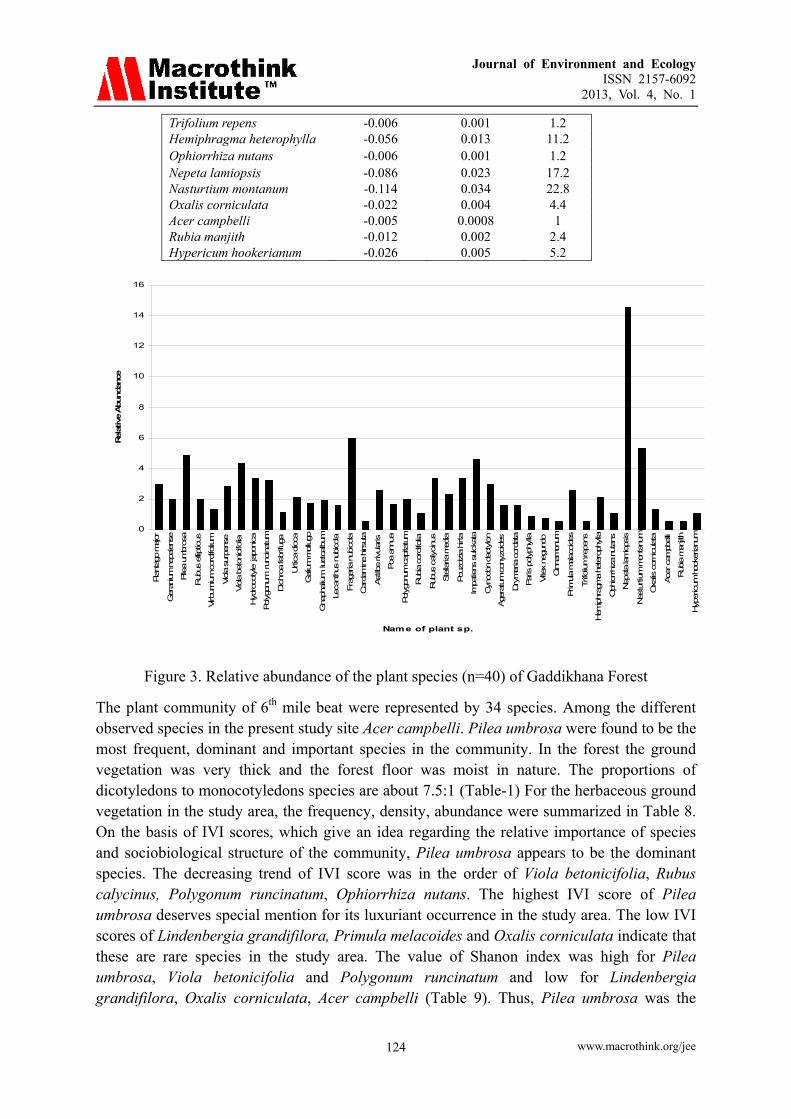
The plant community of Gaddikhana forest range were represented by 40 species belonging to 36 genera from 26 families. Viola betonicifolia was found to be the most frequent, dominant and important species in the community. In the forest the ground vegetation was very thick and the forest floor was moist in nature. The proportions of dicotyledonous to monocotyledons species are about12.99:1 (Table-1.)For the herbaceous ground vegetation in the study area, the phytosociological attributes were summarized in Table 6. The decreasing trend of IVI value was in the order of – Pilea umbrosa ,Rubus calycinus ,Nepeta lamiopsis .The highest IVI value of Viola betonicifolia reveals that the species was most dominant in that community and the Lowest IVI values of Trifolium repens, Rubia cordifolia represent that they are the rare species of that community.Shannon index value were highest for Viola betonicifolia followed by Pilea umbrosa, Rubus calycinus and lowest in Acer campbelli, Cardamine hirsuta etc. (Table 7). Thus, Viola surpense is the most dominant species of the study area.On the other hand the evenness index value is maximum in case of Viola betonicifolia followed by Pilea umbrosa, Rubus calycinus, Polygonum capitatum and minimum is of Cardamine hirsute, Acer campbelli etc. Data pertaining to fig 3 reveals higher relative abundance for Fragaria nubicola and Nepeta lamiopsis.Distant clustering of plant species were observed between Drymeria cordata and Nasturtium montanum and Primula malacoides and Nepeta lamiopsis . (Fig16)
Table 6. Phytosociological attributes of different species of Gaddikhana of Senchal Wildlife sanctuary
Plant Name D A F A:F ratio RF RD RA IVI Plantago major 1.15 5.75 20 0.28 1.76 1.91 2.98 6.65 Geranium nepalense 2.65 3.78 70 0.05 6.19 4.42 1.96 12.57 Pilea umbrosa 7.05 9.40 75 0.13 6.63 11.75 4.87 23.25 Rubus ellipticus 2.05 4.72 55 0.09 4.86 3.41 1.93 10.20 Virburnium cordifolium
1.50 2.50 60 0.04
5.30 2.50 1.29 9.09
Viola surpense 2.15 5.37 40 0.13 3.53 3.58 2.78 9.71 Viola betonicifolia 7.95 8.36 95 0.09 8.40 13.26 4.33 25.99 Hydrocotyle japonica 2.90 6.44 45 0.14 3.98 4.83 3.34 12.15 Polygonum runcinatum
4.30 6.14 70 0.09
6.19 7.17 3.18 16.54
Dichroa febrifuga 0.85 2.12 40 0.05 3.53 1.41 1.10 5.86 Urtica dioca 0.20 4.00 5 0.8 0.44 0.33 2.07 2.84 Galium mollugo 0.50 3.33 15 0.22 1.32 0.83 1.72 3.87 Gnaphalium luetoalbum
0.55 3.66 15 0.24
1.32 0.91 1.89 4.12
Lecanthus nubicola 0.90 3.00 30 0.1 2.65 1.50 1.55 5.70 Fragaria nubicola 1.15 11.5 10 1.15 0.88 1.91 5.96 8.75 Cardamine hirsuta 0.05 1.00 5 0.2 0.44 0.08 0.51 1.03 Astilbe rivularis 0.25 5.00 5 1 0.44 0.41 2.59 3.44 Poa annua 1.10 3.14 35 0.09 3.09 1.83 1.62 6.54 Polygonum capitatum 1.90 3.80 50 0.08 4.42 3.16 1.97 9.55 Rubia cordifolia 0.10 2.00 5 0.4 0.44 0.16 1.03 1.63 Rubus calycinus 4.90 6.53 75 0.09 6.63 8.17 3.38 18.18 Stellaria media 2.45 4.45 55 0.08 4.86 4.08 2.30 11.24 Pouzolzia hirta 1.95 6.50 30 0.22 2.65 3.25 3.37 9.27 Impatiens sulcata 4.00 8.88 45 0.19 3.98 6.67 4.60 15.25 Cynodon dactylon 0.85 5.66 15 0.38 1.32 1.41 2.93 5.66

Journal of Environment and Ecology ISSN 2157-6092
2013, Vol. 4, No. 1
www.macrothink.org/jee 123
Ageratum conyzoides 0.15 3.00 5 0.6 0.44 0.25 1.53 2.24 Drymeria cordata 0.15 3.00 5 0.6 0.44 0.25 1.53 2.24 Paris polyphylla 0.40 1.60 25 0.06 2.21 0.66 0.83 3.70 Vitex negundo 0.20 1.33 15 0.09 1.32 0.33 0.69 2.34 Cinnamonum impressineyium
0.05 1.00 5 0.2
0.44 0.88 0.51 1.83
Primula malacoides 0.25 5.00 5 1 0.44 0..41 2.59 3.44 Trifolium repens 0.10 1.00 10 0.1 0.88 0.16 0.51 1.55 Hemiphragma heterophylla
0.80 4.00 20 0.2
1.76 1.33 2.07 5.16
Ophiorrhiza nutans 0.25 2.00 5 0.4 0.44 0.41 1.03 1.88 Nepeta lamiopsis 1.40 28.00 5 5.6 0.44 2.33 14.52 17.29 Nasturtium montanum 2.05 10.25 20 0.51 1.76 3.41 5.31 10.48 Oxalis corniculata 0.25 2.50 10 0.25 0.88 0.41 1.29 2.58 Acer campbelli 0.05 1.00 5 0.2 0.44 0.88 0.51 1.83 Rubia manjith 0.15 1.00 15 0.07 1.32 0.25 0.51 2.08 Hypericum hookerianum
0.30 2.00 15 0.13
1.32 0.50 1.03 2.85
(D= Density, A= Abundance, F= Frequency, FC= Frequency Class, RF= Relative Frequency, RD= Relative Density, RA= Relative Abundance, IVI = Important Value Index)
Table 7. Diversity Indices of different species of Gaddikhana forest of Senchal Wildlife sanctuary
Name of the Plants Shanon Index Barger Parker Evenness Plantago major -0.075 0.0192 15 Geranium nepalense -0.137 0.0443 27.4 Pilea umbrosa -0.251 0.1178 50.2 Rubus ellipticus -0.115 0.0342 23 Virburnium cordifolium -0.092 0.025 18.4 Viola surpense -0.117 0.035 23.4 Viola betonicifolia -0.267 0.132 53.4 Hydrocotyle japonica -0.145 0.048 29 Polygonum runcinatum -0.187 0.071 37.4 Dichroa febrifuga -0.059 0.014 11.8 Urtica dioca -0.017 0.003 3.4 Galium mollugo -0.038 0.008 7.6 Gnaphalium luetoalbum -0.042 0.009 8.4 Lecanthus nubicola -0.062 0.015 12.4 Fragaria nubicola -0.075 0.019 15 Cardamine hirsuta -0.005 0.0008 1 Astilbe rivularis -0.022 0.004 4.4 Poa annua -0.072 0.018 14.4 Polygonum capitatum -0.107 0.031 21.4 Rubia cordifolia -0.006 0.001 1.2 Rubus calycinus -0.203 0.081 40.6 Stellaria media -0.128 0.04 25.6 Pouzolzia hirta -0.11 0.032 22 Impatiens sulckata -0.179 0.066 35.8 Cynodon dactylon -0.059 0.014 11.8 Ageratum conyzoides -0.012 0.002 2.4 Drymeria cordata -0.012 0.002 0.4 Paris polyphylla -0.03 0.006 6 Vitex negundo -0.017 0.003 3.4 Cinnamonum impressineyium -0.005 0.0008 1 Primula malacoides -0.022 0.004 4.4
Journal of Environment and Ecology ISSN 2157-6092
2013, Vol. 4, No. 1
www.macrothink.org/jee 124
Trifolium repens -0.006 0.001 1.2 Hemiphragma heterophylla -0.056 0.013 11.2 Ophiorrhiza nutans -0.006 0.001 1.2 Nepeta lamiopsis -0.086 0.023 17.2 Nasturtium montanum -0.114 0.034 22.8 Oxalis corniculata -0.022 0.004 4.4 Acer campbelli -0.005 0.0008 1 Rubia manjith -0.012 0.002 2.4 Hypericum hookerianum -0.026 0.005 5.2
0
2
4
6
8
10
12
14
16
Plant
ago
major
Ger
anium
nep
alen
se
Pile
a um
bros
a
Rub
us e
lliptic
us
Virb
urnium
cor
difo
lium
Viola s
urpe
nse
Viola b
eton
icifo
lia
Hyd
roco
tyle jap
onica
Polyg
onum
run
cina
tum
Dichr
oa fe
brifu
ga
Urtica
dioc
a
Galium
mollugo
Gna
phalium
lue
toalbu
m
Leca
nthu
s nu
bico
la
Fra
garia
nub
icola
Car
dam
ine
hirs
uta
Ast
ilbe
rivular
is
Poa
ann
ua
Polyg
onum
cap
itatu
m
Rub
ia c
ordifo
lia
Rub
us c
alyc
inus
Ste
llaria
med
ia
Pou
zolzia h
irta
Impa
tiens
sulck
ata
Cyn
odon
dac
tylon
Age
ratu
m c
onyz
oide
s
Dry
mer
ia c
orda
ta
Par
is p
olyp
hylla
Vite
x ne
gund
o
Cinna
mon
um
Prim
ula
malac
oide
s
Trif
olium
rep
ens
Hem
iphr
agm
a he
tero
phylla
Oph
iorrhiza
nut
ans
Nep
eta
lam
iops
is
Nas
turtium
mon
tanu
m
Oxa
lis c
ornicu
lata
Ace
r ca
mpb
elli
Rub
ia m
anjith
Hyp
ericum
hoo
keria
num
Name of plant sp.
Rel
ativ
e Abundan
ce
Figure 3. Relative abundance of the plant species (n=40) of Gaddikhana Forest
The plant community of 6th mile beat were represented by 34 species. Among the different observed species in the present study site Acer campbelli. Pilea umbrosa were found to be the most frequent, dominant and important species in the community. In the forest the ground vegetation was very thick and the forest floor was moist in nature. The proportions of dicotyledons to monocotyledons species are about 7.5:1 (Table-1) For the herbaceous ground vegetation in the study area, the frequency, density, abundance were summarized in Table 8. On the basis of IVI scores, which give an idea regarding the relative importance of species and sociobiological structure of the community, Pilea umbrosa appears to be the dominant species. The decreasing trend of IVI score was in the order of Viola betonicifolia, Rubus calycinus, Polygonum runcinatum, Ophiorrhiza nutans. The highest IVI score of Pilea umbrosa deserves special mention for its luxuriant occurrence in the study area. The low IVI scores of Lindenbergia grandifilora, Primula melacoides and Oxalis corniculata indicate that these are rare species in the study area. The value of Shanon index was high for Pilea umbrosa, Viola betonicifolia and Polygonum runcinatum and low for Lindenbergia grandifilora, Oxalis corniculata, Acer campbelli (Table 9). Thus, Pilea umbrosa was the

Journal of Environment and Ecology ISSN 2157-6092
2013, Vol. 4, No. 1
www.macrothink.org/jee 125
most dominant species in the study area and reveals its extensive distribution. The evenness index value is high in case of Pilea umbrosa followed by Viola betonicifolia, Rubus calycinus, Polygonum runcinatum, Geranium nepalense and low was in case of Primula melacoides, Lindenbergia grandifilora, Oxalis corniculata. Higher relative abundance value were recorded for Pilea umbrosa, Viola betonicifolia.(Fig-4) Hierarchial cluster analysis of the species data of 6th mile beat revealed numerous group clustering between Hydrocotyle nepalense and Commelina sikkimensis , Rubus calycinus and Viola bentonicifolia , Ophiorhizza nutans and Pilea umbrosa , Viola bentonicifolia and Iritonia coacrtata (Fig 17).
Rank abundance diagrams visually describe the allocation of individuals to species in communities. A more complete description of a community could be obtained by plotting the proportional abundance of every species against its rank of abundance. Data represented in fig (5,6 and 7) reveals higher proportion of frequency class 0.6-1for Rangiroom beat, a homogenized frequency class distribution (0-2) for Gaddikhana forest range and higher proportion of frequency class 0.51 to 1.52 for 6th mile beat.
Table 8. Phytosociological attributes of different species of 6th mile beat of Senchal Wildlife sanctuary
Plant Name D A F A:F ratio
RF RD RA IVI
Polygonum runcinatum
6.95 8.17 85 0.09 8.58 10.19 8.17 21.21
Geranium nepalense 3.8 4.47 85 0.05 8.58 5.57 4.47 16.73 Hydrocotyle nepalensis
3.1 4.66 45 0.10 4.54 3.08 4.66 10.31
Galium mollugo 1.9 4.47 40 0.11 4.04 2.78 4.47 9.4 Pilea umbrosa 12.7 13.36 95 0.14 9.59 18.63 13.36 35.93 Viola betonicifolia 9.35 10.38 90 0.12 9.90 13.71 10.38 28.48 Lecanthus peduncularis
0.2 4 5 0.8 0.50 0.29 4 2.98
Plantago erosa 1.6 5.33 30 0.17 3.03 2.34 5.33 8.28 Fragaria nubicola 1.75 5.83 30 0.19 3.03 2.56 5.83 8.78 Gnaphalium affine 1.35 9 15 0.6 1.51 1.98 9 8.41 Rubus elipticus 0.5 1.66 30 0.06 3.03 0.73 1.66 4.66 Dichroa febrifuga 1.2 4.8 25 0.19 2.52 1.75 4.8 6.89 Stelaria media 2.95 9.83 30 0.33 3.03 4.32 9.83 12.75 Acer campbelli 0.2 2 10 0.2 1.01 0.29 2 2.39 Pauzolzia hirta 0.15 3 5 0.6 0.50 0.22 3 2.36 Virburnium cordifolium
0.7 2 35 0.06 3.53 1.02 2 5.64
Rubus calycinus 7.45 8.27 90 0.09 9.09 10.93 8.27 24.54 Galinsuga perviflora 0.3 3 10 0.3 1.01 0.44 3 3.09 Trifolium repens 0.25 2.5 10 0.25 1.01 0.36 2.5 2.83 Primula melacoides 0.05 1 5 0.2 0.50 0.07 1 1.11 Commelina sikkimensis
0.05 6.5 10 0.65 1.01 0.36 6.5 4.93
Impatiens urticifolia 1.75 8.75 20 0.44 2.02 2.56 8.75 9.37 Lindenbergia grandifilora
0.05 1 5 0.2 0.50 0.07 1 1.11
Chenopodium album 0.75 3 25 0.12 2.52 1.10 3 5.26 Ophiorrhiza nutans 5.95 9.9 60 0.17 6.06 8.73 9.9 20.21 Iritonia coarctata 0.8 16 5 3.2 0.50 1.17 16 10.43

Journal of Environment and Ecology ISSN 2157-6092
2013, Vol. 4, No. 1
www.macrothink.org/jee 126
Arisaema graffithi 0.35 3.5 10 0.35 1.01 0.51 3.5 3.43 Hemiphargma heterophyllum
0.6 4 15 0.27 1.51 0.88 4 4.58
Cynodon dactylon 0.15 3 15 0.2 0.05 0.22 3 2.36 Drymaria diandra 0.3 2 15 0.13 1.51 0.44 2 3.04 Chrysanthemum pyrethroides
1.05 4.2 25 0.17 2.52 1`.54 4.2 6.36
Cardamine hirsuta 0.4 8 5 1.6 0.05 0.58 8 5.46 Polygonum nepalensis 0.4 4 10 0.4 0.01 0.58 4 3.69 Oxalis corniculata 0.1 1 10 0.1 0.01 0.14 1 1.69 (D= Density, A= Abundance, F= Frequency, FC= Frequency Class, RF= Relative Frequency, RD= Relative Density, RA= Relative Abundance, IVI = Important Value Index)
Table 9. Diversity Indices of different species of 6th mile island of Senchal Wildlife sanctuary
Name of the Plants Shanon Index Barger Parker Evenness
Polygonum runcinatum -0.23 0.101 46
Geranium nepalense -0.15 0.055 30
Hydrocotyle nepalensis -0.1 0.03 20
Galium mollugo -0.09 0.027 18
Pilea umbrosa -0.31 0.184 62
Viola betonicifolia -0.27 0.136 54
Lecanthus peduncularis -0.012 0.002 2.4
Plantago erosa -0.086 0.023 17.2
Fragaria nubicola -0.092 0.025 18.4
Gnaphalium affine -0.075 0.019 15
Rubus elipticus -0.034 0.007 6.8
Dichroa febrifuga -0.069 0.017 13.8
Stelaria media -0.133 0.042 26.6
Acer campbelli. -0.006 0.001 1.2
Pauzolzia hirta -0.012 0.002 2.4
Virburnium cordifolium -0.046 0.01 9.2
Rubus calycinus -0.024 0.108 48
Galinsuga perviflora -0.022 0.004 4.4
Trifolium repens -0.017 0.003 3.4
Primula melacoides -0.005 0.0007 1
Commelina sikkimensis -0.042 0.009 8.4
Impatiens urticifolia -0.092 0.025 18.4

Journal of Environment and Ecology ISSN 2157-6092
2013, Vol. 4, No. 1
www.macrothink.org/jee 127
Lindenbergia grandifilora -0.005 0.0007 1
Chenopodium album -0.046 0.01 9.2
Ophiorrhiza nutans -0.21 0.086 42
Iritonia coacrtata -0.049 0.011 9.8
Arisaema graffithi -0.026 0.005 5.2
Hemiphargma heterophyllum -0.038 0.008 7.6
Cynodon dactylon -0.012 0.002 2.4
Drymaria diandra -0.022 0.004 4.4
Chrysanntemum pyrethroides -0.062 0.015 12.4
Cardamine hirsuta -0.026 0.005 5.2
Polygonum nepalensis -0.026 0.005 5.2
Oxalis corniculata -0.006 0.001 1.2
0
0.5
1
1.5
2
2.5
3
Polygonum
runcinatum
Geranium nepalense
Hydrocotyle nepalensis
Galium mollugo
Pilea um
brosa
Viola betonicifolia
Lecanthus peduncularis
Plantago erosa
Fragaria nubicola
Gnaphalium affine
Rubus elipticus
Dichroa febrifuga
Stelaria media
Acer campbellii.
Pauzolzia hirta
Virburnium cordifolium
Rubus calycinus
Galinsuga perviflora
Trifolium repens
Prim
ula melacoides
Com
melina sikkimensis
Impatiens urticifolia
Lindenbergia grandifilora
Chenopodium album
Ophiorrhiza nutans
Iritonia coartata
Arisaema graffithi
Hem
iphargma heterophyllum
Cynodon dactylon
Drymaria diandra
Chrysanntemum
pyrethrrides
Cardamine hirsuta
Polygonum
nepalensis
Oxalis corniculata
Name of Plant sp.
Log10 value of Abundance
Figure 4. Relative abundance of the plant species (n=50) of 6th Mile Beat forest.

Journal of Environment and Ecology ISSN 2157-6092
2013, Vol. 4, No. 1
www.macrothink.org/jee 128
Figure I
0-0.5 (A)
0.6-1(B)
1.1-1.5(C)
1.6-2(D)
2.1-2.5(E)
2.6-3(F)
0
2
4
6
8
10
12
14
16
0-0.5 (A) 0.6-1(B) 1.1-1.5(C) 1.6-2(D) 2.1-2.5(E) 2.6-3(F)
Log 10 Scale
Number Of Species
Number of Species
Figure 5. Log-rank abundance of plant species of Rangiroom Forest
0
2
4
6
8
10
12
0-0.5 0.6-1.0 1.1-1.5 1.6-2.0 2.1-2.5
Log 10 scale
No. of Plant sp.
Figure 6. Log-rank abundance of plant species of Gaddikhana Forest
Rank Abundance of Plant species
0
2
4
6
8
10
0-0.5 0.51-1.0 1.01-1.52 1.53-2.03 2.04-2.5
Log 10 Scale
No. of S
pecies
Figure 7. Log-rank abundance of plant species of 6th Mile Beat Forest
3.2 Pedological Characteristics
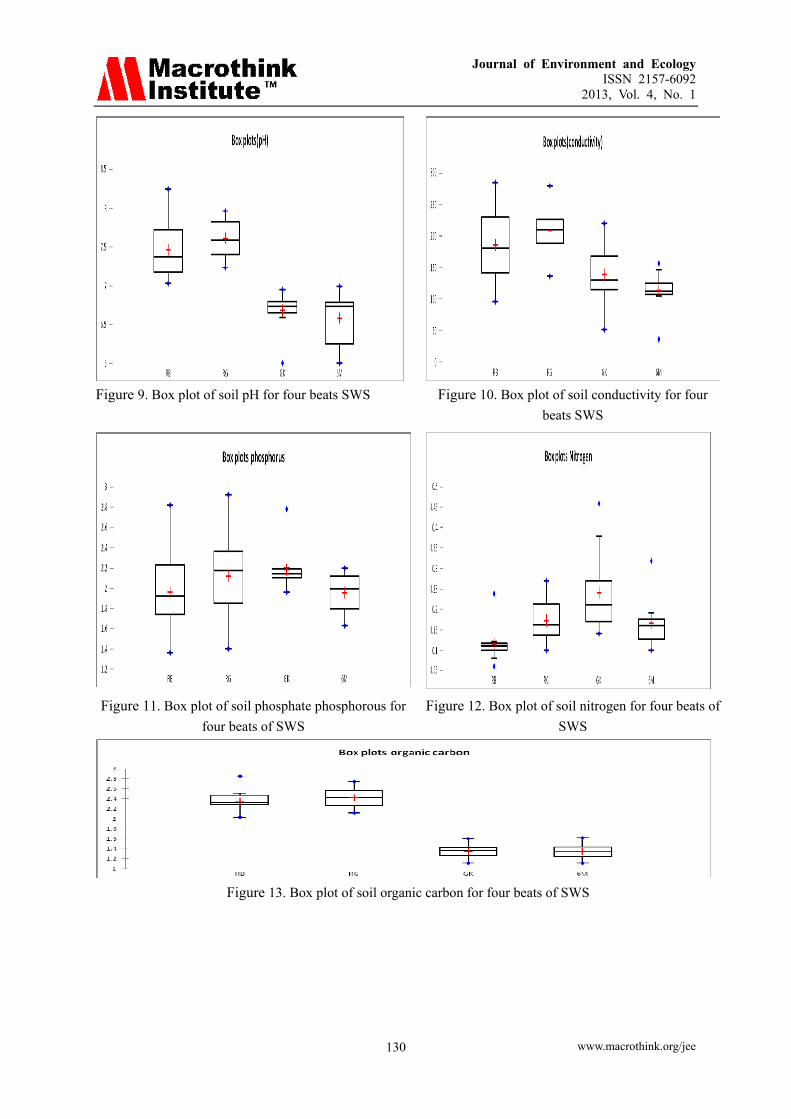
Soil factors include all the physical, chemical and biological properties of the soil. The nature of the soil profile, soil pH and the nutrient cycle between the soil and the trees are some of the important dimensions in determining the site quality. The pH of the soil ranged from 7.03 to 8.24 for Rambhi beat,7.23 to7.96 for Rangiroom beat, clearly indicating that the soil is alkaline in nature and there is not much variation in the pH values of different soil samples (Table 10). The pH of the soil samples Gaddikhana forest and 6th mile beat revealed acidic nature and there

Journal of Environment and Ecology ISSN 2157-6092
2013, Vol. 4, No. 1
www.macrothink.org/jee 129
is not much variation in the pH values of different soil samples (Table 10) .The conductivity value of pedons of Rambhi and Rangiroom beat were relatively higher in comparison to other studied sites (Table 10). The soil available P ranged between 1.72 to 2.82 g/kg for Rambhi beat;1.4 to 2.92 g/kg for Rangiroom beat; 1.97 to 2.78 g/kg for Gaddikhana forest;1.63 to 2.20 g/kg for 6 mile beat. The level of total nitrogen were found to be higher in Rangiroom beat and Gaddikhana forest in comparison to other two studied sites.( Table 10) The soil analyzed for percentage organic carbon revealed elevated level of organic carbon(%) in Rambhi beat and Rangiroom beat in comparison to Gaddikhana and 6 mile beat (Table: 10). Hierarchial cluster analysis of the pedological data revealed close association of organic carbon and nitrogen forming cluster for Rambhi beat.pH and N , conductivity and organic carbon forming closely spaced clusters in Rangiroom beat.pH and organic carbon, nitrogen and phosphorous forming close clusters for Gaddikhana forest range and phosphorous and organic carbon forming close clusters for 6th mile beat.(Fig 5,6,7 and 8) Box plot of the 10 pedons of each studied sites revealed much wider variation of soil pH for Rambhi and 6th mile island among the 10 pedons. Soil conductivity reflected much wider variation among the different pedons of Rambhi beat.Soil phosphate phosphorous results revealed least variation among the 10 pedons of Gaddikhana forest range .Pedons of Rangiroom beat and Gaddikhana forest range showed significant variation among the 10 pedons in comparison two two other sites. Organic carbon did not showed significant variation among the pedons of four studied sites.(Fig 9,10,11,12 and 13)
pH Conducti N Org C P
0.00
0.37
0.75
1.12
Variables
Distance
Clustering of pedons of Rambhi beat
pH N P Conducti Org C
0.00
0.28
0.56
0.84
Variables
Distance
Clustering of pedons of Rangiroom beat
Figure 5. Clustering of pedons of Rambhi beat Figure 6. Clustering of pedons of Rangiroom beat
pH Org C Conducti N P
0.00
0.35
0.70
1.05
Variables
Distance
Clustering of pedons of Gaddikhana forest
Conducti pH N P Org C
0.00
0.21
0.41
0.62
Variables
Distance
Clustering of pedons of 6th mile island
Figure 7. Clustering of pedons of Gaddikhana forest Figure 8. Clustering of pedons of 6th mile beat
Journal of Environment and Ecology ISSN 2157-6092
2013, Vol. 4, No. 1
www.macrothink.org/jee 130
Figure 9. Box plot of soil pH for four beats SWS Figure 10. Box plot of soil conductivity for four
beats SWS
Figure 11. Box plot of soil phosphate phosphorous for
four beats of SWS Figure 12. Box plot of soil nitrogen for four beats of
SWS
Figure 13. Box plot of soil organic carbon for four beats of SWS

Journal of Environment and Ecology ISSN 2157-6092
2013, Vol. 4, No. 1
www.macrothink.org/jee 131
Figure 14. Clustering of plant species for Rambi beat Figure 15. Clustering of plant species for
Rangiroom beat beat
Figure 16. Clustering of plant species for Figure 17.Clustering of plant species for
Gaddikhana forest range 6th mile island
4. Discussion
In order to assess ecological knowledge of the native flora in Eastern Himalayas in general and Sikkim Himalaya in particular., aquantitative phytosociological study in different was carried out. Importance value index (I.V.I.) for each plant species was determined to quantify the importance of each species.The vegetation of the studied sites is composed of evergreen vegetation. The disturbance is mainly due to the extensive cutting of tress for fuel and for

Journal of Environment and Ecology ISSN 2157-6092
2013, Vol. 4, No. 1
www.macrothink.org/jee 132
fodder, overgrazing, removal of economically important trees, defective forest management and some other biotic interferences. These activities are responsible in converting natural vegetation to semi natural vegetation. An important component of any ecosystem is the species it contains. Species also serves as good indicators of the ecological condition of a system (Morgenthal, et al., 2001). A list of all species collected during the study was compiled. The floristic composition of different area was also compared. The species composition of the four studied sites was considerably different. Vegetation analysis gives the information necessary to determine the name of community and provide data that can be used to compare it with other communities. Four to five plant communities: Viola surpense , Fragaria nubicola, Viola betonicifolia and Pilea umbrosa were observed as a leading dominant. The communities with strong single species dominance has been attributed to grazing, species competition, seed predation, disease, stability and niche diversification (Whittaker and Levin 1977, Harper 1977). The rarer plant species with poor representation in our samples need proper attention from plant biologists to determine their conservation status and key functions. Nasturtium montanum, Dichroa febrifuga, Rubia cordifolia, Cinomonum imperssineryium, in Rambhi forest beat; Eupatorium adenophrum, Rubus elipticus, Impatiens urticifolia, Berberis insignis, Dioscorea bulbifera, Paris polyphylla, Nepeta cataria in Rangiroom beat, Cardamine hirsute, Cinnamonum impressineyium, Trifolium repens, Acer campbelli, Rubia manjith in Gaddikhana forest range, Primula melacoides, Lindenbergia grandifilora, Oxalis corniculata in 6th mile beat. The communities in the study area were heterogeneous. The absence of certain frequencies classes in the communities reflected the heterogeneity of the vegetation, which is either due to biotic disturbance or the floral poverty. The result obtained by Raunkiaer (1934) may be regarded only as possibilities to be confirmed by other alternative approaches. The ratio of abundance to frequency for different species was calculated to elicit the distributional patterns. This ratio indicates regular (0.025), random (0.025-0.05) and contagious (>0.05) distributions (Curtis and Cottam 1956). In our present investigation most of the studied plant species were contagious in distribution except Polygonum runcinatum for Rambhi beat, Geranium nepalense and Dichroa febrifuga for Gaddikhana forest , Geranium nepalense for 6th mile island showing random distribution.
The concept of species diversity relates simply to “richness” of a community or geographical area in species. At the simplest level of examination, species diversity corresponds to the number of species present. Species diversity is considered to be an important attribute of community organization and allowed comparison of the structural characteristics of the communities. It is often related to community dynamics stability, productivity, integration, evolution, structure and competition. The idea of displacement of one species through competition with other is net prime importance. The ecology of different plant communities from different sites of Senchel wildlife sanctuary showed variation in nature, structure, composition of vegetation and soil characteristics. Most of the species were evergreen in nature. The majority of individuals of plant population were seen in danger. Various types of activities have modified the plant cover over wide areas. There is a need to develop plant-protected areas. Scientific information relating to the composition of vegetation can be helpful for proper rehabilitation of the affected area because this forms the basic element for the conservation of important and endangered flora and fauna of any region. Protection of the
Journal of Environment and Ecology ISSN 2157-6092
2013, Vol. 4, No. 1
www.macrothink.org/jee 133
natural flora from overgrazing is necessary, especially during the time when the desirable plants set their seeds. Protection is essential to maintain the desirable forage plant species in a good proportion, to avoid invader plant species and to rehabilitate the destroyed natural flora (Arshad, et al., 2002). We must carry out our efforts to make a list of the plant species, which can be lost from the natural environment, otherwise it will leads to desertification. Desertification associated with human activities has been recognized over the past two decades as one of the important facets of ongoing global environmental change (Verstraete and Schwartz, 1991; UNEP,1997; Huenneke, et al., 2002) and Species loss can alter the goods and services provided by ecosystems (Hooper, et al., 2005).
The variable rate of frequency class distribution at four studied sites of Senchel wildlife sanctuary may be explained by a common biological explanation pattern which implies most dominant species appeared to colonize a new area appropriates a fraction of the available resources and by competitive interaction, preempts that fraction. The second species then preempts a similar fraction of the remaining resource and so on with further colonists.
Soil pH gives some measure of general level of fertility (Wilde 1954). Grubb (1963) noted low pH (4.2) with poor exchangeable potassium in Montane Forest soil. Acidic nature of different pedons of Gadikhana forest and 6 mile beat may be attributed towards the acidifying effect of intense decomposition products of organic residues accumulated on the forest floor since remote past. Higher level of conductivity of different pedons of Rambhi and Rangiroom beat maybe attributed towards higher decomposition rate of leaf litter along with higher mineralization rate of the pedons of respective study sites.
The present study indicate significantly lower organic-C in Gaddikhana and 6 mile beat than remaining sites, and it may result due to (a) by prominent deforestation by people for fuel purpose (b) intensive cattle grazing, and (c) heavily eroded surface area (unpublished observation). All these three factors may attribute to low input of organic matter into the soil. The contact between the plant residues and microbes in erosional soil is reduced and may result in lower decomposition. Thus, inputs of organic matter decreases and output of soil organic matter increases in erosional soils. According to Srivastava & Singh (1991), deforestation (conversion of forest into cropland) may result in loss of 51.2% organic-C in the Vindhyan plateau. Higher level of total nitrogen in the different pedons of Rangiroom beat and Gaddikhana forest may be attributed towards low vegetation demand for the nutrients and increase in supply due to microbial cell death (Jaramillo & Sanford 1985).Level of soil phosphate phosphorous were found to be higher for Rambhi and Rangiroom beat might be attributed towards physico-chemical release of inorganic and organic phosphorous by organic acids through the action of lower molecular weight organic anions such as oxalate which can replace phosphorous sorbed at metal hydroxide surfaces through ligand exchange reactions and dissolved metal oxide surfaces that sorb phosphorous (Fox et al, 1990) under higher decomposition rate of litter.
The differential responses of the different pedons of the forest areas under study to different parameters are possibly an outcome of their unique abiotic composition, the interactions between biotic and abiotic components and between themselves and the prevailing climatic

Journal of Environment and Ecology ISSN 2157-6092
2013, Vol. 4, No. 1
www.macrothink.org/jee 134
condition. This information can be used in future for laying out schemes optimization of forest ecosystems.
The reconstruction of plant communities on disturbed sites with a species composition similar to that of the natural area will require allocation of more financial inputs. The saving and establishment of plant communities one of the major tasks facing by ecologist. Extensive work on the development of vegetation depends upon good indigenous vegetation recovery. Preservation of these communities especially within disturbed sites is more generally, demands a unique and pressing conservation challenge. extensive cutting of tress for fuel and for fodder, overgrazing, removal of economically important trees, defective forest management and some other biotic interferences affecting the nature, structure and composition of plant communities. Periodical ecological survey, knowledge of vegetation and their relationship with soil characteristic can be helpful for future development project Plant ecological surveys of all the disturbed and threatened areas on permanent basis are required to know their current biodiversity situation and future continuity status. The impact of anthropogenic alteration of habitats in Senchal forest has to be taken into account. The policymakers should focus their conservation efforts in the fragile ecosystem. Since species diversity is important to maintain heterogeneity of a stable ecosystem, the diversity is to be preserved through appropriate measures. Since this forest is likely to have generous impact on socio-economic conditions of local stakeholders, its ecorestoration and protection is of utmost importance.
References
Ashby, W. R. (1974). Einfuhrung in die kybernetik. Frankfurt/ M. pp: 416.
Banerjee, S., Pal, P., & Banerjee, S. K. (1985). Soil characteristics and Floristic composition of some sub-alpine forest of Darjeeling West Bengal. Indian Nath Sci. Acad., 51(2), 450-457.
Banerjee, S. P., Nath, S., & Banerjee, S. K. (1986). Phytosociology and soil Characteristics of Forest in the Eastern Himalayas. Intern J Trop Agri, 4(2), 116-125.
Bremner, J. M., & Mulvaney, C. S. (1982). Nitrogen total In: A.C. Miller, RH & Kieney,D.R.(Eds.)Method of soil analysis Part2:Chemical and Microbiological methods (2nd edition) Agronomy series No.9 AC Miller R.H. & Kieney, D.R.(Eds.) (pp:595-624).Medison, WI:American Society for Agronomy and Soil Sciences.
Chanda, S., & Palit, D. (2009). Ecological Study on plant diversity and pedological characteristics in Rangiroom forest beat, Senchal West Zone Forest Range, Darjeeling. Pleione, 3(1), 50-58.
Chandran, P. et al. (1987). Soil Characteristics under different Forest cover in the Eastern Himalayas. Indian Agris, 2, 93-99.
Chapin III, F. S., & Korner, C. (1995). Patterns, causes, changes and consequences of biodiversity in arctic and alpine ecosystems. In Chapin III, F. S., & Kmrner, C. (Eds.), Arctic and alpine biodiversity: Patterns, causes and ecosystem consequences (pp. 313-320). Springer, Berlin. http://dx.doi.org/10.1007/978-3-642-78966-3_22
Journal of Environment and Ecology ISSN 2157-6092
2013, Vol. 4, No. 1
www.macrothink.org/jee 135
Cornell, H.V., & Lawton, J. H. (1992). Species interactions, local and regional processes, and limits to the richness of ecological communities: a theoretical perspective. J. Anim. Ecol., 61, 1-12. http://dx.doi.org/10.2307/5503
Curtis, J. T., & Cottam, G. (1956). Plant Ecology Workbook Laboratory Field Reference Manual. Burgess Publishing Co. Minnesota 193.
Das, A. P., & Lahiri, A. K. (1997). Phytosociological studies of the ground covering flora in different types of vegetation in Tiger Hill, Darjeeling District, West Bengal (India). Indian For, 123(12), 1176 -1187.
Day, F. P. Jr., & Monk, C. D. (1974). Vegetation patterns on a southern Appalachian watershed. Ecology, 55, 1064-1074. http://dx.doi.org/10.2307/1940356
Dhir, R. P. (1967). Pedological Characteristics of Soil of the North Western Himalayas. J. India Soc. Soil Sci., 15, 61-69.
Fox, T. R., Comeford, N.B., & Fee. (1990). Kinetics of phosphorous release from spodosols: Effect of oxalate and formate. Soil Science Society Amerca. Journal, 54, 1441-1447.
Grubb, P. J. (1963). A comparison of Montana and lowland rainforest, Equador. Journal of Ecology, 51, 567-601. http://dx.doi.org/10.2307/2257748
Harper, J. L. (1977). Population Biology of Plants. Academic Press, New York.
Hooper, D. U., & Vitousek, P. M. (1997). The effects of plant composition and diversity on ecosystem processes. Science, 277, 1302-1305. http://dx.doi.org/10.1126/science.277.5330.1302
Hooper, et.al. (2005). Effects of biodiversity on ecosystem functioning: a consensus of current knowledge, Ecol. Monogr, 75, 3-35. http://dx.doi.org/10.1890/04-0922
Host, G. E., & Pregitzer, K. S. (1992). Geomorphic influences on ground-flora and over story composition in upland for- Plant diversity in boreal forest of north-western Lower Michigan. Canadian Journal of Forest Research, 22, 1547-1555. http://dx.doi.org/10.1139/x92-205
Huenneke, et.al. (2002). Desertification alters patterns of aboveground net primary production in Chihuahua ecosystems. Biology, 8, 247–264.
Huston, M.A. (1994). Biological diversity. Cambridge University Press, Cambridge.
Jaramillo, V. J., & Sanford, R. L. J. R. (1985). Nutrient cycling in tropical deciduous forests. (pp. 347-362.) In S.H. Bullock, H.A. Mooney & E.O. Medina (Eds.), Seasonally Dry Tropical Forests. Academic Press Inc, London.
Kull, K., & Zobel, M. (1991). High species richness in an Estonian wooded meadow. Journal of Vegetation Science, 2, 711-714. http://dx.doi.org/10.2307/3236182
Magurran, A. E. (1988). Ecological diversity and its measurement. Princeton University Press, Princeton. http://dx.doi.org/10.1007/978-94-015-7358-0

Journal of Environment and Ecology ISSN 2157-6092
2013, Vol. 4, No. 1
www.macrothink.org/jee 136
Marks, P. L., & Harcombe, P. A. (1981). Forest vegetation of the Big Thicket, southeast Texas. Ecological Mono-graphs, 51, 287-305. http://dx.doi.org/10.2307/2937275
Morgenthal, et. al. (2001). The vegetation of ash disposal sites at Hendrina Power Station II: Floristic composition South African Journal of Botany, 67(4), 520 - 532.
Nath, et.al. (1998). Changes in Soil Attributes Consequent Upon Differences in Forest Cover in a Plantation Area. Indian Soc. Soil Sc, 36, 515-521.
Oechel, et.al. (eds.) (1997). Global change and arctic terrestrial ecosystems. Springer, Berlin. http://dx.doi.org/10.1007/978-1-4612-2240-8
Olsen,et.al. (1954). Estimation of available phosphorous in soils by extraction with sodium bicarbonate. U.S. Department of Agriculture Circular, 939, 1-19
Pal, D.K., Nath, S., & Banerjee, S. K. (1984). Pedological Characteristics of some soils of the Darjeeling Himalayan Region. Soc. Soil Sci, 32, 16-24.
Patrick, R. (1997). Biodiversity: Why is it important? In ReakaKudla, M. L., Wilson, D. E., & Wilson, E.O. (Eds.), Biodiversity II (pp. 15-24). Joseph Henry Press, Washington, DC.
Pollock, M. M., Naiman, R. J., & Hanley, T. A. (1998). Plant species richness in riparian wetlands - a test of biodiversity theory. Ecology, 79, 94-105.
Rai, U., & Das, A.P. (2008). Diversity of Trees in the Darjiling Foothill Region of Eastern Himalaya. NBU J. Pl. Sci, 2, 39-57.
Rannie, W. F. (1986). Summer air temperature and number of vascular species in arctic Canada. Arctic, 39, 133-137.
Raunkiaer, C. (1934). The life forms of plants and statistical. Plant Geography, Being the collected papers of C. Raunkiaer. (pp.632)Oxford, Clarendon Press.
Reynolds, H. L. & Tenhunen, J. D. (Eds.) (1996). Landscape function and disturbance in Arctic tundra. Springer, Berlin. http://dx.doi.org/10.1007/978-3-662-01145-4
Rhodes, J. D. (1982) Soluble salts. In Page,A.C.,Miller RH and Kieney,D.R.(Eds.)Method of soil analysis Part2:Chemical and Microbiological methods (2nd edition) Agronomy series No.9Page AC Miller RH and Kieney,DR(Eds.) pp:167-180.Medison, WI:American Society for Agronomy and Soil Sciences pp167-180.
Rodgers, W. A., & Sawarkar, V. B. (1988). Vegetation management in Wildlife Protected Areas in India. Aspects of Applied Biology, 16, 407-422.
Srivastava, S. C., & Singh, J. S. (1991). Microbial biomass C, N and P in dry tropical forest soils: Effect of alternate land-uses and nutrient flux. Soil Biology & Biochemistry, 23, 117-124. http://dx.doi.org/10.1016/0038-0717(91)90122-Z
Ter Baak C. J. F. (1987). The analysis of vegetation environmental relationship by canonical correspondence analysis. Vegetatio, 69, 69-77. http://dx.doi.org/10.1007/BF00038688

Journal of Environment and Ecology ISSN 2157-6092
2013, Vol. 4, No. 1
www.macrothink.org/jee 137
United Nations Environment Program (UNEP). (1997). World Atlas of Desertification. 2nd ed. Edward Arnold, London, and Wiley, New York, USA.
Verstraete, M. M., & Schwartz, S. A. (1991). Desertification and global change, Vegetatio, 91, 3-13. http://dx.doi.org/10.1007/BF00036043
Whittaker, R. H., & Niering, W. A. (1975). Vegetation of the Santa Catalina mountains, Arizona.
Whittaker, R. H., & Levin, S. A. (1977). The role of mosaic phenomena in mosaic communities.Theoretical Population Biology, 12, 117-139. http://dx.doi.org/10.1016/0040-5809(77)90039-9
Wilde, S. A. (1954). Reaction of soils: Facts and facilities. Ecology, 35, 89-99. http://dx.doi.org/10.2307/1931409