species tree reconstruction of a poorly resolved clade of...
TRANSCRIPT
Molecular Phylogenetics and Evolution 68 (2013) 671–682
Contents lists available at SciVerse ScienceDirect
Molecular Phylogenetics and Evolution
journal homepage: www.elsevier .com/ locate /ympev
Species tree reconstruction of a poorly resolved clade of salamanders(Ambystomatidae) using multiple nuclear loci
1055-7903/$ - see front matter Published by Elsevier Inc.http://dx.doi.org/10.1016/j.ympev.2013.04.013
⇑ Corresponding author. Address: DNA Analysis Facility on Science Hill at YaleUniversity, 170 Whitney Ave., ESC Room 150, New Haven, CT 06511, USA. Fax: +1203 432 7394.
E-mail address: [email protected] (J.S. Williams).
Joshua S. Williams a,⇑, John H. Niedzwiecki b, David W. Weisrock a
a Department of Biology, University of Kentucky, Lexington, KY 40506, USAb Department of Biology, Belmont University, Nashville, TN 37212, USA
a r t i c l e i n f o a b s t r a c t
Article history:Received 13 June 2012Revised 14 April 2013Accepted 16 April 2013Available online 28 April 2013
Keywords:Coalescent analysisConcordance analysisBayesian analysisGene treeSpecies treeAmbystoma
The analysis of diverse data sets can yield different phylogenetic estimates that challenge systematists toexplain the source of discordance. The mole salamanders (family Ambystomatidae) are a classic exampleof this phylogenetic conflict. Previous attempts to resolve the ambystomatid species tree using allozymic,morphological, and mitochondrial sequence data have yielded different estimates, making it unclearwhich data source best approximates ambystomatid phylogeny and which ones yield phylogeneticallyinaccurate reconstructions. To shed light on this conflict, we present the first multi-locus DNAsequence-based phylogenetic study of the Ambystomatidae. We utilized a range of analyses, includingcoalescent-based methods of species-tree estimation that account for incomplete lineage sorting withina locus and concordance-based methods that estimate the number of sampled loci that support a partic-ular clade. We repeated these analyses with the removal of individual loci to determine if any locus has adisproportionate effect on our phylogenetic results. Collectively, these results robustly resolved manydeep and relatively shallow clades within Ambystoma, including the placement of A. gracile and A. talpoid-eum as the sister clade to a clade containing all remaining ambystomatids, and the placement of A. mac-ulatum as the sister lineage to all remaining ambystomatids excluding A. gracile and A. talpoideum. BothBayesian coalescent and concordance methods produced similar results, highlighting strongly supportedbranches in the species tree. Furthermore, coalescent-based analyses that excluded loci produced over-lapping species-tree posterior distributions, suggesting that no particular locus – including mtDNA – dis-proportionately contributed to our species-tree estimates. Overall, our phylogenetic estimates havegreater similarity with previous allozyme and mitochondrial sequence-based phylogenetic estimates.However, intermediate depths of divergence in the ambystomatid species tree remain unresolved, poten-tially highlighting a region of rapid species radiation or a hard polytomy, which limits our ability to com-ment on previous morphologically-based taxonomic groups.
Published by Elsevier Inc.
1. Introduction
Systematists are often challenged to explain phylogenetic con-flict arising from the analysis of diverse data sets (e.g., morpholog-ical and molecular data) (Shaffer et al., 1991; Wiens andHollingsworth, 2000). Individual data sets can be phylogeneticallymisleading if parallel evolution has produced homoplastic charac-ters, a problem inherent in both morphological and molecularcharacters (Hillis, 1987). Furthermore, properties of the underlyingphylogeny itself can facilitate inaccurate estimation when terminalbranches are long relative to internal branches [e.g., long branchattraction (Felsenstein, 1978)]. While further exploration of indi-
vidual data sets can sometimes identify the source of discordance(e.g., Wiens and Hollingsworth, 2000), in other studies individualdata sets can yield convincingly strong support, precluding resolu-tion of the conflict. In these situations, collection of additional datafrom an independently evolving source will be necessary to eluci-date phylogenetic history and shed light on the source of the initialphylogenetic conflict.
Phylogenetic reconstruction of multiple independent loci canalso yield discordance among gene trees, a product of a numberof processes, including incomplete lineage sorting (deep coales-cence) and lateral gene transfer (Maddison, 1997). Concatenatedphylogenetic analysis of loci represents a traditional approach toresolving a prevailing species tree from a collection of loci, withthe potential to yield strongly supported trees when large numbersof loci are considered, even when there is gene tree discordance(Rokas and Carroll, 2005). However, despite this potential, concat-enation has been shown to have a high probability for statistical
672 J.S. Williams et al. / Molecular Phylogenetics and Evolution 68 (2013) 671–682
inconsistency when there is substantial gene tree discordance,resulting in strongly supported yet inaccurate phylogenies (Kubat-ko and Degnan, 2007; Weisrock et al., 2012). Methods that esti-mate a species tree from independently estimated gene trees,including those that account for the stochastic nature of geneticdrift in the lineage-sorting process, may be more likely to recon-struct the true species phylogeny, despite strongly supported dis-cordance among gene trees (Edwards et al., 2007; Leache andRannala, 2011).
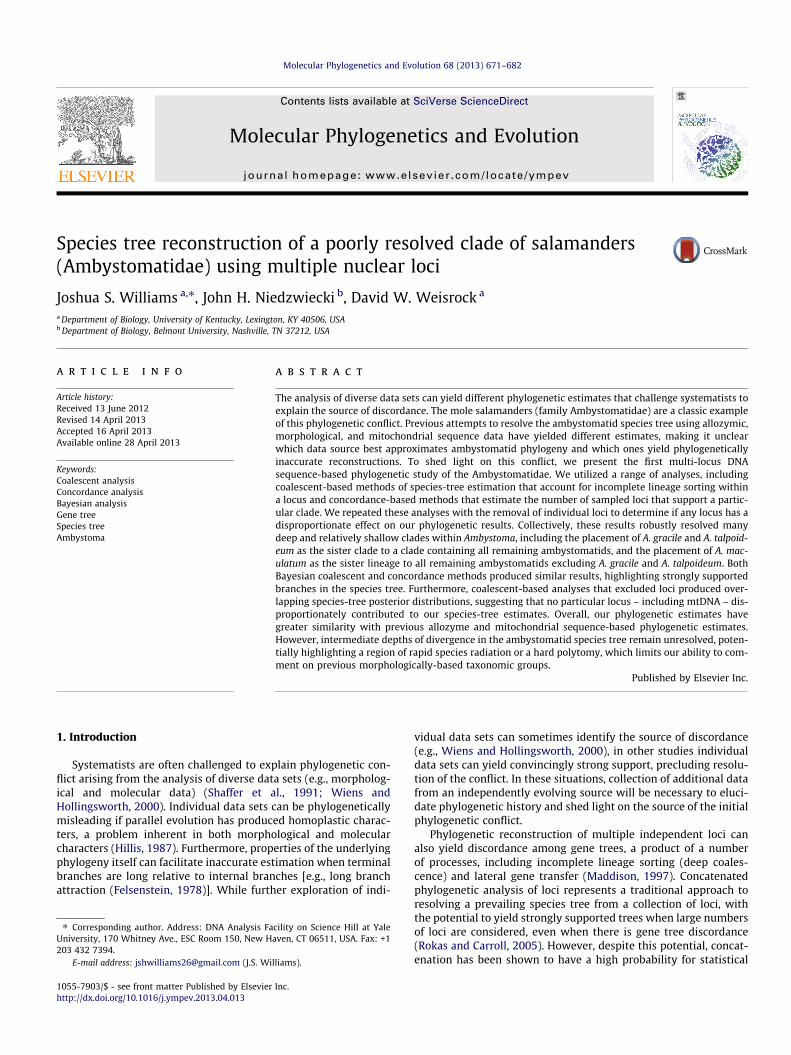
The phylogeny of salamander species of the family Ambystom-atidae represents a classic example of phylogenetic conflict arisingfrom the analysis of very different data sources (Shaffer et al.,1991). The Ambystomatidae are broadly distributed across NorthAmerica, and feature a diverse array of life-history phenotypes.This includes a radiation of US and Mexican species (the tiger sal-amanders) that vary in their propensity to metamorphose, and agroup of unisexual populations in eastern North America that areputatively of hybrid origin. Phylogenetic analyses of allozymicand morphological data sets collected from sexual Ambystoma spe-cies (and representative tiger salamander species) yield a numberof discordant topological patterns. The strongest of these involvesa morphologically supported clade, named Linguaelapsus, com-prising Ambystoma annulatum, A. barbouri, A. cingulatum, A. mabeei,and A. texanum (Fig. 1A) (Kraus, 1988). In contrast, parsimony andmaximum-likelihood analysis of allozymic data strongly supportvery different placements of these taxa within the Ambystoma tree(Fig. 1B). A number of other relationships differ between the two
A. macrodactylumA. maculatumA. opacum
Ambystoma gracile
A. cingulatum
A. talpoideum
A. jeffersonianum
A. annulatum
A. laterale
A. mabeei
A. californiense
A. barbouriA. texanum
A. tigrinumA
B
A. texanumA. barbouri
A. tigrinumA. californiense
A. laterale
A. macrodactylumA. jeffersonianum
A. mabeei
A. annulatum
Ambystoma talpoideum
A. opacum
A. maculatumA. gracileA. cingulatum
97
94
100
96
5942
22
91
74
10077
50
65
73
8169
100
69
65
100
Fig. 1. Morphological (A) and allozyme (B) based phylogenetic hypotheses forAmbystoma from previous published work (Kraus, 1988; Shaffer et al., 1991). (A)The morphological tree was based on 32 morphological characters. Numbers onbranches represent bootstrap values. (B) The allozyme tree was based on 26allozyme characters. Numbers on branches represent jackknife values. In both treesmembers of Linguaelapsus are highlighted in red. (For interpretation of thereferences to color in this figure legend, the reader is referred to the web versionof this article.)
data sources, including the morphological placement of A. gracileas the sister lineage to all other Ambystoma species. However, theLinguaelapsus clade has been highlighted as a particularly strikingexample of discordance between morphological and moleculardata sets (Shaffer et al., 1991). Combined analysis of the data onlyweakly supports the Linguaelapsus clade (Jones et al., 1993; Shaf-fer et al., 1991), but individual data sets each strongly support dif-ferent placements for its component taxa. Whether or not thisdiscordance results from homoplasy in one, or both, data sets, orextreme non-independence among characters is not clear.
Phylogenetic reconstruction of the Ambystomatidae using mul-tiple independent sources of DNA sequence data represents onestep towards elucidating the factors causing this strong discor-dance. There have been previous attempts to reconstruct ambys-tomatid phylogeny using mtDNA sequence data. Bogart (2003)presented a phylogenetic tree based on cytochrome b (cytb) and16S sequence data that included all species of Ambystoma, exceptfor A. annulatum. This tree placed A. texanum and A. barbouri to-gether in a clade, with A. mabeei maintaining a close relationshipwith these two species; however, the Linguaelapsus clade wasnot recovered. In a subsequent mtDNA study of the origin of uni-sexual ambystomatids using cytb sequence data, Robertson et al.(2006) resolved a clade that contained Linguaelapsus species (A.annulatum was not sampled) along with representative tiger sala-mander taxa. However, this clade – and the majority of interspe-cific relationships – received very low parsimony and Bayesianbranch support. This study may also have been misled by the inclu-sion of a nuclear paralog of cytb (Bi and Bogart, 2010).
In this study, we have presented the first multi-locus nuclearDNA sequence data set ever collected to resolve phylogenetic rela-tionships among sexual species of Ambystoma. We included repre-sentatives of nearly all sexual species, including multiplerepresentatives of the diverse tiger salamander clade. Sequencedata were generated from 14 nuclear loci, a majority of which werelocated on separate linkage groups, and a mitochondrial locus. Toavoid the complexities and challenges associated with sampling al-leles from heterozygous individuals for use in concatenated phylo-genetic analysis (Weisrock et al., 2012), we focused on analysesthat allow for the independent reconstruction of locus-specificgene trees. We explored gene-tree discordance among loci usinga Bayesian estimate of clade concordance (Ane et al., 2007), andwe focused our species-tree reconstruction on methods that usea coalescent model to account for gene-tree discordance throughmechanisms of incomplete lineage sorting (Heled and Drummond,2010; Kubatko et al., 2009). Simulation studies indicate that thesemethods outperform concatenation in species-tree reconstructionwhen phylogenetic history features short branches and/or largeeffective population sizes (Leache and Rannala, 2011), conditionsthat should increase the probability of an incomplete lineage sort-ing event and discordance among gene trees. Finally, we gaugewhether any individual gene has a disproportionate effect on spe-cies tree reconstruction. Overall, our results provide strong resolu-tion for many regions of the ambystomatid phylogeny, yethighlight a region of the tree containing short internal branchlengths and weak branch support that still lacks strong evidence,for or against, the Linguaelapsus clade.
2. Materials and methods
2.1. Taxonomic and genetic sampling
A total of 33 individuals were sampled from 18 extant Ambys-toma species, with 1–4 representative individuals per species(Table 1). This sampling included five representative lineages ofthe taxonomically diverse A. tigrinum species complex based on

Table 1Information for the individuals of Ambystoma and Dicamptodon used in this study. Tissue number abbreviations are as follows: DWW, David W. Weisrock tissue collection; HBS, H.Bradley Shaffer tissue collection; JSE, Jim Demastes tissue collection; LSU, Louisiana State University Collection of Genetic Resources; MVZ, Museum of Vertebrate Zoology,University of California, Berkeley.
Species Tissue source Locality # of Loci sequenced
Ambystoma annulatum DWW 0364 Warren Co., MO, USA 15A. barbouri DWW 0363 Jessamine Co., KY, USA 15A. bishopi HBS 18028 Jackson Co., FL, USA 15A. bishopi HBS 18036 Okaloosa Co., FL, USA 15A. cingulatum HBS 8197 Liberty Co., FL, USA 15A. cingulatum HBS 18030 Baker Co., FL, USA 14A. gracile MVZ 161801 Mendocino Co., CA, USA 15A. gracile MVZ 173465 Lane Co., OR USA 15A. jeffersonianum LSU H1207 PA, USA 15A. laterale MVZ 188017 Hants Co., Nova Scotia, Canada 15A. laterale JSE60a Beherens Ponds, Linn Co., IA, USA 15A. laterale MVZ 173468 Cook Co., IL, USA 15A. mabeei MVZ 144890 Scotland Co., SC, USA 15A. macrodactylum MVZ 137198 Missoula Co., MT, USA 15A. macrodactylum MVZ 144895 Linn Co., OR, USA 15A. macrodactylum MVZ 161822 Santa Cruz Co., CA, USA 15A. maculatum MVZ 144934 Wake Co., NC, USA 15A. maculatum MVZ 187999 Halifax Co., Nova Scotia, Canada 15A. maculatum LSU H15983 LA, USA 15A. opacum LSU H513 LA, USA 15A. talpoideum LSU H15996 LA, USA 15A. talpoideum MVZ 144946 Berkeley Co., SC, USA 15A. texanum LSU H18514 LA, USA 15A. texanum MVZ 144954 Douglas Co., KS, USA 15A. tigrinum HBS 7247 Goshen Co., WY, USA 15A. tigrinum HBS 7877 Washington Co., UT, USA 15A. mexicanum DWW 1774 Area Laguna del Toro, Mexico 15A. californiense HBS 6687 Jepson Praire Solano Co., CA, USA 13A. californiense HBS 26367 Sonoma Co., CA, USA 15A. tigrinum DWW 2548 Alachua Co., FL, USA 15A. tigrinum DWW 2554 Alachua Co., FL, USA 15A. ordinarium HBS 25134 San Jose Lagunillas, Mexico 15A. ordinarium HBS 24978 El Pedregoso, Mexico 15Dicamptodon aterrimus MVZ 203271 Idaho Co., ID, USA 1D. aterrimus MVZ 187983 Valley Co., ID, USA 3D. aterrimus MVZ 187986 Valley Co., ID, USA 3D. copei MVZ 197777 Grays Harbor Co., WA, USA 3D. copei MVZ 223515 Mason Co., WA, USA 4D. ensatus MVZ 230027 San Mateo Co., CA, USA 3D. ensatus MVZ 249022 Napa Co., CA, USA 3D. tenebrosus MVZ 246114 Mendocino Co., CA, USA 3D. tenebrosus MVZ 187929 Trinity Co., CA, USA 1
J.S. Williams et al. / Molecular Phylogenetics and Evolution 68 (2013) 671–682 673
divergent lineages in the mtDNA gene tree (Shaffer and McKnight,1996), and all diploid sexual species outside this clade. The Ambys-tomatidae also contains a complex of unisexual populations with acomplicated evolutionary history (Bi and Bogart, 2010), and repre-sentatives from this group were not included in this study. To rootthe Ambystoma tree, 1–2 samples were included from all four ex-tant Dicamptodon species (seven total individuals). Dicamptodonis the most appropriate outgroup for phylogenetic reconstructionwithin Ambystoma as numerous molecular studies consistentlyestablish these genera as sister clades (Frost et al., 2006; Larson,1991; Roelants et al., 2007; Weisrock et al., 2005; Wiens et al.,2005). DNA was extracted from tissues using a Qiagen DNeasyBlood and Tissue kit following the standard protocol. GenomicDNA quantity and quality were assessed using a NanoDrop 2000Spectrophotometer (Thermoscientific) and through electrophore-sis on a 1.3% agarose gel.
Mitochondrial DNA sequence data were collected from a regionencompassing the nad2 gene region and the tRNATrp and tRNAAla
genes using primers previously published in Weisrock et al.(2001). Nuclear sequence data were collected from 14 loci identi-fied from EST-based genome resources developed for the MexicanAxolotl, A. mexicanum, and eastern tiger salamander, A. tigrinum(Putta et al., 2004). Primer sequences for each locus are in Table 2.All PCR reactions were performed in a total volume of 20 lL, and
comprised 14.1 lL of water, 2 lL of Taq buffer (with MgCl2),0.4 lL of dNTPs, 0.7 lL of each primer, 0.1 lL of Taq DNA polymer-ase, and 2 lL of template DNA. In each reaction we used approxi-mately 50 ng of genomic DNA. Most loci were PCR amplifiedwith 35 cycles of denaturing at 95 �C for 45 s, annealing at 55 �Cfor 45 s, and extension at 72 �C for 30 s. All PCR runs opened with95 �C for 3 min and concluded with a 5 min extension stage at72 �C. For loci and individuals that were troublesome to amplify,a gradient PCR was used with the same PCR protocol as outlinedabove, except that the annealing phase consisted of a 45–65 �C gra-dient across the 12 columns of the thermalcycler block. To avoidcontamination, negative controls were run for each set of PCRsusing 2 lL of water instead of DNA. All reactions were run on a1.3% agarose gel, using 0.8 lL of EZ-Vision One 6X loading dye with4 lL of PCR product for each well.
To phase alleles from heterozygous individuals with indels ormultiple polymorphic sites, PCR products were cloned using anInvitrogen TOPO-TA Cloning Kit. Culture plates were made withLB agar, 40 mg of X-gal per mL of dimethylformamide, and mixedwith 50 lg/mL of kanamycin. Colonies were grown overnight at37 �C, subsequently picked from plates, and lysed in 25 lL TE Buf-fer for 5 min at 95 �C. 2 lL of lysed cells were used in the PCR pro-tocol outlined above using standard M13 forward and reverseprimers. Four separate colonies were sequenced for each cloning
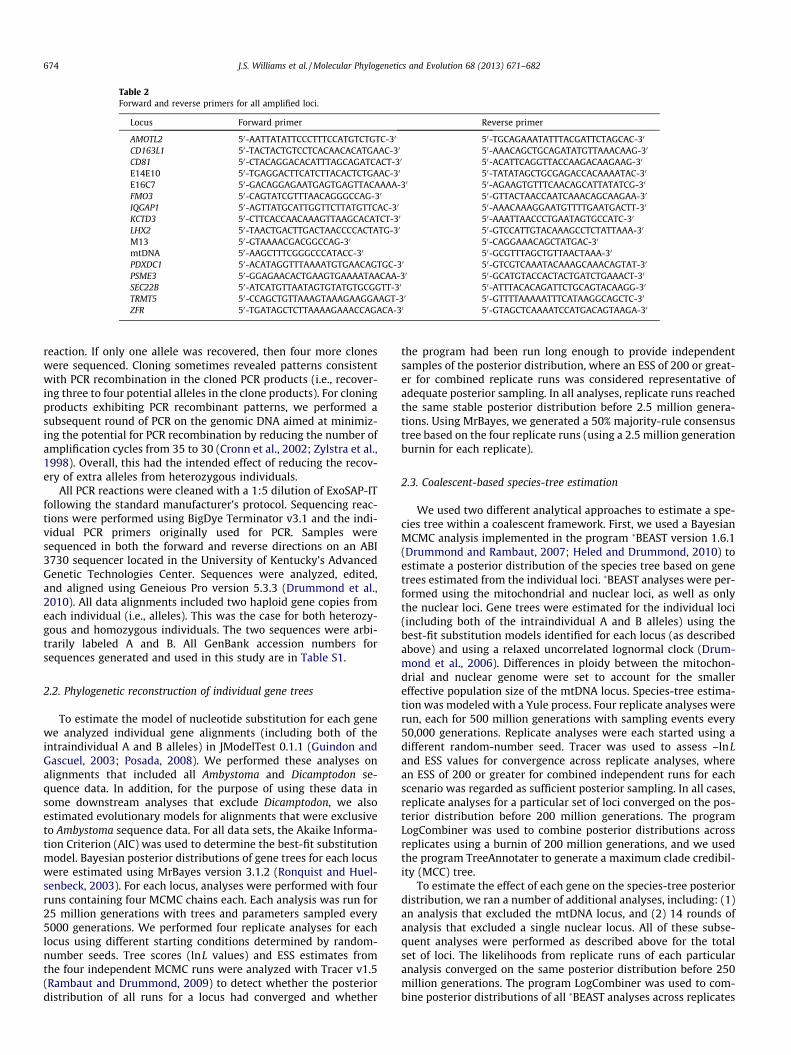
Table 2Forward and reverse primers for all amplified loci.
Locus Forward primer Reverse primer
AMOTL2 50-AATTATATTCCCTTTCCATGTCTGTC-30 50-TGCAGAAATATTTACGATTCTAGCAC-30
CD163L1 50-TACTACTGTCCTCACAACACATGAAC-30 50-AAACAGCTGCAGATATGTTAAACAAG-30
CD81 50-CTACAGGACACATTTAGCAGATCACT-30 50-ACATTCAGGTTACCAAGACAAGAAG-30
E14E10 50-TGAGGACTTCATCTTACACTCTGAAC-30 50-TATATAGCTGCGAGACCACAAAATAC-30
E16C7 50-GACAGGAGAATGAGTGAGTTACAAAA-30 50-AGAAGTGTTTCAACAGCATTATATCG-30
FMO3 50-CAGTATCGTTTAACAGGGCCAG-30 50-GTTACTAACCAATCAAACAGCAAGAA-30
IQGAP1 50-AGTTATGCATTGGTTCTTATGTTCAC-30 50-AAACAAAGGAATGTTTTGAATGACTT-30
KCTD3 50-CTTCACCAACAAAGTTAAGCACATCT-30 50-AAATTAACCCTGAATAGTGCCATC-30
LHX2 50-TAACTGACTTGACTAACCCCACTATG-30 50-GTCCATTGTACAAAGCCTCTATTAAA-30
M13 50-GTAAAACGACGGCCAG-30 50-CAGGAAACAGCTATGAC-30
mtDNA 50-AAGCTTTCGGGCCCATACC-30 50-GCGTTTAGCTGTTAACTAAA-30
PDXDC1 50-ACATAGGTTTAAAATGTGAACAGTGC-30 50-GTCGTCAAATACAAAGCAAACAGTAT-30
PSME3 50-GGAGAACACTGAAGTGAAAATAACAA-30 50-GCATGTACCACTACTGATCTGAAACT-30
SEC22B 50-ATCATGTTAATAGTGTATGTGCGGTT-30 50-ATTTACACAGATTCTGCAGTACAAGG-30
TRMT5 50-CCAGCTGTTAAAGTAAAGAAGGAAGT-30 50-GTTTTAAAAATTTCATAAGGCAGCTC-30
ZFR 50-TGATAGCTCTTAAAAGAAACCAGACA-30 50-GTAGCTCAAAATCCATGACAGTAAGA-30
674 J.S. Williams et al. / Molecular Phylogenetics and Evolution 68 (2013) 671–682
reaction. If only one allele was recovered, then four more cloneswere sequenced. Cloning sometimes revealed patterns consistentwith PCR recombination in the cloned PCR products (i.e., recover-ing three to four potential alleles in the clone products). For cloningproducts exhibiting PCR recombinant patterns, we performed asubsequent round of PCR on the genomic DNA aimed at minimiz-ing the potential for PCR recombination by reducing the number ofamplification cycles from 35 to 30 (Cronn et al., 2002; Zylstra et al.,1998). Overall, this had the intended effect of reducing the recov-ery of extra alleles from heterozygous individuals.
All PCR reactions were cleaned with a 1:5 dilution of ExoSAP-ITfollowing the standard manufacturer’s protocol. Sequencing reac-tions were performed using BigDye Terminator v3.1 and the indi-vidual PCR primers originally used for PCR. Samples weresequenced in both the forward and reverse directions on an ABI3730 sequencer located in the University of Kentucky’s AdvancedGenetic Technologies Center. Sequences were analyzed, edited,and aligned using Geneious Pro version 5.3.3 (Drummond et al.,2010). All data alignments included two haploid gene copies fromeach individual (i.e., alleles). This was the case for both heterozy-gous and homozygous individuals. The two sequences were arbi-trarily labeled A and B. All GenBank accession numbers forsequences generated and used in this study are in Table S1.
2.2. Phylogenetic reconstruction of individual gene trees
To estimate the model of nucleotide substitution for each genewe analyzed individual gene alignments (including both of theintraindividual A and B alleles) in JModelTest 0.1.1 (Guindon andGascuel, 2003; Posada, 2008). We performed these analyses onalignments that included all Ambystoma and Dicamptodon se-quence data. In addition, for the purpose of using these data insome downstream analyses that exclude Dicamptodon, we alsoestimated evolutionary models for alignments that were exclusiveto Ambystoma sequence data. For all data sets, the Akaike Informa-tion Criterion (AIC) was used to determine the best-fit substitutionmodel. Bayesian posterior distributions of gene trees for each locuswere estimated using MrBayes version 3.1.2 (Ronquist and Huel-senbeck, 2003). For each locus, analyses were performed with fourruns containing four MCMC chains each. Each analysis was run for25 million generations with trees and parameters sampled every5000 generations. We performed four replicate analyses for eachlocus using different starting conditions determined by random-number seeds. Tree scores (lnL values) and ESS estimates fromthe four independent MCMC runs were analyzed with Tracer v1.5(Rambaut and Drummond, 2009) to detect whether the posteriordistribution of all runs for a locus had converged and whether
the program had been run long enough to provide independentsamples of the posterior distribution, where an ESS of 200 or great-er for combined replicate runs was considered representative ofadequate posterior sampling. In all analyses, replicate runs reachedthe same stable posterior distribution before 2.5 million genera-tions. Using MrBayes, we generated a 50% majority-rule consensustree based on the four replicate runs (using a 2.5 million generationburnin for each replicate).
2.3. Coalescent-based species-tree estimation
We used two different analytical approaches to estimate a spe-cies tree within a coalescent framework. First, we used a BayesianMCMC analysis implemented in the program �BEAST version 1.6.1(Drummond and Rambaut, 2007; Heled and Drummond, 2010) toestimate a posterior distribution of the species tree based on genetrees estimated from the individual loci. �BEAST analyses were per-formed using the mitochondrial and nuclear loci, as well as onlythe nuclear loci. Gene trees were estimated for the individual loci(including both of the intraindividual A and B alleles) using thebest-fit substitution models identified for each locus (as describedabove) and using a relaxed uncorrelated lognormal clock (Drum-mond et al., 2006). Differences in ploidy between the mitochon-drial and nuclear genome were set to account for the smallereffective population size of the mtDNA locus. Species-tree estima-tion was modeled with a Yule process. Four replicate analyses wererun, each for 500 million generations with sampling events every50,000 generations. Replicate analyses were each started using adifferent random-number seed. Tracer was used to assess –lnLand ESS values for convergence across replicate analyses, wherean ESS of 200 or greater for combined independent runs for eachscenario was regarded as sufficient posterior sampling. In all cases,replicate analyses for a particular set of loci converged on the pos-terior distribution before 200 million generations. The programLogCombiner was used to combine posterior distributions acrossreplicates using a burnin of 200 million generations, and we usedthe program TreeAnnotater to generate a maximum clade credibil-ity (MCC) tree.
To estimate the effect of each gene on the species-tree posteriordistribution, we ran a number of additional analyses, including: (1)an analysis that excluded the mtDNA locus, and (2) 14 rounds ofanalysis that excluded a single nuclear locus. All of these subse-quent analyses were performed as described above for the totalset of loci. The likelihoods from replicate runs of each particularanalysis converged on the same posterior distribution before 250million generations. The program LogCombiner was used to com-bine posterior distributions of all �BEAST analyses across replicates

J.S. Williams et al. / Molecular Phylogenetics and Evolution 68 (2013) 671–682 675
using a burnin of 250 million generations. To calculate a measureof dissimilarity among trees from these analyses, we calculatedRobinson–Foulds (RF) distances between species-tree posteriordistributions using the program Treedist in PHYLIP version 3.69(Felsenstein, 2004). In addition, to visualize the relative degree ofsimilarity among each posterior distribution, 100 random samplesfrom each posterior distribution were plotted in ordination spaceusing multidimensional scaling (MDS) in the Mesquite moduleTree Set Viz v2.1 (Hillis et al., 2005; Maddison and Maddison,2004). Unweighted RF distances, which measure the dissimilaritybetween the topology of two trees, were calculated for all pairwisetree comparisons and used in the MDS analyses. The default stepsize in Tree Set Viz was used in all analyses and MDS was allowedto proceed until the first six decimal positions of the stress-func-tion value ceased to change. To avoid being trapped in local opti-ma, this procedure was repeated multiple times to insure thatsimilar results were being achieved. The results of MDS analyseswere plotted as two-dimensional representations of multidimen-sional space.
We also performed a fossil-calibrated �BEAST species tree anal-ysis of the Ambystomatidae by calibrating the root of the Ambys-toma tree using �BEAST v1.7.4 (Drummond et al., 2012). Theoldest fossil for Ambystoma is A. tiheni, which is from the Late Eo-cene (37.2–33.9 million years ago) (Holman, 2006). This fossilwas used to calibrate the root of Ambystoma by placing a lognormaldistribution on the root of the tree at 35.55 million years with astandard deviation of 1.65 million years. All other running condi-tions were identical to those in the above �BEAST analyses.
As a second method of coalescent-based species-tree recon-struction, we estimated the maximum-likelihood (ML) speciestrees using the program STEM version 2.0 (Kubatko et al., 2009).STEM requires input of an ultrametric gene tree generated for eachindividual locus. We estimated gene trees for each locus (includingboth of the intraindividual A and B alleles) using a Bayesian ap-proach implemented in BEAST version 1.6.1 (Drummond and Ram-baut, 2007). Best fitting substitution models were used for eachlocus, and analyses were performed using a relaxed uncorrelatedlognormal molecular clock. Four replicate analyses were per-formed for each locus. All BEAST analyses were run for 100 milliongenerations, sampling every 10,000 generations. We assessed con-vergence by assessing the distribution of lnL and parameter values(with an ESS of 200 or greater indicating adequate sampling of theposterior) over the course of each run using Tracer, and by compar-ing these values across replicate runs. All replicate analyses con-verged on the same stable distribution prior to 10 milliongenerations, and we excluded samples from this portion of therun prior to summarizing the posterior distribution. The MCC treefor each locus was summarized from the combined posterior dis-tribution of each replicate analysis.
Single-locus MCC gene trees were input into STEM, and ML spe-cies trees were estimated using all mitochondrial and nuclear lociand using only nuclear loci. Because it was unclear what h valuewould best represent our data, we used a range of prior valuesfor h (0.0001, 0.0006, 0.001, 0.006, 0.01, 0.1, 1, 10) to account forthe potential effect of ancestral population size on our results.Analyses were run using a simulated annealing search for 10 mil-lion generations, while discarding the first 1 million generationsas burnin. A total of four replicate analyses were executed for eachh prior.
2.4. Bayesian concordance of gene trees
To determine the proportion of gene trees that supported a par-ticular clade, we calculated Bayesian concordance factors usingBUCKy version 1.4.0 (Ane et al., 2007; Larget et al., 2010). AllBUCKy analyses were performed on posterior distributions of indi-
vidual gene trees generated from Ambystoma-specific data sets inMrBayes. We focused these analyses on Ambystoma based on thelack of complete nuclear-gene sampling for Dicamptodon and asan effort to reduce the number of tips in the analyzed trees. BUCKyanalyses were conducted using both mitochondrial and nucleargene trees, and using nuclear gene trees exclusively. For all nuclearloci, both the A and B alleles from an individual were present in theinput gene trees, and we used a function within BUCKy to choosethe allele designated with the A label (which had been arbitrarilyassigned to one of the two gene copies as described above) fromeach individual. All BUCKy analyses were run for 10 million gener-ations after an initial burnin of 1 million generations. For eachanalysis, four independent replicate runs were performed, eachwith four MCMC chains. We ran multiple analyses using a rangeof Dirichlet process priors (a = 0.001, 0.01, 0.1, 1.0, 10.0, 100.0)where a is a parameter indicating the a priori degree of discordancebetween different genes.
3. Results
A total of 14 nuclear loci and one mitochondrial locus (nad2 andthe adjacent tRNATrp and tRNAAla genes) were sequenced for mostof the 33 Ambystoma individuals. The exceptions were the PSME3locus (31 Ambystoma individuals) and the CD81 locus (32 individ-uals). For Dicamptodon, we were able to sequence three nuclear locifor all seven individuals; however, we were unable to generatesuccessful PCR or sequence data for the remaining nuclear loci.New mtDNA data were generated for only one Dicamptodon copeiindividual (MVZ223515). Two additional Dicamptodon sequences(GenBank Accessions AY916017 and AY916018) from a previousstudy (Weisrock et al., 2005) were used in the mtDNA alignment.Overall, this totaled 4276 bp of aligned nuclear sequence dataand 1183 bp of aligned mtDNA data. The nuclear DNA containeda total of 1688 variable sites and 988 parsimony-informative sitesacross all Ambystoma and Dicamptodon individuals (Table 3). With-in Ambystoma, the nuclear data contained a total of 1581 variableand 926 parsimony-informative sites. The mtDNA contained a totalof 1035 variable sites and 524 parsimony-informative sites acrossall Ambystoma and Dicamptodon individuals (Table 3). WithinAmbystoma, the mtDNA data contained a total of 827 variableand 441 parsimony-informative sites. All data used in this studyare available from the Dryad online repository at http://dx.doi.org/10.5061/dryad.2gq14.
3.1. Individual gene-tree reconstruction
For all loci analyzed with MrBayes, the independent replicateruns had sampling patterns after 2.5 million generations that indi-cated convergence on the posterior distribution, including overlap-ping plots of stabilized lnL values and similar majority-ruleconsensus topologies generated from each replicate analysis.Majority-rule consensus trees generated from the combined pos-terior distributions for each locus are presented in Fig. S1. ReplicateBayesian posterior distributions of trees for each locus generated inBEAST (for use in STEM analyses) exhibited similar signs of conver-gence. Furthermore, the topologies of majority-rule consensustrees generated from MrBayes were generally consistent withthose of the MCC trees estimated in BEAST. Differences betweenthese two analyses were generally in ambiguous regions of thetree; unresolved regions of the MrBayes consensus trees were leftas polytomies, while corresponding relationships in BEAST treeswere resolved as bifurcating branches with low posterior probabil-ities. Tree files for all majority-rule consensus trees generated inMrBayes and MCC trees generated in BEAST are available fromDryad (link provided above).

Table 3Information for the loci sequenced in this study.
Locusa Alignmentlength (bp)
Number ofAmbystomaindividualssequenced
Number ofDicamptodonindividualssequenced
Linkagegroupb
Numberofvariablesites
Number ofparsimonyinformativesites
Substitutionmodel
Number of distincttopologies inposteriordistributionc
Rate ofevolution(meanRate)d
mtDNA 1183 33 3** mtDNA 827/1035* 441/524* GTR+I+C 2143/3957* 5.605AMOTL2 349 33 0 8 165 113 HKY+I 18,000 0.893CD163L1 379 33 0 4 116 92 HKY+C 18,000 0.688CD81 372 32 0 6 202 110 HKY+C 18,000 0.871E14E10e 184 33 7 5 34/41* 18/25* GTR+I/GTR+C* 18,000 0.259E16C7e 373/387* 33 7 5 133/223* 94/139* HKY+I+C 18,000 0.743FMO3 384 33 0 10 143 107 GTR+C 18,000 0.908IQGAP1 271 33 0 6 136 63 GTR+C 18,000 0.629KCTD3 211 33 0 13 94 56 HKY+C 18,000 0.707LHX2 157 33 7 7 23/33* 18/28* HKY+C 18,000 0.271PDXDC1 225 33 0 3 89 54 GTR+C 18,000 0.624PSME3 475 31 0 11 176 110 GTR+C 18,000 0.637SEC22B 397 33 0 10 130 64 GTR+C 18,000 0.419TRMT5 214 33 0 14 50 27 GTR+I+C 18,000 0.390ZFR 271 33 0 2 90 47 GTR+I 18,000 0.332Total nuclear 4262/4276* – – – 1581/1688* 926/988* – –Total nuclear + mtDNA 5445/5459* – – – 2408/2723* 1367/1512* – –
* Value that differs when Dicamptodon is included.** Two of these sequences were originally published in Weisrock et al. (2005).
a Full names for nuclear loci with determined ortholog: AMOTL2 (Angiomotin-like 2), CD163L1 (CD163 Antigen-like 1), CD81 (CD81 Antigen), FMO3 (Flavin-containingMonooxygenase 3), IQGAP1 (IQ Motif-containing GTPase-activating Protein 1), KCTD3 (Potassium Channel Tetramerization Domain-containing Protein 3), LHX2 (LIMHomeobox Gene 2), PDXDC1 (Pyridoxal-dependent Decarboxylase Domain-containing Protein 1), PSME3 (Proteasome Activator Subunit 3), SEC22B (SEC22 Vesicle-traffickingProtein Homolog B), TRMT5 (tRNA Methyltransferase 5), ZFR (Zinc Finger RNA Binding Protein).
b Based on the linkage map of Smith et al. (2005).c Based on the combined posterior distributions from replicate MrBayes analyses. Because every sample of the posterior distribution had a different topology, all nuclear
loci have the same number of distinct topologies.d Derived from the meanRate parameter in �BEAST. Units for these values entail the number of substitutions per site averaged across the tree. These values come from the
joint posterior distributions from �BEAST analyses using all loci, using the meanRate value for each locus.e Original EST locus name; human ortholog not determined.
676 J.S. Williams et al. / Molecular Phylogenetics and Evolution 68 (2013) 671–682
3.2. �BEAST species tree analyses
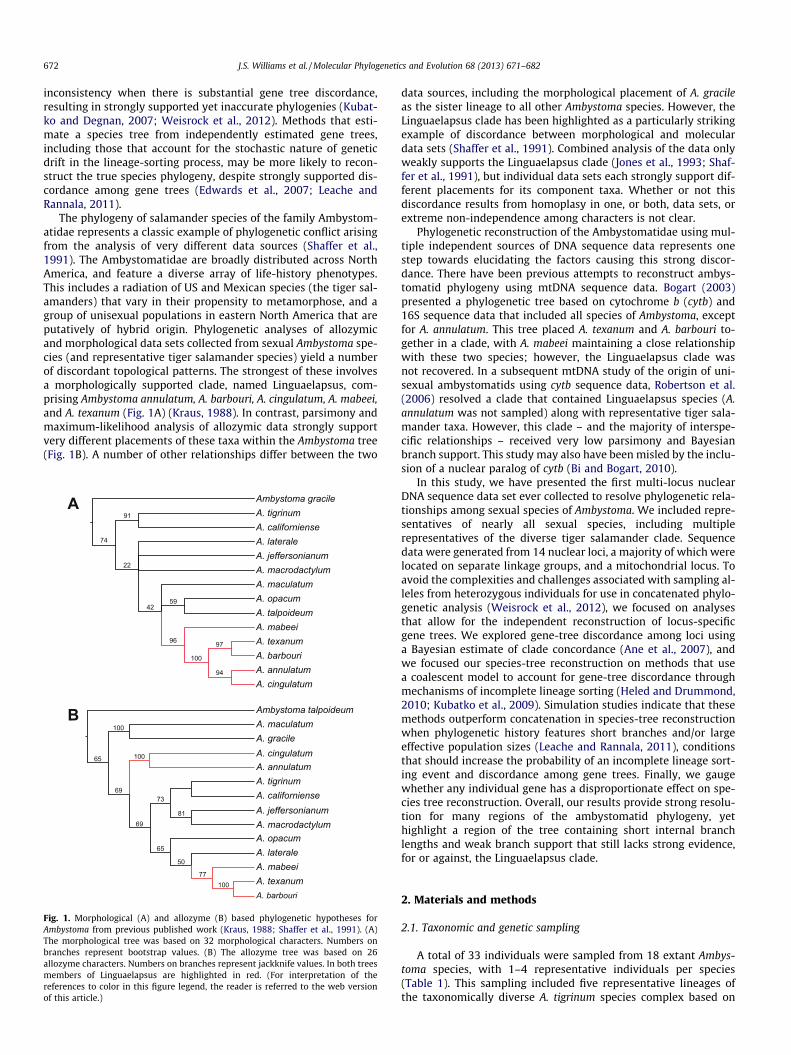
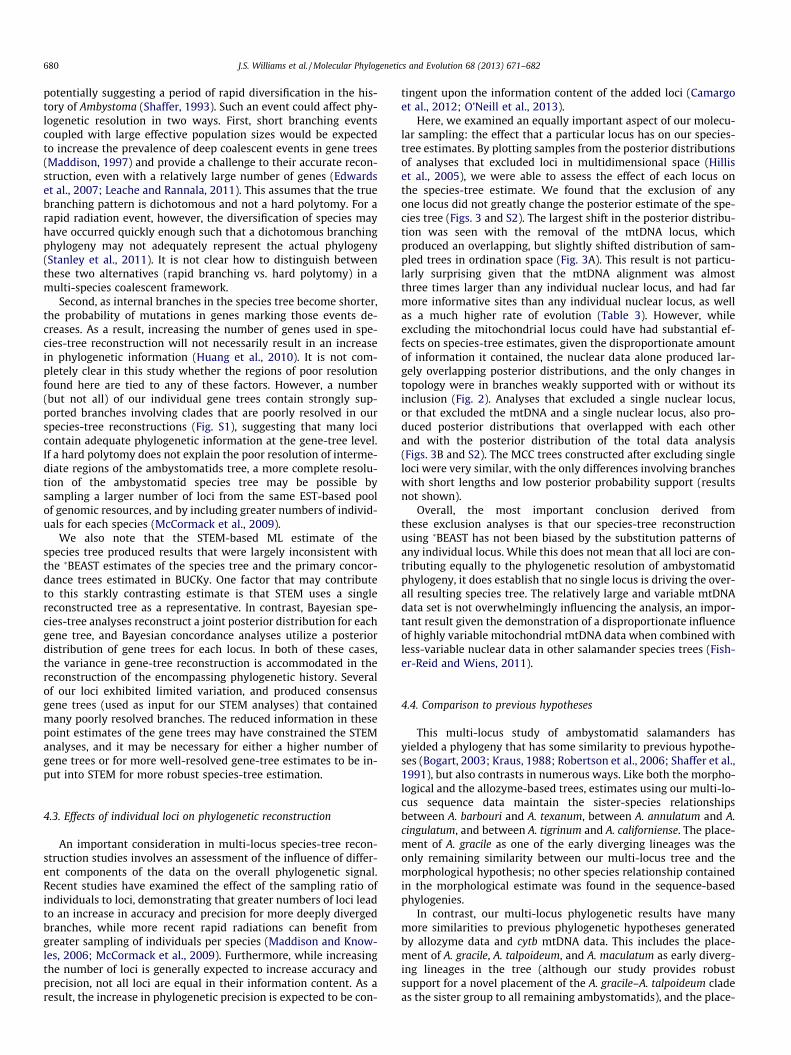
The �BEAST species tree generated using all mitochondrial andnuclear loci produced a monophyletic Ambystoma with a high pos-terior probability (PP) of 1.0 (Fig. 2A). Within the Ambystoma clade,eight branches were resolved that exhibited moderate to strong PPsupport and either contained multiple species or were monotypicwith no strong placement with other species. Ambystoma gracileand A. talpoideum were placed in a clade (designated clade A) witha PP = 0.91, and this clade was supported as the sister group to aclade containing all remaining Ambystoma species (PP = 1.0). With-in this larger clade, A. maculatum (clade B) was placed as the sisterlineage to the remaining Ambystoma clades (C–H) with strong sup-port (PP = 1.0). There was weak branch support for the relation-ships among A. macrodactylum (clade C), A. opacum (clade D), anda clade of remaining Ambystoma species (clades E–H), with the lat-ter two clades placed as sister groups with a PP = 0.48. Clades E–Hwere each individually supported by strong PPs, although relation-ships among these clades received lower measures of branch sup-port. Ambystoma jeffersonianum and A. laterale (clade E) wereresolved as sister taxa with a PP = 0.96. Ambystoma mabeei, A.barbouri, and A. texanum formed a clade (clade F) with a PP = 1.0.Clades E and F were resolved as sister groups, although with weak-er levels of branch support (PP = 0.73). Ambystoma annulatum, A.bishopi, and A. cingulatum formed a clade (clade G) with aPP = 1.0. Finally, all sampled tiger salamander taxa (A. californiense,A. mexicanum, A. ordinarium, and A. tigrinum) formed a clade with aPP = 1.0. Clades G and H were resolved as sister groups, again, withweaker branch support (PP = 0.78) than that seen for the individu-ally identified clades. Collectively, clades E–H formed a monophy-letic group with strong branch support (PP = 0.98).�BEAST analyses that excluded individual loci produced species-
tree posterior distributions that largely overlapped in ordination
space with that of the full data analysis (Fig. 3); however, thereare two notable deviations. Exclusion of the mtDNA data producedan overlapping, but slightly different posterior distribution, com-pared to the full-data analysis (Fig. 3A). These differences weremanifested in two different ways. First, measures of branch supportfor some of the terminal clades described above changed (Fig. 2B).When the mtDNA data were excluded, branch support increasedslightly for clade A (PP = 0.93), which corresponds with the individ-ual mtDNA gene tree not resolving A. gracile and A. talpoideum assister species (Fig. S1). In addition, the exclusion of mtDNA datayielded decreased branch support for clade E (PP = 0.77). Second,exclusion of mtDNA data yielded some alternative phylogeneticrelationships among clades C–H, although these involved branchesthat received low levels of branch support from both sets of analy-ses. Clade D was placed as the sister lineage to a clade containingclades C and clades E–H (PP = 0.54). Clades E–G were grouped to-gether to the exclusion of clade H with a PP = 0.50. In addition, sup-port for the placement of clades E–H in a larger clade was reducedto a PP = 0.71. The average RF distance between analyses that in-cluded and excluded the mtDNA locus was 7.2 (Table S2).
Overall, removal of a single nuclear locus had less of an effect onthe posterior distribution of species trees compared to the removalof the mtDNA locus (Fig. 3B). Average RF distances between poster-ior distributions from the nuclear exclusion analyses ranged from5.60 to 6.74 (Table S2). Given both the higher number of variablesites in the mitochondrial alignment vs. individual nuclear locusalignments as well as the higher rate of evolution in the mitochon-drial data (Table 3), this is not unexpected.
We also attempted a time-calibrated �BEAST analysis of theAmbystomatidae by setting a date on the root of Ambystoma. How-ever, independent runs failed to converge on a similar posteriordistribution, even after running analyses for 500 million genera-tions. As a result, we do not discuss these results further. However,
A
B
0.03 substitutions/siteA. ordinarium
D. tenebrosus
A. gracile
A. tigrinum
A. mexicanum
A. barbouri
A. maculatum
A. californiense
A. mabeei
A. bishopi
A. lateraleA. jeffersonianum
A. annulatum
A. opacum
Ambystoma talpoideum
A. texanum
A. macrodactylum
A. cingulatum
Dicamptodon ensatus
D. aterrimusD. copei1
.78/2.1
1
.48/1.4
1/3.7
.49
1/7.2
.96/3.8
1/9.5
.91
1
.73/.1
1/5.8
1/13.0
1/7.51/5.9
1/13.4
.98/2.4
.75
A
B
E
CD
F
G
H
0.0050 substitutions/site
A. tigrinumA. ordinariumA. mexicanum
Ambystoma talpoideum
A. laterale
A. texanum
D. aterrimus
A. opacum
A. gracile
D. tenebrosus
Dicamptodon ensatus
A. macrodactylum
A. bishopi
A. mabeei
A. californiense
A. maculatum
A. barbouri
D. copei
A. jeffersonianum
A. annulatum
A. cingulatum
.71/2.0
1/8.5
.66
1/12.0
.74/.1
1/4.8
1/2.7
.93
.54/1.1
.77/2.8
1/12.3
1/6.5
.5/.1
1
1/5.8
1/6.4
1
.83
.97
A
B
H
DC
G
F
E
(CF = 11.7)
(CF = 10.8)
Fig. 2. Maximum clade credibility (MCC) trees generated from the posterior distributions of Bayesian coalescent species-tree reconstructions performed in �BEAST. (A) MCCtree generated from analyses that used all mitochondrial and nuclear loci. (B) MCC tree generated from analyses that used only nuclear loci. Numbers on branches represent�BEAST posterior probabilities (left of the slash) and Bayesian concordance factors (minimum number of loci supporting a branch, right of the slash). Bayesian concordancefactors are not included on all branches due to the exclusion of Dicamptodon outgroup taxa in Bayesian concordance analysis. Branches in red highlight relationships thatdiffer between the two trees. In this study, we consider clades that have posterior probabilities above 0.95 and Bayesian concordance factors of 2 or greater to be stronglysupported.
J.S. Williams et al. / Molecular Phylogenetics and Evolution 68 (2013) 671–682 677
all files associated with these analyses can be found in the onlineDryad repository.
3.3. STEM analyses
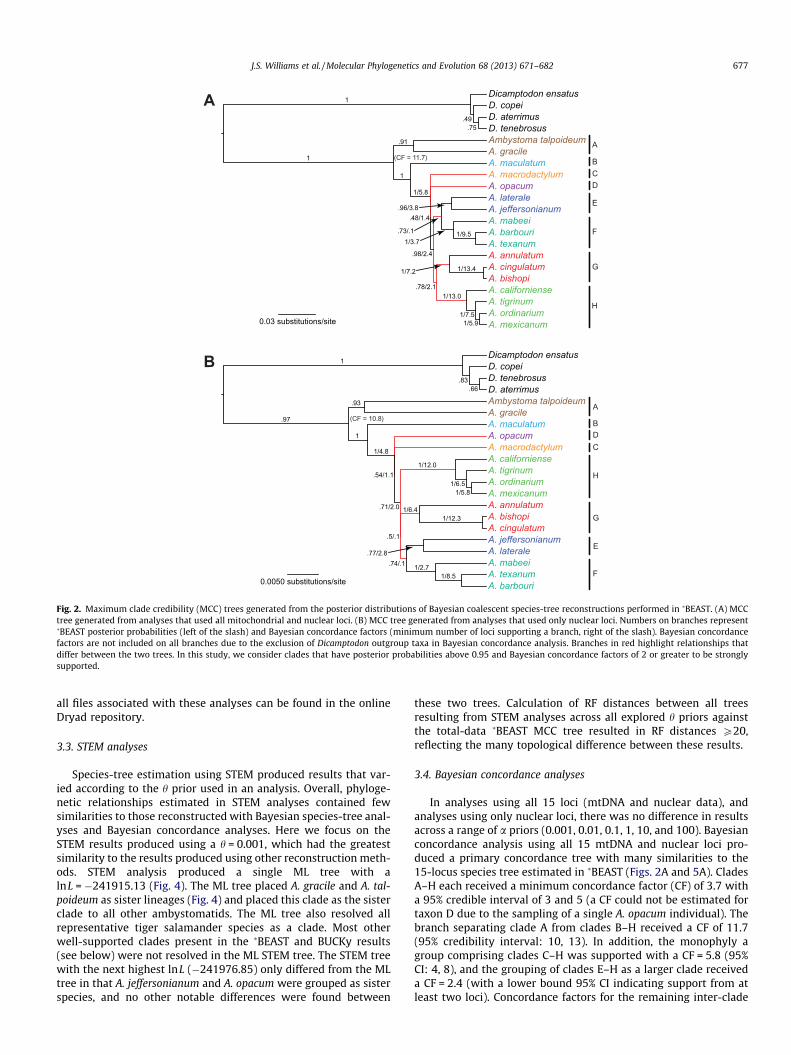
Species-tree estimation using STEM produced results that var-ied according to the h prior used in an analysis. Overall, phyloge-netic relationships estimated in STEM analyses contained fewsimilarities to those reconstructed with Bayesian species-tree anal-yses and Bayesian concordance analyses. Here we focus on theSTEM results produced using a h = 0.001, which had the greatestsimilarity to the results produced using other reconstruction meth-ods. STEM analysis produced a single ML tree with alnL = �241915.13 (Fig. 4). The ML tree placed A. gracile and A. tal-poideum as sister lineages (Fig. 4) and placed this clade as the sisterclade to all other ambystomatids. The ML tree also resolved allrepresentative tiger salamander species as a clade. Most otherwell-supported clades present in the �BEAST and BUCKy results(see below) were not resolved in the ML STEM tree. The STEM treewith the next highest lnL (�241976.85) only differed from the MLtree in that A. jeffersonianum and A. opacum were grouped as sisterspecies, and no other notable differences were found between
these two trees. Calculation of RF distances between all treesresulting from STEM analyses across all explored h priors againstthe total-data �BEAST MCC tree resulted in RF distances P20,reflecting the many topological difference between these results.
3.4. Bayesian concordance analyses
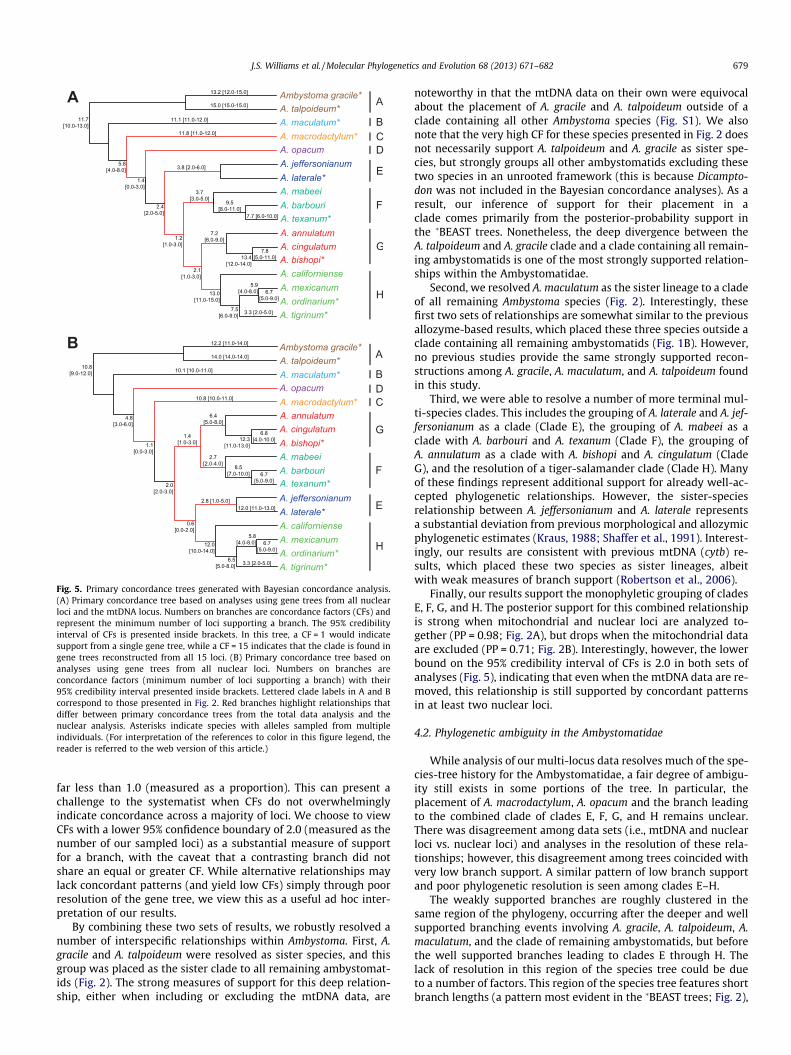
In analyses using all 15 loci (mtDNA and nuclear data), andanalyses using only nuclear loci, there was no difference in resultsacross a range of a priors (0.001, 0.01, 0.1, 1, 10, and 100). Bayesianconcordance analysis using all 15 mtDNA and nuclear loci pro-duced a primary concordance tree with many similarities to the15-locus species tree estimated in �BEAST (Figs. 2A and 5A). CladesA–H each received a minimum concordance factor (CF) of 3.7 witha 95% credible interval of 3 and 5 (a CF could not be estimated fortaxon D due to the sampling of a single A. opacum individual). Thebranch separating clade A from clades B–H received a CF of 11.7(95% credibility interval: 10, 13). In addition, the monophyly agroup comprising clades C–H was supported with a CF = 5.8 (95%CI: 4, 8), and the grouping of clades E–H as a larger clade receiveda CF = 2.4 (with a lower bound 95% CI indicating support from atleast two loci). Concordance factors for the remaining inter-clade

A
B
All LocimtDNA excluded
All Loci
PSME3 excludedSEC22B excluded
KCTD3 excluded
ZFR excluded
AMOTL2 excludedCD163L1 excludedCD81 excludedE14E10 excludedE16C7 excludedFMO3 excludedIQGAP1 excluded
TRMT5 excluded
LHX2 excludedPDXDC1 excluded
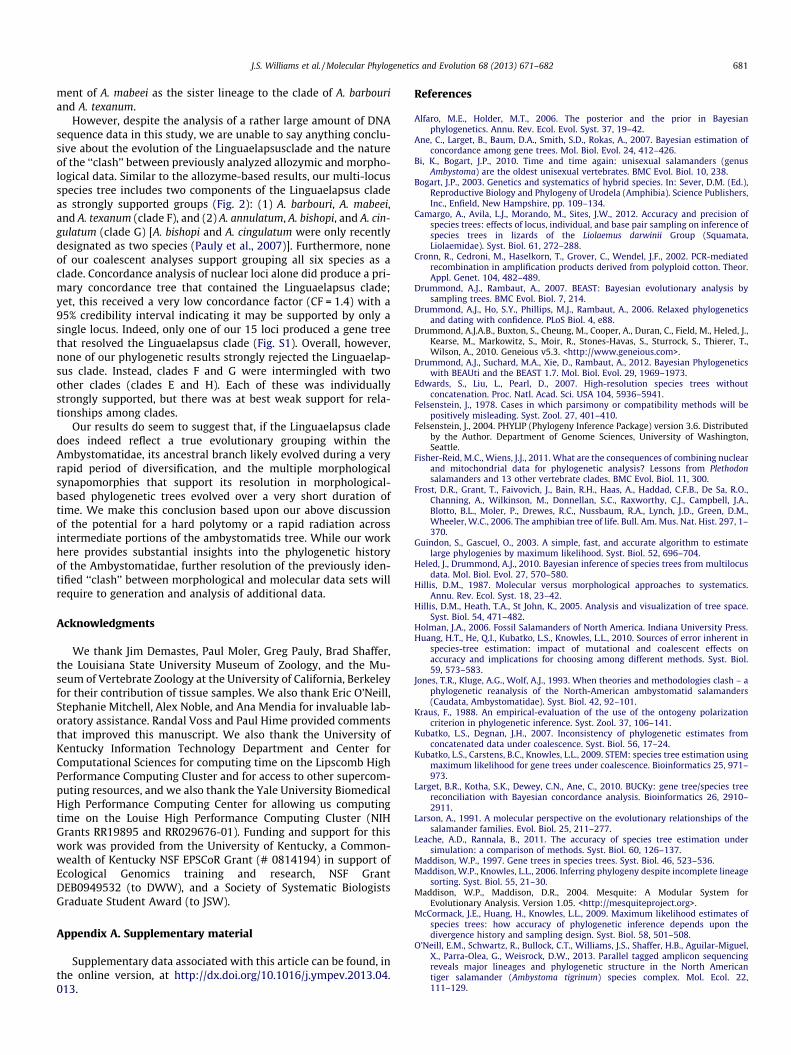
Fig. 3. Ordination plots based on multidimensional scaling of trees sampled fromthe posterior distributions (PDs) generated from Bayesian species tree analyses.Each dot represents a tree sampled from the posterior distribution. Distancesbetween dots represent Robinson–Foulds distances between trees, where two dotsthat are closer in ordination space have a more similar topology than two dots thatare farther apart in ordination space. (A) The PDs resulting from analysis of all 15(mitochondrial + nuclear) loci and analysis of all nuclear loci (excluding mtDNA).The final stress value of this analysis was 0.276388. Minimum convex polygonsencompass the distribution of trees from each analysis. (B) The PDs resulting fromanalysis of all 15 (mitochondrial + nuclear) loci and analyses that excluded a singlenuclear locus. The final stress value of this analysis was 0.301906. Minimum convexpolygons encompass the distribution of trees from each analysis.
0.3 substitutions/site
A. gracile
A. mexicanum
A. jeffersonianum
A. maculatum
A. tigrinum
A. bishopi
A. macrodactylum
A. californiense
A. mabeei
A. opacum
A. laterale
A. cingulatum
Ambystoma talpoideum
A. annulatum
A. ordinarium
A. texanumA. barbouri
Fig. 4. Coalescent-based species tree generated via a maximum likelihood analysisin STEM. The tree is based on input gene trees from all nuclear loci and the mtDNAlocus. A range of h values was used in STEM analyses. The tree presented here wasgenerated using a h = 0.001. Branches in red indicate those that differ with the�BEAST maximum clade credibility tree using all loci (Fig. 2A).
678 J.S. Williams et al. / Molecular Phylogenetics and Evolution 68 (2013) 671–682
relationships in the PC tree were low, with 95% CIs that includedzero or one. Alternative phylogenetic relationships resolved inthe �BEAST species tree that were not present in the PC tree alsoreceived low CFs (Fig. 2A). For example, the �BEAST tree placedclades E and F as sister groups with a PP = 0.73, while Bayesianconcordance analysis gave it a very low CF of 0.1.
Bayesian concordance analysis of only the nuclear loci producedsimilar results to those that included mtDNA (Fig. 5B). In theseanalyses, a CF = 14 would be the highest value that could be given.Differences in the PC tree between the two sets of analyses wererestricted to branches that had 95% credibility intervals that in-cluded a CF < 2. For example, the nuclear PC tree included the Lin-guaelapsus clade (clade F + clade G) with a CF = 1.4 and a 95% CIthat included 1 and 3 (Fig. 5B), while the mtDNA + nuclear PC treeplaced clades G and H as sister clades with a CF = 2.1 and a 95% CIthat included 1 and 3 (Fig. 5A). Overall, branches with lowerbounds on their 95% CIs that included CFs P 2 were consistentacross the PC trees generated from all loci (mtDNA and nuclear),and only the nuclear loci. Removal of mtDNA did decrease CFsfor most branches. Concordance factors for individual clades A–Heach decreased by approximately one, as did the branches ances-tral to clades B–H and clades C–H. This effect was slightly less pro-nounced for the ancestral branch leading to clades E–H (CF = 2.4for all loci vs. CF = 2.0 for all nuclear loci); however, the upperbound of the 95% CI did drop by two in the nuclear analyses. Whilemany absolute CFs were decreased by the exclusion of mitochon-drial data, we point out that concordance values presented in thisway are relative to the number of loci used in BUCKy analyses.
4. Discussion
4.1. Interpreting phylogenetic resolution within the Ambystomatidae
In contrast to the lack of resolution between conflicting mor-phological and allozymic data sets in previous phylogenetic studiesof Ambystoma, we found considerable phylogenetic resolutionamong data sets generated from independent nuclear and mito-chondrial loci. We reached this conclusion based primarily on pat-terns of posterior probability support resulting from Bayesiancoalescent species-tree reconstruction in �BEAST and from Bayes-ian concordance factors. In general, we considered clades that re-ceived high posterior probabilities (in the range of 0.95 orgreater) and concordance factors with a minimum lower confi-dence estimate of 2.0 (as reported in the 95% credibility interval)to represent confidently supported relationships.
Whether or not the �BEAST posterior probabilities should beinterpreted as the probability that a clade is present in the speciestree is not entirely clear (Alfaro and Holder, 2006), and can dependon a number of aspects of the analysis, including priors and modelassumptions (e.g., no gene tree discordance due to gene flow). Re-cent simulation studies suggest that Bayesian implementations ofthe multispecies coalescent can produce very accurate estimatesof the species tree under certain species tree histories (Leacheand Rannala, 2011). Here, we interpret the species-tree posteriorprobabilities as a measure of the certainty that our data supporta particular clade, and given our broad sampling of loci acrossthe genome, we infer such clades to be strongly supported esti-mates of the phylogeny for ambystomatids.
The interpretation of concordance factors as measures of branchsupport is less clear, and cannot be viewed in the same light as aposterior probability or bootstrap value. Instead, they representthe number of sampled loci with reconstructed gene trees that re-flect a particular relationship. Because discordance for a relation-ship can exist across gene trees due to a number of factors(Maddison, 1997), CFs for a true branch in the species tree can be
A
B
Fig. 5. Primary concordance trees generated with Bayesian concordance analysis.(A) Primary concordance tree based on analyses using gene trees from all nuclearloci and the mtDNA locus. Numbers on branches are concordance factors (CFs) andrepresent the minimum number of loci supporting a branch. The 95% credibilityinterval of CFs is presented inside brackets. In this tree, a CF = 1 would indicatesupport from a single gene tree, while a CF = 15 indicates that the clade is found ingene trees reconstructed from all 15 loci. (B) Primary concordance tree based onanalyses using gene trees from all nuclear loci. Numbers on branches areconcordance factors (minimum number of loci supporting a branch) with their95% credibility interval presented inside brackets. Lettered clade labels in A and Bcorrespond to those presented in Fig. 2. Red branches highlight relationships thatdiffer between primary concordance trees from the total data analysis and thenuclear analysis. Asterisks indicate species with alleles sampled from multipleindividuals. (For interpretation of the references to color in this figure legend, thereader is referred to the web version of this article.)
J.S. Williams et al. / Molecular Phylogenetics and Evolution 68 (2013) 671–682 679
far less than 1.0 (measured as a proportion). This can present achallenge to the systematist when CFs do not overwhelminglyindicate concordance across a majority of loci. We choose to viewCFs with a lower 95% confidence boundary of 2.0 (measured as thenumber of our sampled loci) as a substantial measure of supportfor a branch, with the caveat that a contrasting branch did notshare an equal or greater CF. While alternative relationships maylack concordant patterns (and yield low CFs) simply through poorresolution of the gene tree, we view this as a useful ad hoc inter-pretation of our results.
By combining these two sets of results, we robustly resolved anumber of interspecific relationships within Ambystoma. First, A.gracile and A. talpoideum were resolved as sister species, and thisgroup was placed as the sister clade to all remaining ambystomat-ids (Fig. 2). The strong measures of support for this deep relation-ship, either when including or excluding the mtDNA data, are
noteworthy in that the mtDNA data on their own were equivocalabout the placement of A. gracile and A. talpoideum outside of aclade containing all other Ambystoma species (Fig. S1). We alsonote that the very high CF for these species presented in Fig. 2 doesnot necessarily support A. talpoideum and A. gracile as sister spe-cies, but strongly groups all other ambystomatids excluding thesetwo species in an unrooted framework (this is because Dicampto-don was not included in the Bayesian concordance analyses). As aresult, our inference of support for their placement in aclade comes primarily from the posterior-probability support inthe �BEAST trees. Nonetheless, the deep divergence between theA. talpoideum and A. gracile clade and a clade containing all remain-ing ambystomatids is one of the most strongly supported relation-ships within the Ambystomatidae.
Second, we resolved A. maculatum as the sister lineage to a cladeof all remaining Ambystoma species (Fig. 2). Interestingly, thesefirst two sets of relationships are somewhat similar to the previousallozyme-based results, which placed these three species outside aclade containing all remaining ambystomatids (Fig. 1B). However,no previous studies provide the same strongly supported recon-structions among A. gracile, A. maculatum, and A. talpoideum foundin this study.
Third, we were able to resolve a number of more terminal mul-ti-species clades. This includes the grouping of A. laterale and A. jef-fersonianum as a clade (Clade E), the grouping of A. mabeei as aclade with A. barbouri and A. texanum (Clade F), the grouping ofA. annulatum as a clade with A. bishopi and A. cingulatum (CladeG), and the resolution of a tiger-salamander clade (Clade H). Manyof these findings represent additional support for already well-ac-cepted phylogenetic relationships. However, the sister-speciesrelationship between A. jeffersonianum and A. laterale representsa substantial deviation from previous morphological and allozymicphylogenetic estimates (Kraus, 1988; Shaffer et al., 1991). Interest-ingly, our results are consistent with previous mtDNA (cytb) re-sults, which placed these two species as sister lineages, albeitwith weak measures of branch support (Robertson et al., 2006).
Finally, our results support the monophyletic grouping of cladesE, F, G, and H. The posterior support for this combined relationshipis strong when mitochondrial and nuclear loci are analyzed to-gether (PP = 0.98; Fig. 2A), but drops when the mitochondrial dataare excluded (PP = 0.71; Fig. 2B). Interestingly, however, the lowerbound on the 95% credibility interval of CFs is 2.0 in both sets ofanalyses (Fig. 5), indicating that even when the mtDNA data are re-moved, this relationship is still supported by concordant patternsin at least two nuclear loci.
4.2. Phylogenetic ambiguity in the Ambystomatidae
While analysis of our multi-locus data resolves much of the spe-cies-tree history for the Ambystomatidae, a fair degree of ambigu-ity still exists in some portions of the tree. In particular, theplacement of A. macrodactylum, A. opacum and the branch leadingto the combined clade of clades E, F, G, and H remains unclear.There was disagreement among data sets (i.e., mtDNA and nuclearloci vs. nuclear loci) and analyses in the resolution of these rela-tionships; however, this disagreement among trees coincided withvery low branch support. A similar pattern of low branch supportand poor phylogenetic resolution is seen among clades E–H.
The weakly supported branches are roughly clustered in thesame region of the phylogeny, occurring after the deeper and wellsupported branching events involving A. gracile, A. talpoideum, A.maculatum, and the clade of remaining ambystomatids, but beforethe well supported branches leading to clades E through H. Thelack of resolution in this region of the species tree could be dueto a number of factors. This region of the species tree features shortbranch lengths (a pattern most evident in the �BEAST trees; Fig. 2),
680 J.S. Williams et al. / Molecular Phylogenetics and Evolution 68 (2013) 671–682
potentially suggesting a period of rapid diversification in the his-tory of Ambystoma (Shaffer, 1993). Such an event could affect phy-logenetic resolution in two ways. First, short branching eventscoupled with large effective population sizes would be expectedto increase the prevalence of deep coalescent events in gene trees(Maddison, 1997) and provide a challenge to their accurate recon-struction, even with a relatively large number of genes (Edwardset al., 2007; Leache and Rannala, 2011). This assumes that the truebranching pattern is dichotomous and not a hard polytomy. For arapid radiation event, however, the diversification of species mayhave occurred quickly enough such that a dichotomous branchingphylogeny may not adequately represent the actual phylogeny(Stanley et al., 2011). It is not clear how to distinguish betweenthese two alternatives (rapid branching vs. hard polytomy) in amulti-species coalescent framework.
Second, as internal branches in the species tree become shorter,the probability of mutations in genes marking those events de-creases. As a result, increasing the number of genes used in spe-cies-tree reconstruction will not necessarily result in an increasein phylogenetic information (Huang et al., 2010). It is not com-pletely clear in this study whether the regions of poor resolutionfound here are tied to any of these factors. However, a number(but not all) of our individual gene trees contain strongly sup-ported branches involving clades that are poorly resolved in ourspecies-tree reconstructions (Fig. S1), suggesting that many locicontain adequate phylogenetic information at the gene-tree level.If a hard polytomy does not explain the poor resolution of interme-diate regions of the ambystomatids tree, a more complete resolu-tion of the ambystomatid species tree may be possible bysampling a larger number of loci from the same EST-based poolof genomic resources, and by including greater numbers of individ-uals for each species (McCormack et al., 2009).
We also note that the STEM-based ML estimate of thespecies tree produced results that were largely inconsistent withthe �BEAST estimates of the species tree and the primary concor-dance trees estimated in BUCKy. One factor that may contributeto this starkly contrasting estimate is that STEM uses a singlereconstructed tree as a representative. In contrast, Bayesian spe-cies-tree analyses reconstruct a joint posterior distribution for eachgene tree, and Bayesian concordance analyses utilize a posteriordistribution of gene trees for each locus. In both of these cases,the variance in gene-tree reconstruction is accommodated in thereconstruction of the encompassing phylogenetic history. Severalof our loci exhibited limited variation, and produced consensusgene trees (used as input for our STEM analyses) that containedmany poorly resolved branches. The reduced information in thesepoint estimates of the gene trees may have constrained the STEManalyses, and it may be necessary for either a higher number ofgene trees or for more well-resolved gene-tree estimates to be in-put into STEM for more robust species-tree estimation.
4.3. Effects of individual loci on phylogenetic reconstruction
An important consideration in multi-locus species-tree recon-struction studies involves an assessment of the influence of differ-ent components of the data on the overall phylogenetic signal.Recent studies have examined the effect of the sampling ratio ofindividuals to loci, demonstrating that greater numbers of loci leadto an increase in accuracy and precision for more deeply divergedbranches, while more recent rapid radiations can benefit fromgreater sampling of individuals per species (Maddison and Know-les, 2006; McCormack et al., 2009). Furthermore, while increasingthe number of loci is generally expected to increase accuracy andprecision, not all loci are equal in their information content. As aresult, the increase in phylogenetic precision is expected to be con-
tingent upon the information content of the added loci (Camargoet al., 2012; O’Neill et al., 2013).
Here, we examined an equally important aspect of our molecu-lar sampling: the effect that a particular locus has on our species-tree estimates. By plotting samples from the posterior distributionsof analyses that excluded loci in multidimensional space (Hilliset al., 2005), we were able to assess the effect of each locus onthe species-tree estimate. We found that the exclusion of anyone locus did not greatly change the posterior estimate of the spe-cies tree (Figs. 3 and S2). The largest shift in the posterior distribu-tion was seen with the removal of the mtDNA locus, whichproduced an overlapping, but slightly shifted distribution of sam-pled trees in ordination space (Fig. 3A). This result is not particu-larly surprising given that the mtDNA alignment was almostthree times larger than any individual nuclear locus, and had farmore informative sites than any individual nuclear locus, as wellas a much higher rate of evolution (Table 3). However, whileexcluding the mitochondrial locus could have had substantial ef-fects on species-tree estimates, given the disproportionate amountof information it contained, the nuclear data alone produced lar-gely overlapping posterior distributions, and the only changes intopology were in branches weakly supported with or without itsinclusion (Fig. 2). Analyses that excluded a single nuclear locus,or that excluded the mtDNA and a single nuclear locus, also pro-duced posterior distributions that overlapped with each otherand with the posterior distribution of the total data analysis(Figs. 3B and S2). The MCC trees constructed after excluding singleloci were very similar, with the only differences involving brancheswith short lengths and low posterior probability support (resultsnot shown).
Overall, the most important conclusion derived fromthese exclusion analyses is that our species-tree reconstructionusing �BEAST has not been biased by the substitution patterns ofany individual locus. While this does not mean that all loci are con-tributing equally to the phylogenetic resolution of ambystomatidphylogeny, it does establish that no single locus is driving the over-all resulting species tree. The relatively large and variable mtDNAdata set is not overwhelmingly influencing the analysis, an impor-tant result given the demonstration of a disproportionate influenceof highly variable mitochondrial mtDNA data when combined withless-variable nuclear data in other salamander species trees (Fish-er-Reid and Wiens, 2011).
4.4. Comparison to previous hypotheses
This multi-locus study of ambystomatid salamanders hasyielded a phylogeny that has some similarity to previous hypothe-ses (Bogart, 2003; Kraus, 1988; Robertson et al., 2006; Shaffer et al.,1991), but also contrasts in numerous ways. Like both the morpho-logical and the allozyme-based trees, estimates using our multi-lo-cus sequence data maintain the sister-species relationshipsbetween A. barbouri and A. texanum, between A. annulatum and A.cingulatum, and between A. tigrinum and A. californiense. The place-ment of A. gracile as one of the early diverging lineages was theonly remaining similarity between our multi-locus tree and themorphological hypothesis; no other species relationship containedin the morphological estimate was found in the sequence-basedphylogenies.
In contrast, our multi-locus phylogenetic results have manymore similarities to previous phylogenetic hypotheses generatedby allozyme data and cytb mtDNA data. This includes the place-ment of A. gracile, A. talpoideum, and A. maculatum as early diverg-ing lineages in the tree (although our study provides robustsupport for a novel placement of the A. gracile–A. talpoideum cladeas the sister group to all remaining ambystomatids), and the place-
J.S. Williams et al. / Molecular Phylogenetics and Evolution 68 (2013) 671–682 681
ment of A. mabeei as the sister lineage to the clade of A. barbouriand A. texanum.
However, despite the analysis of a rather large amount of DNAsequence data in this study, we are unable to say anything conclu-sive about the evolution of the Linguaelapsusclade and the natureof the ‘‘clash’’ between previously analyzed allozymic and morpho-logical data. Similar to the allozyme-based results, our multi-locusspecies tree includes two components of the Linguaelapsus cladeas strongly supported groups (Fig. 2): (1) A. barbouri, A. mabeei,and A. texanum (clade F), and (2) A. annulatum, A. bishopi, and A. cin-gulatum (clade G) [A. bishopi and A. cingulatum were only recentlydesignated as two species (Pauly et al., 2007)]. Furthermore, noneof our coalescent analyses support grouping all six species as aclade. Concordance analysis of nuclear loci alone did produce a pri-mary concordance tree that contained the Linguaelapsus clade;yet, this received a very low concordance factor (CF = 1.4) with a95% credibility interval indicating it may be supported by only asingle locus. Indeed, only one of our 15 loci produced a gene treethat resolved the Linguaelapsus clade (Fig. S1). Overall, however,none of our phylogenetic results strongly rejected the Linguaelap-sus clade. Instead, clades F and G were intermingled with twoother clades (clades E and H). Each of these was individuallystrongly supported, but there was at best weak support for rela-tionships among clades.
Our results do seem to suggest that, if the Linguaelapsus cladedoes indeed reflect a true evolutionary grouping within theAmbystomatidae, its ancestral branch likely evolved during a veryrapid period of diversification, and the multiple morphologicalsynapomorphies that support its resolution in morphological-based phylogenetic trees evolved over a very short duration oftime. We make this conclusion based upon our above discussionof the potential for a hard polytomy or a rapid radiation acrossintermediate portions of the ambystomatids tree. While our workhere provides substantial insights into the phylogenetic historyof the Ambystomatidae, further resolution of the previously iden-tified ‘‘clash’’ between morphological and molecular data sets willrequire to generation and analysis of additional data.
Acknowledgments
We thank Jim Demastes, Paul Moler, Greg Pauly, Brad Shaffer,the Louisiana State University Museum of Zoology, and the Mu-seum of Vertebrate Zoology at the University of California, Berkeleyfor their contribution of tissue samples. We also thank Eric O’Neill,Stephanie Mitchell, Alex Noble, and Ana Mendia for invaluable lab-oratory assistance. Randal Voss and Paul Hime provided commentsthat improved this manuscript. We also thank the University ofKentucky Information Technology Department and Center forComputational Sciences for computing time on the Lipscomb HighPerformance Computing Cluster and for access to other supercom-puting resources, and we also thank the Yale University BiomedicalHigh Performance Computing Center for allowing us computingtime on the Louise High Performance Computing Cluster (NIHGrants RR19895 and RR029676-01). Funding and support for thiswork was provided from the University of Kentucky, a Common-wealth of Kentucky NSF EPSCoR Grant (# 0814194) in support ofEcological Genomics training and research, NSF GrantDEB0949532 (to DWW), and a Society of Systematic BiologistsGraduate Student Award (to JSW).
Appendix A. Supplementary material
Supplementary data associated with this article can be found, inthe online version, at http://dx.doi.org/10.1016/j.ympev.2013.04.013.
References
Alfaro, M.E., Holder, M.T., 2006. The posterior and the prior in Bayesianphylogenetics. Annu. Rev. Ecol. Evol. Syst. 37, 19–42.
Ane, C., Larget, B., Baum, D.A., Smith, S.D., Rokas, A., 2007. Bayesian estimation ofconcordance among gene trees. Mol. Biol. Evol. 24, 412–426.
Bi, K., Bogart, J.P., 2010. Time and time again: unisexual salamanders (genusAmbystoma) are the oldest unisexual vertebrates. BMC Evol. Biol. 10, 238.
Bogart, J.P., 2003. Genetics and systematics of hybrid species. In: Sever, D.M. (Ed.),Reproductive Biology and Phylogeny of Urodela (Amphibia). Science Publishers,Inc., Enfield, New Hampshire, pp. 109–134.
Camargo, A., Avila, L.J., Morando, M., Sites, J.W., 2012. Accuracy and precision ofspecies trees: effects of locus, individual, and base pair sampling on inference ofspecies trees in lizards of the Liolaemus darwinii Group (Squamata,Liolaemidae). Syst. Biol. 61, 272–288.
Cronn, R., Cedroni, M., Haselkorn, T., Grover, C., Wendel, J.F., 2002. PCR-mediatedrecombination in amplification products derived from polyploid cotton. Theor.Appl. Genet. 104, 482–489.
Drummond, A.J., Rambaut, A., 2007. BEAST: Bayesian evolutionary analysis bysampling trees. BMC Evol. Biol. 7, 214.
Drummond, A.J., Ho, S.Y., Phillips, M.J., Rambaut, A., 2006. Relaxed phylogeneticsand dating with confidence. PLoS Biol. 4, e88.
Drummond, A.J.A.B., Buxton, S., Cheung, M., Cooper, A., Duran, C., Field, M., Heled, J.,Kearse, M., Markowitz, S., Moir, R., Stones-Havas, S., Sturrock, S., Thierer, T.,Wilson, A., 2010. Geneious v5.3. <http://www.geneious.com>.
Drummond, A.J., Suchard, M.A., Xie, D., Rambaut, A., 2012. Bayesian Phylogeneticswith BEAUti and the BEAST 1.7. Mol. Biol. Evol. 29, 1969–1973.
Edwards, S., Liu, L., Pearl, D., 2007. High-resolution species trees withoutconcatenation. Proc. Natl. Acad. Sci. USA 104, 5936–5941.
Felsenstein, J., 1978. Cases in which parsimony or compatibility methods will bepositively misleading. Syst. Zool. 27, 401–410.
Felsenstein, J., 2004. PHYLIP (Phylogeny Inference Package) version 3.6. Distributedby the Author. Department of Genome Sciences, University of Washington,Seattle.
Fisher-Reid, M.C., Wiens, J.J., 2011. What are the consequences of combining nuclearand mitochondrial data for phylogenetic analysis? Lessons from Plethodonsalamanders and 13 other vertebrate clades. BMC Evol. Biol. 11, 300.
Frost, D.R., Grant, T., Faivovich, J., Bain, R.H., Haas, A., Haddad, C.F.B., De Sa, R.O.,Channing, A., Wilkinson, M., Donnellan, S.C., Raxworthy, C.J., Campbell, J.A.,Blotto, B.L., Moler, P., Drewes, R.C., Nussbaum, R.A., Lynch, J.D., Green, D.M.,Wheeler, W.C., 2006. The amphibian tree of life. Bull. Am. Mus. Nat. Hist. 297, 1–370.
Guindon, S., Gascuel, O., 2003. A simple, fast, and accurate algorithm to estimatelarge phylogenies by maximum likelihood. Syst. Biol. 52, 696–704.
Heled, J., Drummond, A.J., 2010. Bayesian inference of species trees from multilocusdata. Mol. Biol. Evol. 27, 570–580.
Hillis, D.M., 1987. Molecular versus morphological approaches to systematics.Annu. Rev. Ecol. Syst. 18, 23–42.
Hillis, D.M., Heath, T.A., St John, K., 2005. Analysis and visualization of tree space.Syst. Biol. 54, 471–482.
Holman, J.A., 2006. Fossil Salamanders of North America. Indiana University Press.Huang, H.T., He, Q.I., Kubatko, L.S., Knowles, L.L., 2010. Sources of error inherent in
species-tree estimation: impact of mutational and coalescent effects onaccuracy and implications for choosing among different methods. Syst. Biol.59, 573–583.
Jones, T.R., Kluge, A.G., Wolf, A.J., 1993. When theories and methodologies clash – aphylogenetic reanalysis of the North-American ambystomatid salamanders(Caudata, Ambystomatidae). Syst. Biol. 42, 92–101.
Kraus, F., 1988. An empirical-evaluation of the use of the ontogeny polarizationcriterion in phylogenetic inference. Syst. Zool. 37, 106–141.
Kubatko, L.S., Degnan, J.H., 2007. Inconsistency of phylogenetic estimates fromconcatenated data under coalescence. Syst. Biol. 56, 17–24.
Kubatko, L.S., Carstens, B.C., Knowles, L.L., 2009. STEM: species tree estimation usingmaximum likelihood for gene trees under coalescence. Bioinformatics 25, 971–973.
Larget, B.R., Kotha, S.K., Dewey, C.N., Ane, C., 2010. BUCKy: gene tree/species treereconciliation with Bayesian concordance analysis. Bioinformatics 26, 2910–2911.
Larson, A., 1991. A molecular perspective on the evolutionary relationships of thesalamander families. Evol. Biol. 25, 211–277.
Leache, A.D., Rannala, B., 2011. The accuracy of species tree estimation undersimulation: a comparison of methods. Syst. Biol. 60, 126–137.
Maddison, W.P., 1997. Gene trees in species trees. Syst. Biol. 46, 523–536.Maddison, W.P., Knowles, L.L., 2006. Inferring phylogeny despite incomplete lineage
sorting. Syst. Biol. 55, 21–30.Maddison, W.P., Maddison, D.R., 2004. Mesquite: A Modular System for
Evolutionary Analysis. Version 1.05. <http://mesquiteproject.org>.McCormack, J.E., Huang, H., Knowles, L.L., 2009. Maximum likelihood estimates of
species trees: how accuracy of phylogenetic inference depends upon thedivergence history and sampling design. Syst. Biol. 58, 501–508.
O’Neill, E.M., Schwartz, R., Bullock, C.T., Williams, J.S., Shaffer, H.B., Aguilar-Miguel,X., Parra-Olea, G., Weisrock, D.W., 2013. Parallel tagged amplicon sequencingreveals major lineages and phylogenetic structure in the North Americantiger salamander (Ambystoma tigrinum) species complex. Mol. Ecol. 22,111–129.
682 J.S. Williams et al. / Molecular Phylogenetics and Evolution 68 (2013) 671–682
Pauly, G.B., Piskurek, O., Shaffer, H.B., 2007. Phylogeographic concordance in thesoutheastern United States: the flatwoods salamander, Ambystoma cingulatum,as a test case. Mol. Ecol. 16, 415–429.
Posada, D., 2008. JModelTest: phylogenetic model averaging. Mol. Biol. Evol. 25,1253–1256.
Putta, S., Smith, J.J., Walker, J.A., Rondet, M., Weisrock, D.W., Monaghan, J., Samuels,A.K., Kump, K., King, D.C., Maness, N.J., Habermann, B., Tanaka, E., Bryant, S.V.,Gardiner, D.M., Parichy, D.M., Voss, S.R., 2004. From biomedicine to natural historyresearch: EST resources for ambystomatid salamanders. BMC Genom. 5, 54.
Rambaut, A., Drummond, A.J., 2009. Tracer v1.5. <http://tree.bio.ed.ac.uk/software/tracer>.
Robertson, A.V., Ramsden, C., Niedzwiecki, J., Fu, J.Z., Bogart, J.P., 2006. Anunexpected recent ancestor of unisexual Ambystoma. Mol. Ecol. 15, 3339–3351.
Roelants, K., Gower, D.J., Wilkinson, M., Loader, S.P., Biju, S.D., Guillaume, K., Moriau,L., Bossuyt, F., 2007. Global patterns of diversification in the history of modernamphibians. Proc. Natl. Acad. Sci. USA 104, 887–892.
Rokas, A., Carroll, S.B., 2005. More genes or more taxa? The relative contribution ofgene number and taxon number to phylogenetic accuracy. Mol. Biol. Evol. 22,1337–1344.
Ronquist, F., Huelsenbeck, J.P., 2003. MrBayes 3: Bayesian phylogenetic inferenceunder mixed models. Bioinformatics 19, 1572–1574.
Shaffer, H.B., 1993. Phylogenetics of model organisms – the laboratory axolotl,Ambystoma mexicanum. Syst. Biol. 42, 508–522.
Shaffer, H.B., McKnight, M.L., 1996. The polytypic species revisited: geneticdifferentiation and molecular phylogenetics of the tiger salamanderAmbystoma tigrinum (Amphibia: Caudata) complex. Evolution 50, 417–433.
Shaffer, H.B., Clark, J.M., Kraus, F., 1991. When molecules and morphology clash – aphylogenetic analysis of the North-American ambystomatid salamanders(Caudata, Ambystomatidae). Syst. Zool. 40, 284–303.
Smith, J.J., Kump, D.K., Walker, J.A., Parichy, D.M., Voss, S.R., 2005. A comprehensiveexpressed sequence tag linkage map for tiger salamander and Mexican axolotl:enabling gene mapping and comparative genomics in Ambystoma. Genetics 171,1161–1171.
Stanley, E.L., Bauer, A.M., Jackman, T.R., Branch, W.R., Mouton, P.L.F.N.,2011. Between a rock and a hard polytomy: rapid radiation in therupicolous girdled lizards (Squamata: Cordylidae). Mol. Phylogenet. Evol.58, 53–70.
Weisrock, D.W., Macey, J.R., Ugurtas, I.H., Larson, A., Papenfuss, T.J., 2001. Molecularphylogenetics and historical biogeography among salamandrids of the ‘‘true’’salamander clade: rapid branching of numerous highly divergent lineages inMertensiella luschani associated with the rise of Anatolia. Mol. Phylogenet. Evol.18, 434–448.
Weisrock, D.W., Harmon, L.J., Larson, A., 2005. Resolving deep phylogeneticrelationships in salamanders: analyses of mitochondrial and nuclear genomicdata. Syst. Biol. 54, 758–777.
Weisrock, D.W., Smith, S.D., Chan, L.M., Biebouw, K., Kappeler, P.M., Yoder, A.D.,2012. Concatenation and concordance in the reconstruction of mouse lemurphylogeny: an empirical demonstration of the effect of allele sampling inphylogenetics. Mol. Biol. Evol. 29, 1615–1630.
Wiens, J.J., Hollingsworth, B.D., 2000. War of the iguanas: conflicting molecular andmorphological phylogenies and long-branch attraction in iguanid lizards. Syst.Biol. 49, 143–159.
Wiens, J.J., Bonett, R.M., Chippindale, P.T., 2005. Ontogeny discombobulatesphylogeny: paedomorphosis and higher-level salamander relationships. Syst.Biol. 54, 91–110.
Zylstra, P., Rothenfluh, H.S., Weiller, G.F., Blanden, R.V., Steele, E.J., 1998.PCR amplification of murine immunoglobulin germline V genes:strategies for minimization of recombination artefacts. Immunol. CellBiol. 76, 395–405.